
 Submit a Paper
 Propose a Special lssue
 Open Access
ARTICLE

Sparse Adversarial Learning for FDIA Attack Sample Generation in Distributed Smart Grids
1 College of Computer Science and Technology, Shanghai University of Electric Power, Shanghai, 201306, China
2 College of Electrical Engineering, Shanghai University of Electric Power, Shanghai, 201306, China
* Corresponding Author: Fengyong Li. Email:
(This article belongs to the Special Issue: Machine Learning Empowered Distributed Computing: Advance in Architecture, Theory and Practice)
Computer Modeling in Engineering & Sciences 2024, 139(2), 2095-2115. https://doi.org/10.32604/cmes.2023.044431
Received 30 July 2023; Accepted 10 November 2023; Issue published 29 January 2024
 View Full Text
 Download PDF
Abstract
False data injection attack (FDIA) is an attack that affects the stability of grid cyber-physical system (GCPS) by evading the detecting mechanism of bad data. Existing FDIA detection methods usually employ complex neural network models to detect FDIA attacks. However, they overlook the fact that FDIA attack samples at public-private network edges are extremely sparse, making it difficult for neural network models to obtain sufficient samples to construct a robust detection model. To address this problem, this paper designs an efficient sample generative adversarial model of FDIA attack in public-private network edge, which can effectively bypass the detection model to threaten the power grid system. A generative adversarial network (GAN) framework is first constructed by combining residual networks (ResNet) with fully connected networks (FCN). Then, a sparse adversarial learning model is built by integrating the time-aligned data and normal data, which is used to learn the distribution characteristics between normal data and attack data through iterative confrontation. Furthermore, we introduce a Gaussian hybrid distribution matrix by aggregating the network structure of attack data characteristics and normal data characteristics, which can connect and calculate FDIA data with normal characteristics. Finally, efficient FDIA attack samples can be sequentially generated through interactive adversarial learning. Extensive simulation experiments are conducted with IEEE 14-bus and IEEE 118-bus system data, and the results demonstrate that the generated attack samples of the proposed model can present superior performance compared to state-of-the-art models in terms of attack strength, robustness, and covert capability.Keywords
With the continuous advancement of smart grid construction, the traditional power system is deeply integrated with information control equipment and communication sensor networks to form the grid cyber-physical system (CPS) [1]. The new energy internet contains a high proportion of distributed new energy, which is a large-scale power CPS that can more effectively leverage the advantages brought by information fusion. However, the CPS used in smart grids and other Industrial Internet of Things (IIoT) networks face huge security challenges, especially in today’s increasingly serious threat of network attacks, and are also more susceptible to network attacks. Network attacks will not only damage the normal functions of the information system, but also may be transmitted to the physical system, threatening the safe operation of the power system [2]. Tian et al. [3] conducted in-depth research on the unique security issues surrounding safety critical CPSs. They proposed two adversarial attack methods based on regression models and produced almost imperceptible adversarial images, which pose a significant threat to the navigation and control of unmanned aerial vehicles (UAV). State estimation is the calculation of the state of the power grid system based on the raw measurement values collected by supervisory control and data acquisition (SCADA), and plays a very important role in the control center. In particular, damaged system state estimation may interfere with the operation of the power system, as many power system applications are dependent on the results of state estimation [4]. Among prevalent network attacks, FDIA represents a common attack vector that compromises the integrity of power grid information systems. Its main goal is to tamper with power grid measurement data through false attack data injection to damage power system state estimation [5], thereby causing line congestion [6], power outage [7], communication congestion, etc. It is one of the most threatening attack methods to the power system.
In recent years, there have been multiple large-scale power network security incidents worldwide, including scenes of using data tampering mechanisms for attacks. Taking the attacks on Ukrenergo as an example, Ukrenergo suffered two network attacks in 2015 and 2016, where attackers injected false data and deleted original data into the SCADA system, resulting in huge economic losses and social unrest [8]. These events indicate that attackers will bypass bad data detection (BDD) through carefully designed fake data, and their network attacks will pose a huge threat to the power grid. Therefore, a large amount of research work has been carried out in society to defend against FDIA. For example, Luo et al. [9] used adaptive kalman filter to estimate the internal state and noise of the system. Cheng et al. [10] introduced a highly discriminative FDIA detector known as the
Furthermore, in order to better predict potential FDIA attacks in the power public-private network edge, domestic and foreign researchers have developed various studies to investigate possible methods for constructing FDIA [14,15]. On the one hand, some literature focuses on the direction of constructing false data injection attack vectors. For example, a continuous FDIA [16] was proposed to increase the attack time span to a certain period and identify the sequence of lines that need to be heavily protected. Liu et al. [17] designed a sparse attack strategy that is also applicable to situations where topology information is incomplete. Tian et al. [18] introduced adversarial examples and FDIAs (AFDIAs) to study state estimation attack scenarios in power systems. By adding perturbations to state variables instead of measured values, the attack can be carried out covertly and avoid being detected by BDD. This method optimizes the final effect of the attack. On the other hand, due to the relative closeness of the private network side of the virtual power plant (VPP), the information flow attack behavior of the public network in the actual scene is difficult to easily cross the protection of the public and private boundaries, and the attack samples are extremely rare or even difficult to obtain. The emergence of some sample construction methods based on artificial intelligence provides new ideas. For example, Ehrhart et al. [19] designed a GAN framework combining long short-term memory (LSTM) network with fully convolutional network (FCN), which can generate the training data set of time series better. Rao et al. [20] proposed an intrusion data enhancement method based on the combination of generative adversarial network and deep neural network, which generated high-quality false data injection (FDI) attack samples and solved the problem of insufficient attack samples in the virtual power plant scene. Gao et al. [21] utilized GANs’ ability to learn features from input data and proposed GAN-based automatic property generation (GAPG) to automatically generate verification properties that support model checking. This innovative approach shows promise in automating property generation for model checking, reducing the need for manual specification. Dina et al. [22] used conditional generative adversarial network to generate synthetic samples to balance attack intrusion sample set, solved the problem of data set imbalance caused by insufficient attack samples, and studied the impact of generated attack samples on various machine learning classifiers.
Overall, FDIA attack samples that are constructed from the attack vectors have some common features that are easy for the detection model to find patterns for defense. Also, FDIA attack samples based on artificial intelligence often have strong diversity but large data fluctuations, which are also easy to detect. In order to solve the problem of easy detection of constructed attack samples, we use GAN technology [23] to construct FDIA samples. The proposed scheme can enrich the diversity of FDIA samples, while enhancing their concealment. The generated attack samples can better bypass the defense of detection models, and make the constructed FDIA samples less easily detected. In general, compared to existing works, we make the following novel contributions:
• We design an efficient adversarial network framework to learn the distribution characteristics between normal data and attack data in context of distributed smart grids. Our generated FDIA samples can obtain high concealment effect to effectively bypass the defense of the detection model in public-private network edge.
• Our network structure is designed carefully to allow information to be directly transmitted between network layers, which can effectively solve the problems of gradient vanishing and gradient explosion, and make the network converge faster. Also, different operating parameters are introduced to enrich the diversity of FDIA samples.
• Extensive evaluations are conducted on IEEE 14-bus and IEEE 118-bus systems, and four state-of-the-art detection models are used to validate and analyze the proposed framework. The results indicate that the FDIA data generated by our model outperforms traditional FDIA construction methods in terms of concealment and attack strength, as well as the decrease in FDIA detection accuracy.
The remainder of this paper is organized as follows. Section 2 introduces the related work. The detailed procedure of our proposed model is shown in Section 3. We perform comprehensive experiments to evaluate the performance of proposed model, and present the results and corresponding discussions in Section 4. Finally, Section 5 concludes the paper.
2.1 False Data Injection Attack
FDIA is a type of network attack targeting data-based systems. In this attack, attackers manipulate or tamper with the data input into the system, with the aim of deceiving, interfering, or disrupting the normal operation of the system. To build invisible and unobservable FDIAs, attackers need to know the complete topology information of the power grid, that is, the Jacobian matrix
where
where
According to the bad data detection mechanism of state estimation, the residual in Eq. (4) is
Obviously, as long as the attacker constructs the attack vector
2.2 FDIA Attack Generation and Detection Model
With the continuous expansion of the power grid, the amount of data is exploding, and the bottleneck of power public-private edge computing is prominent. Considering that the essence of power public-private edge computing is to decentralize some functions of the power cloud center to the network edge near the sensing data source, it can realize the local/nearby processing of data and related applications. In the context of power big data, edge computing can not only reduce the pressure of data traffic in the cloud center, but also improve the efficiency of data processing. Therefore, the detection of FDIA has gradually begun to be implemented efficiently using edge computing. For instance, facing the harm of FDIA attacks in smart grids, some researchers have attempted to construct efficient detection models to detect FDIA [24]. Due to the difficulty in obtaining large-scale FDIA attack samples in CPS, the construction of FDIA attack vectors has become a primary problem to be solved. Some researchers have extensively researched the construction of false data injection attack vectors. Ozay et al. [25] improved the ow sparse attack vector scheme and proposed a distributed attack vector construction scheme. Hao et al. [26] proposed a construction algorithm scheme that can quickly generate highly sparse attack vectors. Bhattacharjee et al. [27] hypothesized that the prior information of the system is unknown, and that attackers can implement stealth attacks based on measurement matrices. They propose a stealth attack vector construction scheme based on independent component analysis to identify mixed matrices. Yu et al. [28] developed a blind FDI attack construction strategy based on principal component analysis (PCA), which utilizes instrument measurements to attack the system with high concealment.
Nevertheless, most of these methods design attack samples through mathematical models, lacking statistical learning for both normal and attack samples. As a result, it is difficult for the constructed attack samples to evade deep neural networks based FDIA detection models. Correspondingly, some FDIA detection methods using machine learning and deep learning technology [29] have been developed sequentially. For example, James et al. [30] introduced discrete wavelet transform and deep neural network to reveal the characteristics of spatial data and obtain the temporal data correlation of FDIA detection. He et al. [31] proposed using a conditional deep belief network to explain the high-dimensional temporal behavior characteristics of FDIA with strong concealment, and successfully achieved a 90% accuracy rate for FDIA detection. Ozay et al. [32] proposed semi-supervised and online learning algorithms in machine learning to detect FDIA, which can be used in hierarchical and topological networks in different attack scenarios. In the past two years, Qu et al. [33] designed a scheme based on joint image changes to pre-process changes in measurement data. The dynamic correlation of measurement data between adjacent moments makes the distribution characteristics of measurement data changes more significant, and achieves high detection accuracy. Hu et al. [34] jointly used weighted least squares (WLS) and extended kalman filter (EKF) with an exponential weighting function (WEKF) to detect FDIA, which improved the robustness of state estimation.
Overall, most existing FDIA detection models belong to machine learning-based methods. These methods require a large number of training samples to construct detection models, while the FDIA attack samples in CPS pose significant limitations to the construction of detection models due to their extreme sparsity. This paper attempts to fill this gap by constructing large-scale FDIA attack samples using sparse adversarial learning methods.
3.1 Proposed FDIA Sample Generation Framework
The proposed framework is mainly composed of three parts: a data pre-processing module, a training module and a generating data module. The data pre-processing module merge multi-sensor data, including normal data and attack data, where the data samples need to be normalized to adapt to network training. In addition, the training module employs the residual network as conditional generator to generate fake attack data, and further uses full connected network as a conditional discriminator to extract features from attack data and normal data. The generator and discriminator are trained interactively to generate a discriminative model to distinguish attack data. Finally, by repeatedly training the generator and discriminator until convergence, the trained generator in the generating module can be employed to construct new attack data samples. The whole framework of our proposed scheme is shown in Fig. 1.
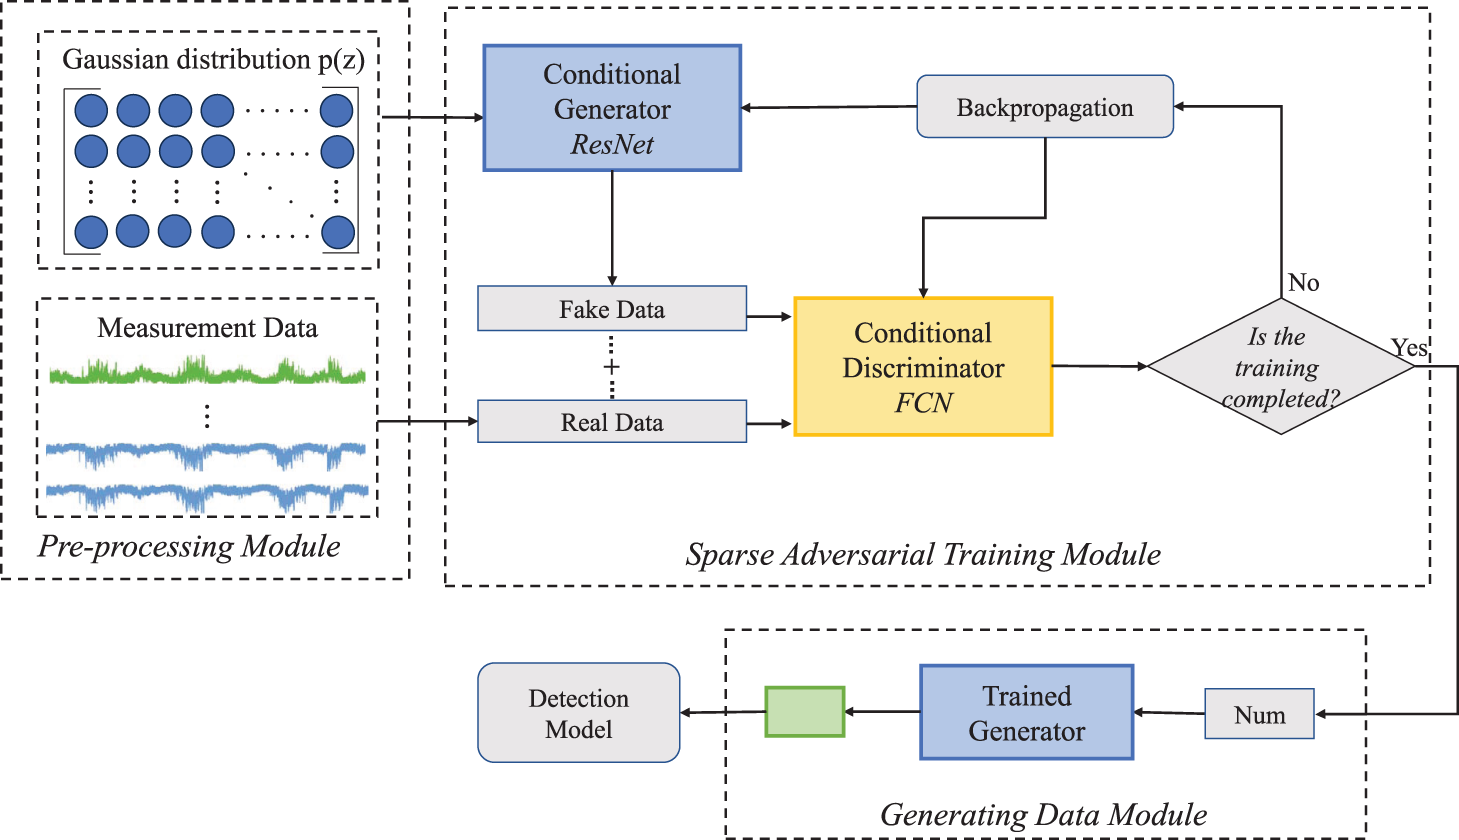
Figure 1: Proposed FDIA attack sample generation framework
3.2 Data Pre-Processing Module
In CPS network system, data may come from different sensors. Since these data are very different in data composition, data accuracy, data transmission delay and frequency refresh, it is necessary to pre-process these multi-source heterogeneous data.
Since each column in the dataset corresponds to different characteristics of the sensor. These different features may have different measurement units and scales. These different scales may cause some features to have a greater impact on data analysis and model training. In order to eliminate the dimensional difference and process each feature more fairly in data analysis and model training, we use the min-max normalization method to linearly map the data to a given range, while maintaining the relative order and distribution shape of the original data.
where
3.3 Sparse Adversarial Training Module
In this section, we construct a sparse adversarial training model by combining a generator ResNet and a discriminator FCN. In the generator module, we first input a Gaussian noise matrix
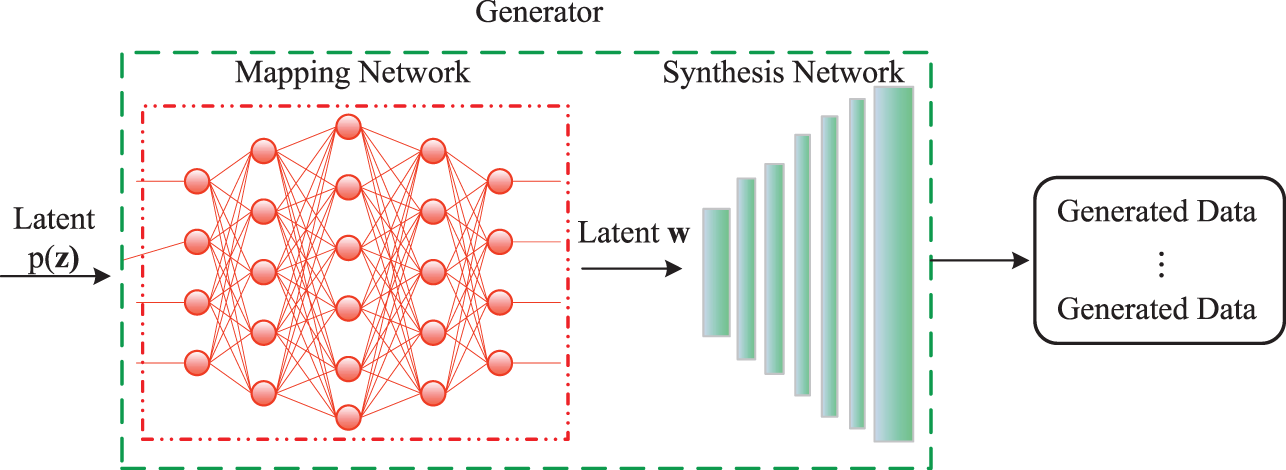
Figure 2: Structural diagram of generator
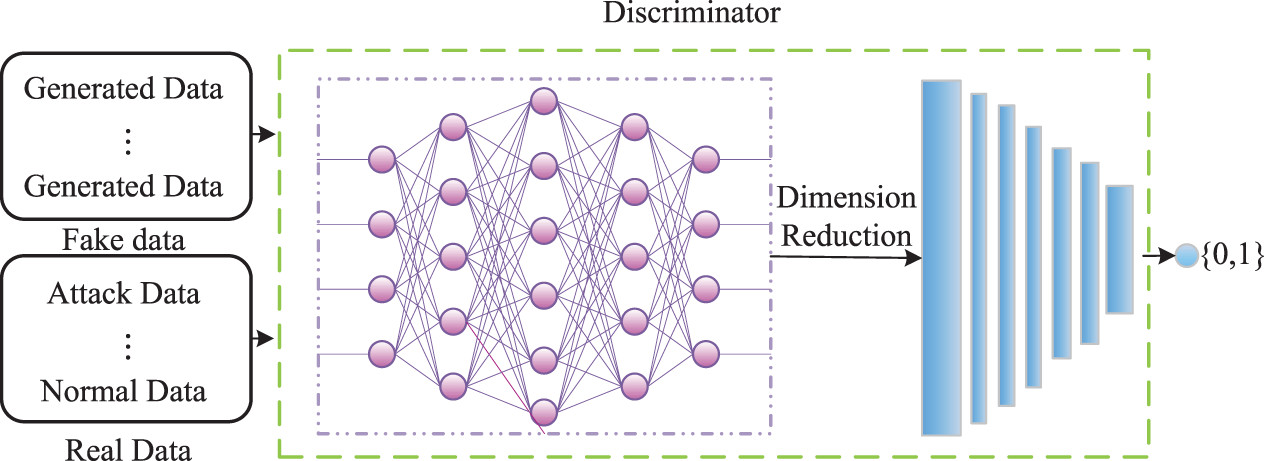
Figure 3: Structural diagram of discriminator
We firstly use Eq. (7) to build the noise matrix
where
Furthermore,
The corresponding residual block can be divided into two parts: the direct mapping part and the residual part, where
Subsequently, similar to the first residual block, the second residual block also employs the fully connected operation, batch-normalization and ReLU activation function to further process the output feature
Finally, passing through a linear layer, the output
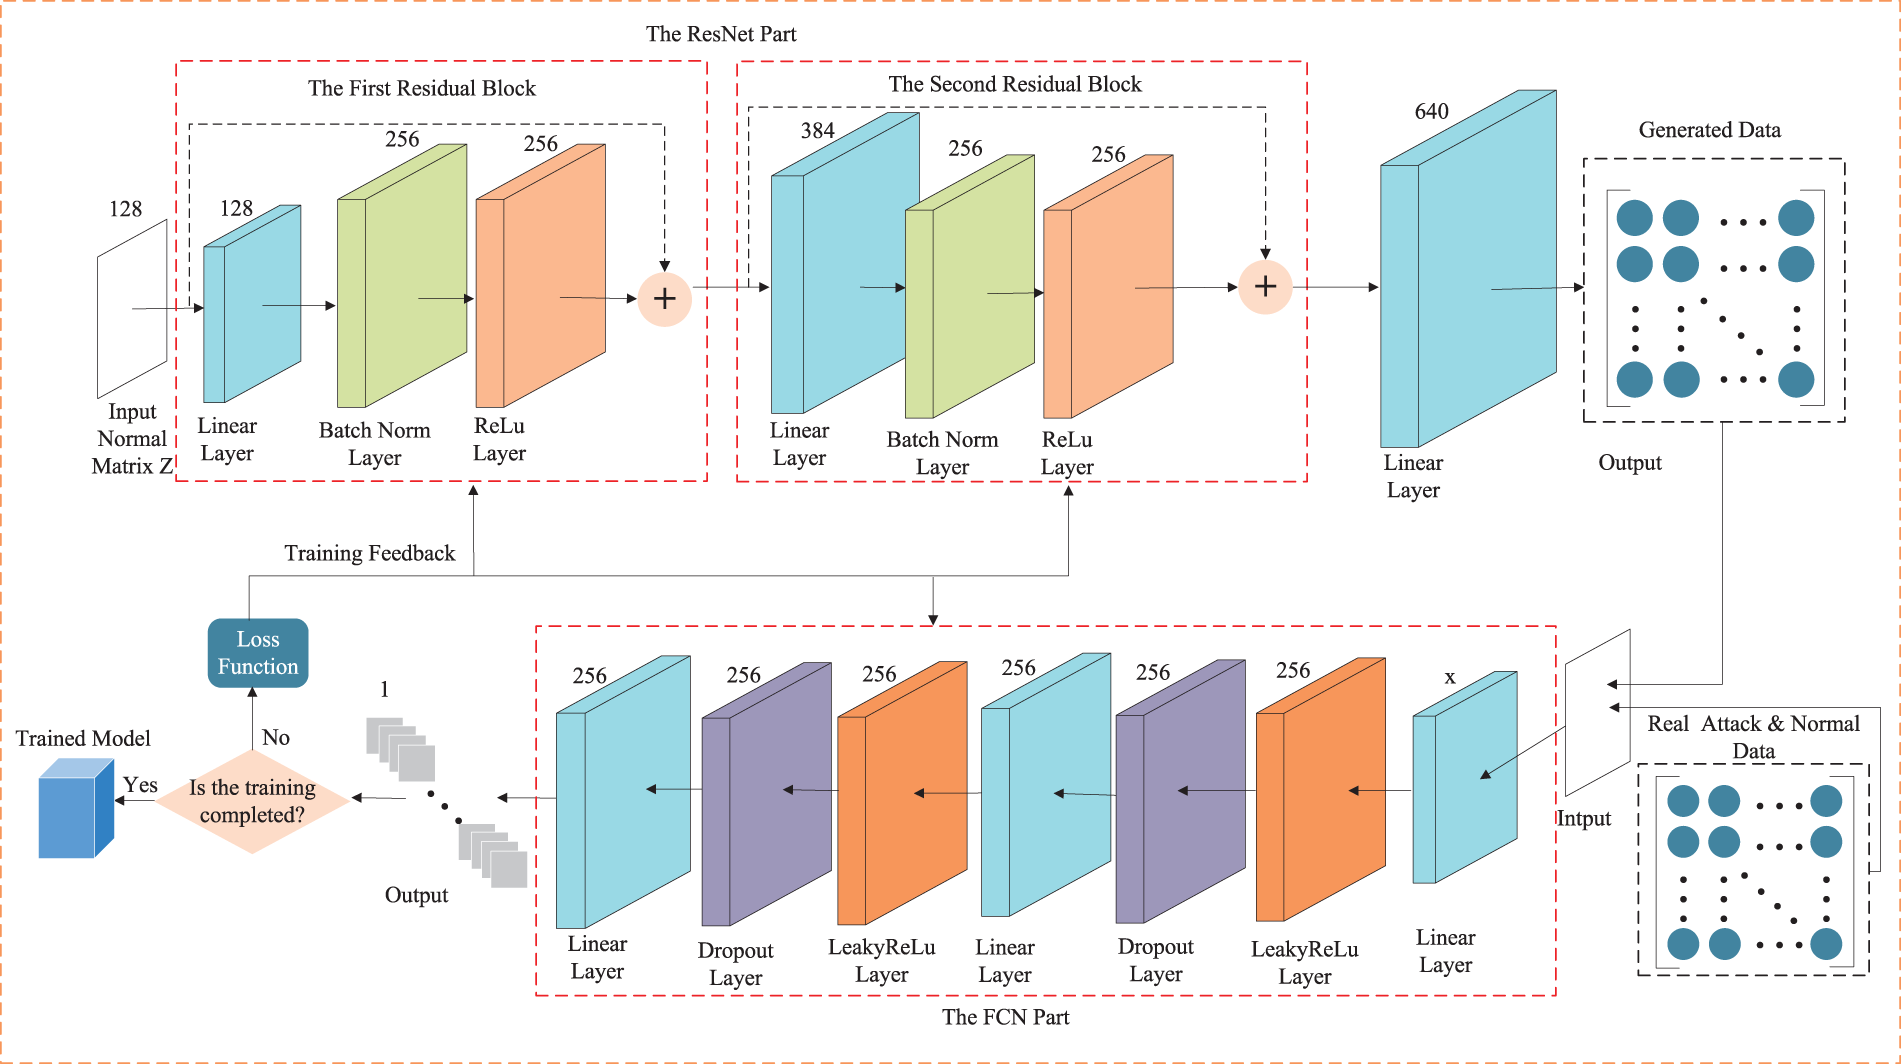
Figure 4: The specific structure of the generator and the discriminator
When attack sample is built, a discriminator FCN can be constructed to firstly extract the features from attack data and the normal data, which is considered to distinguish the authenticity of fake attack data.
where
Afterwards,
In the training process, we introduce the WGAN-GP loss function, which provides a more stable training process, reducing issues such as mode collapse. Furthermore, the gradient penalty term in WGAN-GP encourages smooth gradient flow throughout the entire network. This results in better convergence and helps mitigate the problem of vanishing gradients. Therefore, we build the loss function
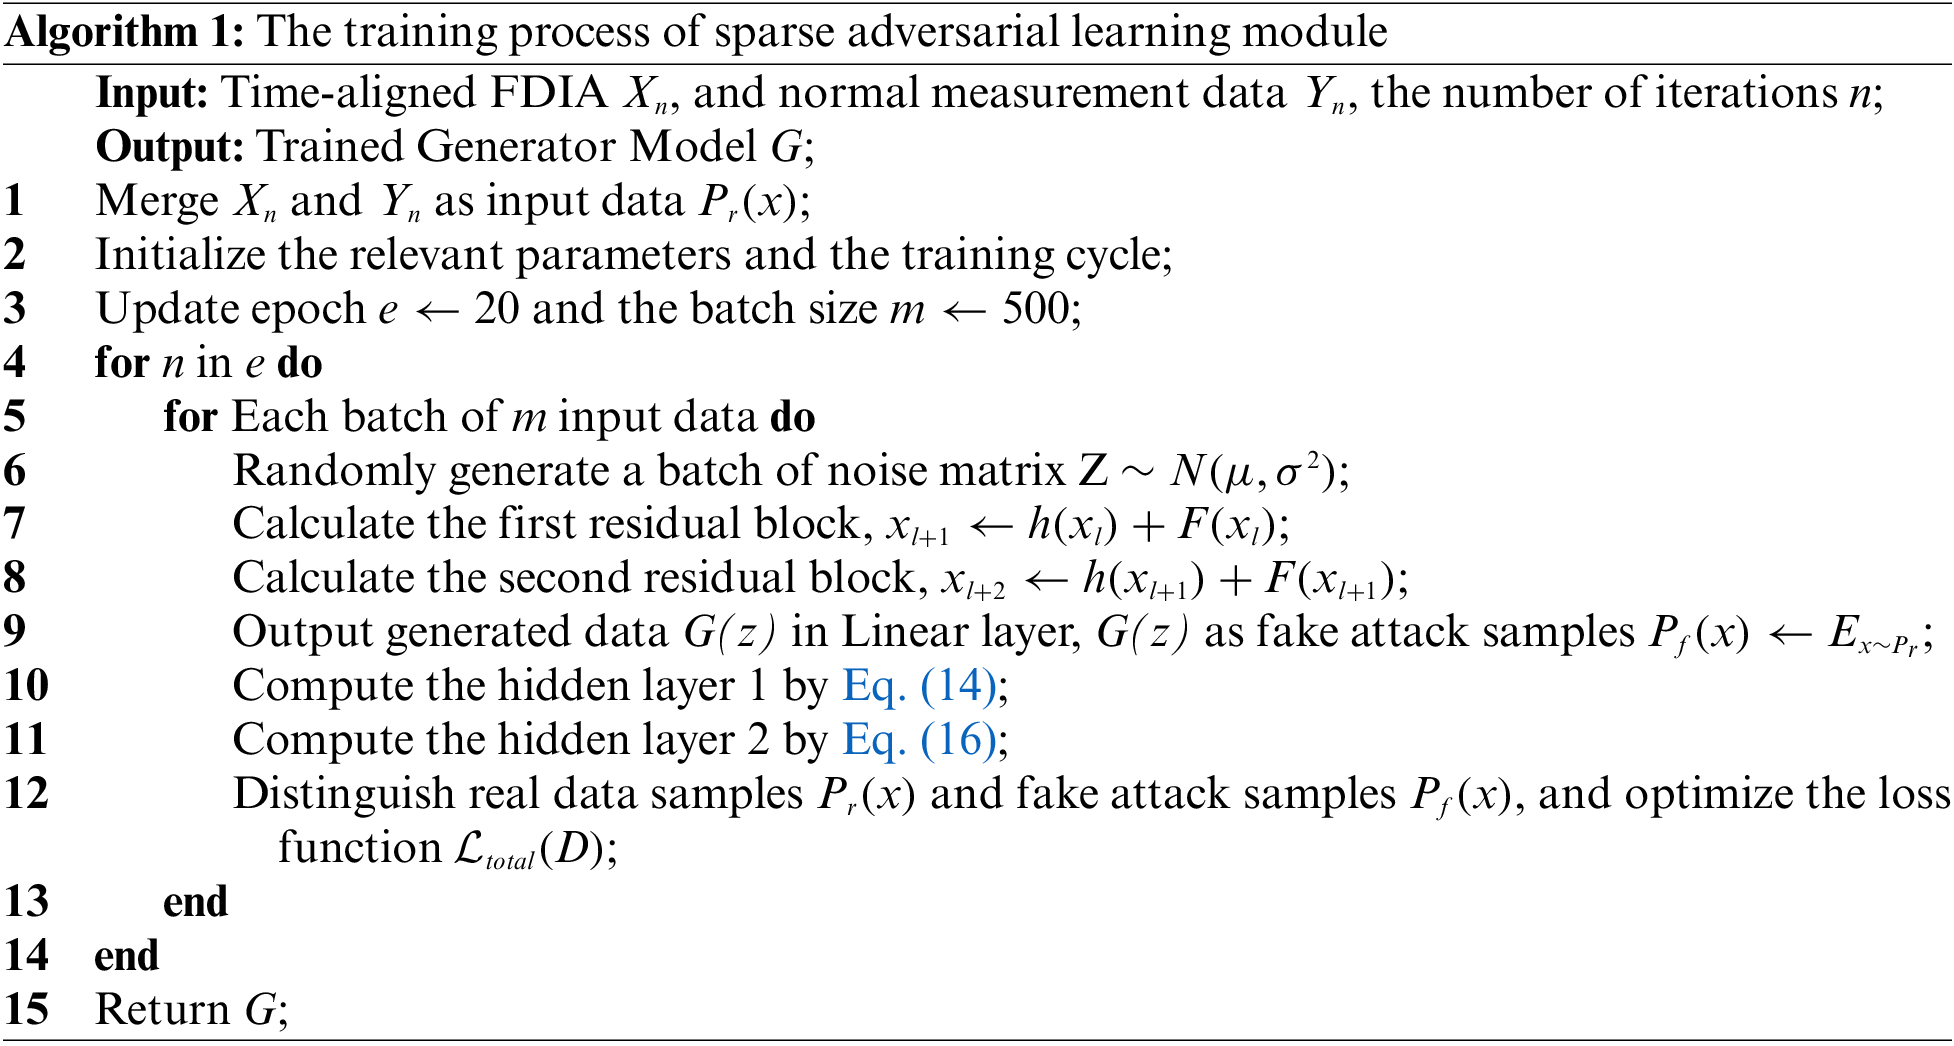
Notably, this process can be recorded by an iteration number. Accordingly, the number of training iterations of the conditional generative adversarial network is 20, the batch size is 500, and the optimizer uses Adam learner. In addition, the default parameters are (0.9, 0.99) operated by the Adam learner. The initial learning rate is
After each iteration, the generator continuously learns the distribution characteristics of attack data samples and updates the weight values of each hidden layer towards the optimization goal. When the set number of iterations are performed, the generator can exactly generate more realistic attack data. Finally, the input samples meeting standard normal distribution are trained, and the corresponding attack data samples with camouflage and confusion can be outputted by the generator accordingly.
4 Experimental Results and Discussions
In our experiments, two classical power datasets, the IEEE 14-bus system data and the IEEE 118-bus system data [36,37], are used to evaluate the model performance. The IEEE 14-bus and IEEE 118-bus system data refers to two well-known benchmark datasets that represents the electrical power system of a simplified 14-bus and 118-bus network. They are commonly used in power system analysis and serve as a standard reference for various research studies and algorithm development in the field of power systems. Two datasets provide topology information, bus configurations, and electrical parameters of the power system, including generator data, load data, transmission line parameters, and transformer data. They capture the essential elements and characteristics of a power distribution system, enabling researchers and engineers to analyze and study various aspects of power system operation, stability, and control. The composition information of the IEEE 14-bus system data is shown in Fig. 5 [36,37], and the IEEE 118-bus system data has similar composition information.
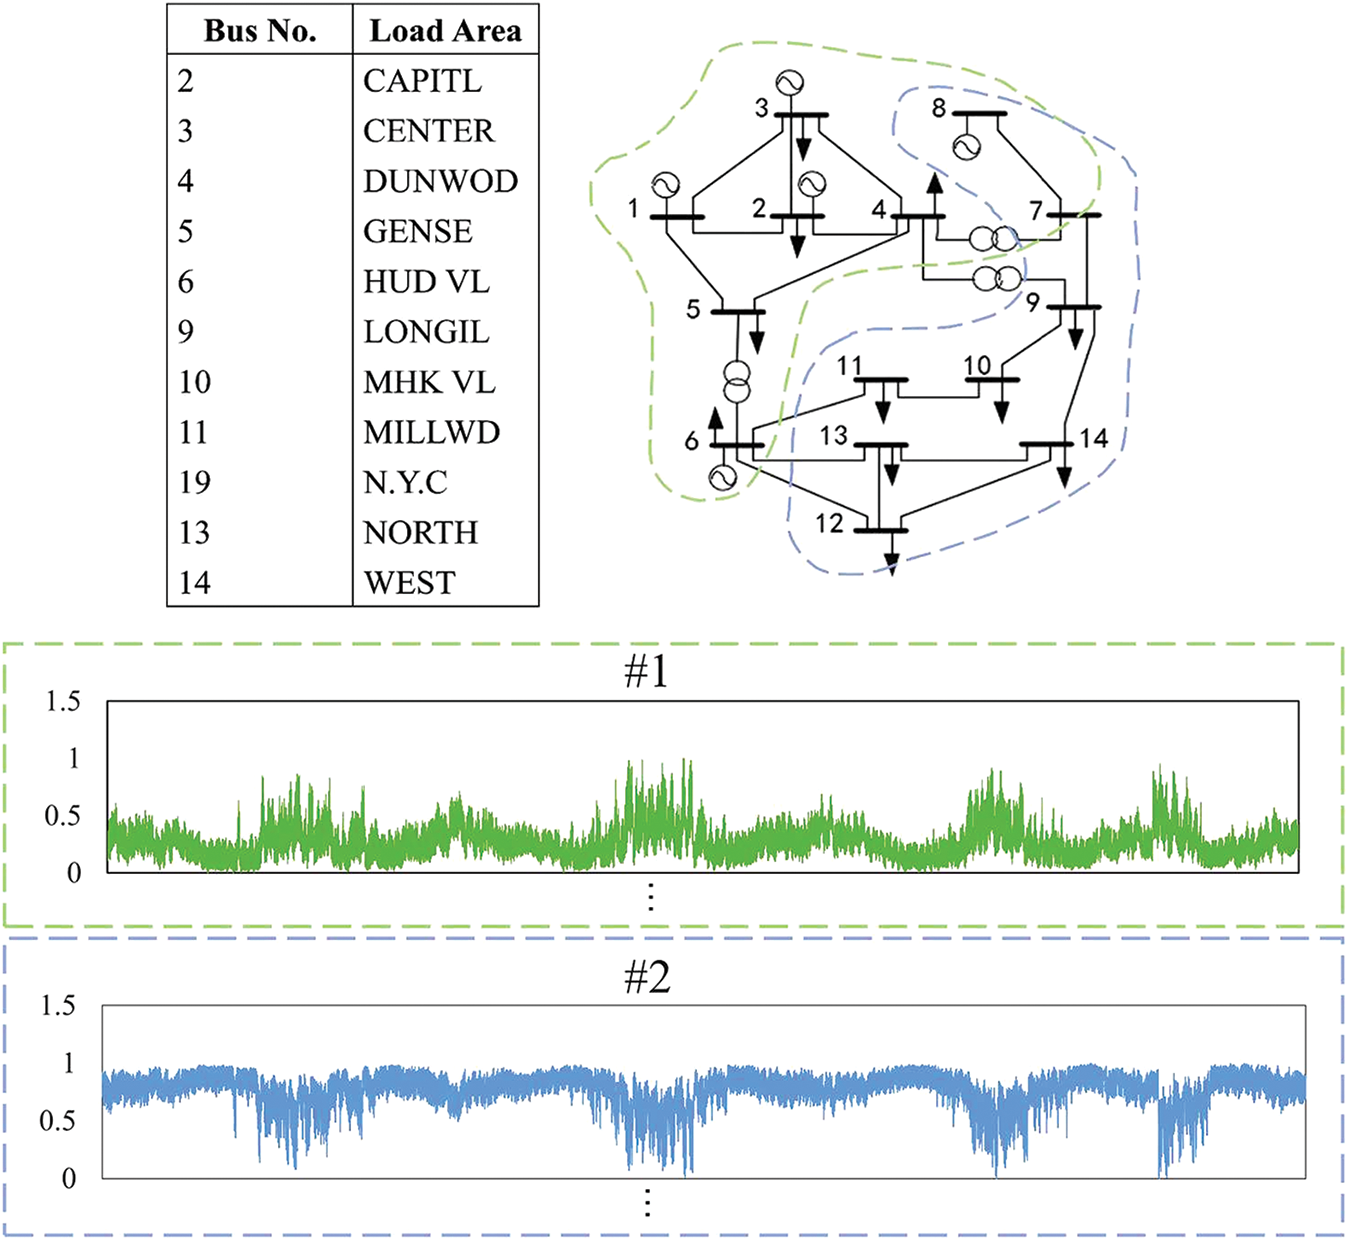
Figure 5: IEEE 14-bus system. The missing node is the generator node. Due to high intensity protection, their data is usually not easily tampered with, so we do not consider the data of these nodes in our testing
In our experiments, because of the fact that the IEEE 14-bus system data and IEEE 118-bus system data are all data from normal measurement situations, in order to simulate the behavior of attackers and the errors of sensors in reality, we conduct two parts of operations on the IEEE 14-bus and IEEE 118-bus system datasets: attack implementation and measurement noise.
• Attack Implementation: the attack data is usually generated using a false data injection method. The random FDIA is a traditional and classical method, which is characterized by injecting randomly sized false attack data into specific nodes. This attack method has a certain degree of concealment and flexibility. Our scheme integrates the random FDIA attack sample generation method and further integrates the idea of sparse sample adversarial learning to construct a sparse learning based attack sample generation method (SL-GAN). Through the trained generator in the model, we can generate more confusing attack data mixed with normal data characteristics.
• Measurement Noise: given the inevitable dynamic noise in the process of measurement and communication, we also add random Gaussian noise to the measured value and test the performance of different noise derivations.
Given that both the IEEE 14-bus and IEEE 118-bus systems have 15,000 pieces of data, two datasets were constructed based on different numbers of attack data points, including balanced and unbalanced datasets. Experimental comparisons were implemented with different attack intensities. The division ratio between the training set and the testing set is 8:2, including 12000 pieces training samples and 3000 pieces testing samples.
In addition, we employ the precision and recall of the generated outputs as performance evaluation metrics, where precision represents the percentage of error data that we have correctly detected as a percentage of all predicted error data and the recall rate represents the percentage of error data that we have successfully detected as a percentage of all error data. The precision and recall are defined as:
where true positive (TP) denotes the amount of false data detected correctly, true negative (TN) the amount of normal data detected as normal, false positive (FP) as the amount of normal data incorrectly detected as false, and false negative (FN) the amount of false data incorrectly detected as normal.
Moreover, we also strike the accuracy and
where the accuracy reflects the proportion of correct classification; the recall rate represents the percentage of error data that we have successfully detected among all error data, and
4.2 Effectiveness Verification for Proposed Model
In the following experiment, in order to verify that the attack data generated by our model can effectively bypass the detection of the detection model, we conduct a series of comparative experiments. All simulations are performed over a machine with an Intel (R) Core (TM) i5-8300H CPU, a NVIDIA GTX 1050, and 16 GB RAM. In general, when our proposed SL-GAN model is used to generate FDIA attack samples, we set the number of training iterations to 20, and the batch size to 500. The loss function uses WGAN loss and the optimizer is set to Adam learner. The default parameters are (0.9, 0.99), and Adam learner performs optimization. The initial learning rate was
Regarding the benchmark method for verifying effectiveness, we compared the attack sample generated by the traditional random FDIA attack generation and our proposed model, respectively. Different attack sample generation methods are tested by several state-of-the-art detection models for experimental comparison. These detection models include SGAT [38], RF [13], SVM [11] and CNN [12], where self-supervised graph attention network(SGAT) introduces a graph attention module to improve the accuracy of FDIA detection. RF is the ensemble learning algorithm based on decision tree, which is easy to implement and has low computational overhead, but it shows very amazing performance in classification and regression. CNN can build a binary detection model using diverse convolutional neural networks. SVM is a maximum margin classifier that constructs a hyperplane(s) in a high-dimensional space. It is widely used since it achieved top performance in some classification problems
Fig. 6 presents the test results. From this figure, it can be seen that the loss value of the attack data generated by our proposed mode during the training process, e.g., Fig. 6(b), is higher than that of the attack data generated by the original FDIA, e.g., Fig. 6(a), regardless of the initial point of loss value and the stable point. This means that the generated samples by our proposed model are more aggressive. In addition, it can be observed in Fig. 6(a), the loss curve converges after 8 iterations, while Fig. 6(b) converges more slowly, indicating that our attack data has better camouflage, making it more difficult for the detection model to distinguish. This phenomenon can be easily explained as follows. During the process of training the model, we add a certain proportion of sparse normal sample data, which allows the model to learn a certain distribution of normal data and extract some features of normal samples during training. This results in the generated attack data being accompanied by some normal data features, which is more confusing. Accordingly, the detection model requires more iterations to detect and is more time-consuming.
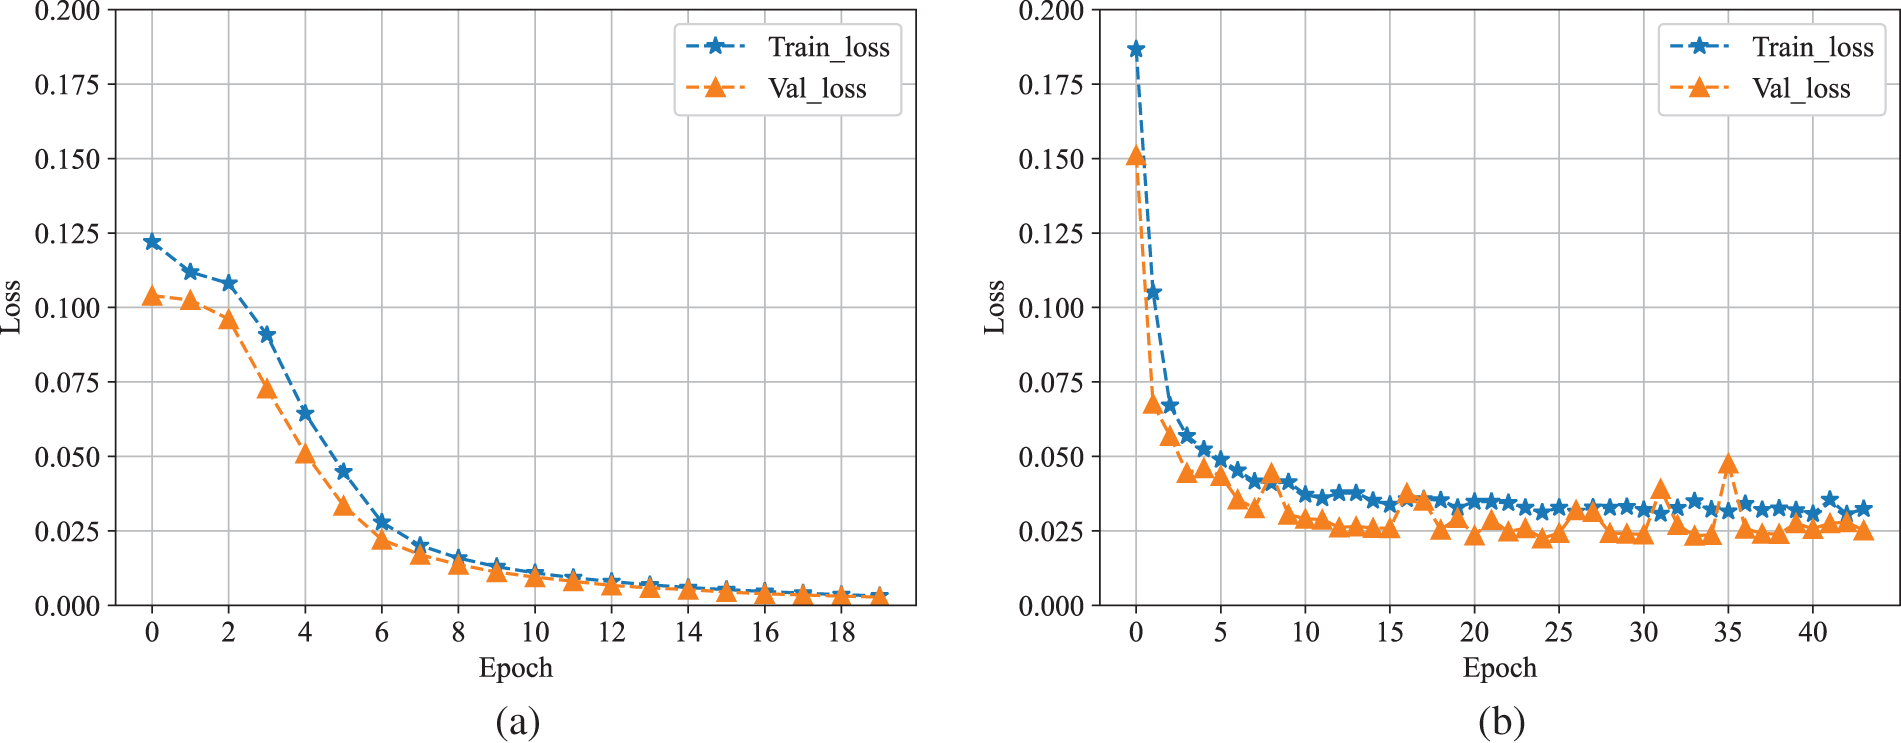
Figure 6: Loss curve changes detected using SGAT model for different attack injection data. (a) Training process using attack data generated by random FDIA model. (b) Training process using attack data generated by SLGAN FDIA model
In addition, we conducted a series of experiments on the IEEE 14-bus and IEEE 118-bus system datasets to verify the effectiveness of the model and its applicability to different datasets. In the testing, we used the four basic detection methods mentioned above: SGAT model, RF model, CNN model, SVM model. We compared and detect the two FDIA attack injection datasets mentioned in Section 4.1 by placing them into different detection models. The corresponding results were shown in Fig. 7. We can observe from this figure that the attack data generated using the FDIA based on SL-GAN model is more likely to deceive the four detection models than the data injected directly into the random FDIA attack, resulting in an effective decrease in the accuracy of the detection models. This indicates that the attack data generated by our model has stronger confusion and camouflage. To be specific, for IEEE 14-bus system dataset, the accuracy of the SGAT model has significantly decreased by about 12%, 15% approximately decrease for deep learning CNN model, and about 5% and 6% for two machine learning models, RF model and SVM model, respectively. Similarly, for IEEE 118-bus system dataset, our model generated attack data with a reduction of approximately 15% in accuracy for SGAT model, 12% for CNN model, 7% for RF and and 5% for SVM model. This indicates that the attack data generated by our model can effectively bypass the detection of the detection model. This is mainly because our model can learn the features of normal data during training stage, the generated attack data thus contains the characteristics of normal data, making it easy to find the difference between attack features and normal features. This greatly confuses the extraction and resolution ability of the detection model, ultimately leading to a decrease in the detection accuracy of FDIA. In addition, our model eliminates data redundancy through ascending and descending dimensions, achieving certain results at IEEE 14-bus and IEEE 118-bus system data, greatly enhancing the applicability of different datasets.
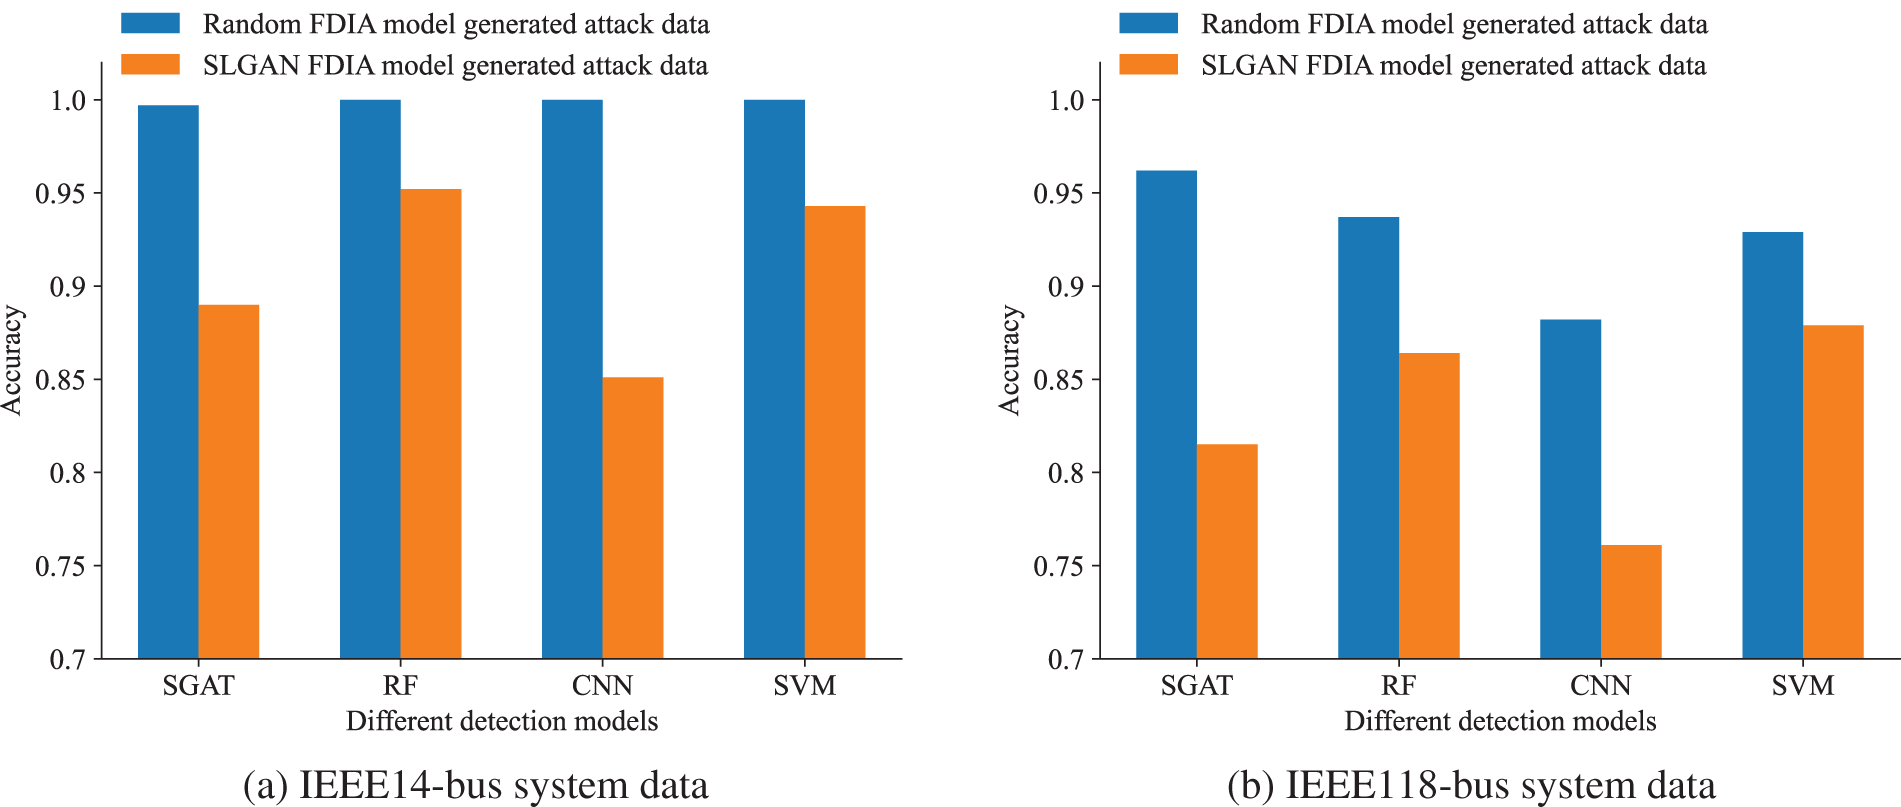
Figure 7: Comparison of accuracy performance of four detection models after injecting different FDIA attacks in (a) IEEE 14-bus system data and (b) IEEE 118-bus system data
Since our model needs to face attack scenarios of new power systems, e.g., VPP, a large-scale attack samples in this scenario are yet difficult to obtain. To verify the universality of the model, we adjusted the number of data injected into the attack from 270 to 7500, and conduct experimental comparisons on four detection models. The corresponding testing results were shown in Table 1.


4.3 Performance Comparison of Different Parameter
In order to further construct attack data with more camouflage and diversity, we carefully investigated the performance of the proposed scheme with different parameters, such as the number of loop iterations of the generator and discriminator, and different ratios of attack samples. Similar to previous experiments, we used attack datasets generated under different parameters for detection, and used four machine learning-based detection models, SGAT, RF, CNN, SVM. The impact of different parameters on the quality of the generated attack data were further discussed in this experiment.
We firstly conducted experimental comparisons on the balanced and unbalanced datasets of IEEE 14-bus system by changing the number of loop iterations of the generator and discriminator. We set the number of iterations to 20, 50, and 80, respectively (e.g., epochs = 20, 50, 80). Similar to previous experiments, we compared the accuracy and
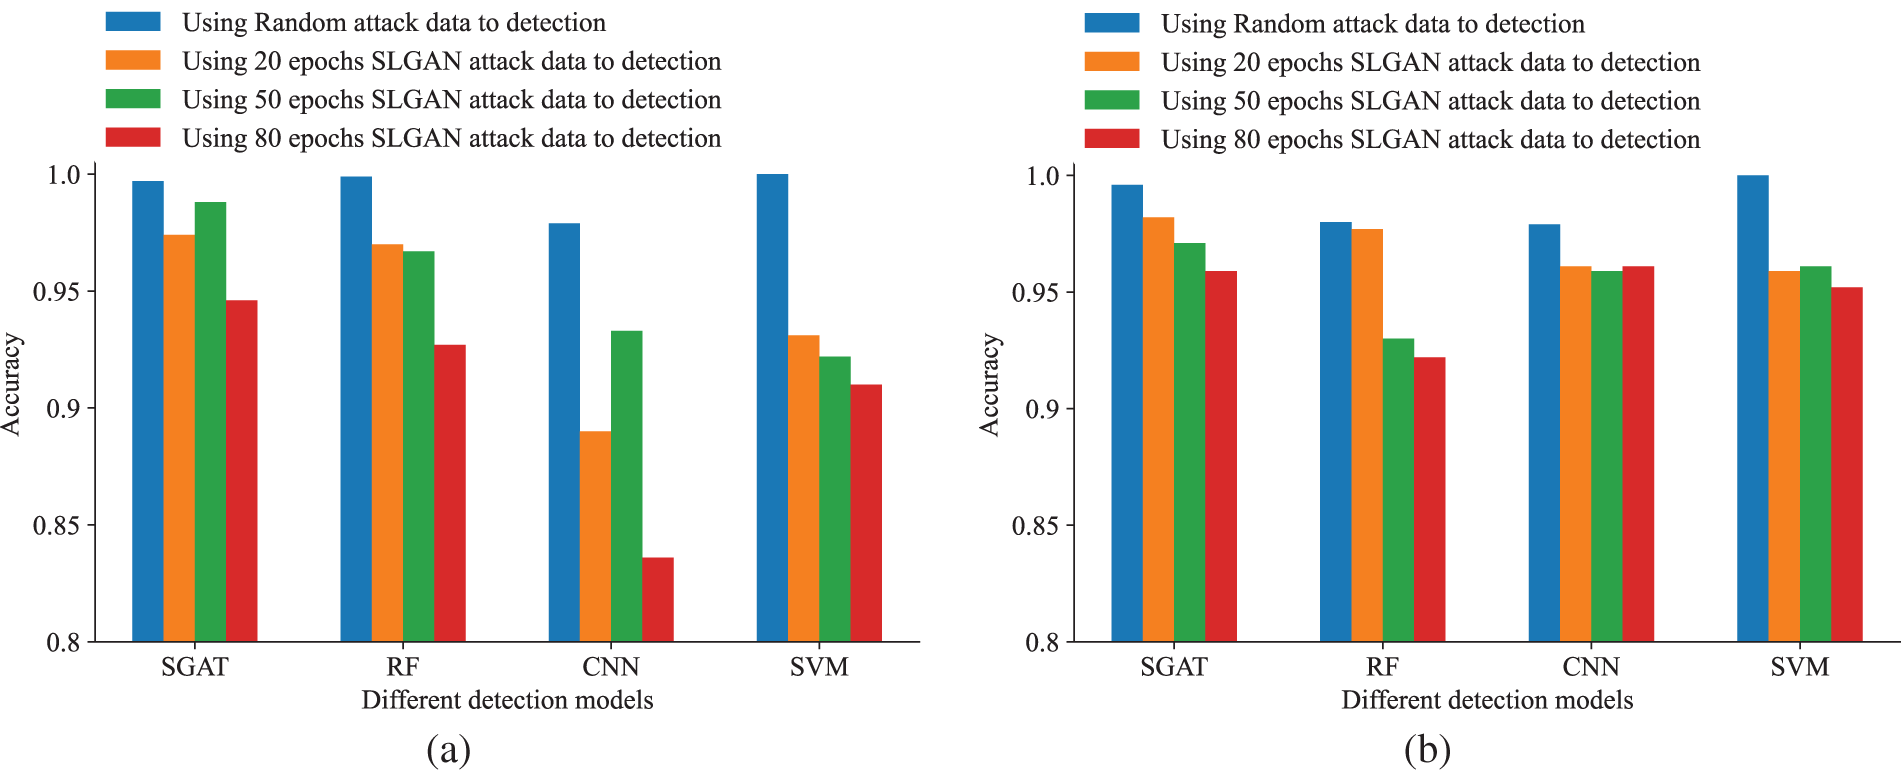
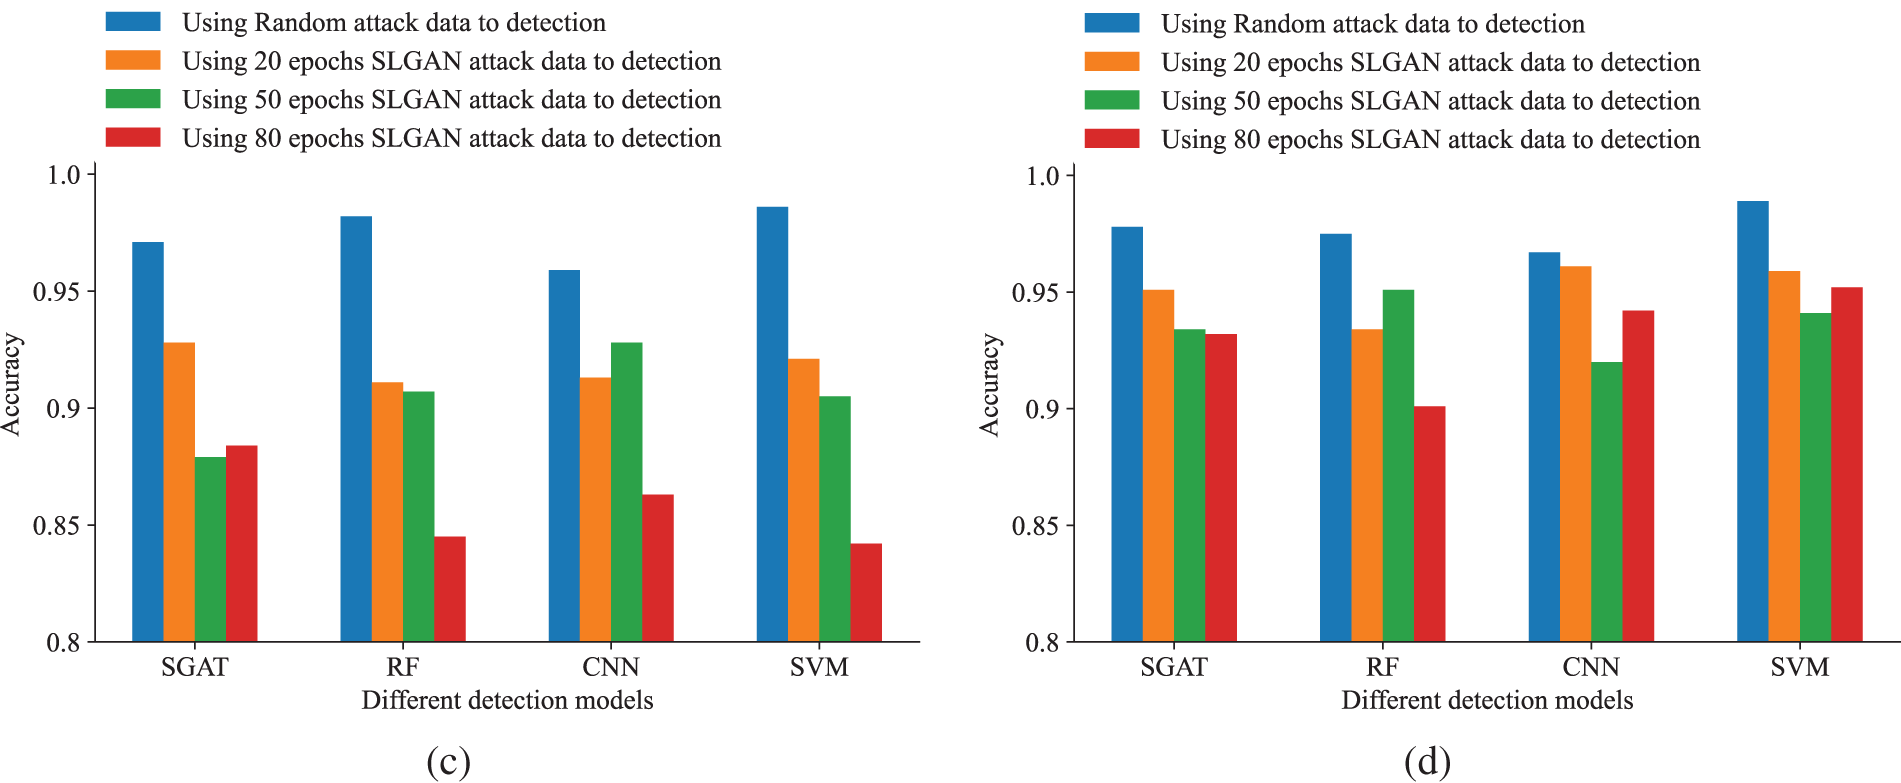
Figure 8: Accuracy comparisons when different parameters are used. In this test, we set epochs = 0, 20, 50, 80, respectively. (a) Changes in the accuracy of four detection models with different parameters on a balanced dataset of IEEE 14-bus system. (b) Changes in the accuracy of four detection models with different parameters on an unbalanced dataset of IEEE 14-bus system. (c) Changes in the accuracy of four detection models with different parameters on a balanced dataset of IEEE 118-bus system. (d) Changes in the accuracy of four detection models with different parameters on an unbalanced dataset of IEEE 118-bus system
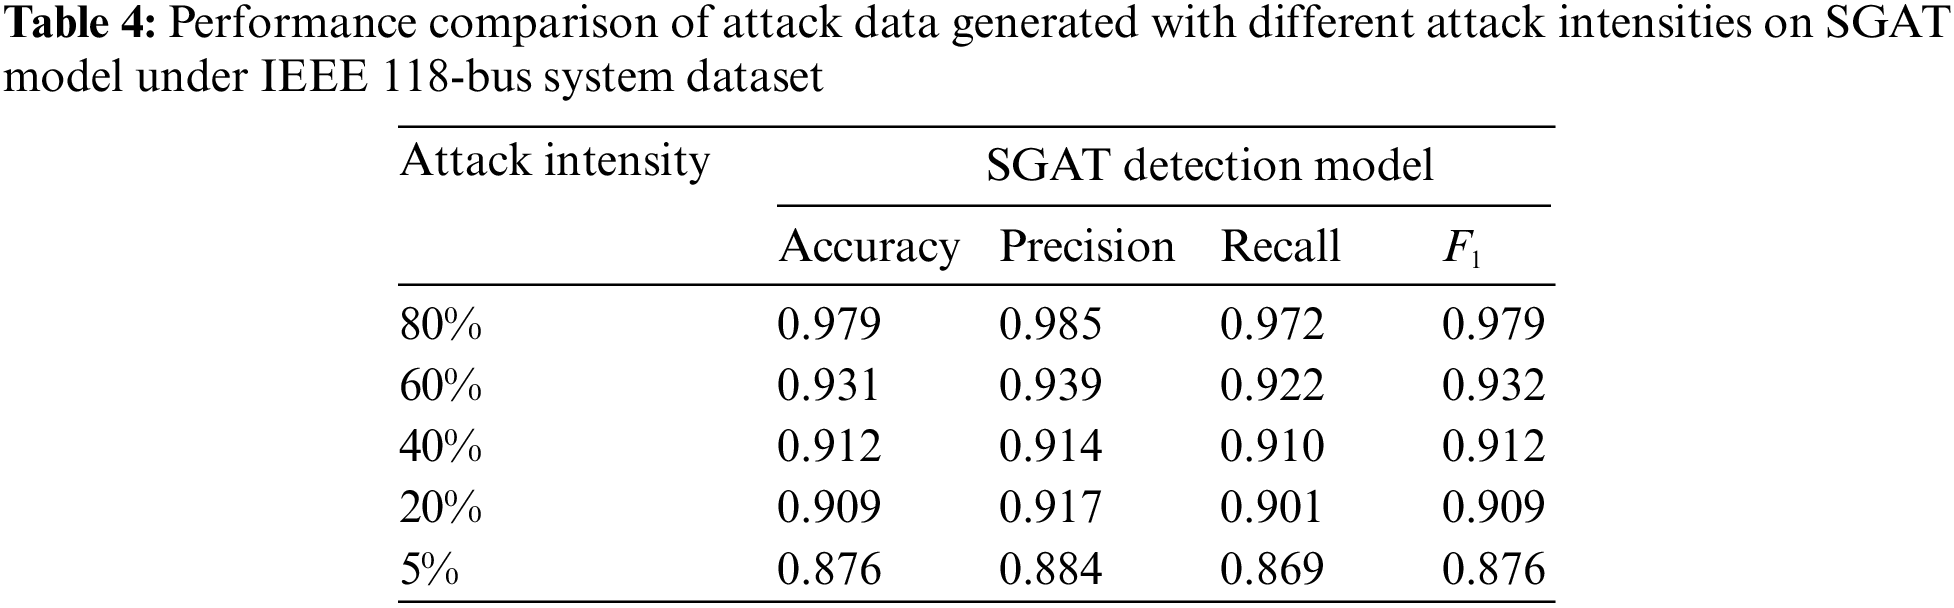
In addition, we further discussed the attack intensity, which is defined by the proportion of attack samples in all samples. Obviously, attack intensity is closely related to the ratio of input normal data to attack data, for example, attack intensity 5% represents 5% of attack data and 95% of normal data in the whole samples. We conducted experimental comparisons on the SGAT model [38] using attack data generated with different attack intensities, and use the evaluation metrics mentioned in Section 4.1. The corresponding results were shown in Tables 3 and 4. It can be observed that as the attack intensity decreases, four evaluation metrics show varying degrees of decline. This result is not difficult to understand. Due to the close correlation between attack intensity and the proportion of input normal data and attack data, when the proportion of input attack data decreases, the generated attack data only carry fewer characteristics of attack samples and have more characteristics of normal samples. This can naturally enhance the disguise and concealment of the attack data and further deceive the detection model.

4.4 Computational Complexity Comparison
To gain more insight, we further tested the computational complexity of our model when using different parameters. Specifically, we compared the computational complexity of the running time in different situations by changing the iteration number epoch parameter and attack intensity parameter. We can see from the following figure that the lower the attack intensity parameter, the higher the iteration number parameter, and the more time it takes to generate attack data. This can be a natural explanation. The lower the attack intensity, the more normal sample data that participates in training, and the more total samples trained, which naturally increases the time consumption. On the other hand, the more iterations, the more times it takes to find the optimal objective function, and the longer it takes to run. Compared to Fig. 9, Table 3 and 4, it can be easily observed that when the attack intensity decreases, the camouflage and concealment of the generated attack data will improve. Increasing the same number of iterations can generate the attack samples with higher quality, but, it is more time-consuming.
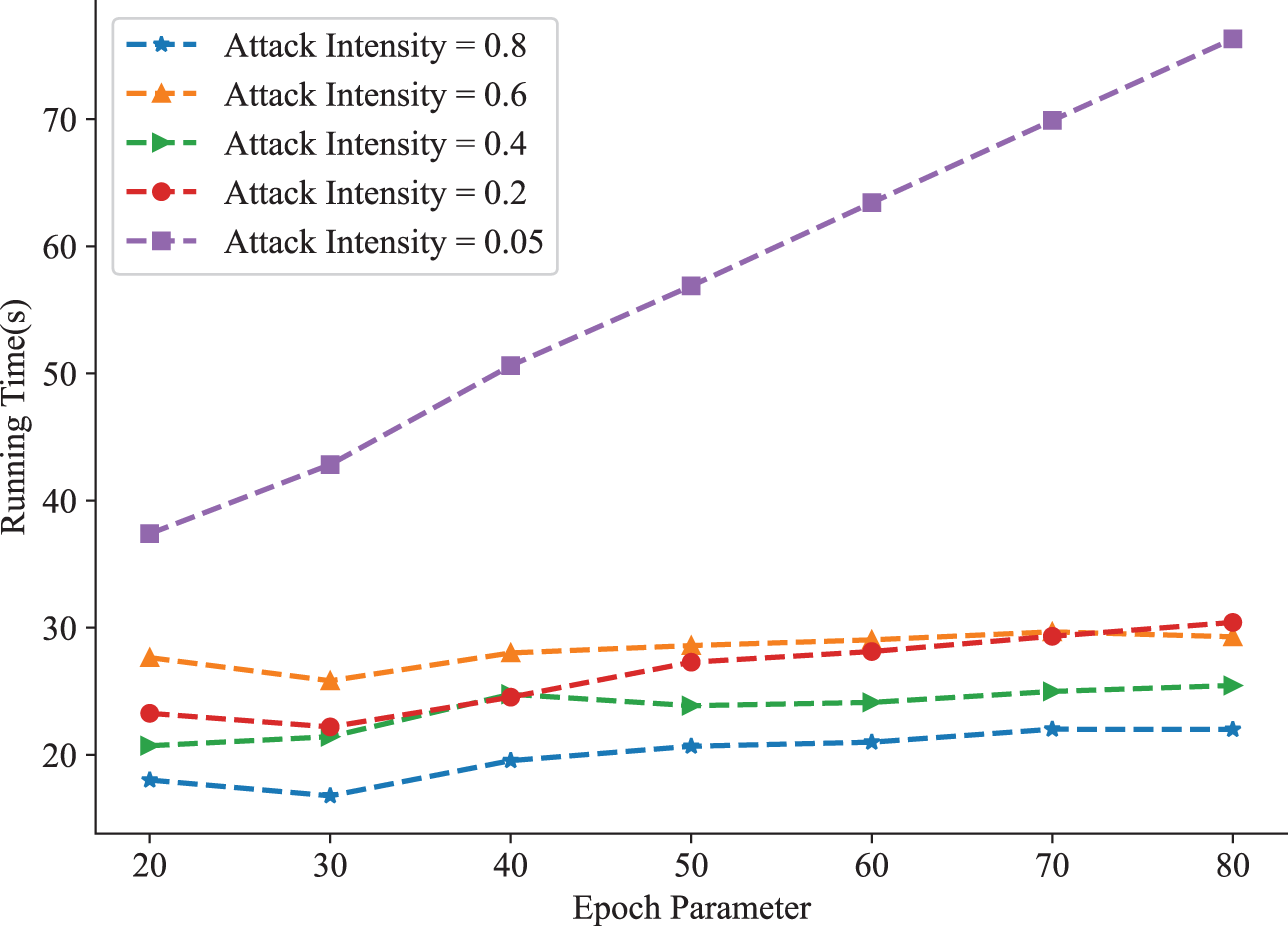
Figure 9: Complexity testing of different parameters
Due to the dynamic interaction between information flow and energy flow on both sides of the public and private sectors in virtual power plants, information risk and power risk can overlap and cross propagate on both sides of the public and private sectors. However, some detection models may not be able to fully utilize their detection capabilities when facing strong deceptive attack data designed by attackers. Therefore, this paper proposed a model for generating FDIA attack data based on SLGAN. The model first used time alignment technology to merge some normal sample data with the input attack data, and constructed a generator and discriminator for training. The generator was used to generate false attack data, and the discriminator was used to extract the characteristics of the attack samples and normal samples,and distinguish between false attack data and real data. Finally, the input of the trained generator meets the normal distribution, and generates more camouflage and covert attack data samples. A series of experimental comparisons utilizing four state-of-the-art detection models on the load datasets of the IEEE 14-node and IEEE 118-node systems were conducted, validating the attack data samples generated by the proposed model. The experimental results show that compared with the traditional random FDIA attack methods, the proposed attack data generative model can effectively bypass the detection of the detection model so that the detection accuracy is effectively reduced. In the public-private network edge scenarios, this method generates more covert and camouflage attack sample data, which expands the attack sample library and can be effectively used to simulate the methods of possible attack and unknown attack. This lays the foundation for further research on improving the anti-interference ability and detectability of detection models, and ultimately enhances the defense against FDIA attacks in smart grids.
Although our proposed method has shown excellent performance in FDIA detection testing, we should note that our attack data generation scheme mainly uses the load dataset of the IEEE 14-bus and IEEE 118-bus systems to simulate multi-source sensing data on the electrical side. In fact, for the special business scenario of public private interaction virtual power plant, it may be more practical to consider the public and private multi-source data sets. In addition, the time cost of generating attack data samples in our proposed model is relatively high. Producing high-quality attack data samples necessitates a significant time investment to achieve a decrease in detection rates. Future work will aim to address these issues, with a focus on enhancing the quality and efficiency of attack data generation.
Acknowledgement: The authors would like to thank the suggestions for data testing from Dr. Jung Yoon Kim and also thank anonymous reviewers for their valuable suggestions which helped to improve this article.
Funding Statement: This work was supported in part by the the Natural Science Foundation of Shanghai (20ZR1421600), and Research Fund of Guangxi Key Lab of Multi-Source Information Mining & Security (MIMS21-M-02).
Author Contributions: The authors confirm contribution to the paper as follows: study conception and design: Fengyong Li; data collection: Weicheng Shen; analysis and interpretation of results: Zhongqin Bi, Xiangjing Su; draft manuscript preparation: Fengyong Li, Weicheng Shen. All authors reviewed the results and approved the final version of the manuscript.
Availability of Data and Materials: All data used or analyzed during this study are included in this article and its references.
Conflicts of Interest: The authors declare that they have no conflicts of interest to report regarding the present study.
References
1. Zhao, J., Wen, F., Xue, Y., Li, X., Dong, Z. (2010). Cyber physical power systems: Architecture, implementation techniques and challenges. Dianli Xitong Zidonghua/Automation of Electric Power Systems, 34(16), 1–7. [Google Scholar]
2. Mo, Y., Kim, T. H. J., Brancik, K., Dickinson, D., Lee, H. et al. (2011). Cyber–physical security of a smart grid infrastructure. Proceedings of the IEEE, 100(1), 195–209. [Google Scholar]
3. Tian, J., Wang, B., Guo, R., Wang, Z., Cao, K. et al. (2021). Adversarial attacks and defenses for deep-learning-based unmanned aerial vehicles. IEEE Internet of Things Journal, 9(22), 22399–22409. [Google Scholar]
4. Horowitz, B. M., Pierce, K. M. (2013). The integration of diversely redundant designs, dynamic system models, and state estimation technology to the cyber security of physical systems. Systems Engineering, 16(4), 401–412. [Google Scholar]
5. Kazemi, Z., Safavi, A. A., Naseri, F., Urbas, L., Setoodeh, P. (2020). A secure hybrid dynamic-state estimation approach for power systems under false data injection attacks. IEEE Transactions on Industrial Informatics, 16(12), 7275–7286. [Google Scholar]
6. Paul, K. (2022). Modified grey wolf optimization approach for power system transmission line congestion management based on the influence of solar photovoltaic system. International Journal of Energy and Environmental Engineering, 13(2), 751–767. [Google Scholar]
7. Hong, T., Hofmann, A. (2021). Data integrity attacks against outage management systems. IEEE Transactions on Engineering Management, 69(3), 765–772. [Google Scholar]
8. Li, Z., Tong, W., Jin, X. (2016). Construction of cyber security defense hierarchy and cyber security testing system of smart grid: Thinking and enlightenment for network attack events to national power grid of ukraine and israel. Automation of Electric Power Systems, 40(8), 147–151. [Google Scholar]
9. Luo, X., Pan, X., Wang, X., Guan, X. (2022). Detection of false data injection attack in smart grid via adaptive kalman filtering. Acta Automatica Sinica, 48, 2960–2971 (In Chinese). [Google Scholar]
10. Cheng, G., Lin, Y., Zhao, J., Yan, J. (2022). A highly discriminative detector against false data injection attacks in AC state estimation. IEEE Transactions on Smart Grid, 13(3), 2318–2330. [Google Scholar]
11. Tang, C., Nayak, D. R., Wangx, S. (2020). Least-square support vector machine and wavelet selection for hearing loss identification. Computer Modeling in Engineering & Sciences, 125(1), 299–313. https://doi.org/10.32604/cmes.2020.011069 [Google Scholar] [CrossRef]
12. Li, C., Liu, L., Zhao, J., Liu, X. (2022). LF-CNN: Deep learning-guided small sample target detection for remote sensing classification. Computer Modeling in Engineering & Sciences, 131(1), 429–444. https://doi.org/10.32604/cmes.2022.019202 [Google Scholar] [CrossRef]
13. Chen, Y., Yong, W., Li, C., Zhou, J. (2023). Predicting the thickness of an excavation damaged zone around the roadway using the DA-RF hybrid model. Computer Modeling in Engineering & Sciences, 136(3), 2507–2526. https://doi.org/10.32604/cmes.2023.025714 [Google Scholar] [CrossRef]
14. Wu, Z., Sun, B., Feng, Q., Wang, Z., Pan, J. (2023). Physics-informed ai surrogates for day-ahead wind power probabilistic forecasting with incomplete data for smart grid in smart cities. Computer Modeling in Engineering & Sciences, 137(1), 527–554. https://doi.org/10.32604/cmes.2023.027124 [Google Scholar] [CrossRef]
15. Deng, R., Xiao, G., Lu, R., Liang, H., Vasilakos, A. V. (2016). False data injection on state estimation in power systems attacks, impacts, and defense: A survey. IEEE Transactions on Industrial Informatics, 13(2), 411–423. [Google Scholar]
16. Liu, Y., Gao, S., Shi, J., Wei, X., Han, Z. (2020). Sequential-mining-based vulnerable branches identification for the transmission network under continuous load redistribution attacks. IEEE Transactions on Smart Grid, 11(6), 5151–5160. [Google Scholar]
17. Liu, C., Liang, H., Chen, T. (2020). Network parameter coordinated false data injection attacks against power system AC state estimation. IEEE Transactions on Smart Grid, 12(2), 1626–1639. [Google Scholar]
18. Tian, J., Wang, B., Wang, Z., Cao, K., Li, J. et al. (2021). Joint adversarial example and false data injection attacks for state estimation in power systems. IEEE Transactions on Cybernetics, 52(12), 13699–13713. [Google Scholar]
19. Ehrhart, M., Resch, B., Havas, C., Niederseer, D. (2022). A conditional gan for generating time series data for stress detection in wearable physiological sensor data. Sensors, 22(16), 5969. [Google Scholar] [PubMed]
20. Rao, Y. N., Suresh Babu, K. (2023). An imbalanced generative adversarial network-based approach for network intrusion detection in an imbalanced dataset. Sensors, 23(1), 550. [Google Scholar] [PubMed]
21. Gao, H., Dai, B., Miao, H., Yang, X., Barroso, R. J. D. et al. (2023). A novel gapg approach to automatic property generation for formal verification: The gan perspective. ACM Transactions on Multimedia Computing, Communications and Applications, 19(1), 1–22. [Google Scholar]
22. Dina, A. S., Siddique, A., Manivannan, D. (2022). Effect of balancing data using synthetic data on the performance of machine learning classifiers for intrusion detection in computer networks. IEEE Access, 10, 96731–96747. [Google Scholar]
23. Li, X., Mao, K., Lin, F., Feng, Z. (2023). Feature-aware conditional gan for category text generation. Neurocomputing, 547, 126352. [Google Scholar]
24. Gao, H., Qiu, B., Barroso, R. J. D., Hussain, W., Xu, Y. et al. (2022). TSMAE: A novel anomaly detection approach for Internet of Things time series data using memory-augmented autoencoder. IEEE Transactions on Network Science and Engineering, 10(5), 2978–2990. [Google Scholar]
25. Ozay, M., Esnaola, I., Vural, F. T. Y., Kulkarni, S. R., Poor, H. V. (2013). Sparse attack construction and state estimation in the smart grid: Centralized and distributed models. IEEE Journal on Selected Areas in Communications, 31(7), 1306–1318. [Google Scholar]
26. Hao, J., Piechocki, R. J., Kaleshi, D., Chin, W. H., Fan, Z. (2015). Sparse malicious false data injection attacks and defense mechanisms in smart grids. IEEE Transactions on Industrial Informatics, 11(5), 1198–1209. [Google Scholar]
27. Bhattacharjee, A., Mondal, A. K., Verma, A., Mishra, S., Saha, T. K. (2022). Deep latent space clustering for detection of stealthy false data injection attacks against ac state estimation in power systems. IEEE Transactions on Smart Grid, 14(3), 2338–2351. [Google Scholar]
28. Yu, Z., Chin, W. (2015). Blind false data injection attack using PCA approximation method in smart grid. IEEE Transactions on Smart Grid, 6(3), 1219–1226. [Google Scholar]
29. Cao, Z., Xu, L., Chen, D. Z., Gao, H., Wu, J. (2023). A robust shape-aware rib fracture detection and segmentation framework with contrastive learning. IEEE Transactions on Multimedia, 25, 1584–1591. [Google Scholar]
30. James, J., Hou, Y., Li, V. O. (2018). Online false data injection attack detection with wavelet transform and deep neural networks. IEEE Transactions on Industrial Informatics, 14(7), 3271–3280. [Google Scholar]
31. He, Y., Mendis, G. J., Wei, J. (2017). Real-time detection of false data injection attacks in smart grid: A deep learning-based intelligent mechanism. IEEE Transactions on Smart Grid, 8(5), 2505–2516. [Google Scholar]
32. Ozay, M., Esnaola, I., Vural, F. T. Y., Kulkarni, S. R., Poor, H. V. (2015). Machine learning methods for attack detection in the smart grid. IEEE Transactions on Neural Networks and Learning Systems, 27(8), 1773–1786. [Google Scholar] [PubMed]
33. Qu, Z., Yang, J., Lang, Y., Wang, Y., Han, X. et al. (2022). Earth-mover-distance-based detection of false data injection attacks in smart grids. Energies, 15(5), 1733. [Google Scholar]
34. Hu, P., Gao, W., Li, Y., Hua, F., Qiao, L. et al. (2023). Detection of false data injection attacks in smart grid based on joint dynamic and static state estimation. IEEE Access, 11, 45028–45038. [Google Scholar]
35. Gulrajani, I., Ahmed, F., Arjovsky, M., Dumoulin, V., Courville, A. C. (2017). Improved training of wasserstein gans. Advances in Neural Information Processing Systems, 30, 5769–5779. [Google Scholar]
36. Wu, Y., Sheng, Y., Guo, N., Li, F., Tian, Y. et al. (2022). Hybrid deep network based multi-source sensing data fusion for fdia detection in smart grid. 2022 Asia Power and Electrical Technology Conference (APET), vol. 2022, pp. 310–315. Shanghai, China, IEEE. [Google Scholar]
37. Wu, Y., Wang, Q., Guo, N., Tian, Y., Li, F. et al. (2023). Efficient multi-source self-attention data fusion for fdia detection in smart grid. Symmetry, 15(5), 1019. [Google Scholar]
38. Liu, Q., Yang, Z., Wang, L., Zhang, Y., Lin, H. et al. (2021). SGAT: A self-supervised graph attention network for biomedical relation extraction. 2021 IEEE International Conference on Bioinformatics and Biomedicine (BIBM), vol. 2021, pp. 698–701. Fujian, China, IEEE. [Google Scholar]
39. Liang, G., Zhao, J., Luo, F., Weller, S. R., Dong, Z. Y. (2016). A review of false data injection attacks against modern power systems. IEEE Transactions on Smart Grid, 8(4), 1630–1638. [Google Scholar]
Cite This Article
 Copyright © 2024 The Author(s). Published by Tech Science Press.
This work is licensed under a Creative Commons Attribution 4.0 International License , which permits unrestricted use, distribution, and reproduction in any medium, provided the original work is properly cited.
 Downloads
 Citation Tools