
 Submit a Paper
 Propose a Special lssue
 Open Access
ARTICLE

AWSD: An Aircraft Wing Dataset Created by an Automatic Workflow for Data Mining in Geometric Processing
1 School of Artificial Intelligence, Beijing Technology and Business University, Beijing, 100048, China
2 School of Computer Science and Engineering, Beijing Technology and Business University, Beijing, 100048, China
* Corresponding Author: Nan Li. Email:
(This article belongs to the Special Issue: Integration of Geometric Modeling and Numerical Simulation)
Computer Modeling in Engineering & Sciences 2023, 136(3), 2935-2956. https://doi.org/10.32604/cmes.2023.026083
Received 16 August 2022; Accepted 19 October 2022; Issue published 09 March 2023
 View Full Text
 Download PDF
Abstract
This paper introduces an aircraft wing simulation data set (AWSD) created by an automatic workflow based on creating models, meshing, simulating the wing flight flow field solution, and parameterizing solution results. AWSD is a flexible, independent wing collection of simulations with specific engineering requirements. The data set is applicable to handle computer geometry processing tasks. In contrast to the existing 3D model data set, there are some advantages the scale of this data set is not limited by the collection source, the data files have high quality, no defects, redundancy, and other problems, and the models and simulation are all designed for the specific actual engineering demand. Moreover, AWSD has the characteristics of rich information and a similar model structure, which contributes to the construction of the surrogate model. On the other hand, this data set is suitable for advancing research of data mining in computational geometry graphics. To solve the problem that the CFD flows field results are not intuitive, this paper used the resampling method of surface data to sample the result to the model surface, then segmented the re-sampled 3D mesh surface, and compared with the differences among K-means algorithm, Mini-Batch K-means algorithm, and Spectral Clustering algorithm. AWSD provides 300 sets of models, meshes, CFD simulation results, and parametric results based on ARAP (As-Rigid-As-Possible) and Harmonic mapping for advancing the construction of engineering surrogate models, 3D mesh segmentation, surface resampling, and related geometric processing tasks.Graphic Abstract
Keywords
The combination of data sets, neural network methods, and machine learning is changing some fields of computer science, while the data sets are the foundation of development. In industry, the establishment of surrogate model simulation calculations based on machine learning can solve the problem of a large number of physical simulation calculations. The traditional surrogate model can help design a simple regression model by manually adjusting the training shape. Modern surrogate models combine data sets with deep learning methods to learn directly from the shape of the model. Therefore, high-quality data sets have a great impact on the application of deep learning in engineering.
At the same time, 3D mesh segmentation based on machine learning has emerged in recent years. As far as the current state of research is concerned, there is no clear standard for the system evaluation criteria of segmentation methods and problems that the sensitivity of existing algorithms to models is different, so 3D mesh segmentation needs to be explored from multiple angles and fields. Therefore, high-quality data sets can provide rich information from multiple perspectives to promote the comprehensive consideration of 3D mesh segmentation, which is important significance to advance the application of machine learning in 3D mesh segmentation.
At present, the data collection of the 3D model data set comes from the following three sources:
Comprehensive generation of shape data. Users need to manually input programs or engineers to explore and input accurate geometric parameters to create models. Although the users can accurately control the shape model’s generation, this designed behavior limits the shape diversity and lacks authenticity.
Collecting shape data. The collection of this kind of shape data comes from all kinds of publicly available interfaces hosted. A new large-scale model data set was formed by filtering the collected models, including segmentation, classification, cleaning, shape exploration, and other operations. However, for example, ShapeNet, ABC, etc. This kind of model data sets need more practical engineering simulation, so it is impossible to develop the surrogate model.
Design competition data. The collection of this kind of shape data comes from the engineering design competition. The contestants create the model according to the specific engineering requirements, so this kind of data maintains the authenticity of the model and has engineering simulation. However, the data file submitted by the participants may have defects, redundancy, and other problems. It is necessary to clean up the competition works. In addition, the scale of the data set is limited by the number of works.
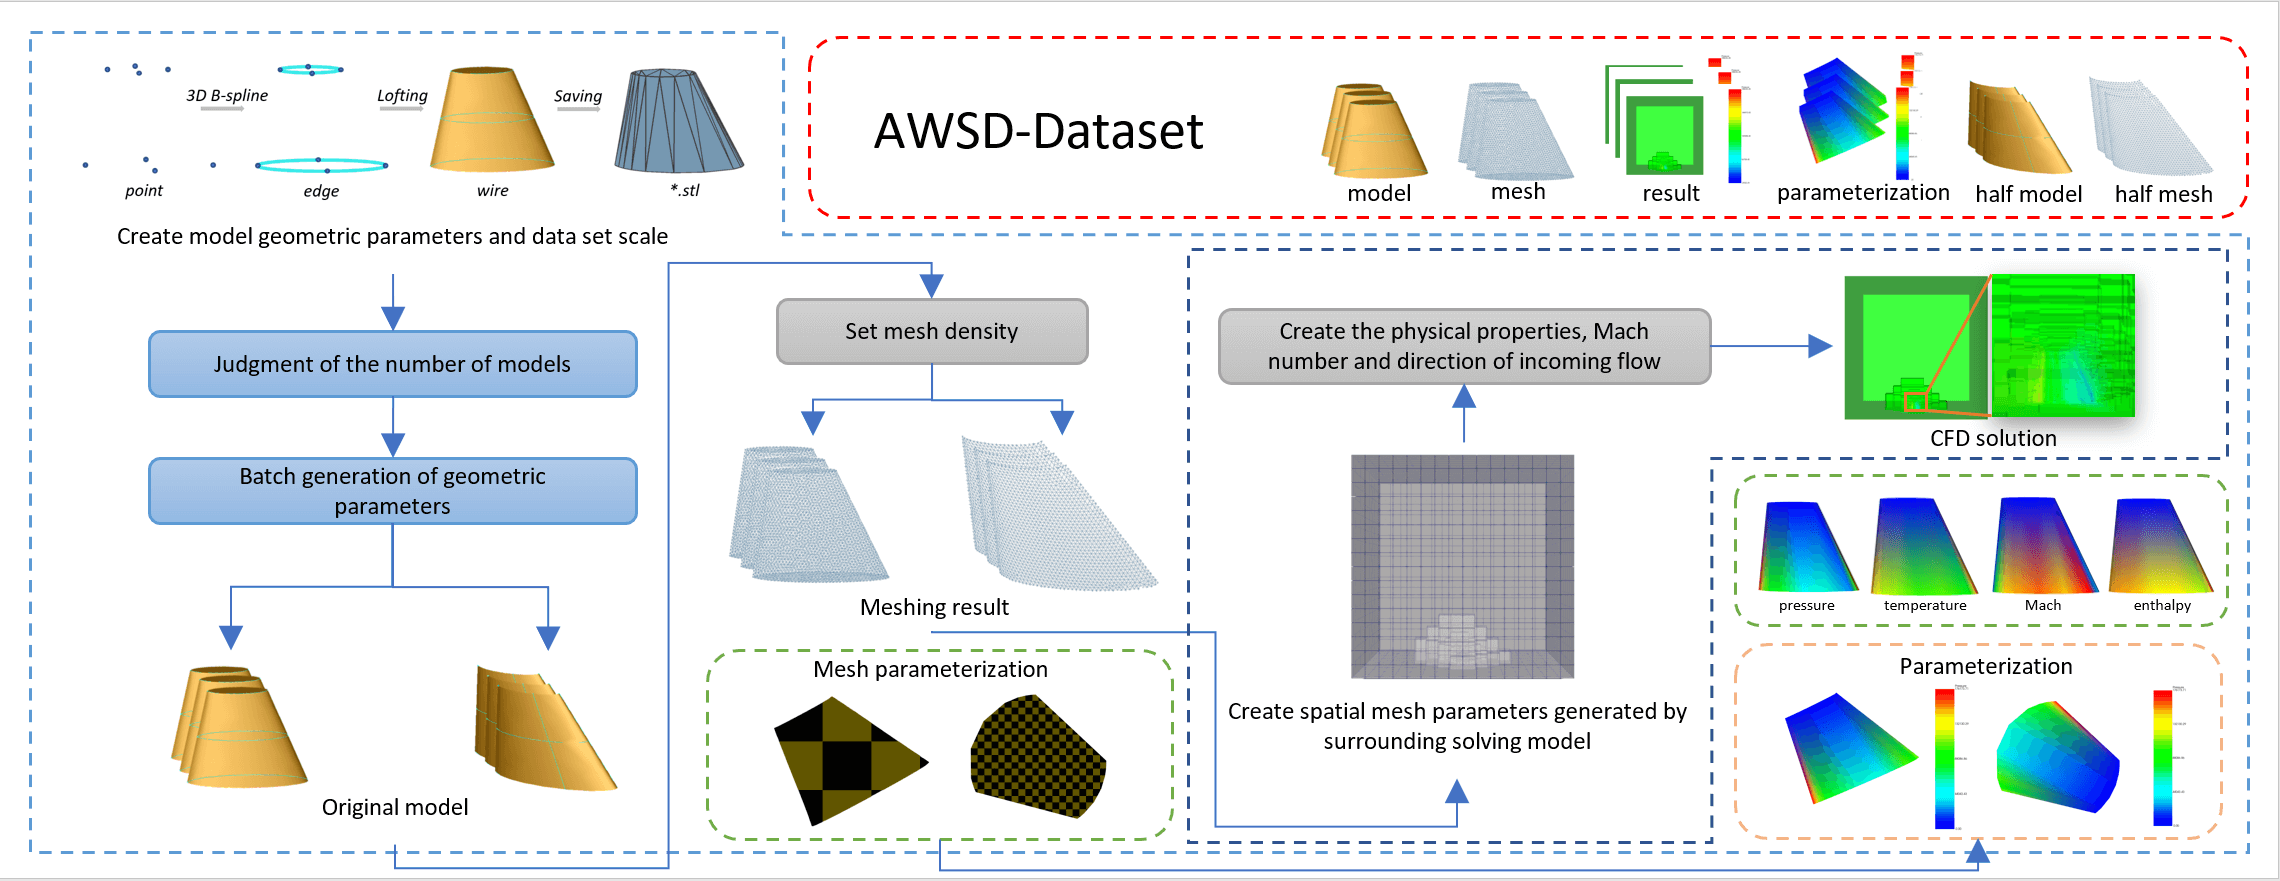
Considering the characteristics of three kinds of data collection, this paper proposes to create a simulated aircraft wing data set (see Fig. 1). This is a new, independent collection of simulations with specific engineering requirements. A simulation with specific engineering requirements means that AWSD provides a collection of data for the creation of models, meshing, numerical simulation solutions, and their parameterization based on an automated workflow to address simulations at the experimental assumptions of aircraft airfoils under specific incoming physical conditions (e.g., pressure, temperature, specific heat capacity), Mach number and specified incoming flow direction in terms of attack angle and side-slip angle. The data set is equipped with CAD models, triangular mesh data, solution result files of simulated aircraft wing flow field, and parameterization result files of flow field solution resampling.
Figure 1: Introducing AWSD: An aircraft wing data set (AWSD) created by an automatic workflow
The contributions are as follows:
1. Create data set: An automatic workflow used in batch to create CAD models, automatic subdivision surface mesh, calculate CFD flows field, and model parameterization of resampling of flow field results.
2. Data resampling: To solve the problem that the CFD flows field solution result is not intuitive, and sample the flow field solution result to the model surface.
3. 3D mesh segmentation: Resampling results were used for 3D mesh segmentation based on iterative clustering and spectral clustering and compared the difference between iterative clustering and spectral clustering.
Section 2 describes the advantages and existing problems of SimJEB, ShapeNet, and ABC, and compares the differences with AWSD proposed in this paper. Section 3 describes the automated workflow for creating this data set. Section 4 presents the applications of the data set in resampling and 3D mesh segmentation. Section 5 summarizes the conclusions of this paper and puts forward suggestions for future work.
2.1 Compared with Existing Datasets
SimJEB is a complex, diverse, and open data set for mechanical support and related structural simulation. This data set is used in promoting deep learning, engineering surrogate modeling, and other tasks and comes from the GE Jet Engine Bracket Challenge. After filtering, SimJEB finally collected 381 models. Each model is equipped with five data type files as a set of data: a) CAD models, b) finite element models, c) tetrahedral mesh data, d) triangular surface mesh data, and e) simulation results. The surrogate model based on the model in SimJEB can simulate and solve the problems that cannot be solved by the original model [1]. The data set we provide inherits this advantage. It can be used as the input of simulation calculation to establish a surrogate model, to avoid using the knowledge of fluid mechanics and solid mechanics for finite element simulation. Compared with SimJEB, the scale of the data set we provide is not limited, so researchers can specify the scale of the data set. Each model in the data set we provide is equipped with three data type files as a set of data: a) CAD models, b) triangular surface meshes data, c) simulation results, and d) parametric results. The establishment and source of data sets are not bound by the comprehensive generation of shapes, collection of shapes, and design competitions and data sets can be established according to the specific needs of engineering projects.
ShapeNet is a large and informative 3D model repository. There are many kinds of models in ShapeNet, and each model is provided with a large number of annotation sets. However, there is a problem with expanding new data in ShapeNet that models need to artificially extend the annotated model and collect new models from new data sources. The models contained in ShapeNet only include the 3D models of objects from daily life, while excluding CAD mechanical parts, molecular structures, or other objects in specific fields [2]. Therefore, compared with ShapeNet, the data set we provide does not require collecting new models from various new sources or artificially annotating the model while solving the problem that ShapeNet cannot be applied in specific fields.
ABC-Data set is a collection of more than one million independent and high-quality 3D models, which is applied to geometric deep learning. The source of models in the ABC-Data set comes from the publicly available interfaces hosted by OnShape. However, the model is designed and created artificially, so there is a problem that models may have imperfect boundaries, intersecting faces, and edges, or duplicate vertices. To avoid low-quality defective models, model collectors need to use geometric and topological criteria for filtering. Therefore, compared with ABC-Dataset, the CAD models in the data set we provided are created in batches by using the open-source software OpenCasCade to avoid incomplete models in model loading and translation [3].
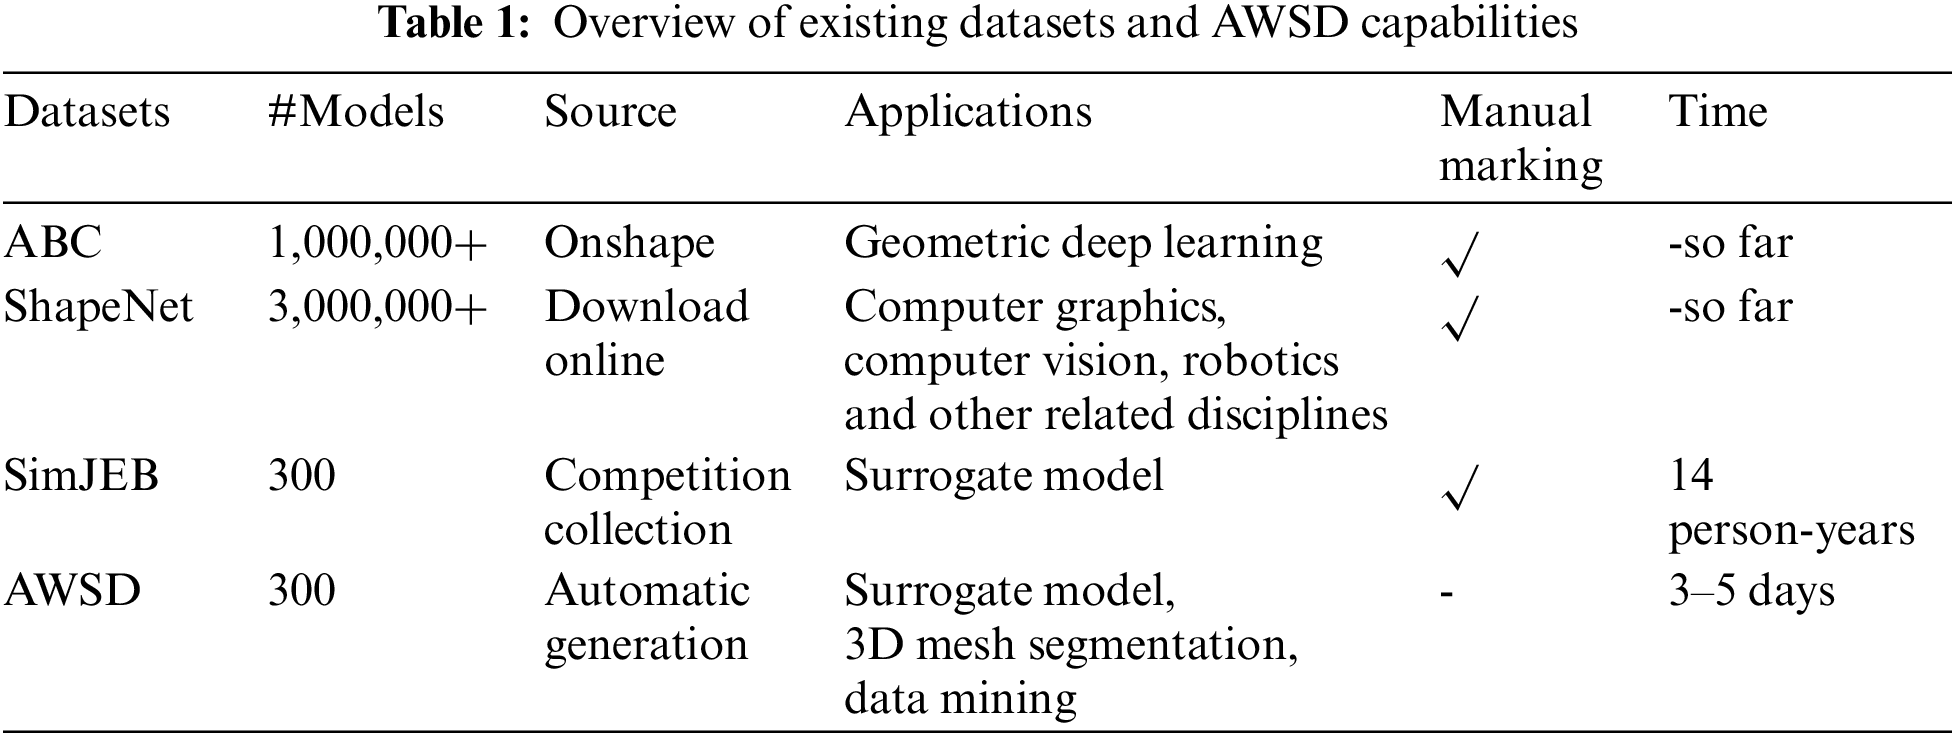
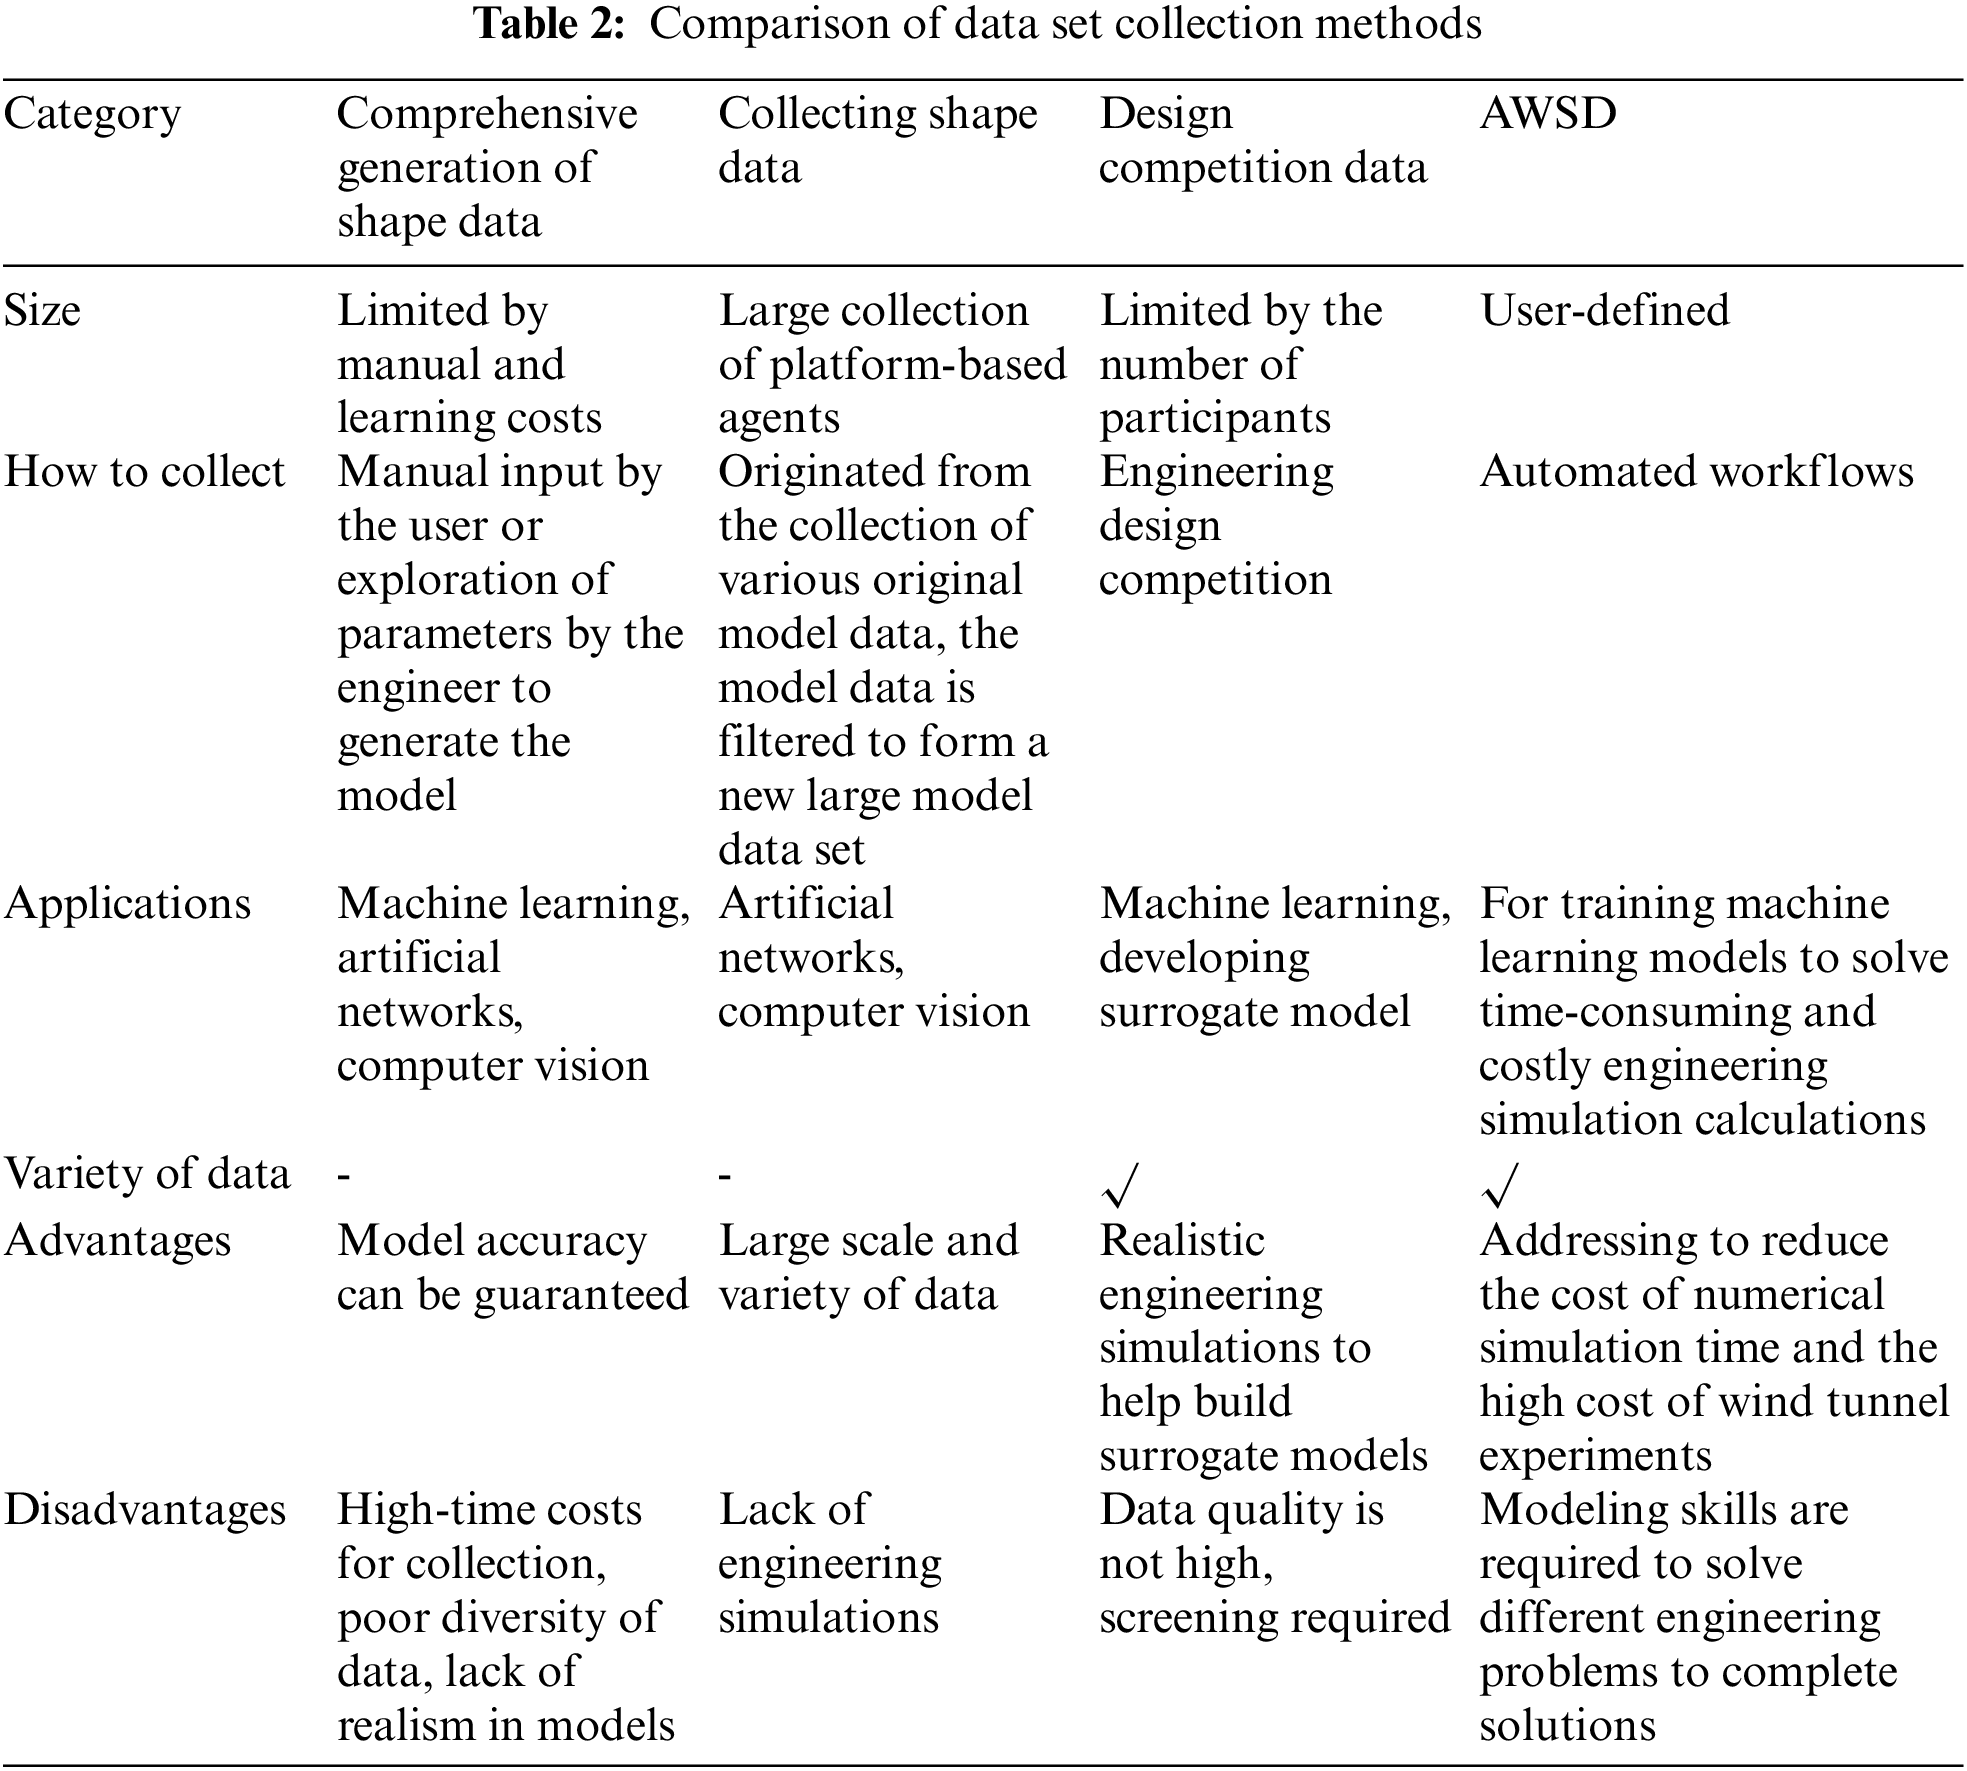
Compared to the existing data sets mentioned above (see Table 1), AWSD provides a data collection method for collecting data to form data sets. Its efficiency and intelligence will be demonstrated by listing the sources of the current three data sets collected and comparing them by size, collection method, purpose, advantages, and disadvantages (see Table 2).
2.2 Processing of Geometric Data
Data mining is a hot issue in artificial intelligence and database research. It is a decision-support process based on artificial intelligence, machine learning, pattern recognition, statistics, database, visualization, and other fields. Its advantages are to achieve highly automated data analysis and make reasonable inductive reasoning, tap potential patterns and help decision makers make correct decisions. The research on geometric modeling, data processing, and data mining theory based on algebra, geometry, and other core mathematical fields is one of the research hotspots of computer geometry graphics. The application of this technology can improve the research level in the basic theory of free curve and surface modeling, graphic image processing, and finite element analysis, and provide basic theoretical support for the secondary development and application of CAD, CAM, CAE, and other fields.
This section summarizes the research status of relevant data processing and data mining theories involved in this paper.
Data preparation. A three-dimensional point cloud provides efficient external representation for complex objects and their surrounding environment [4], so it is widely used in many fields. Point cloud processing includes surface reconstruction [5–7], rendering [8–11], feature extraction [12–15] and visualization [16,17].
Point cloud resampling is an important tool to point cloud segmentation. There is a problem in that it takes a lot of time to calculate the traditional contour detection to obtain the normal and classification model of the surface [18,19]. In the team [20], an effective random resampling strategy is proposed to reduce the computational complexity, which is intended to represent the resampling problem as a graphical signal sampling to resample the 3D point cloud. To replace the traditional uniform resampling, the team [21] proposed contour enhancement resampling based on the point cloud resampling research of hypergraph spectrum analysis to solve the problem of selecting the point set in the point cloud and extracting different surface features.
Data mining in clustering. Data Mining algorithms include classification, clustering, association rules, and linear regression. Clustering is the core of applications in many data areas and has a wide range of applications in various fields. This paper will focus only on the K-means clustering algorithm for computational geometry.
Although the K-means clustering algorithm is considered to be one of the most powerful and popular data mining algorithms in the research field [22], this algorithm will lead to accidental convergence due to the random initialization of the centroid, which has certain limitations. Therefore, the K-means clustering algorithm has various variants. The team [23] introduced an extended fuzzy K-means algorithm, which is used to classify data, and the clustering center vector is expressed as an extended form to preserve more clustering information as much as possible. The team [24] proposed a K-means clustering algorithm based on adaptive learning to solve the problem that the traditional K-means clustering algorithm is vulnerable to noise and outliers.
Results and evaluation. In machine learning, a clustering algorithm is a relatively important part of an unsupervised learning algorithm, which is commonly used in low-resource and unlabeled cases. K-means is one of the most important algorithms in clustering algorithms, and there is a fatal disadvantage in the selection of the K value. If the selection is good, the clustering effect can be better. Therefore, the corresponding optimal clustering results are given by using the evaluation index of the clustering effect. The silhouette coefficient is an index to evaluate the clustering effect. The best value is 1, the worst difference is −1, and the values close to 0 represent overlapping clusters. Negative values usually represent samples assigned to the wrong cluster. At present, researchers often use this method to evaluate unsupervised learning results. For example, the team [25] used a silhouette coefficient to evaluate a method of power grid region classification based on SOM clustering, and the results show that it has good accuracy. The team [26] used the silhouette coefficient to identify good clustering results for household smart meter data.
The following section describes the automated workflow for model creation, mesh generation, wing flight flow field solution simulation, and parameterization of solution results. The complete workflow is depicted in Fig. 2. In the complete workflow, professionals need to set the parameter setting and constraint conditions of the project according to specific engineering needs. The use of the automated workflow proposed in this paper requires a professional to understand OpenCasCade to complete the model creation and to specify the mesh density in the meshing step to facilitate the solution. What’s more, professionals need to have a background in CFD solving for aircraft wing shapes, to be familiar with solving experimental assumptions, and to complete the loading of experimental conditions to complete the simulation.
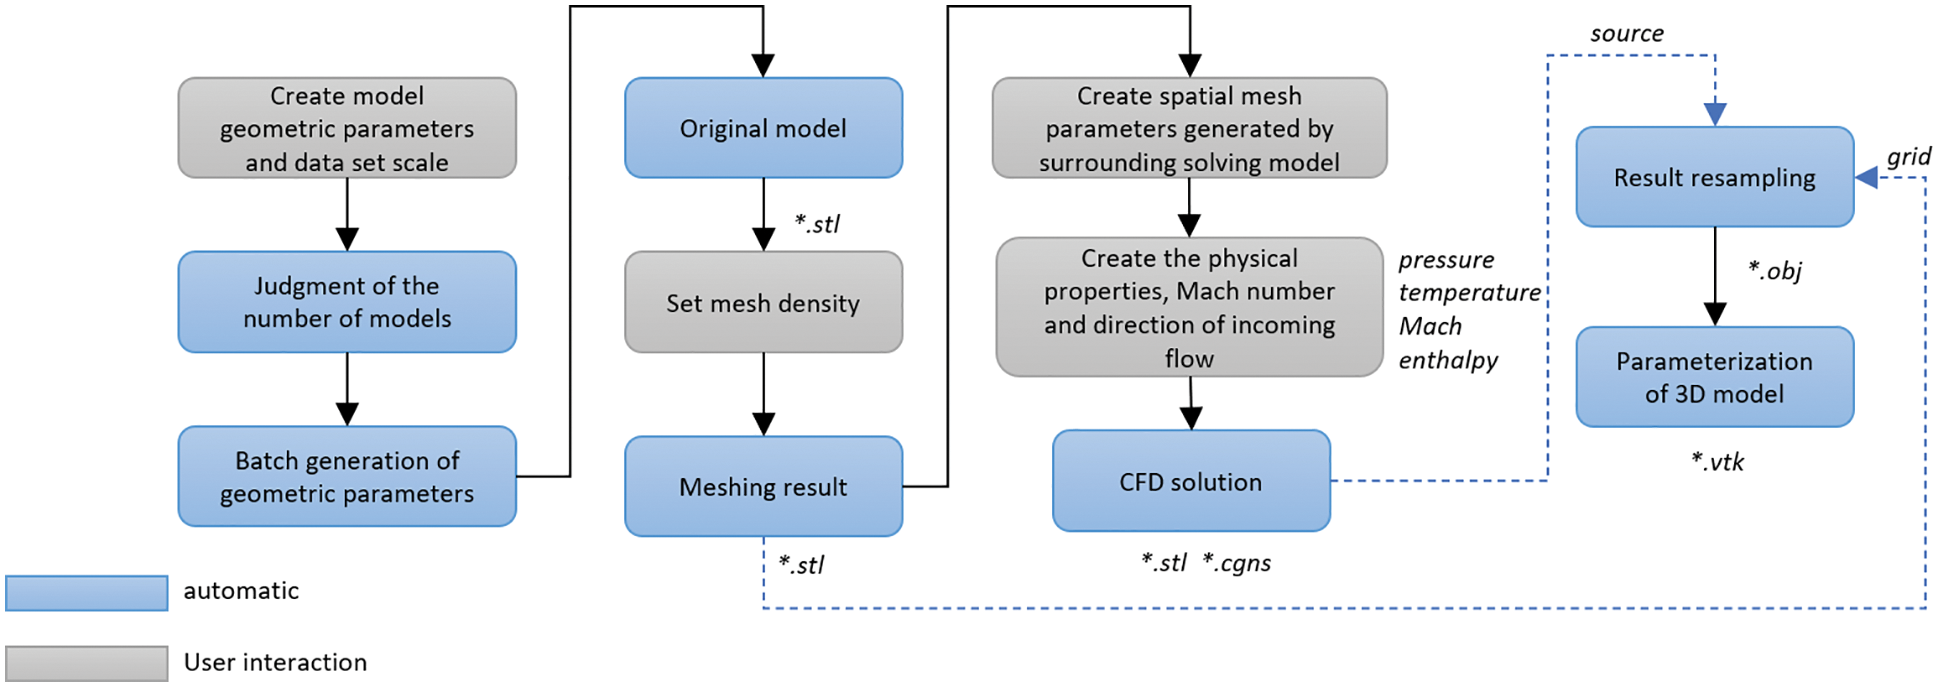
Figure 2: The automated workflow is used to create models, mesh, finish flow field solution, and parameterization
There are 300 CAD models of aircraft wings, which come from the batch generation of programs. We took OpenCasCade as the development engine, used a 3D B-spline curve to approximate the geometric parameters of the wing end face, and completed the creation of the wing 3D model through lofting operation (See Fig. 3). At present, the 3D B-spline curve approximation is used to roughly fit the five points defined to express the aircraft wings profile structure and facilitate the integration of control parameters. To accommodate the fitting of fine geometries, the construction of the 3D model can be adapted to the needs of the actual geometry processing task by adding fitting points or constructing a custom fitting function. Since the 3D model of the aircraft wing is a topological structure, the derived format is STL, which is convenient for subsequent CFD simulation calculation. Moreover, we also provide the derived STL format of the half membrane structure of the aircraft wing. In the subsequent CFD flows field calculation, we will use the half membrane structure as the input to shorten the solution time and cost.
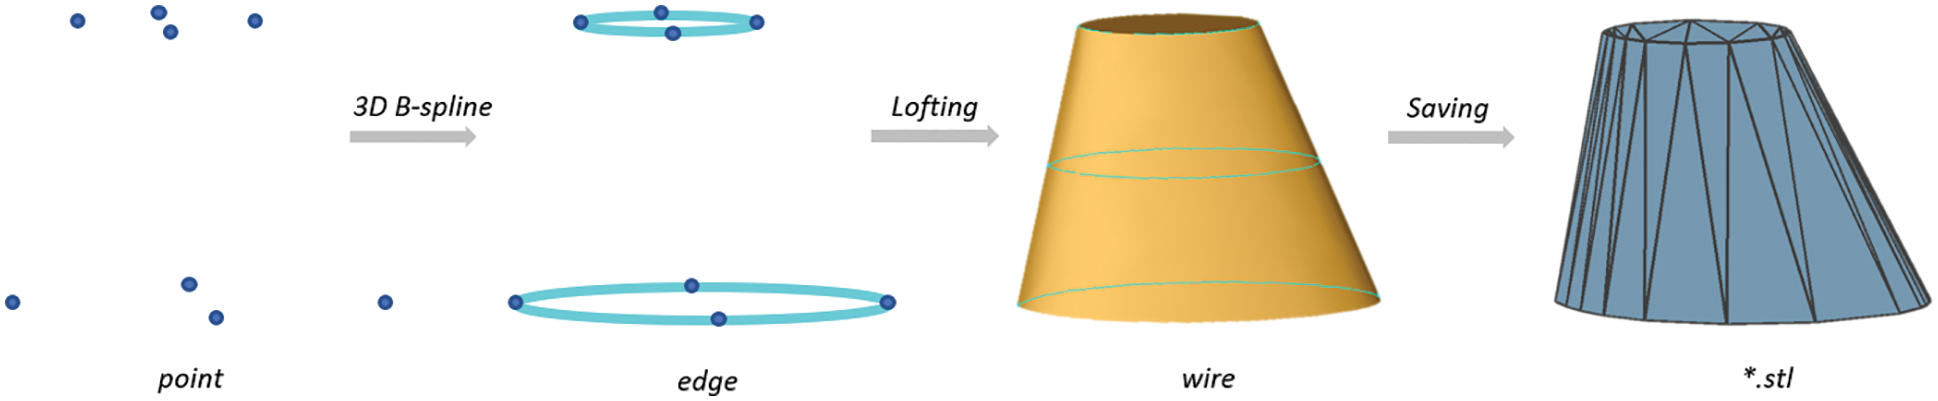
Figure 3: The generation process of CAD original model of an aircraft wing. Eight points determine the shape of the end face of the wing, 3D B-spline fitting forms a closed figure, and end face lofting forms a model
The principle of batch generation of CAD models of an aircraft wing is to generate different models by changing the geometric parameters and distance of both end faces of the aircraft wing. The position of four points at both end face of the aircraft wing determines the shape of the 3D B-spline curve approaching the closed figure. The change of the end face distance is to change the Y value of four points in the smaller of the two end faces of an aircraft wing. To ensure the rationality of the aircraft wing model generated in batch, we design to change the geometric parameters of the model step in step. When the number of models generated in the batch is required to be less than 50, we change the value of distance and geometric parameters of two end faces, which changed each time are 0.5% of the current parameter. When the number of batch-generated models is required to be greater than 50 and less than 200, each variation in the geometric parameters is 0.1% of the current parameter value. When the number of batch-generated models is required to be greater than 200 and less than 500, each variation in the geometric parameters is 0.05% of the current parameter value.
Before CFD flows field analysis, it is necessary to mesh each CAD model. Although in Section 3.1, the CAD model generated in the batch is in STL format and the model file is a surface mesh structure, which will affect the subsequent calculation because of the low-quality grid. Therefore, we redivided the surface mesh of the CAD model. In the case of saving time and cost, we should improve the calculation solution as much as possible and encrypt the surface mesh of the model. We save the CAD model after surface mesh re-division in STL format. At the same time, we also provide the STL file of the corresponding half model after meshing (see Fig. 4).
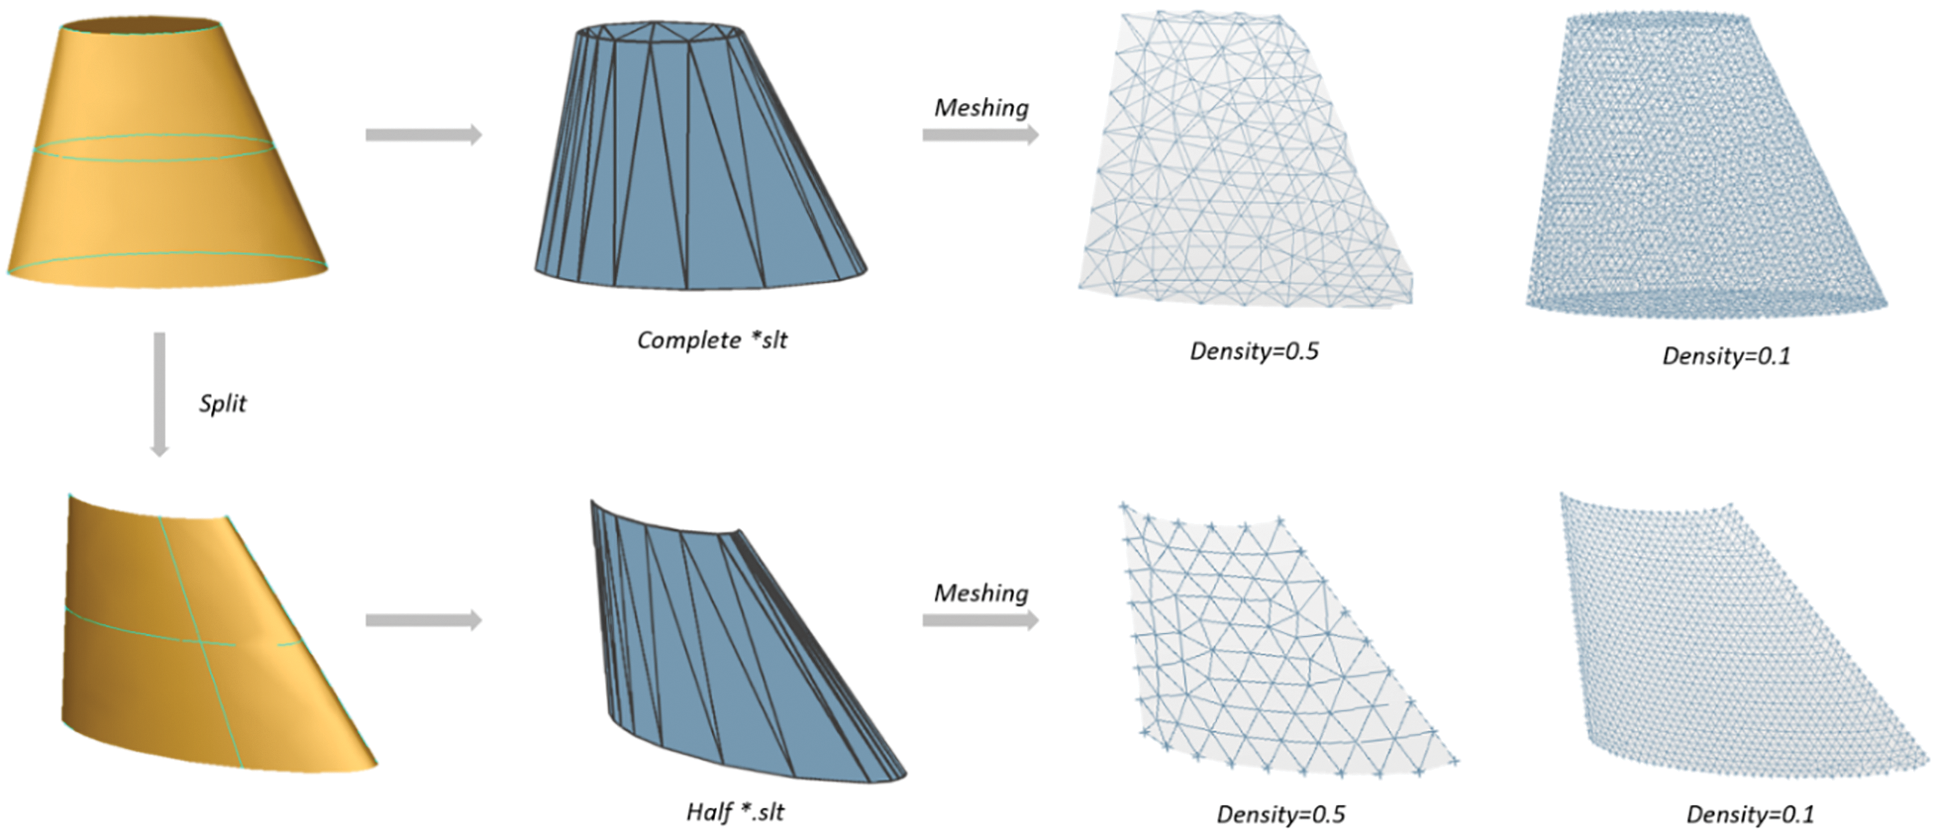
Figure 4: The meshing of the full model and half model of an aircraft wing. Fully automatic workflow supports STL formats output of the full model and half model and supports researchers to re-divide the model surface according to engineering requirements
We finish batch CFD flows field analysis with the program. The input file data required for CFD flows field analysis are: a) CAD model data file, b) Cartesian grid [27] generation configuration file, and c) CFD solution configuration file.
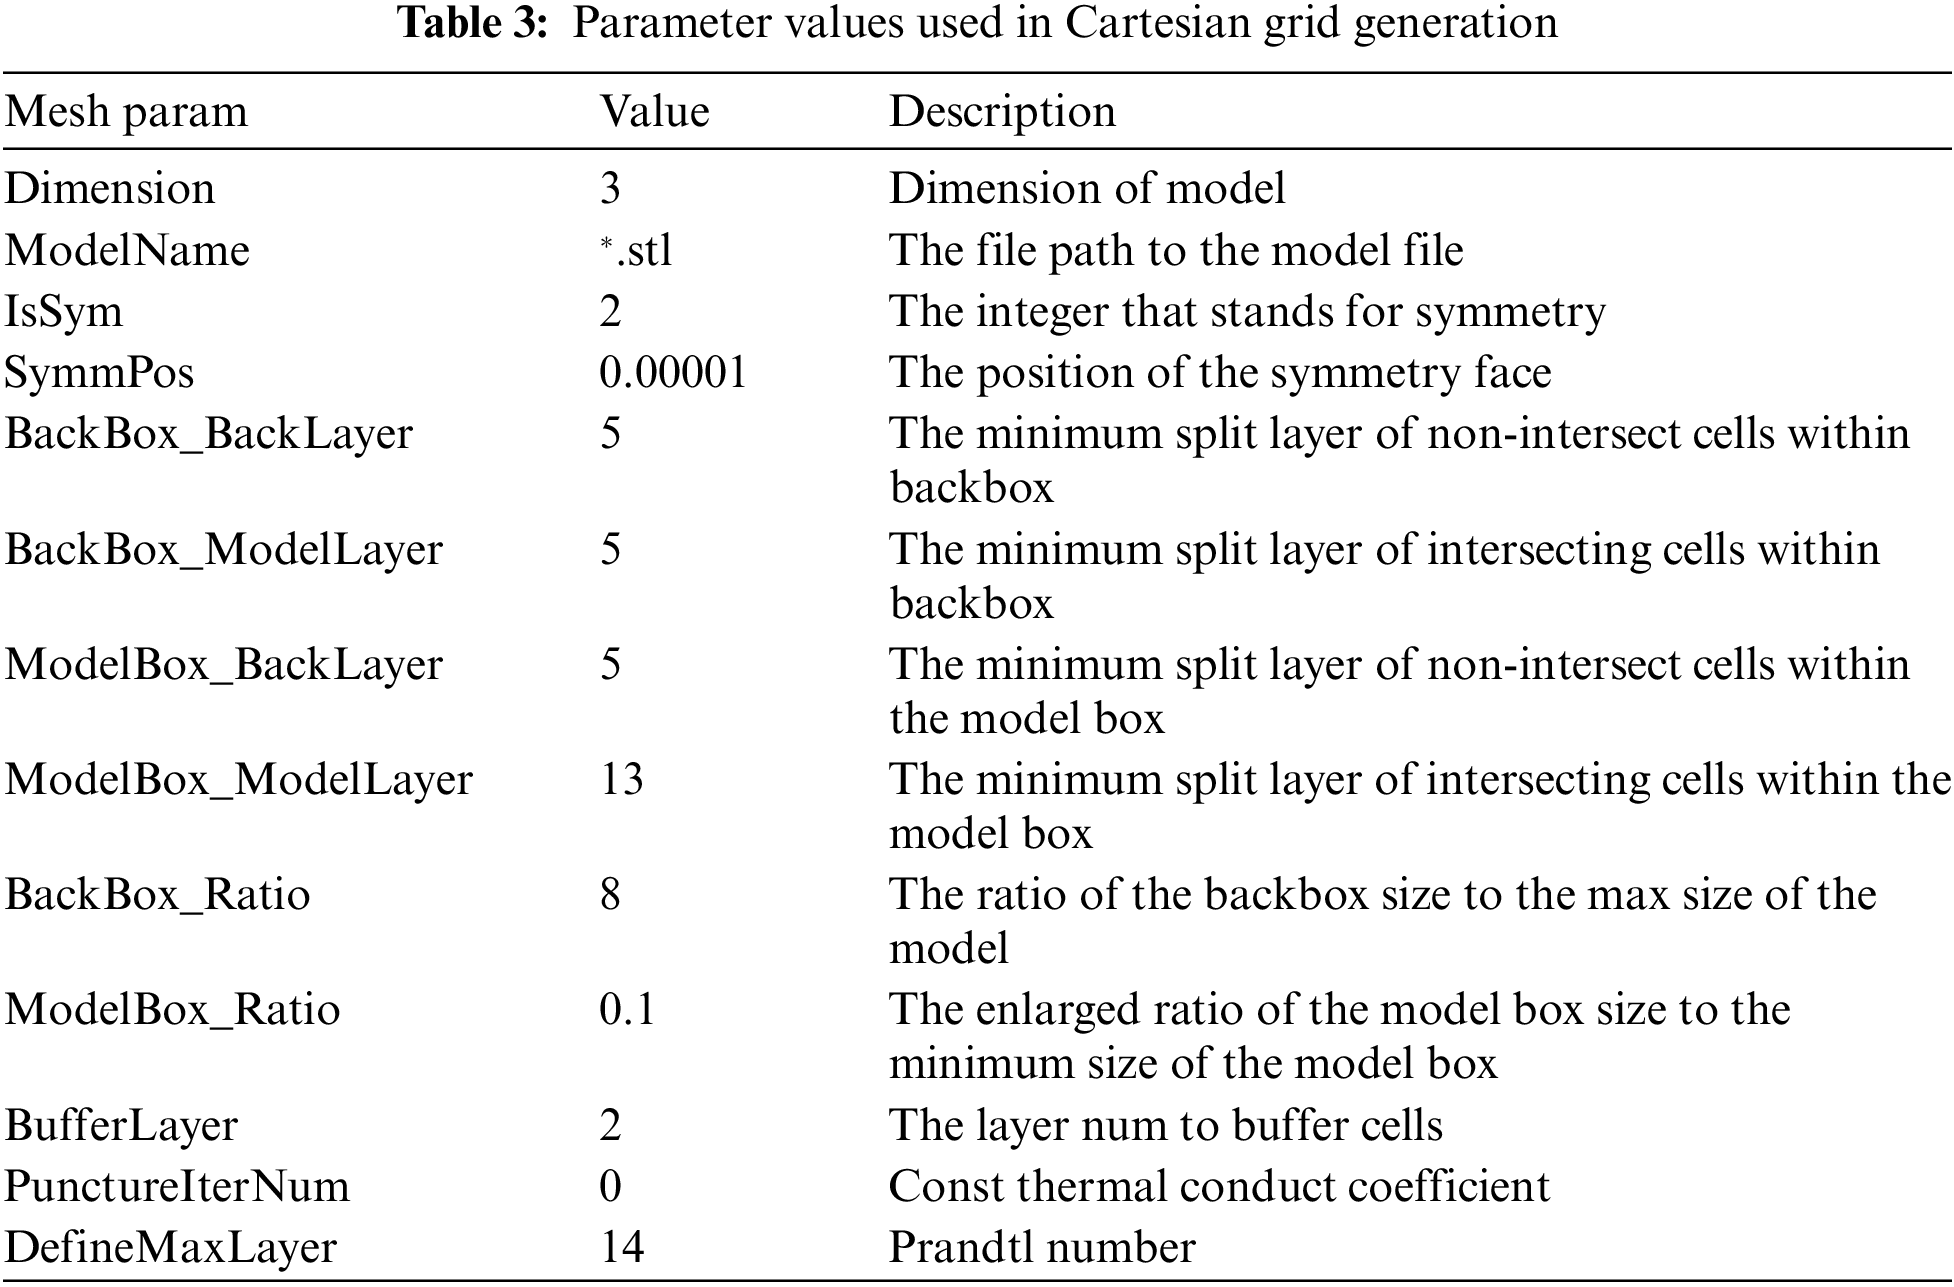
Cartesian grid generation: To set the parameters required for the Cartesian grid to be generated according to the CAD model data file generated in Section 3.2.
Firstly, setting the symmetry plane. The symmetry plane of the CAD model is
Flow field solution: The CFD flows field solution needs to specify the physical properties of the incoming flow, such as pressure, temperature and specific heat capacity, etc., as well as the Mach number and incoming direction, in which the angle of attack and side-slip angle is used to specify the incoming direction. In addition, the CFD flows field solution also needs to control the solution process. For example, too few iteration steps will affect the solution results. Other configuration contents are shown in Table 4.

Finally, the Euler model is used for the solution. After a successful solution, we saved the results in CGNS format. The solution process is shown in Fig. 5. The solution results include a pressure field, temperature field, velocity field, and so on.
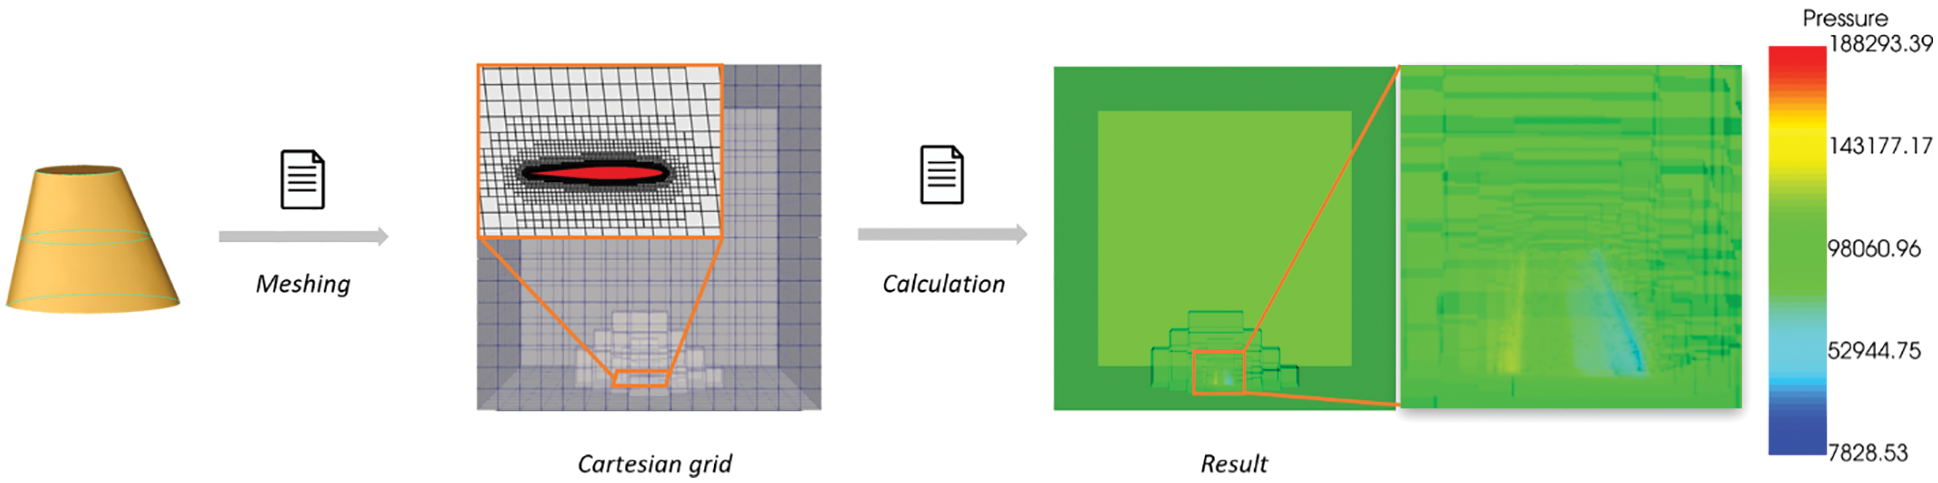
Figure 5: CFD flows field solution flow. To better show the internal solution effect of the flow field, we set the rendering transparency to 0.4
To assess the reasonableness of the generated models and their simulation solutions, it is unfortunately and not possible to measure all the models provided by AWSD and their simulation results in the form of an experimental comparison, as the generation in batches of CAD modeling for the airfoil shape is artificially defined. However, the airfoils included in the AWSD are based on the ONERA M6 Wing as a variant. The following will demonstrate the validity of the airfoil model in the form of a comparison of the CFD-solved simulation results and experimental values provided by the automated workflow that generates the AWSD. In the following, the pressure of the z/l = 0.2 wings section for the ONERA M6 wing is selected, and the experimental values are compared with the calculated simulation results (see Fig. 6).
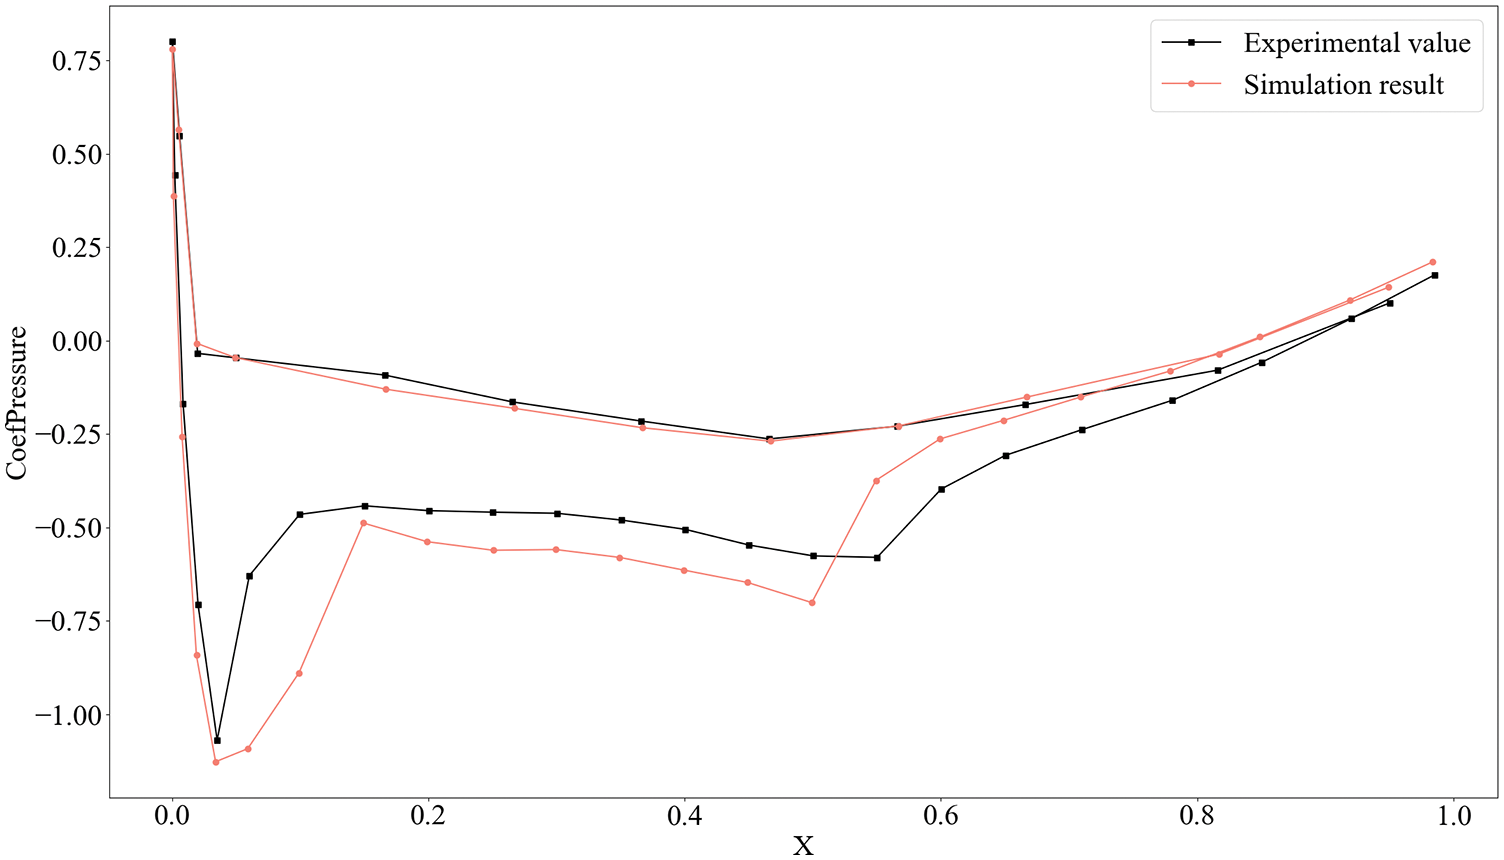
Figure 6: Comparison of simulation and experimental results of wing section pressure for ONERA M6 wing with z/l = 0.2
Parameterization of a 3D model is the process of mapping a 3D model to a 2D plane. In this section, we respectively used the ARAP (As-Rigid-As-Possible) algorithm [28] and harmonic mapping [29] to parameterize the resampling results of the convection field (see Section 4.1).
Firstly, File parsing. The resampling results include not only the topological relationship and geometric information of the model but also the attribute information. Secondly, the parameterized object is a mesh model without attribute information, so we extracted the topological relationship and geometric information of the model, and then parameterized the extracted results. Finally, we bound the attribute information on the parameterized grid result to finish the parameterization of flow field results (see Fig. 7).
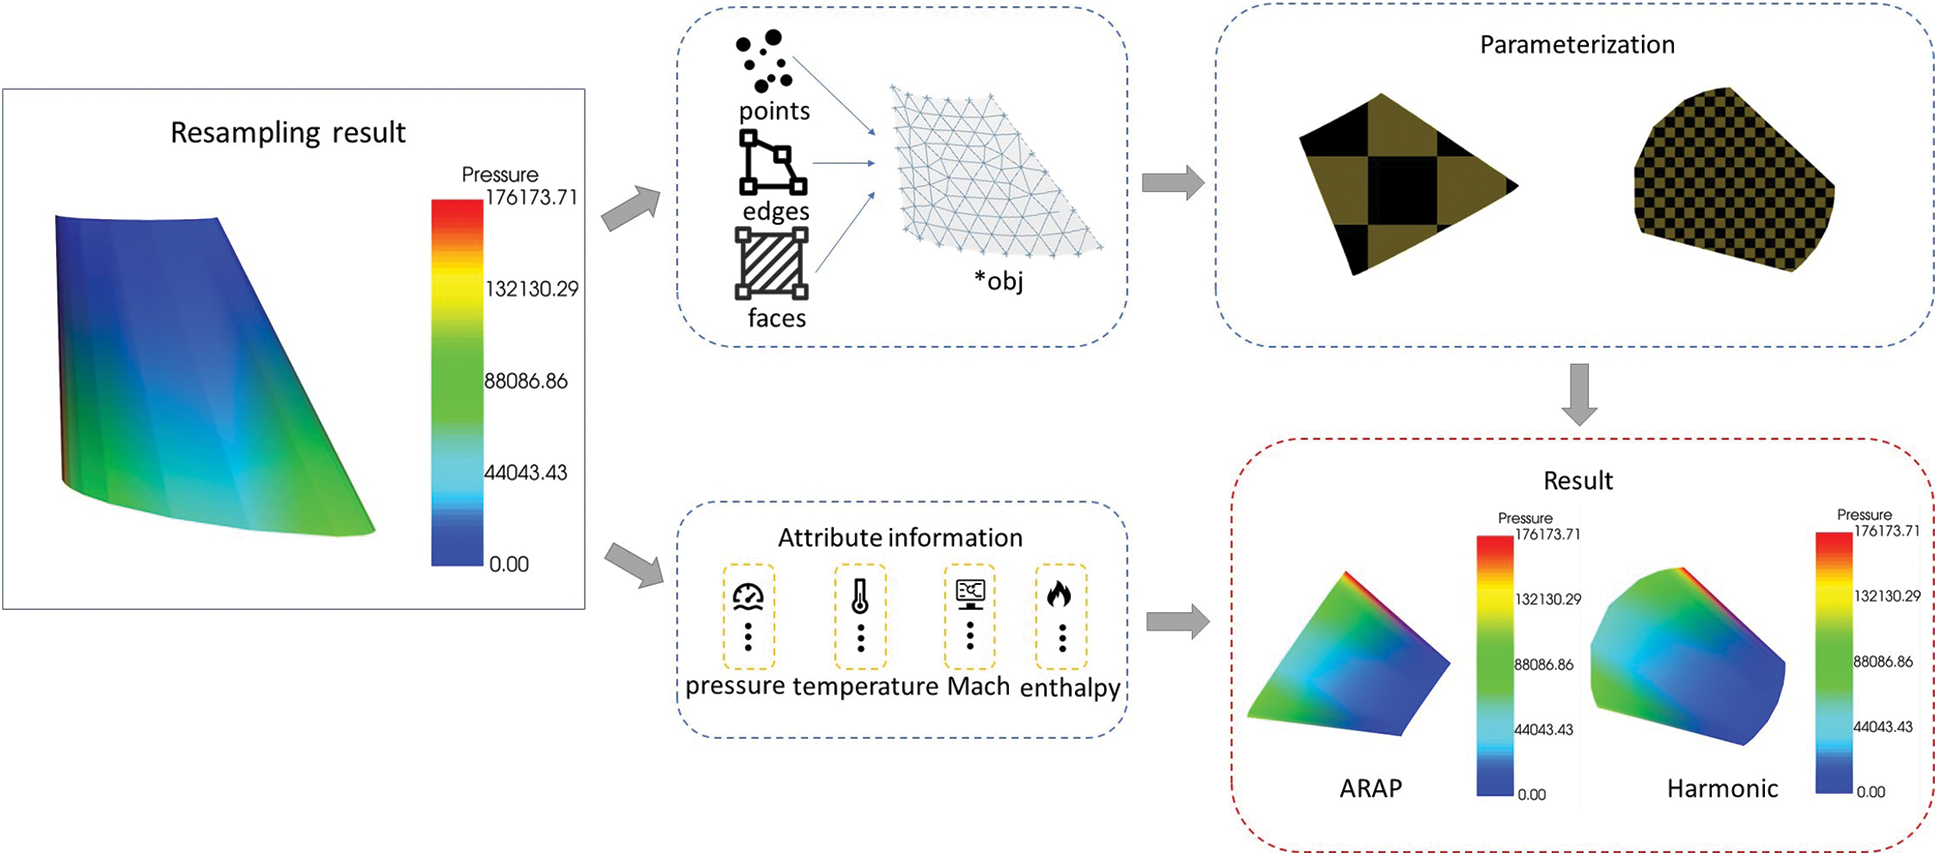
Figure 7: The parametric flow of resampling results. To re-sample the flow field data to the surface of the half model, extract the geometric and attribute information, parameterize, and finally bind the attribute information
3.5 Automatic Processing Pipeline
From the creation of the CAD model, the meshing of the model surface to the solution of CFD flows field, the whole process is automated batch processing, so researchers can quickly obtain data sets of different sizes according to research needs to solve the problem of insufficient data. At the same time, data analysts only need to complete business understanding, and the rest of the modeling and solving processes that need repeated iteration do not need to be carried out manually, which greatly shortens the time and cost of data set creation. Batch-generated models will also greatly reduce the model cost. In addition, batch generation of data with strong similarity is conducive to promoting the application of machine learning and neural network methods in geometric data processing. As the size of the data set can be tailored to the actual geometric processing task, the length of the data set generation time is influenced by the number of iterative steps of the CFD numerical solution. The more iterative steps to solve the problem, the longer it takes to generate the data set. As the size of the data set currently used in engineering and equipped with the model, mesh, and solution results are around 300, the AWSD is sized at 300 sets. The automatic workflow of data batch generation is shown in Fig. 8.
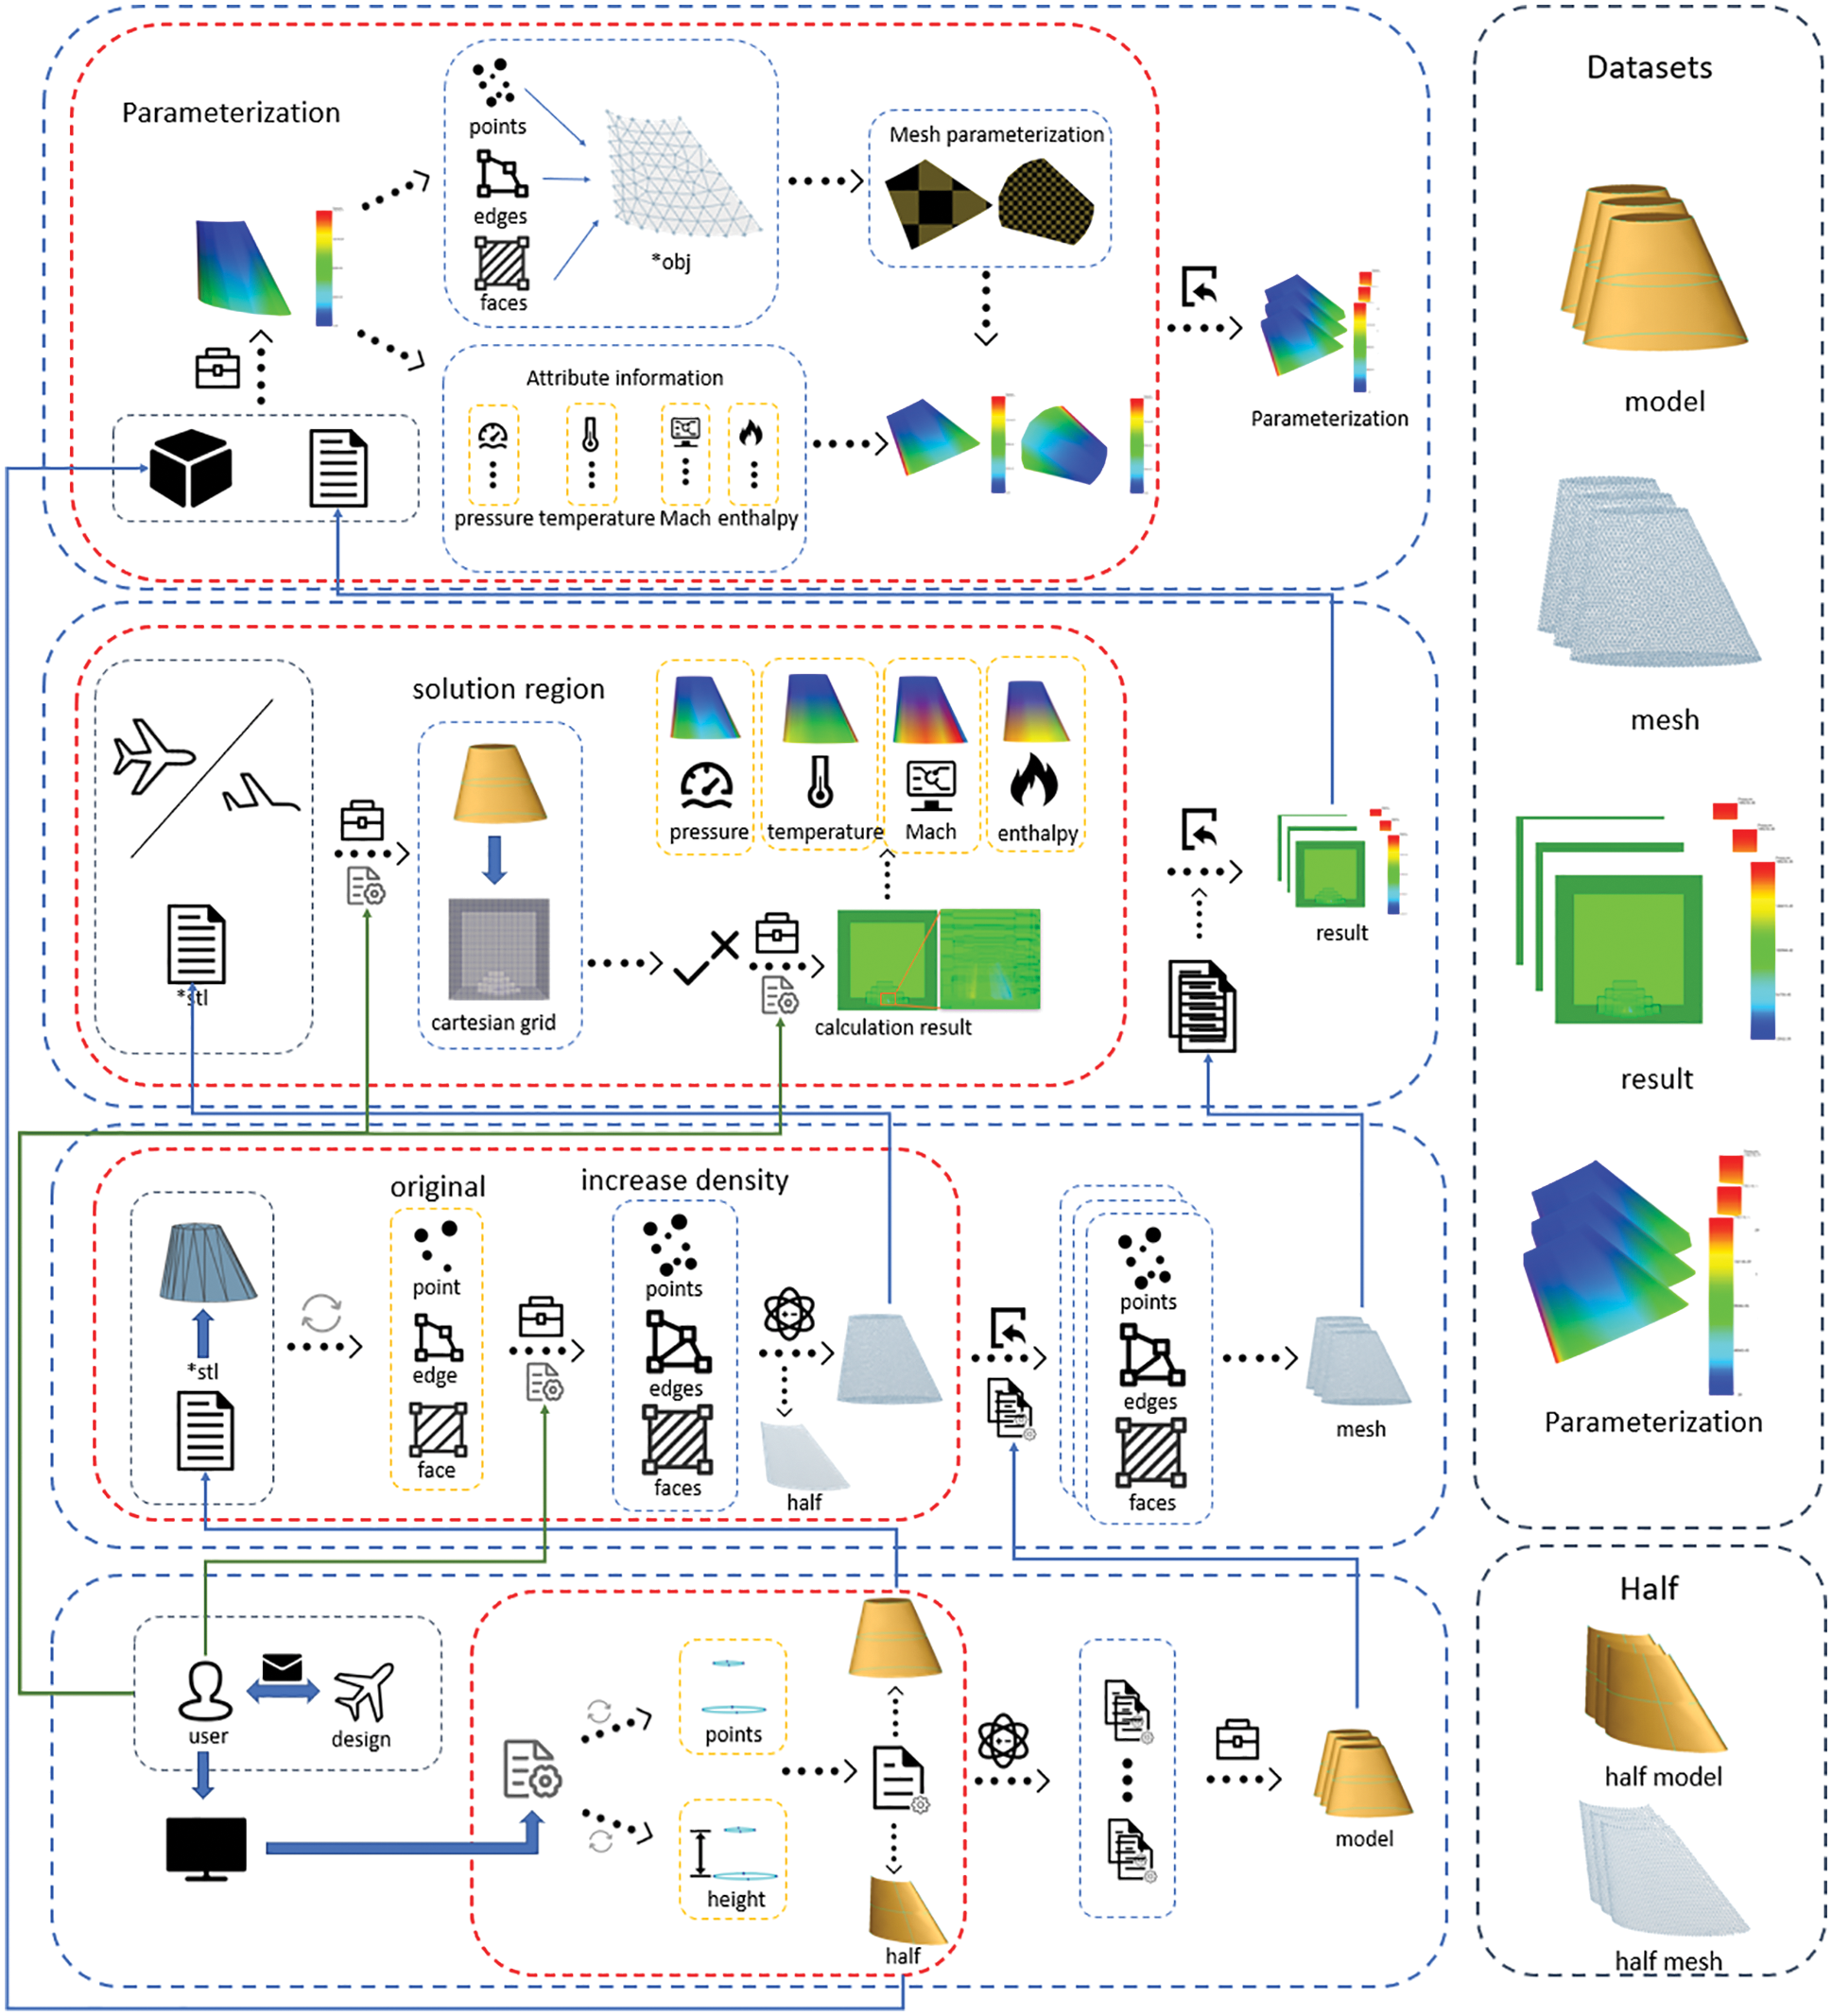
Figure 8: The automatic workflow of data batch generation. The data set provides CAD model files, triangular mesh data, flow field solution result files, and its resampling parameterization result for each model. In addition, the workflow also supports the output of half-model meshing results
To quantify the time taken to generate the data set, the example of the generated data set provided by AWSD. Ninety-nine percent of the time the data set generated by AWSD focuses on simulation solutions. Because the number of iteration steps of the simulation solution affects the solution effect and the generation time of the data set, we will provide the solution results of 100 to 500 equal interval iteration steps (see Table 5), as well as the generated time of modeling, meshing, simulation and parametric results of 300 sets of data in this paper (see Table 6).


This section describes the analysis and applications of the data set obtained in Section 3. The steps are as follows:
1) use resampling with data method to sample the solution results of the external flow field to the surface of the wing model.
2) cluster the pressure field, temperature field, Mach number, and enthalpy in the resampling results by using K-means, Mini-Batch K-means, and spectral clustering algorithm.
3) evaluate the clustering results.
Since the bounding box stored the results of the flow field solution data obtained in Section 3, the result of the mechanical structure surface of the model cannot be seen intuitively through rendering and display (see Fig. 9). To solve this problem, the data in contact between the bounding box and the model needs to be resampled to the model surface (see Fig. 10).
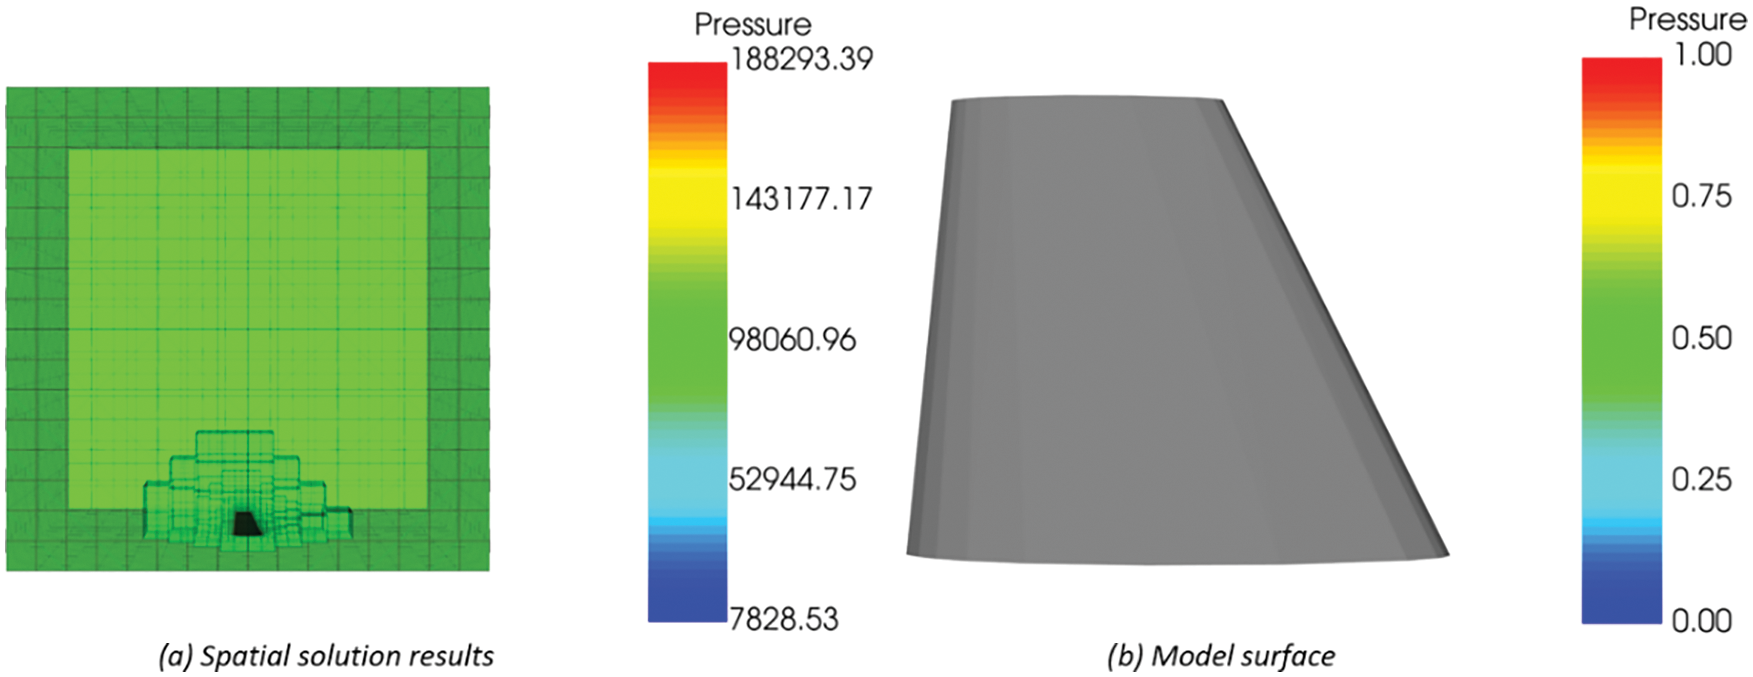
Figure 9: The storage location of flow field solution results. (a) The resulting data is in the space where the bounding box is located; (b) No results on the model surface
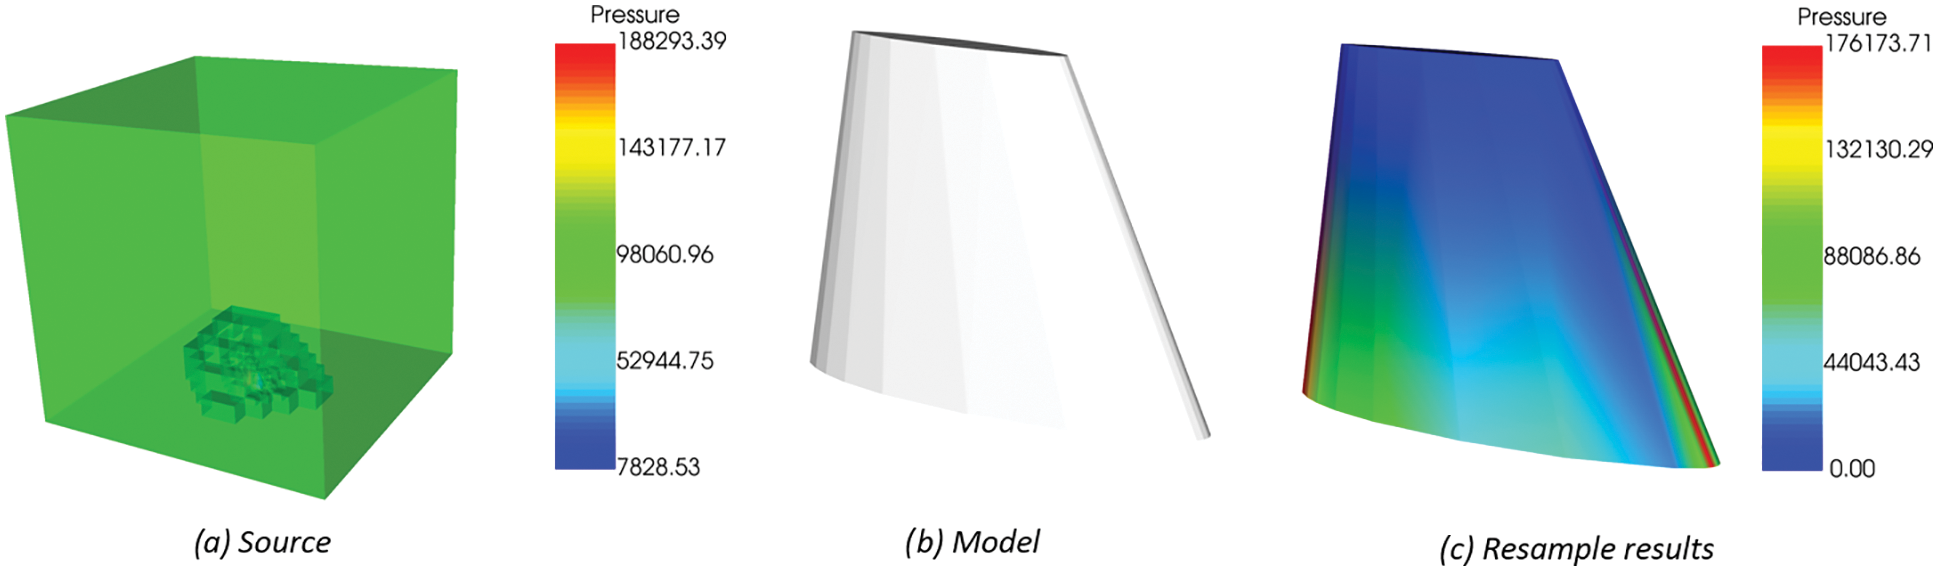
Figure 10: Resampling process of flow field solution results. (a) The data source provides resampling data (b) Model to be sampled (c) Resampling results of flow field solution results
Resampling steps are as follows:
Import file: Need to provide the flow field solution result (. CGNS) as source data and the mechanical structure file (. STL) of the model as re-sampled data.
Analysis file: Read the flow field solution results and model files using the reader extended by VTK. The data type of the flow field solution results is multiblock data. We used the filter to change the data type to PolyData used to represent the geometry including vertices, lines, polygons, and triangles for subsequent operations.
Resampling: Use the filter to sample the point and cell data of the flow field solution resulting in the data set to the point of the model file data set. The output has the same structure as the flow field solution result, and its point data contain the re-sampled values from the flow field solution results.
In recent years, a variety of new 3D mesh segmentation has emerged. As an important research direction of computer graphics, 3D mesh segmentation will promote the development of digital modeling, mesh deformation, mesh compression and other fields to a certain extent [30]. At present, these 3D mesh segmentations are mainly based on cluster analysis. Compared with the method based on region growth and hierarchical clustering, the method based on iterative clustering can transform the segmentation problem into a given segmentation number K, and search for the best segmentation region through iteration. In this section, we will segment the surface mesh of the resampling results in Section 4.1 based on K-means iterative clustering.
The steps of iterative clustering segmentation are as follows:
Input: a) Sample set
Output: Cluster partition
Step 1: Randomly select K objects from n sample objects as the initial cluster center iteration.
Step 2: K clusters are formed by assigning each sample to the nearest cluster center. Then recalculate the cluster centers.
Step 3: Repeat Step 2, until each cluster centers remain unchanged.
We did a K-means analysis of the pressure field, temperature field, Mach number, and enthalpy after resampling as samples, where
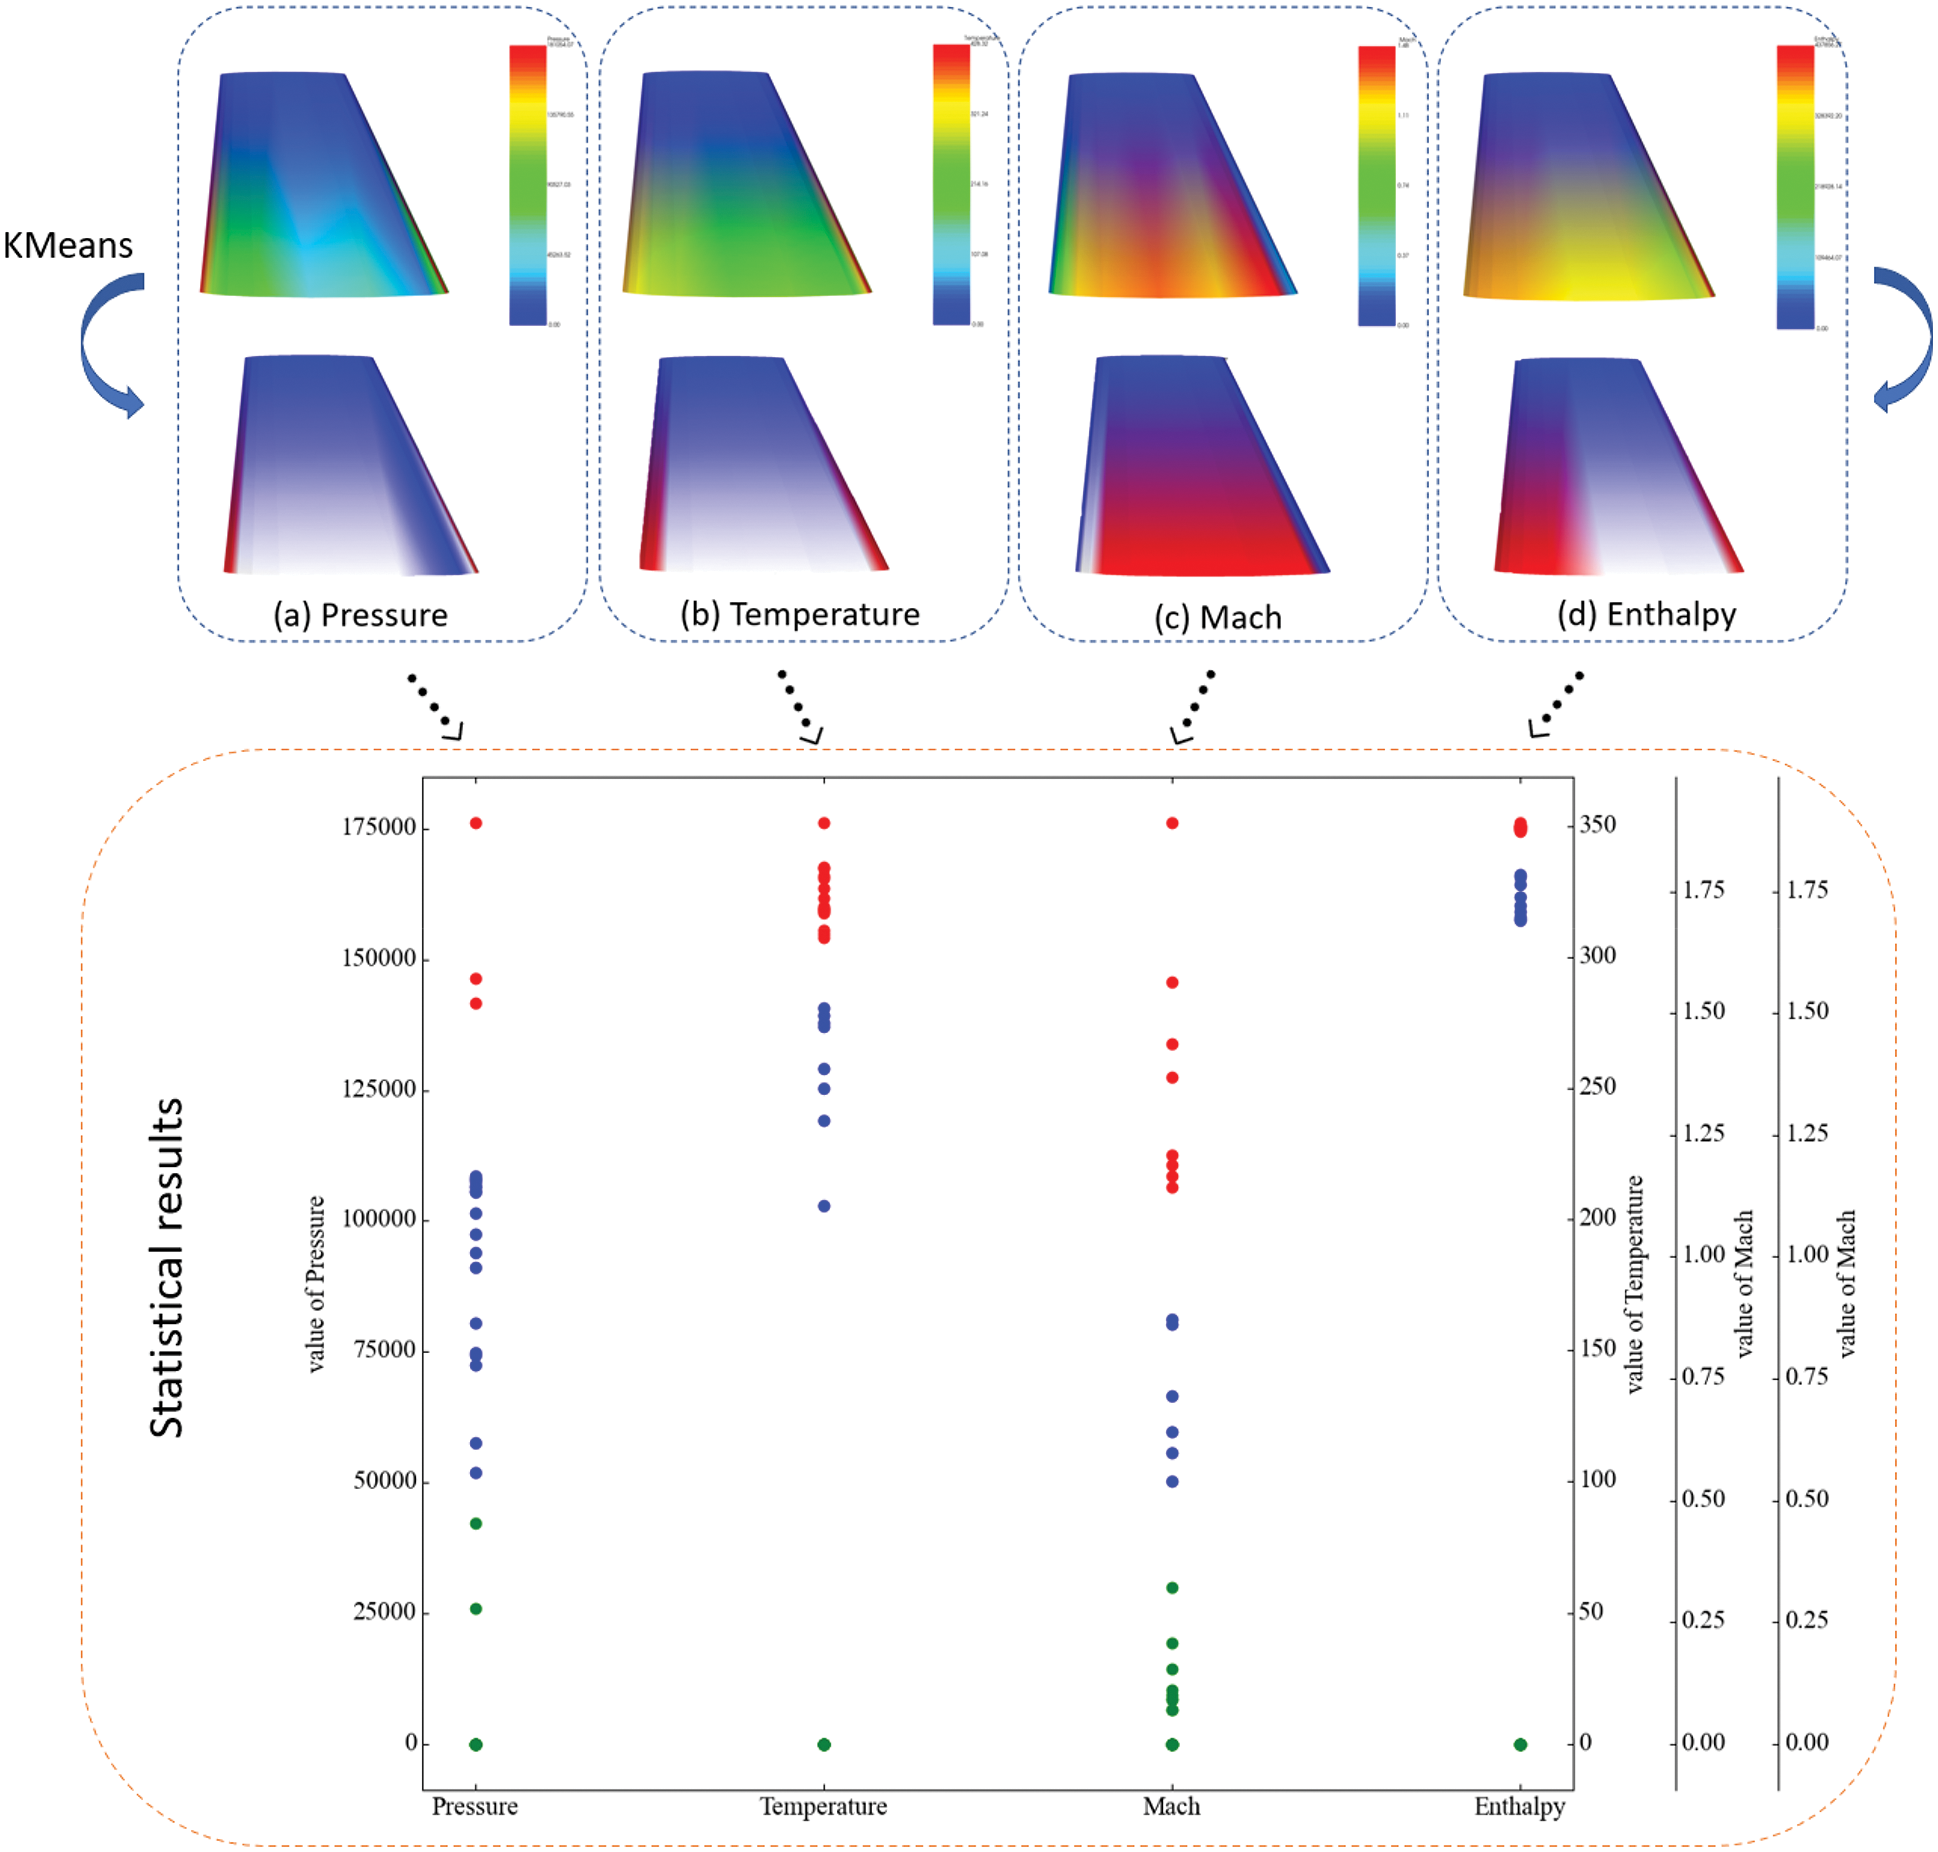
Figure 11: K-means clustering result statistics and results of 3D mesh segmentation
The experimental results show that the surface features of the re-sampled model can be roughly extracted after 3D mesh segmentation based on K-means. We make statistics on the pressure, temperature, Mach number, and enthalpy respectively, as shown in Fig. 12. The iterative results show that the similarity within clusters is high and the similarity between clusters is low. In addition, we also use Mini-Batch K-means [31] and spectral clustering [32] for surface grid clustering. It is found that the segmentation results of Mini-Batch K-means are consistent with those of the traditional K-means algorithm. The clustering results of spectral clustering are not good, but to sample data with strong continuity, such as Mach number, spectral clustering, and K-means clustering results are consistent.
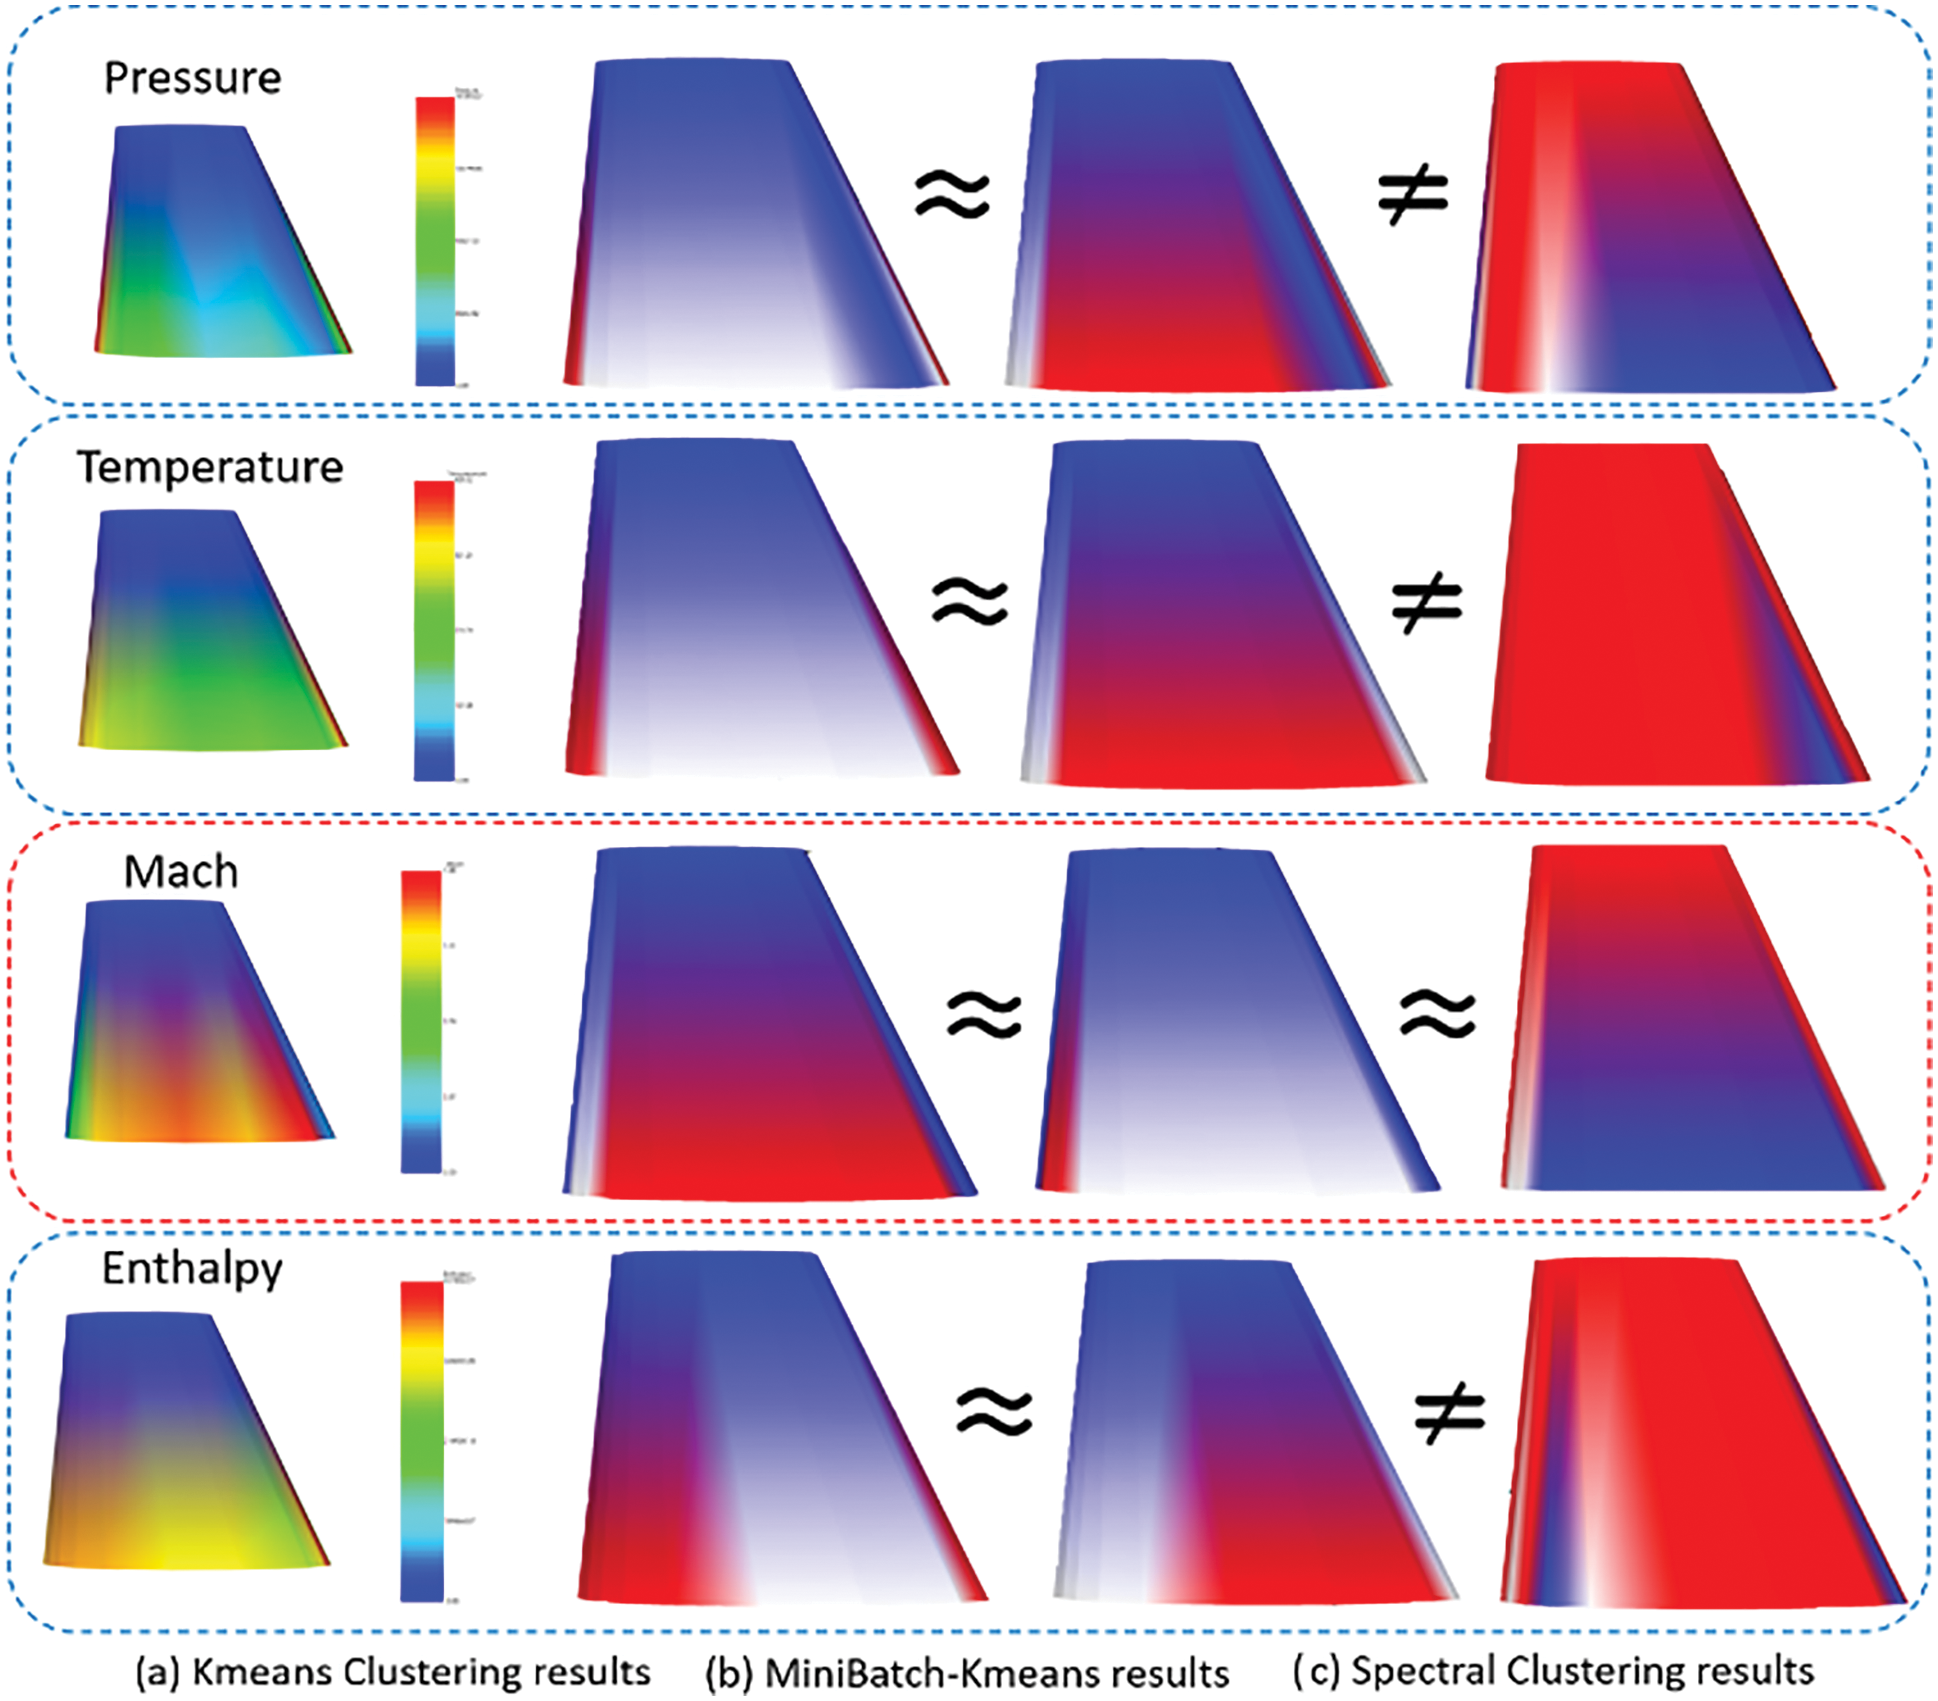
Figure 12: The statistics and 3D mesh segmentation results of K-means, spectral clustering, and Mini-Batch K-means clustering
The silhouette coefficient is the evaluation index of clustering performance, so we quantitatively analyze the silhouette coefficient obtained by the three clustering algorithms. The experimental results demonstrated that the silhouette coefficient of spectral clustering results in pressure, temperature, and enthalpy is low while the silhouette coefficient calculated based on Mach number shows good results. It is consistent with the above conclusions of manual observation, but it is not as high as the silhouette coefficient obtained by Mini-Batch K-means and K-means. Since the silhouette coefficient can help find the optimal number of clusters K, we choose K with a larger silhouette coefficient as the number of clusters. The cluster number in pressure should be 4, in temperature should be 1, in Mach number should be 3, and in enthalpy should be 2 (see Fig. 13).
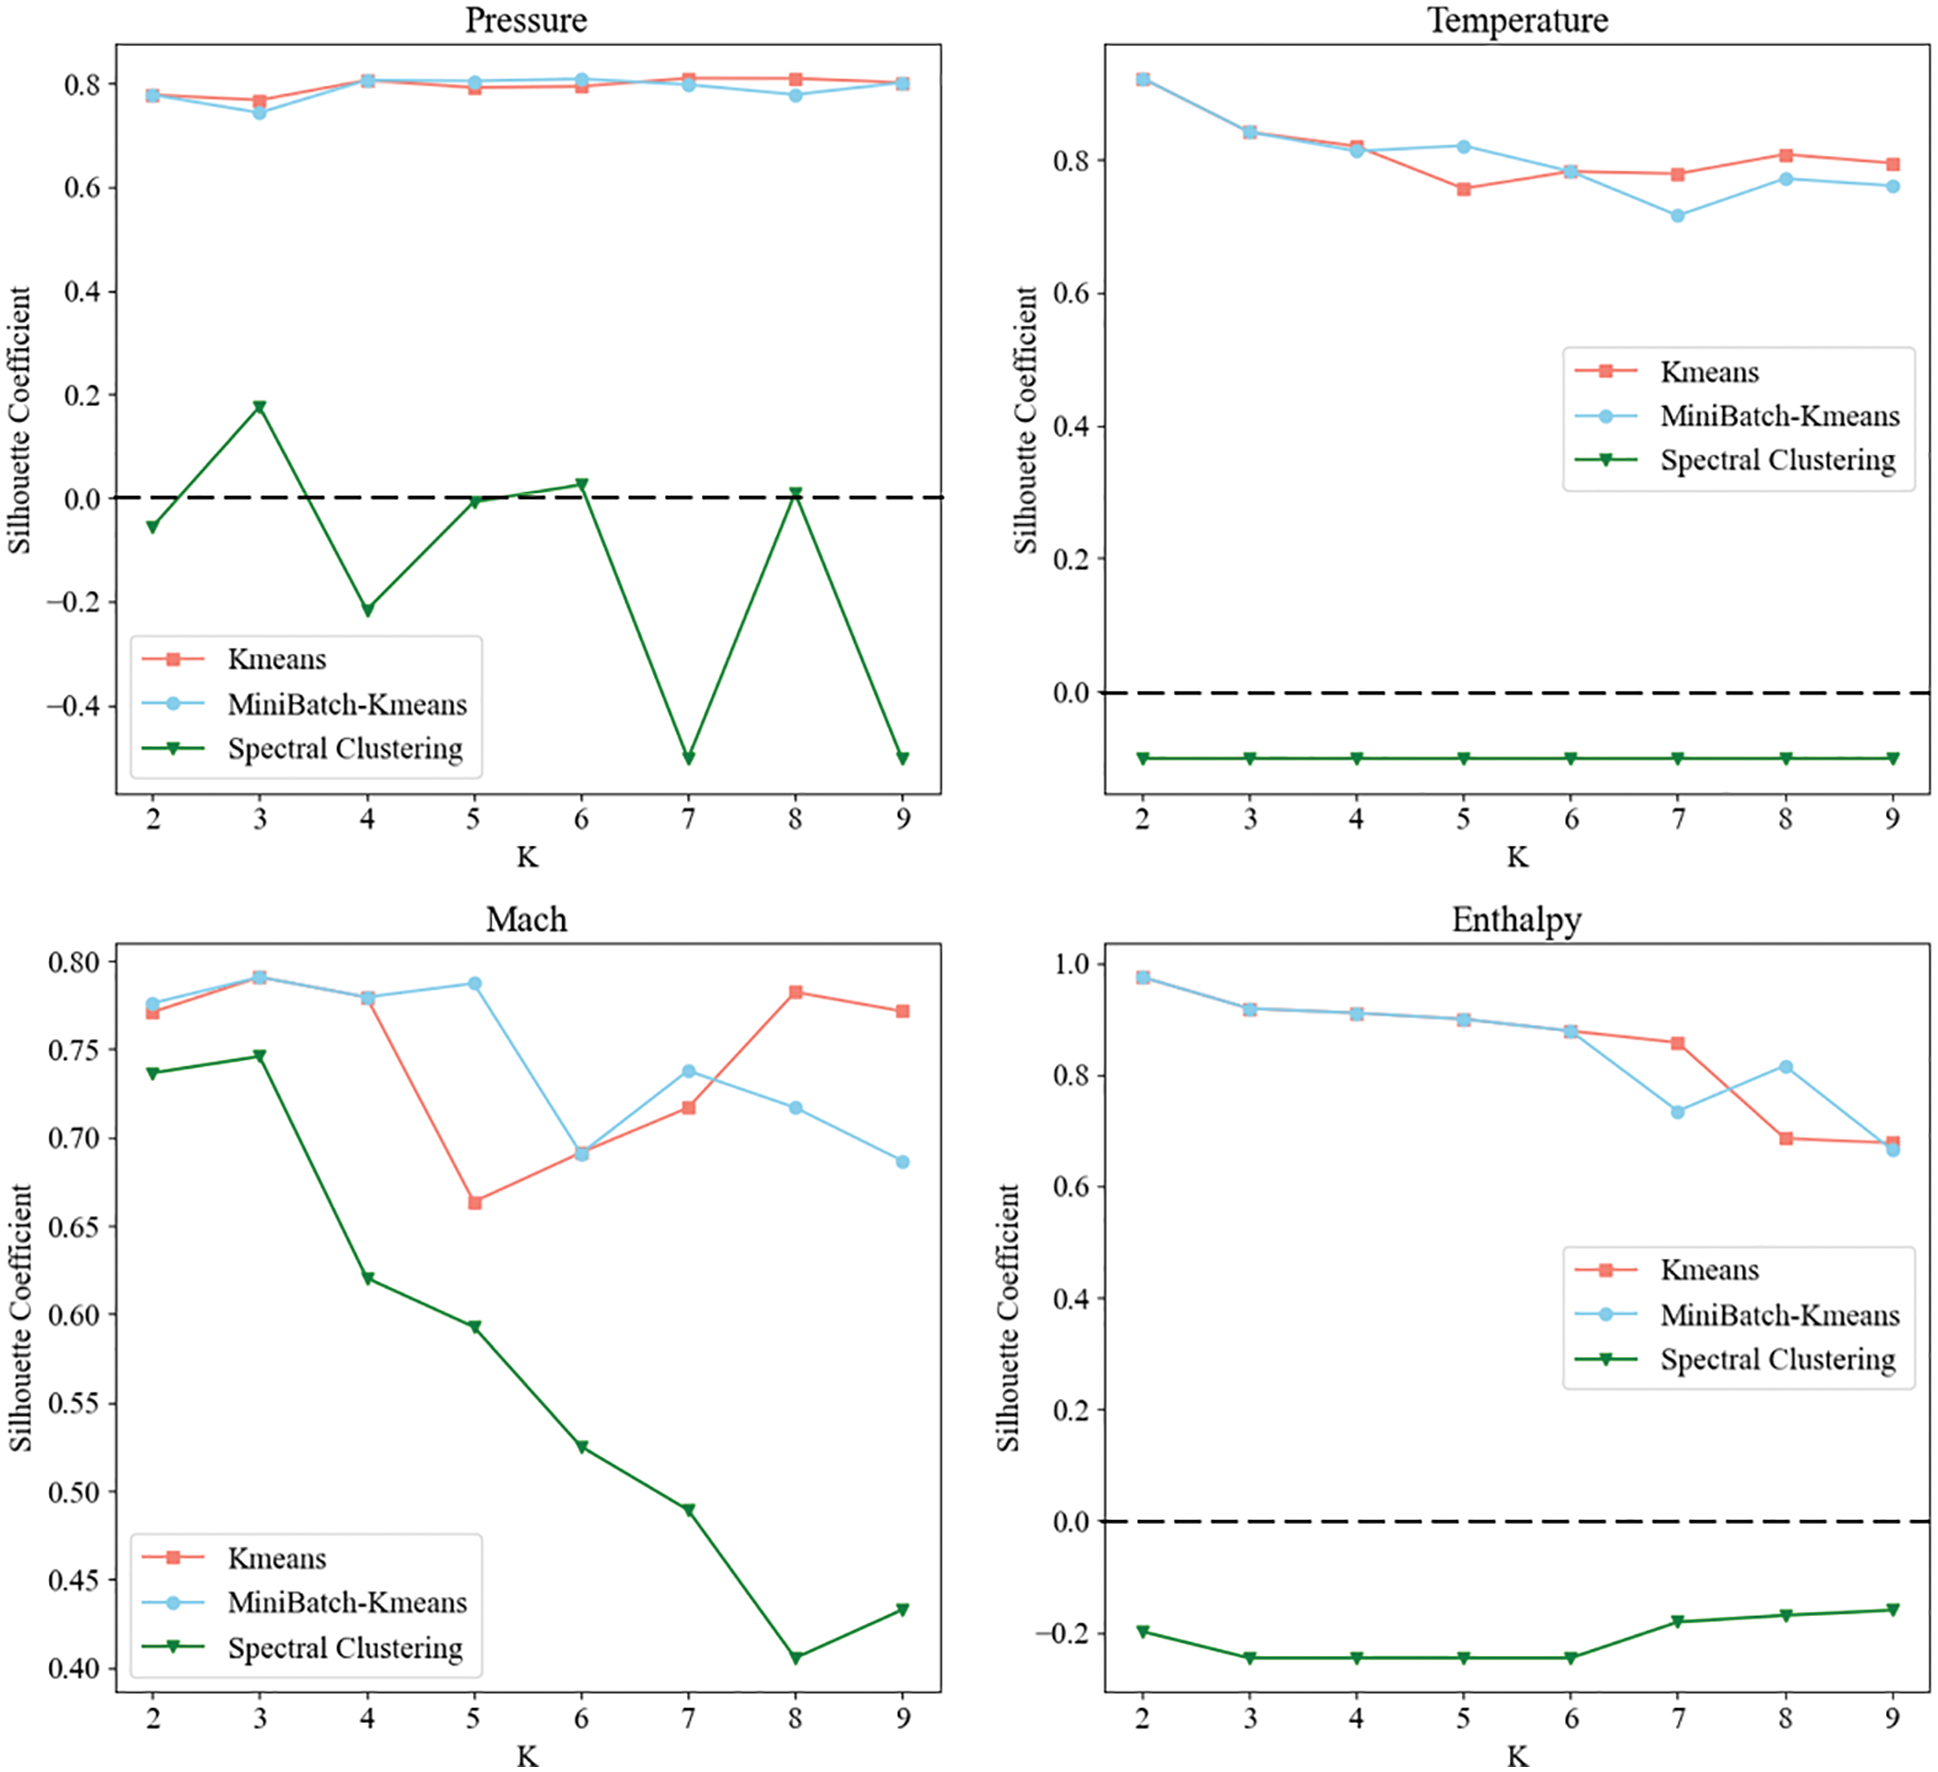
Figure 13: The Silhouette coefficient of K-means, spectral clustering, and Mini-Batch K-means clustering based on pressure, temperature, Mach number, and enthalpy
Aircraft wing data set (AWSD) is a new and custom-sized collection of engineering model, and simulations based on specific engineering requirements. Mesh data provided by AWSD can be applied to digital modeling, grid deformation, grid compression, and other fields and try to promote the development of data mining, 3D mesh segmentation, and data resampling. In addition, the simulation results contained in this data set have the same constraints and boundary conditions, so AWSD is also very suitable for applying to establish an engineering surrogate model. Since the data set is established automatically from the establishment of model data, the meshing of the model surface to the CFD flows field calculation, and its parameterization, users can define the scale of the data set. Compared with the comprehensive generation of shape data, the collection of shape data, and the design competition data, the data we provided includes a completed data set for a specific engineering application and no limitation on the scale of the data set.
Moreover, to solve the problem that the CFD flows field solution can not directly display the results on the model surface, we used the resampling with surface data to reflect the flow field solution results on the 3D model. On this basis, we explored the problem of 3D mesh segmentation and took K-means, Mini-Batch K-means, and spectral clustering analysis on the attribute information stored in the re-sampled 3D model, and segmented the 3D mesh based on the analysis results. The experiments show that the segmentation results of K-means and Mini-Batch K-means are the same, and spectral clustering has a good result on the segmentation of data with strong continuity.
Future work may include improving the diversity of batch generation models and boundary conditions of flow field solutions, to increase the number of surrogate models for numerical simulation of different engineering requirements. The data set will be used in the direction of proxy model-assisted evolutionary algorithms, which will be used to construct a proxy model of the aircraft wing shape, then combined with multi-objective optimization algorithms, to optimize the design of the aircraft wing shape and thus achieve improved performance targets. On the other hand, other future projects could include improving the accuracy of resampling to support the exploration of 3D mesh segmentation.
Funding Statement: This research is based upon work supported by Beijing Natural Science Foundation and Fengtai Rail Transit Frontier Research Joint Fund L191009, the National Natural Science Foundation of China (No. 61877002), and the Scientific Research Program of Beijing Municipal Education Commission KZ202110011017.
Availability of Data and Materials: For all data sets and all information, please visit https://github.com/suxiang09/AWSD-Dataset. It includes 300 sets of files including CAD model (.STL), meshing file (.STL), flow field solution (.CGNS), and parameterized results (.VTK), and provides the code of resampling and 3D surface mesh segmentation.
Conflicts of Interest: The authors declare that they have no conflicts of interest to report regarding the present study.
References
1. Whalen, E., Beyene, A., Mueller, C. (2021). SimJEB: Simulated Jet engine bracket dataset. Computer Graphics Forum, 40(5), 9–17. https://doi.org/10.1111/cgf.14353 [Google Scholar] [CrossRef]
2. Chang, A. X., Funkhouser, T., Guibas, L., Hanrahan, P., Huang, Q. et al. (2015). ShapeNet: An information-rich 3D model repository. Computer Science. arXiv:1512.03012. [Google Scholar]
3. Koch, S., Matveev, A., Jiang, Z. S., Williams, F., Artemov, A. et al. (2019). ABC: A big CAD model dataset for geometric deep learning. IEEE Conference on Computer Vision and Pattern Recognition, pp. 9593–9603. New York. [Google Scholar]
4. Wang, Y., Sun, Y. B., Liu, Z. W., Sarma, S. E., Bronstein, M. M. et al. (2019). Dynamic graph CNN for learning on point clouds. ACM Transactions on Graphics, 38(5), 146–158. https://doi.org/10.1145/3326362 [Google Scholar] [CrossRef]
5. Xie, Y. X., Tian, J. J., Zhu, X. X. (2020). Linking points with labels in 3D: A review of point cloud semantic segmentation. IEEE Geoscience and Remote Sensing Magazine, 8(4), 38–59. https://doi.org/10.1109/MGRS.6245518 [Google Scholar] [CrossRef]
6. Li, H. S., Zheng, Y. P., Wu, X. Q., Cai, Q. (2019). 3D model generation and reconstruction using conditional generative adversarial network. International Journal of Computational Intelligence Systems, 12(2), 697–705. https://doi.org/10.2991/ijcis.d.190617.001 [Google Scholar] [CrossRef]
7. Wang, Q., Kim, M. K. (2019). Applications of 3D point cloud data in the construction industry: A fifteen-year review from 2004 to 2018. Advanced Engineering Informatics, 39, 306–319. https://doi.org/10.1016/j.aei.2019.02.007 [Google Scholar] [CrossRef]
8. Javaheri, A., Brites, C., Pereira, F., Ascenso, J. (2021). Point cloud rendering after coding: Impacts on subjective and objective quality. IEEE Transactions on Multimedia, 23, 4049–4064. https://doi.org/10.1109/TMM.2020.3037481 [Google Scholar] [CrossRef]
9. Zhang, P. P., Wang, X., Ma, L., Wang, S. Q., Kwong, S. et al. (2021). Progressive point cloud upsampling via differentiable rendering. IEEE Transactions on Circuits and Systems for Video Technology, 31(12), 4673–4368. https://doi.org/10.1109/TCSVT.2021.3100134 [Google Scholar] [CrossRef]
10. Zeng, G., Li, H. S., Wang, X. C., Li, N. (2021). Point cloud up-sampling network with multi-level spatial local feature aggregation. Computers and Electrical Engineering, 94, 107337.https://doi.org/10.1016/j.compeleceng.2021.107337 [Google Scholar] [CrossRef]
11. Kot, T., Novak, P., Babjak, J. (2016). Visualization of point clouds built from 3D scanning in coal mines. Proceedings of the 2016 17th International Carpathian Control Conference, pp. 372–377. Tatranska Lomnica, Slovakia. [Google Scholar]
12. Guo, Y. L., Wang, H. Y., Hu, Q. Y., Liu, H., Liu, L. et al. (2021). Deep learning for 3D point clouds: A survey. IEEE Transactions on Pattern Analysis and Machine Intelligence, 43(12), 4338–4364. https://doi.org/10.1109/TPAMI.2020.3005434 [Google Scholar] [PubMed] [CrossRef]
13. Yu, Y. T., Guan, H. Y., Li, D. L., Jin, S. H., Chen, T. Y. et al. (2020). 3-D feature matching for point cloud object extraction. IEEE Geoscience and Remote Sensing Letters, 17(2), 322–326. https://doi.org/10.1109/LGRS.8859 [Google Scholar] [CrossRef]
14. Tong, G. F., Li, Y., Zhang, W. L., Chen, D., Zhang, Z. X. et al. (2019). Point set multi-level aggregation feature extraction based on multi-scale max pooling and LDA for point cloud classification. Remote Sensing, 11(23), 2846–2873. https://doi.org/10.3390/rs11232846 [Google Scholar] [CrossRef]
15. He, G. Z., Yang, J., Behnke, S. (2018). Research on geometric features and point cloud properties for tree skeleton extraction. Personal and Ubiquitous Computing, 22(5–6), 903–910. https://doi.org/10.1007/s00779-018-1153-2 [Google Scholar] [CrossRef]
16. Li, L., Hasegawa, K., Nii, I., Tanaka, S. (2019). Fused transparent visualization of point cloud data and background photographic image for tangible cultural heritage assets. International Journal of GeoInformation, 8(8), 343–357. https://doi.org/10.3390/ijgi8080343 [Google Scholar] [CrossRef]
17. Virtanen, J. P., Daniel, S., Turppa, T., Zhu, L. L., Julin, A. et al. (2020). Interactive dense point clouds in a game engine. ISPRS Journal of Photogrammetry and Remote Sensing, 163, 375–389. https://doi.org/10.1016/j.isprsjprs.2020.03.007 [Google Scholar] [CrossRef]
18. Eckart, B., Kim, K., Troccoli, A., Kelly, A., Kautz, J. (2016). Accelerated generative models for 3D point cloud data. IEEE Conference on Computer Vision and Pattern Recognition, pp. 5497–5505. Seattle, WA. [Google Scholar]
19. Hackel, T., Wegner, J. D., Schindler, K. (2016). Contour detection in unstructured 3D point clouds. IEEE Conference on Computer Vision and Pattern Recognition, pp. 1610–1618. Seattle, WA. [Google Scholar]
20. Chen, S. H., Tian, D., Feng, C., Vetro, A., Kovacevic, J. (2018). Fast resampling of three-dimensional point clouds via graphs. IEEE Transactions on Signal Processing, 66(3), 666–681. https://doi.org/10.1109/TSP.2017.2771730 [Google Scholar] [CrossRef]
21. Deng, Q. W., Zhang, S. Y., Ding, Z. (2022). An efficient hypergraph approach to robust point cloud resampling. IEEE Transactions on Image Processing, 31, 1924–1937. https://doi.org/10.1109/TIP.2022.3149225 [Google Scholar] [PubMed] [CrossRef]
22. Ahmed, M., Seraj, R., Islam, S. M. S. (2020). The k-means algorithm: A comprehensive survey and performance evaluation. Electronics, 9(8), 1295–1307. [Google Scholar]
23. Wang, J. C., Gu, R. J. (2010). An extended fuzzy k-means algorithm for clustering categorical valued data. 2010 International Conference on Artificial Intelligence and Computational Intelligence, pp. 504–507. Sanya, China. [Google Scholar]
24. Yu, H., Wen, G. Q., Gan, J. Z., Zheng, W. (2020). Self-paced learning for K-means clustering algorithm. Pattern Recognition Letters, 132, 69–75. https://doi.org/10.1016/j.patrec.2018.08.028 [Google Scholar] [CrossRef]
25. Li, H. F., Zhang, Y. J., Hai, M. (2019). Categorize the power grid projects with SOM method. 7th International Conference on Information Technology and Quantitative Management (ITQM)-Information Technology and Quantitative Management Based on Artificial Intelligence, pp. 475–479. Granada, Spain. [Google Scholar]
26. Keitsch, K. A., Bruckner, T. (2015). Influence of demand response tariffs on the electrical load of households. IEEE Electrical Power and Energy Conference, pp. 215–219. Ontario, Canada. [Google Scholar]
27. AbdelMigid, T. A., Saqr, K. M., Kotb, M. A., Aboelfarag, A. A.(2017). Revisiting the lid-driven cavity flow problem: Review and new steady state benchmarking results using GPU accelerated code. Alexandria Engineering Journal, 56(1), 123–135. [Google Scholar]
28. Sorkine, O., Alexa, M. (2007). As-rigid-as-possible surface modeling. Symposium on Geometry Processing, pp. 109–116. Barcelona, Spain. https://doi.org/10.2312/SGP/SGP07/109-116 [Google Scholar] [CrossRef]
29. Stepanov, S., Tsyganok, I. (2017). Vanishing theorems for harmonic mappings into non-negatively curved manifolds and their applications. Manuscripta Mathematica, 154(1–2), 79–90. [Google Scholar]
30. Mejia, D., Ruiz-Salguero, O., Sanchez, J. R., Posada, J., Moreno, A. et al. (2018). Hybrid geometry/topology based mesh segmentation for reverse engineering. Computers & Graphics, 73, 47–58. https://doi.org/10.1016/j.cag.2018.03.004 [Google Scholar] [CrossRef]
31. Peng, K., Leung, V. C. M., Huang, Q. J. (2018). Clustering approach based on mini batch kmeans for intrusion detection system over Big data. IEEE Access, 6, 11897–11906. https://doi.org/10.1109/ACCESS.2018.2810267 [Google Scholar] [CrossRef]
32. Nascimento, M. C. V., de Carvalho, A. C. P. L. F. (2011). Spectral methods for graph clustering–A survey. European Journal of Operational Research, 211(2), 221–231. https://doi.org/10.1016/j.ejor.2010.08.012 [Google Scholar] [CrossRef]
Cite This Article
 Copyright © 2023 The Author(s). Published by Tech Science Press.
This work is licensed under a Creative Commons Attribution 4.0 International License , which permits unrestricted use, distribution, and reproduction in any medium, provided the original work is properly cited.
 Downloads
 Citation Tools