
 Submit a Paper
 Propose a Special lssue
 Open Access
ARTICLE

Improvement of Binocular Reconstruction Algorithm for Measuring 3D Pavement Texture Using a Single Laser Line Scanning Constraint
1 Hubei Key Laboratory of Power System Design and Test for Electrical Vehicle, Hubei University of Arts and Science, Xiangyang, 441053, China
2 School of Civil Engineering and Architecture, Hubei University of Arts and Science, Xiangyang, 441053, China
3 Enterprise Technical Center, Xiangyang Road & Bridge Construction Group Co., Ltd., Xiangyang, 441023, China
* Corresponding Author: Yuanyuan Wang. Email:
(This article belongs to the Special Issue: Advanced Computational Models for Decision-Making of Complex Systems in Engineering)
Computer Modeling in Engineering & Sciences 2023, 136(2), 1951-1972. https://doi.org/10.32604/cmes.2023.026112
Received 17 August 2022; Accepted 12 October 2022; Issue published 06 February 2023
 View Full Text
 Download PDF
Abstract
The dense and accurate measurement of 3D texture is helpful in evaluating the pavement function. To form dense mandatory constraints and improve matching accuracy, the traditional binocular reconstruction technology was improved threefold. First, a single moving laser line was introduced to carry out global scanning constraints on the target, which would well overcome the difficulty of installing and recognizing excessive laser lines. Second, four kinds of improved algorithms, namely, disparity replacement, superposition synthesis, subregion segmentation, and subregion segmentation centroid enhancement, were established based on different constraint mechanism. Last, the improved binocular reconstruction test device was developed to realize the dual functions of 3D texture measurement and precision self-evaluation. Results show that compared with traditional algorithms, the introduction of a single laser line scanning constraint is helpful in improving the measurement's accuracy. Among various improved algorithms, the improvement effect of the subregion segmentation centroid enhancement method is the best. It has a good effect on both overall measurement and single point measurement, which can be considered to be used in pavement function evaluation.Keywords
As an intuitive external natural attribute, the 3D pavement texture is closely related to driving comfort, tire-road noise, and skid resistance. Poor driving comfort and noise pollution have a serious effect on public health, resulting in insomnia, learning disabilities, emotional irritability, and hypertension [1,2]. Skid resistance is one of the most important factors in driving safety, especially under wet or ice conditions [3,4]. A statistically significant correlation has been observed between skid resistance and pavement crash rates, and average reduction of wet-pavement crash rates can reach 68% by improving the skid resistance [5]. The statistical results of national road traffic accidents show that a total of 248,000 traffic accidents occurred in 2019, resulting in 63,000 deaths and a direct property loss of 134 million Yuan [6]. In general, texture and friction coefficient are the two most commonly used methods to evaluate pavement skid resistance. A large number of studies have shown that pavement skid resistance is closely related to the texture characteristics [7,8]. Moreover, the friction coefficient measured by skid resistant test is easy to be affected by the dry or wet road conditions and the test speed, which leads to the problems such as strong restrictive conditions and hard to control in the field. Therefore, in view of the close relationship between 3D texture and road function, research on the accurate measurement of 3D pavement texture can enrich the research scope of road function and reduce the impact of the road function on public health and driving safety.
According to the undulation degree of road surface, pavement texture could be divided into four categories: unevenness, mega texture, macro texture, and micro texture [7,9]. Among them, the structure size of unevenness and mega texture is larger, and the vertical size is larger than 20 mm, so the requirements for both measurement accuracy and resolution are relatively low. Using only common equipment such as total station, laser profilometer, and ultrasonic detector could meet the measurement needs. However, the structure size of macro texture and micro texture is small. Specifically, the vertical size of micro texture is less than 0.5 mm, which requires very high measurement accuracy. Both macro texture and micro texture have an important effect on pavement function. Macro texture not only affects the vibration and acoustic characteristics of tire-road [10,11], but also directly determines the retardation component of tire due to elastic deformation lag, which can remove the water between contact surfaces, increase the real contact area, and improve the skid resistance in rainy days [12,13]. Micro texture can increase the occlusion degree between tire and pavement, which is the main cause of friction at low speeds [14].
At present, the practical methods used to detect pavement texture mainly include sand patch and circular track texture meter [15]. Due to the limitation of measurement accuracy, the above two methods are mainly used for the measurement of macro texture, which are difficult to reach the scale level of micro texture. But for the measurement of micro texture, pendulum friction coefficient method and surface profiler method are commonly used [16,17]. The sand patch method and the pendulum friction coefficient method are greatly affected by human factors, resulting in poor repeatability and low measurement accuracy. Although the surface profiler method has high precision and good reproducibility, it is a two-dimensional linear measurement, so it is difficult to obtain high-resolution 3D measurement results. Thus, developing a high-resolution and high-precision 3D pavement texture detection method is needed to realize the synchronous 3D measurement of macro texture and micro-texture.
With the development of modern measurement technology, non-contact measurement methods, especially computer vision technology based on digital image processing, have attracted much attention due to the advantages of digitization and non-contact. The commonly used computer vision technology mainly includes photogrammetry, structured light measurement, photometric stereo reconstruction, and binocular reconstruction [18–21]. In contrast, binocular reconstruction has the advantages of simple operation, low cost and strong anti-light interference ability, and has been widely used in building materials. Binocular reconstruction aims to calculate the disparity of the same name pixels between the left and right images, according to the rigorous geometric relationship to complete the calculation of 3D texture. The biggest limitation of binocular reconstruction is the accurate matching of the same name pixels, especially for objects with weak textures or fewer feature points, such as asphalt pavement. Due to the influence of matching accuracy, the measurement results of the traditional binocular reconstruction technology were only limited to the macro texture.
Gendy et al. [22] applied binocular reconstruction to measure concrete pavement texture. Due to the influence of matching accuracy, the measurement results were only limited to the macro texture under the premise of a global statistical average, while the results were not ideal for local single point measurement or micro texture.
Dunford et al. [23] measured 3D characterization of surface texture for road stones undergoing simulated traffic wear. The surface was finally successfully characterized at each stage using the measured texture data.
Moreover, binocular reconstruction was also used for crack observation of concrete bridges. Compared with monocular measurement, binocular reconstruction is more robust that has less influence on the change of shooting angle [24].
In order to improve the matching effect, several fixed laser lines were introduced into traditional binocular reconstruction technology to form forced matching by Liu et al. [25]. The results showed that the addition of laser lines improved the measurement accuracy of the whole and single point. However, excessive laser lines not only brought difficulties to the installation of laser emitters, but also affected the recognition and matching effect of laser lines.
In summary, introducing fixed laser lines can improve the measurement effect to a certain extent, but the number of laser lines has become the key problem. Therefore, in this study, a single moving laser line was used to improve the traditional binocular reconstruction. And the improved binocular reconstruction test device was also developed. Furthermore, four kinds of improved algorithms were established based on different constraint mechanism. The main contributions of this study are as follows: first, by introducing the constraint of laser line, the feature points are artificially constructed to narrow the matching range and improve the matching accuracy; second, only one moving laser line is used to carry out global scanning constraints, which not only construct the dense surface constraints but also overcome the difficulty of installing and recognizing excessive laser lines; third, the dual functions of 3D texture measurement and precision self-evaluation are realized through developing the measuring device.
2 Proposed Improved Binocular Reconstruction Algorithms
Traditional binocular reconstruction mainly includes four operation steps: camera calibration, stereo image correction, stereo matching, and 3D reconstruction [26]. The improved algorithms are based on the traditional algorithm to add a single moving laser line to form global scanning constraint. Then, video image shooting, frame by frame reading of left and right images, laser line recognition, stereo matching, and other operations are carried out to form forced matching and improve matching accuracy. The basic flow of different improved algorithms is shown in Fig. 1. The processing flow of improved algorithms is roughly the same as that of traditional binocular reconstruction, but the essential differences exist in the step of stereo matching. In the traditional binocular reconstruction, stereo matching cost is calculated according to the characteristic statistics of image gray information. However, the improved algorithms introduce a single moving laser line and discuss the matching effect under different constraint mechanisms. Aimed at the global scanning constraints, this study proposes four improved stereo matching algorithms: disparity replacement, superposition synthesis, subregion segmentation, and subregion segmentation centroid enhancement.

Figure 1: Flow chart of improved algorithms
In the disparity replacement method, initial stereo matching is first performed on the first frame of video image according to the traditional algorithm, and the original disparity matrix of the whole test area is solved. Then, the video image is read frame by frame, and the laser line in each corrected image is extracted based on color difference. According to the extracted laser line, the pixel coordinates of the laser line constraint in the left and right images are calculated, and the constraint disparity of each laser line is calculated according to the pixel coordinates (Eq. (1)). Furthermore, the disparity value in the original disparity matrix is replaced by the constraint disparity frame by frame. Finally, a new disparity matrix modified by a single laser line scanning constraint is produced according to Eq. (2), and then the improved stereo matching algorithm based on disparity replacement is completed. The matching process of this algorithm is shown in Fig. 2. The advantage of disparity replacement method is that it is simple to operate and can ensure the accurate matching at all constraint positions. But in practice, it is difficult to achieve accurate matching at pixel level on the whole measurement surface.
where dc(i, j) is the constraint disparity at pixel coordinate (i, j); Xl is the abscissa of the left image at pixel coordinate (i, j), Xl = i; Xr is the abscissa of the same name pixel about the pixel (i, j) in the left image; DF is the final disparity matrix; DI is the initial disparity matrix; M(i, j) is the binary expression of laser line.
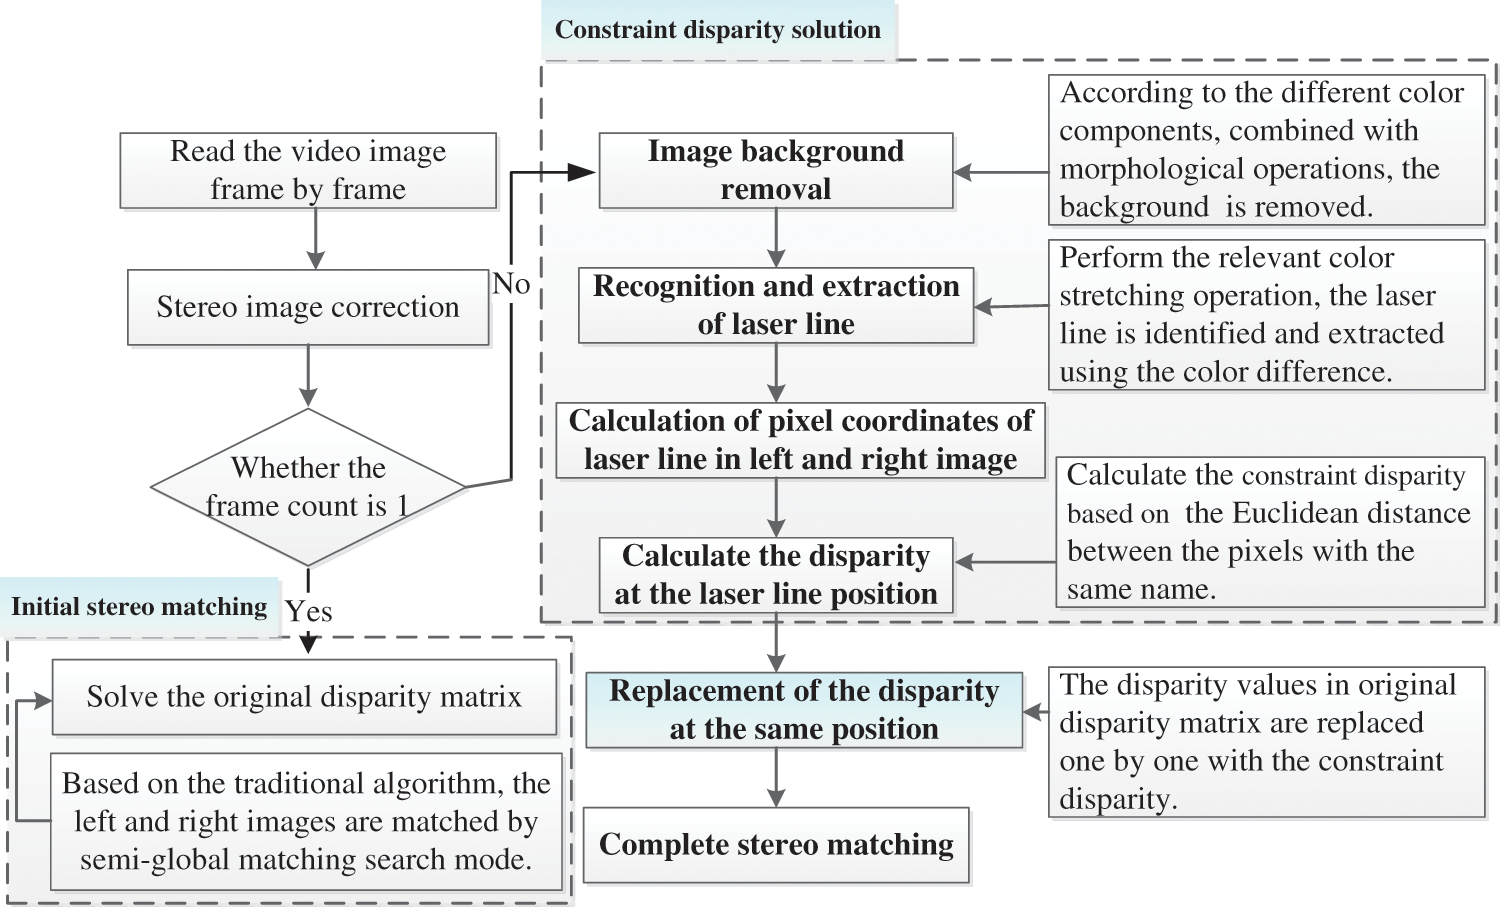
Figure 2: Matching process of disparity replacement method
The superposition synthesis method aims to recognize and extract the laser line from the corrected video image frame by frame, and to concentrate all the laser lines from different images onto the same image (Eq. (3)). On this basis, the traditional stereo matching algorithm is used to perform the step of stereo matching. The matching process of superposition synthesis method is shown in Fig. 3. The superposition synthesis method is simple to operate. The matching feature points can be artificially created to improve the matching efficiency.

Figure 3: Matching process of superposition synthesis method
In Eq. (3), IC means the brightness of composite image; IF means the brightness of the first frame; Mk (i, j) is the binary expression of the laser line in the image of frame k; (i, j) is the pixel coordinates; N is the total number of frames of video image.
In the step of recognition and extraction of laser line, the laser line marking template is to set the pixel value at the laser line position to 1, and the other positions are set to 0. Then the basic image is a constantly updated image matrix, which means the superposition of the basic image with background removal and all previous extracted laser lines.
On the basis of the extracted laser line, the subregion segmentation method divides the target into different subregions according to the constraint position of laser line, Eqs. (4) and (5). First, the range of stereo matching is reduced to each subregion, and the matching disparity of each subregion is solved. Then, the matching disparity of all subregions are combined and superimposed to obtain the disparity matrix of the whole target according to Eq. (6). The matching process of the subregion segmentation method is shown in Fig. 4. The particularity of this method is to narrow the matching range and reduce the probability of wrong matching.
where Sk is the brightness of the subregion segmentation of the video image at frame k; Tk is segmentation template of the video image at frame k; DS,k is the disparity matrix of the subregion segmentation calculated from Sk through semi-global matching algorithm; DR is the residual disparity matrix calculated from residual subregion segmentation SR.

Figure 4: Matching process of subregion segmentation method
2.4 Subregion Segmentation Centroid Enhancement
The subregion segmentation centroid enhancement method is a further upgrade of the subregion segmentation method, which creates more favorable conditions for the accurate matching of sub-regions with a small area. The matching process of the subregion segmentation centroid enhancement method is basically the same as that of the subregion segmentation method. The only difference lies in the step of centroid enhancement. To clearly delimit the subregion boundary and achieve accurate matching, the centroid of the laser line at the subregion boundary is enhanced, and its gray value is directly set as 255 (Eq. (7)). The matching process of this method is shown in Fig. 5. In contrast, the subregion segmentation centroid enhancement method not only reduces the matching range, but also strengthens the mandatory matching of subregion boundaries.

Figure 5: Matching process of subregion segmentation centroid enhancement method
In Eq. (7), when
At present, the measurement accuracy of the 3D texture is mainly evaluated by high-precision and high-resolution test equipment. However, due to the different resolutions of the test equipment, the statistical average index is often used to evaluate the measurement accuracy, which not only weakens the influence of noise, but also interferes with the real evaluation of measurement accuracy of single point.
In addition, although the measurement accuracy of binocular reconstruction technology is affected by system structure parameters (SSPs) and camera calibration parameters (CCPs), it can be improved by optimizing equipment performance, adjusting component collocation and increasing the number of correction images, etc. [27]. The biggest difficulty of measurement accuracy lies in the accurate matching of pixels with the same name, especially for this study with the fixed constraint mode and the same operating equipment. The main aims in this study are to explore the measurement effects of different algorithms under different constraint mechanisms. Therefore, the laser points positioning system is introduced to randomly select different laser marking points. And the matching effect on laser marking points is used to represent the measurement accuracy. Then the goal of self-evaluation of measurement accuracy is achieved through evaluating the matching effect. This evaluation method of measurement accuracy does not need high precision and high resolution measurement equipment, and uses low cost to realize the real evaluation of measurement accuracy of single point.
To synchronously realize the dual functions of 3D texture measurement and precision self-evaluation, an improved binocular reconstruction test device is developed in this study, as shown in Fig. 6.

Figure 6: Structure diagram of improved binocular reconstruction test device
The test device is mainly composed of the binocular camera, moving laser line, laser points positioning system, and bracket. The binocular camera (Lena Machine Vision Technology Co., Ltd., Wuhan, China) with resolution and frame rate of 2560 × 960 @ 24 fps is composed of two lenses with the same specification assembled on one circuit board to achieve simultaneous shooting of the same object at the same time. As for each lens, the single pixel size is 3.0 μm × 3.0 μm and the focal length is 3.1 mm.The outer diameters of the two lenses are 15 mm and the center spacing is 6 cm. Furthermore, the outer side of each lens is provided with a hollow circular reinforcing light source; the moving laser line is a rigid hose high-intensity magnetic frame laser line emitter (Xinkunyang Technology Co., Ltd., Shenzhen, China). It is connected to the slider through strong magnetic adsorption. By moving, the slider can complete the global scanning constraint. The laser point positioning system is composed of seven rigid hose high-intensity magnetic frame laser point emitters (Xinkunyang Technology Co., Ltd., Shenzhen, China). The bracket is made of steel through self-processing, and the mechanical connection between the guide rail, slide block, column, roof, and other parts is realized through bolts.
The operational process of the improved binocular reconstruction test device is as follows:
1) The reinforcing light sources are adjusted to keep the illumination intensity at 200–400 Lux, and the binocular camera calibration is completed using the checkerboard method.
2) The laser line emitter is moved at a linear speed of 2.5 mm/s to perform the global scanning constraint. At the same time, the binocular camera is controlled to synchronously shoot video images under the scanning constraint.
3) The video images are read frame by frame, and four improved binocular reconstruction algorithms are used to conduct stereo image correction, stereo matching, and 3D reconstruction successively. Then, the disparity matrix and 3D texture information of the target are obtained.
4) The laser line emitter is turned off, the dot laser emitter is turned on, seven points to be measured are randomly assigned, and the image is obtained through the binocular camera. Combined with image processing, the assigned laser points are recognized and the position coordinates of the laser points are solved. Then, the pixel disparity between the left and right images is calculated for each assigned laser point. The calculated pixel disparity is recorded as reference disparity. Furthermore, the reference elevation of each assigned laser point is calculated based on reference disparity and camera calibration parameters. Taking the 1# assigned laser point as the reference point, the elevation difference between other points and the 1# point is solved, which is recorded as reference elevation difference.
5) According to the disparity matrix and 3D texture information solved in step 3, the measured disparity and measured elevation at the coordinate positions of seven assigned laser points is obtained.
6) Based on the disparity and elevation difference information of the assigned laser points, the average deviation and maximum deviation between the measured and reference values are calculated to realize the independent evaluation of measurement accuracy.
4.1 Measurement Process Analysis of Different Improved Algorithms
A core sample of φ 10 cm × 3 cm was arbitrarily taken from the actual asphalt pavement, which was used as the target to examine the measurement effect of improved algorithms on 3D pavement texture. Following the operating procedure of the improved binocular reconstruction test device, the laser line emitter was switched on and the global scanning constraint on the target was completed at a moving speed of 2.5 mm/s. The binocular camera was also used to capture the video image at the same time. With computer programming, the video image was read and corrected frame by frame, and the laser line in every frame image was recognized and extracted (Fig. 7). Thus, all the laser lines in the entire video image are extracted to form a global dense constraint on the target (Fig. 8). Finally, based on four different stereo matching mechanisms of disparity replacement, superposition synthesis, subregion segmentation, and subregion segmentation centroid enhancement, the improved binocular reconstruction algorithm was used to measure the 3D pavement texture. The measurement results of different algorithms are shown in Fig. 9.

Figure 7: Laser line recognition and extraction process of single frame image in left view

Figure 8: Global scanning constraint process of moving laser line
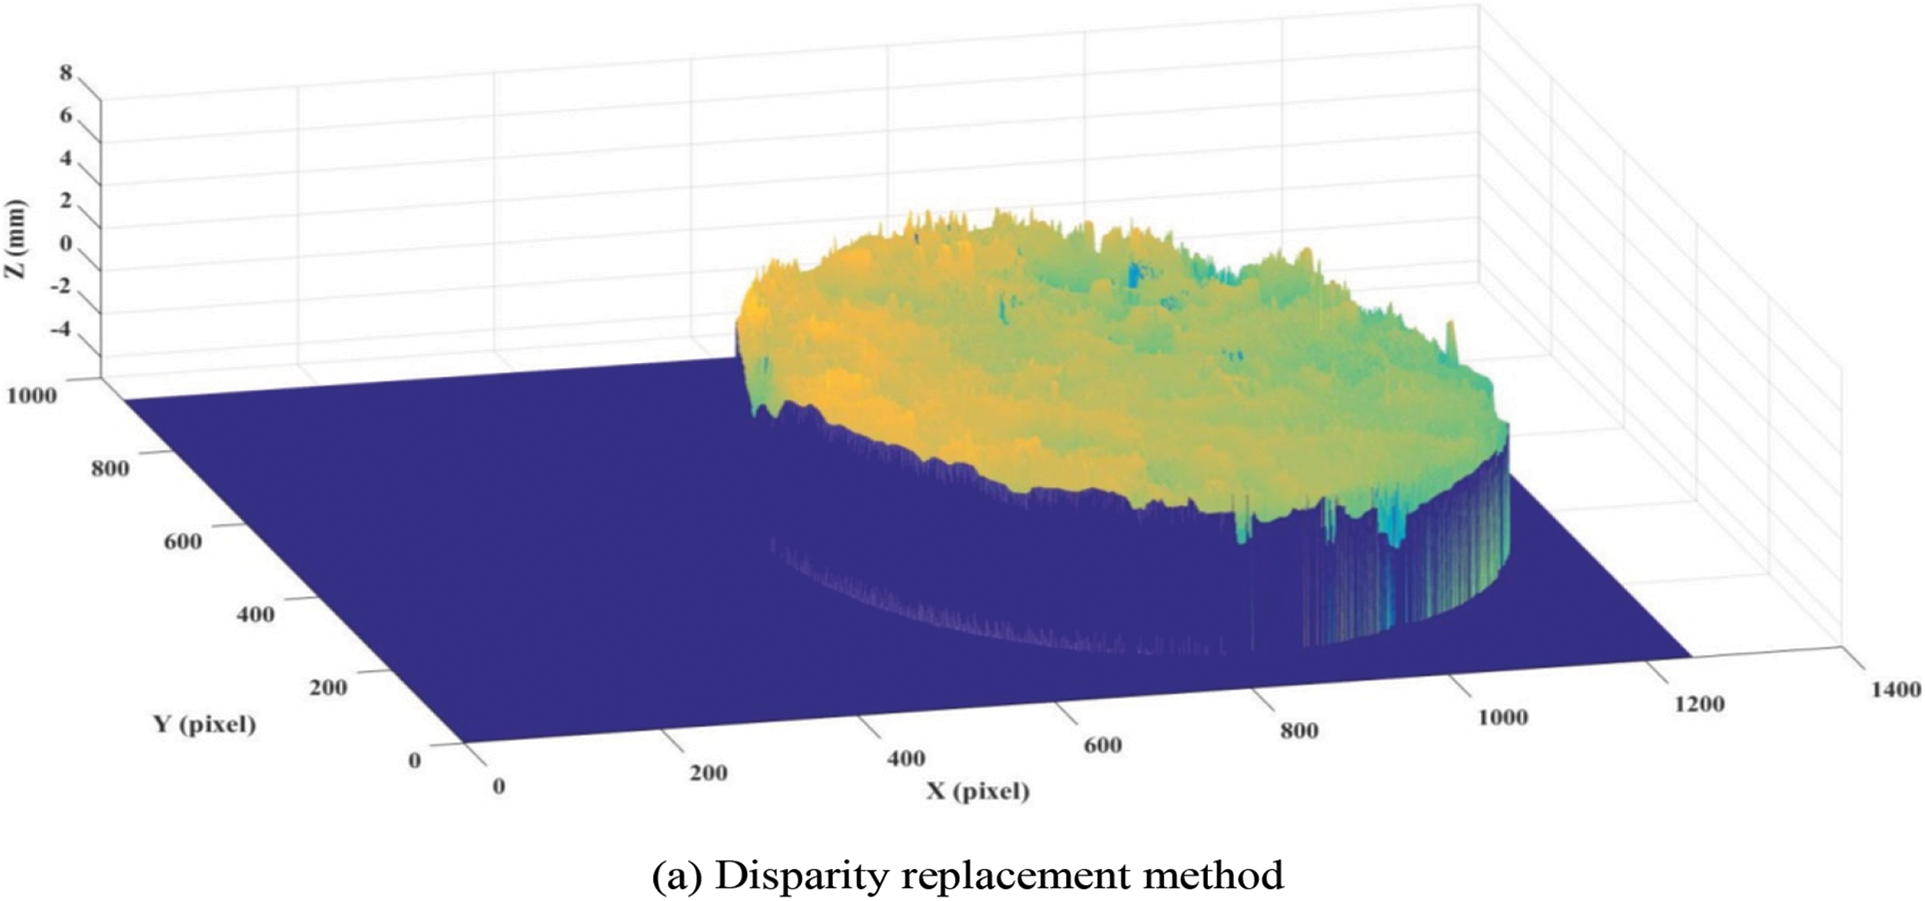


Figure 9: Measurement effect of various improved algorithms
Fig. 7 shows the recognition and extraction process of the laser line in a single frame image. In this study, there is only one laser line in each frame image, which avoids the interference between multiple fixed laser lines and greatly reduces the difficulty of recognition and extraction. The results of Fig. 7 show that the laser line recognition and extraction algorithm adopted in this paper is effective and can clearly and completely extract the whole laser line constrained target.
In Fig. 8, the video image under the global scanning constraint is captured using only one moving laser line. The results show that although a single laser line is used, dense forced constraints are still artificially constructed on the surface of the sample, which provides conditions for the accurate matching between same name pixels. The accumulation of the constraint line in each frame not only overcomes the difficulty of installing multiple laser line emitters, but also forms a good global dense constraint.
Fig. 9 describes the measurement effect of the different improved algorithm. The measurement surface using the disparity replacement method is not smooth, with many fine structural peaks and diffuses the whole surface, which means that the matching effect of the disparity replacement method is not ideal and contains a lot of noise. By contrast, the results using the superposition synthesis method, subregion segmentation method, and subregion segmentation centroid enhancement method are significantly improved. The overall visual effect is good, but a few structural peaks remain in the local area, especially near the boundary area. To further quantitatively analyze the testing effects of different improved algorithms, the following part applies the measurement accuracy evaluation function of the improved binocular reconstruction test device to conduct follow-up research.
4.2 Test Results of Improved Binocular Reconstruction Test Device
Following the operating procedure of the improved binocular reconstruction test device, seven laser points were randomly assigned on the surface of the target specimen. Combined with computer programming, the assigned laser points were identified and extracted, as shown in Fig. 10.

Figure 10: Extraction process of assigned laser points
In Fig. 10, the background of the sample images are removed successfully and all assigned laser points are correctly identified and extracted. The results show that the algorithms of background removal and laser points’ extraction are effective. The successful extraction of assigned laser points provides the basis for calculating reference elevation and reference disparity, and makes the self-evaluation of measurement accuracy possible. Based on the identified and extracted results, pixel coordinates, reference disparity, reference elevation, and reference elevation difference of the assigned laser points were further calculated. The results are shown in Table 1.

In Table 1, the pixel coordinate Y in the left and right images for the same assigned laser point is almost the same and the maximum deviation is only 1 pixel. Importantly, the essence of one pixel deviation comes from the data processing rules of rounding. The results show that the image correction algorithm used in this study is effective and the image shows good line parallelism after correction. Due to the character of line parallelism, only the change of pixel coordinates in the column needs to be considered when calculating the reference disparity. The reference disparity in Table 1 is a sub-pixel solution based on the centroid position of the assigned laser points, and the results retain two decimal places.
4.3 Comparison of Measurement Results Using Different Improved Matching Algorithms
With computer programming, the disparity matrix and 3D texture information of the specimen surface were acquired by using traditional binocular reconstruction algorithm (TBRA) and four improved binocular reconstruction algorithms (IBRA). According to independent evaluation procedure of the measuring accuracy in Section 4, combined with the pixel coordinates of the assigned laser points in Table 1, the measured disparity and measured elevation of each algorithm at the assigned laser points were solved, and the average deviation and maximum deviation between the reference value and measured value were calculated to complete the comparison of measurement accuracy between different algorithms. The results are shown in Table 2.
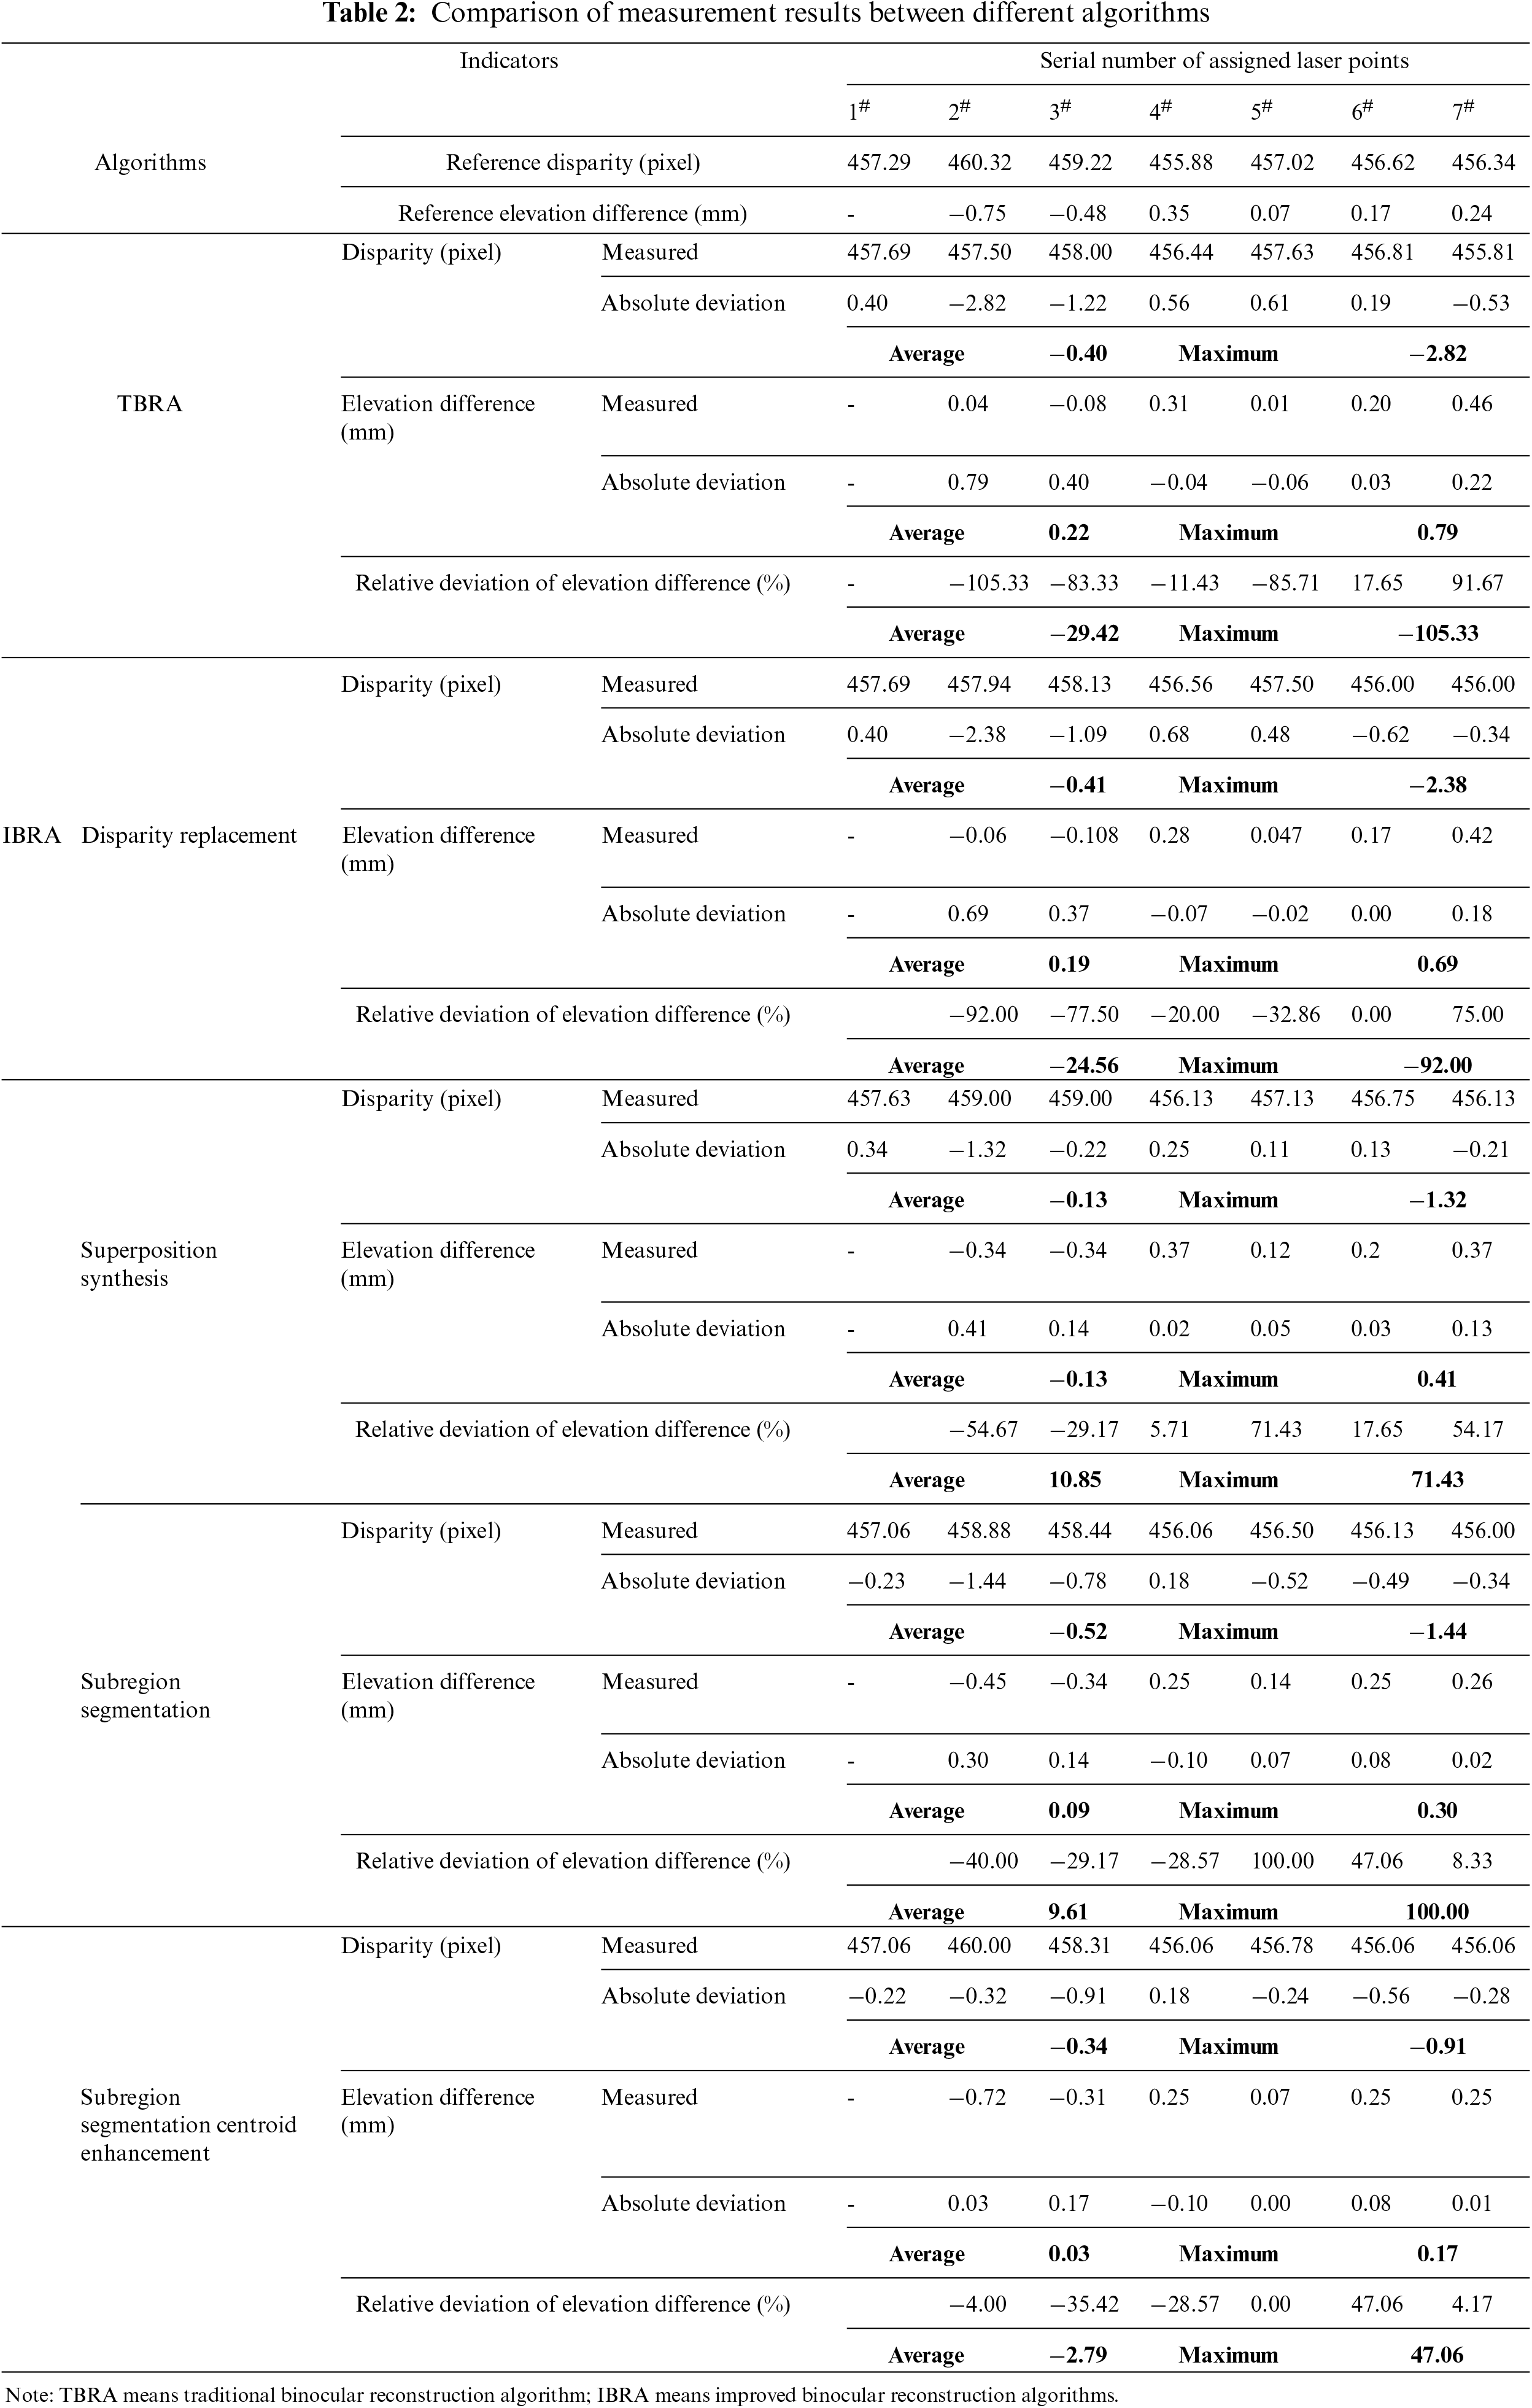
The results in Table 2 show that for the traditional binocular reconstruction without laser line constraint, the average absolute deviation of disparity and elevation difference is 0.40 pixel and 0.22 mm, respectively. However, the maximum absolute deviation of parallax is 2.82 pixel, and the maximum relative deviation of elevation difference is as high as 105.33%. The traditional binocular reconstruction algorithm shows a certain overall effect, but it is the result of statistical average. Overall, the mean absolute deviation of the traditional binocular reconstruction algorithm is the largest among all of the algorithms. In particular, the error of the local single point is extremely large, so meeting the requirements of 3D pavement texture measurement is difficult. After introducing the moving laser line scanning constraint, all the algorithms have improved. The average deviation of disparity of all improved algorithms is within 1 pixel. Among the four improved algorithms, the disparity replacement method has the worst improvement effect, followed by superposition synthesis method and subregion segmentation method. The improved algorithm with subregion segmentation centroid enhancement has the best measurement effect. The maximum absolute deviation of disparity in the disparity replacement method is 2.38 pixel, and the maximum absolute deviation of elevation difference is 0.69 mm (greater than 0.5 mm), which also has the problem of large error in local areas. The maximum deviations of the elevation difference of the superposition synthesis method and subregion segmentation method are 0.41 and 0.30 mm, respectively, and the maximum relative deviations of the elevation difference are 71.43% and 100%, respectively. The measurement accuracy of the two methods is better than that of the disparity replacement method, but it is still limited. The reason may be that the local accurate and effective matching ability of these two algorithms is still limited, especially in the subregion boundary matching. For the subregion segmentation centroid enhancement method, both the mean absolute deviation and maximum absolute deviation of disparity are less than 1 pixel; and the mean absolute deviation and maximum absolute deviation of elevation difference are 0.03 and 0.17 mm, respectively; in particular, the mean relative deviation of elevation difference is only 2.79%. In conclusion, no matter the overall measurement accuracy or single point measurement accuracy, the improved algorithm with subregion segmentation centroid enhancement can exhibit a good effect.
4.4 Validation Study in Real Environment
Considering the good measurement effect, the improved algorithm with subregion segmentation centroid enhancement is further examined in real road environment. One campus Road, who has served for six years, was chosen. The paving material used for the road surface is AC-13 that is one typical continuous dense-graded hot-mix asphalt mixture. Three measurement positions representing different test conditions were selected to analyze the measurement effect, as shown in Fig. 11. Where, test position I is located in the carriageway traffic lane without obvious pavement diseases; test position II is also located in the carriageway traffic lane, but there is a transverse crack in the test range; As for test position III, it is located on a walking path and has not been subjected to vehicle load.

Figure 11: Schematic diagram of the improved algorithm examined in a real environment
The measurement results for each test position are shown in Fig. 11. The improved algorithm shows good overall effect in test positions. To further quantitatively analyze the test accuracy, the improved binocular reconstruction test device is further used to randomly assign seven laser points for each test position. And the reference disparity and the measured disparity are solved. The calculation results are shown in Table 3.

In Table 3, taking the randomly assigned laser point as a reference, the average absolute deviation of the measured disparity in three test positions are 0.12, 0.17 and 0.25 pixels, respectively. Even the maximum absolute deviations are all less than 1 pixel, which are 0.72, 0.81 and 0.86 pixels, respectively. The results show that the improved algorithm with subregion segmentation centroid enhancement can also achieve ideal measurement accuracy in real road environment.
Focusing on solving the problem of dense and accurate matching of pixels with the same name, this study introduced a single moving laser line. The video images were also captured under the global scanning constraint generated by moving the laser line. In response to the global scanning constraint, four different improved algorithms were proposed. The effect of different improved algorithms on the measurement accuracy was further analyzed. The following conclusions can be drawn:
(1) Aiming at the improved algorithms, a set of measuring devices are developed to realize the dual functions of 3D texture measurement and precision self-evaluation. With the help of computer programming, this device can complete operations such as background removal, laser line recognition and extraction, subregion segmentation, laser line centroid enhancement, and reference disparity solution.
(2) Four kinds of improved algorithms are established based on different constraint mechanisms. Among them, the subregion segmentation centroid enhancement method has the best measurement effect, followed by the superposition synthesis and subregion segmentation methods, and the disparity replacement method has the worst improvement effect. The first three algorithms have a better overall visual effect, but the last algorithm contains a lot of noise and presents more small structural peaks on the surface.
(3) The introduction of a single laser line scanning constraint is helpful in improving the measurement accuracy. Compared with traditional binocular reconstruction, the improved algorithms have better measurement accuracy in both overall and local single points. Especially for the subregion segmentation centroid enhancement method, the average deviation and maximum deviation of the elevation difference are 0.03 and 0.17 mm. Using only one moving laser line, and the mandatory dense surface constraints are artificially constructed to narrow the matching range and improve the matching accuracy. Moreover, one moving laser line can also overcome the difficulty of installing and recognizing excessive laser lines.
(4) Although the proposed methods have achieved satisfactory test results, there are still some practical challenges, such as the automatic with-traffic continuous measurement, the stability in complex environments, and the more application in different road environments, etc. All these challenges need further research and analysis.
Acknowledgement: The authors are grateful for the support provided by the National Natural Science Foundation of China, the Doctoral Research Foundation of Hubei University of Arts and Science, National College Students' Innovation and Entrepreneurship Training Program, and the Hubei Superior and Distinctive Discipline Group of “New Energy Vehicle and Smart Transportation.”
Funding Statement: The paper was supported by National Natural Science Foundation of China (52178422); Doctoral Research Foundation of Hubei University of Arts and Science (2059047); National College Students’ Innovation and Entrepreneurship Training Program (202210519021).
Author Contributions: Conceptualization, Yuanyuan Wang; methodology, Yuanyuan Wang and Xiaofeng Ren; investigation, Rui Wang and Xiaofeng Ren; formal analysis, Rui Wang and Xiaofeng Ren; Funding acquisition, Yuanyuan Wang and Rui Wang; writing-review and editing, Rui Wang and Junan Lei. All authors have read and agreed to the published version of the manuscript.
Availability of Data and Materials: Some or all data, models, or code that support the findings of this study are available from the corresponding author upon reasonable request.
Conflicts of Interest: The authors declare that they have no conflicts of interest to report regarding the present study.
References
1. Licitra, G., Cerchiai, M., Teti, L., Ascari, E., Fredianelli, L. (2015). Durability and variability of the acoustical performance of rubberized road surfaces. Applied Acoustics, 94, 20–28. DOI 10.1016/j.apacoust.2015.02.001. [Google Scholar] [CrossRef]
2. Soares, F., Freitas, E., Cunha, C., Silva, C., Lamas, J. et al. (2017). Traffic noise: Annoyance assessment of real and virtual sounds based on close proximity measurements. Transportation Research Part D: Transport and Environment, 52, 399–407. DOI 10.1016/j.trd.2017.03.019. [Google Scholar] [CrossRef]
3. Tan, T., Xing, C., Tan, Y., Gong, X. (2019). Safety aspects on icy asphalt pavement in cold region through field investigations. Cold Regions Science and Technology, 161, 21–31. DOI 10.1016/j.coldregions.2019.02.010. [Google Scholar] [CrossRef]
4. Awolusi, T. F., Sojobi, A. O., Oguntayo, D. O., Akinkurolere, O. O., Orogbade, B. O. (2021). Effects of calcined clay, sawdust ash and chemical admixtures on strength and properties of concrete for pavement and flooring applications using taguchi approach. Case Studies in Construction Materials, 15, 00568. DOI 10.1016/j.cscm.2021.e00568. [Google Scholar] [CrossRef]
5. Mayora, J. M. P., Piña, R. J. (2009). An assessment of the skid resistance effect on traffic safety under wet-pavement conditions. Accident Analysis & Prevention, 41(4), 881–886. DOI 10.1016/j.aap.2009.05.004. [Google Scholar] [CrossRef]
6. National Bureau of Statistics of the People's Republic of China (NBSPRC) (2020). China statistical yearbook-2020. Beijing, China: China Statistics Press (in Chinese). [Google Scholar]
7. Permanent International Association of Road Congresses (PIARC) (1987). Report of the committee on surface characteristics. Proceedings of the XVIIWorld Road Congress, Brussels, Belgium. [Google Scholar]
8. Liu, Q., Shalaby, A. (2017). Relating concrete pavement noise and friction to three-dimensional texture parameters. International Journal of Pavement Engineering, 18(5), 450–458. DOI 10.1080/10298436.2015.1095897. [Google Scholar] [CrossRef]
9. Chen, B., Xiong, C. L., Li, W. X., He, J. R., Zhang, X. N. (2021). Assessing surface texture features of asphalt pavement based on three-dimensional laser scanning technology. Buildings, 11(12), 11120623. DOI 10.3390/buildings11120623. [Google Scholar] [CrossRef]
10. Sakhaeifar, M., Banihashemrad, A., Liao, G., Waller, B. (2018). Tyre–pavement interaction noise levels related to pavement surface characteristics. Road Materials and Pavement Design, 19(5), 1044–1056. DOI 10.1080/14680629.2017.1287770. [Google Scholar] [CrossRef]
11. Zhang, H., Liu, Z., Meng, X. (2019). Noise reduction characteristics of asphalt pavement based on indoor simulation tests. Construction and Building Materials, 215, 285–297. DOI 10.1016/j.conbuildmat.2019.04.220. [Google Scholar] [CrossRef]
12. Zhou, X. L., Xiao, S. Q., Xiao, W. X., Ran, M. P. (2017). Multi-fractal evaluation on roughness of coarse aggregate surface texture. Journal of Huazhong University of Science and Technology (Nature Science Edition), 45(2), 29–33 (in Chinese). [Google Scholar]
13. Yang, G., Li, Q. J., Zhan, Y., Fei, Y., Zhang, A. (2018). Convolutional neural network–based friction model using pavement texture data. Journal of Computing in Civil Engineering, 32(6), 000797. DOI 10.1061/(ASCE)CP.1943-5487.0000797. [Google Scholar] [CrossRef]
14. Wang, Y., Liu, Y., Cheng, Y., Xue, J. (2020). Evaluation of the decay characteristics of pavement skid resistance using three-dimensional texture from accelerated abrasion test. Journal of Transportation Engineering, Part B: Pavements, 146(4), 0000230. DOI 10.1061/JPEODX.0000230. [Google Scholar] [CrossRef]
15. Do, M. T., Cerezo, V. (2015). Road surface texture and skid resistance. Surface Topography: Metrology and Properties, 3(4), 043001. DOI 10.1088/2051-672X/3/4/043001. [Google Scholar] [CrossRef]
16. Hiti, M., Ducman, V. (2014). Analysis of the slider force calibration procedure for the British pendulum skid resistance tester. Measurement Science and Technology, 25(2), 025013. DOI 10.1088/0957-0233/25/2/025013. [Google Scholar] [CrossRef]
17. Thomsen-Schmidt, P. (2011). Characterization of a traceable profiler instrument for areal roughness measurement. Measurement Science and Technology, 22(9), 094019. DOI 10.1088/0957-0233/22/9/094019. [Google Scholar] [CrossRef]
18. Jahanshahi, M. R., Jazizadeh, F., Masri, S. F., Becerik-Gerber, B. (2013). Unsupervised approach for autonomous pavement-defect detection and quantification using an inexpensive depth sensor. Journal of Computing in Civil Engineering, 27(6), 743–754. DOI 10.1061/(ASCE)CP.1943-5487.0000245. [Google Scholar] [CrossRef]
19. Lu, J., Zhang, Y. J., Wang, C. C., Shao, Q. (2017). Structured light 3D vision measurement technology using phase shift gamma correction method. Journal of Harbin Institute of Technology, 49(9), 182–188 (in Chinese). [Google Scholar]
20. Alamdarlo, M. N., Hesami, S. (2018). Optimization of the photometric stereo method for measuring pavement texture properties. Measurement, 127, 406–413. DOI 10.1016/j.measurement.2018.05.109. [Google Scholar] [CrossRef]
21. Sun, L., Wang, Y. (2017). Three-dimensional reconstruction of macrotexture and microtexture morphology of pavement surface using six light sources–based photometric stereo with low-rank approximation. Journal of Computing in Civil Engineering, 31(2), 0000625. DOI 10.1061/(ASCE)CP.1943-5487.0000625. [Google Scholar] [CrossRef]
22. Gendy, A. E., Shalaby, A., Saleh, M., Flintsch, G. W. (2011). Stereo-vision applications to reconstruct the 3D texture of pavement surface. International Journal of Pavement Engineering, 12(3), 263–273. DOI 10.1080/10298436.2010.546858. [Google Scholar] [CrossRef]
23. Dunford, A. M., Parry, A. R., Shipway, P. H., Viner, H. E. (2012). Three-dimensional characterisation of surface texture for road stones undergoing simulated traffic wear. Wear, 292, 188–196. DOI 10.1016/j.wear.2012.05.010. [Google Scholar] [CrossRef]
24. Wang, L., Zhao, J. K., Xia, X., Long, H. H. (2015). Bridge crack measurement system based on binocular stereo vision technology. Journal of Computer Applications, 35(3), 901–904. [Google Scholar]
25. Liu, Y., Wang, Y., Cai, X., Hu, X. (2020). The detection effect of pavement 3D texture morphology using improved binocular reconstruction algorithm with laser line constraint. Measurement, 157, 107638. DOI 10.1016/j.measurement.2020.107638. [Google Scholar] [CrossRef]
26. Tang, Y. C., Li, L. J., Feng, W. X., Liu, F., Zou, X. J. et al. (2018). Binocular vision measurement and its application in full-field convex deformation of concrete-filled steel tubular columns. Measurement, 130, 372–383. DOI 10.1016/j.measurement.2018.08.026. [Google Scholar] [CrossRef]
27. Yang, L., Wang, B., Zhang, R., Zhou, H., Wang, R. (2017). Analysis on location accuracy for the binocular stereo vision system. IEEE Photonics Journal, 10(1), 2784958. [Google Scholar]
Cite This Article
 Copyright © 2023 The Author(s). Published by Tech Science Press.
This work is licensed under a Creative Commons Attribution 4.0 International License , which permits unrestricted use, distribution, and reproduction in any medium, provided the original work is properly cited.
 Downloads
 Citation Tools