
 Submit a Paper
 Propose a Special lssue
 Open Access
ARTICLE

Experimental and Numerical Research on Water Transport during Adsorption and Desorption in Cement-Based Materials
1 Department of Civil Engineering, Yunnan University, Kunming, 650091, China
2 School of Information Engineering, Kunming University, Kunming, 650214, China
* Corresponding Author: Xiang Zhang. Email:
(This article belongs to the Special Issue: Advanced Computational Methods in Fluid Mechanics and Heat Transfer)
Computer Modeling in Engineering & Sciences 2023, 136(2), 1487-1507. https://doi.org/10.32604/cmes.2023.025799
Received 30 July 2022; Accepted 26 September 2022; Issue published 06 February 2023
 View Full Text
 Download PDF
Abstract
The durability of cement-based materials is related to water transport and storage in their pore network under different humidity conditions. To understand the mechanism and characteristics of water adsorption and desorption processes from the microscopic scale, this study introduces different points of view for the pore space model generation and numerical simulation of water transport by considering the “ink-bottle” effect. On the basis of the pore structure parameters (i.e., pore size distribution and porosity) of cement paste and mortar with water-binder ratios of 0.3, 0.4 and 0.5 obtained via mercury intrusion porosimetry, randomly formed 3D pore space models are generated using two-phase transformation on Gaussian random fields and verified via image analysis method of mathematical morphology. Considering the Kelvin-Laplace equation and the influence of “ink-bottle” pores, two numerical calculation scenarios based on mathematical morphology are proposed and applied to the generated model to simulate the adsorption-desorption process. The simulated adsorption and desorption curves are close to those of the experiment, verifying the effectiveness of the developed model and methods. The obtained results characterize water transport in cement-based materials during the variation of relative humidity and further explain the hysteresis effect due to “ink-bottle” pores from the microscopic scale.Keywords
Durability is one of the most prominent problems of cement-based materials. The transport of water in the pore network directly influences the mechanical (shrinkage, creep) and chemical (penetration of aggressive agents) degradation of cement-based materials [1–5]. The adsorption-desorption curve can reflect the corresponding relationship between the equilibrium water content of porous materials and the relative humidity (RH) of the environment; thus, it is one of the major data used to evaluate durability [6–8]. Exploring the mechanism of water transport in a microscopic pore network is conducive to increasing the understanding of the adsorption-desorption characteristics of cement-based materials.
Given the same temperature and humidity conditions, hysteresis frequently occurs between adsorption and desorption curves. This phenomenon is closely related to “ink-bottle” pores in the microscopic pore network of cement-based materials [9–14]. McBain [9] was one of the earliest to propose the hysteresis effect produced by ink-bottle pores. Espinosa et al. [10] developed the “IBP” method, in which ink-bottle pores consist of two cylinders with different radii to investigate the equilibrium hygroscopic water content in hardened cement paste and cement mortars under changing climatic conditions. Baroghel-Bouny [11] presented various results with regard to the analysis of the drying-wetting process and its relation to pore structure. The results indicated that hysteresis occurs between desorption and adsorption, extending over the whole RH range. Ranaivomanana et al. [12] proposed a flattened shape for pores which is approximated by an oblong geometry to represent the pore structure of cement-based materials and predicted the hysteresis phenomenon encountered in water adsorption–desorption isotherms. Zhang et al. [13] conducted parameter analysis during an isothermal adsorption-desorption experiment and on the kinetic principle of water vapor in cement-based materials; they found that the Guggenheim-Andersen-de Boer model can better describe adsorption (desorption) equilibrium and hysteresis. Schiller et al. [14] provided a more detailed mathematical description for estimating the influences of pore shape and material constants, such as Young’s modulus and adhesion energy, on sorption hysteresis in hardened cement paste.
In general, pores are formed naturally in porous media. Quantitatively describing their geometric and spatial characteristics is extremely difficult due to their complicated morphology and disordered distribution. That is, a pore network model which is constructed on the basis of the definition of specific shapes and relevant parameters differs significantly from real pore space, and thus, is not sufficiently convincing for predicting the migration of fluid [15]. To further explore and understand the mechanism of water transport in porous media, building models that can reflect the randomness of pore morphology is necessary. Direct scanning and random pore space generation are the mainstream methods at present. Tian et al. [16] applied X-ray computed tomography (CT) technique to reconstruct the meso and micro structures of concrete and used an improved threshold method to eliminate noise during X-ray CT image processing. Zhang et al. [17] proposed a 3D random porous media model to characterize the spatial distribution associated with porosity in cement mortar. The proposed model addresses random heterogeneity in material properties by using a Weibull random field. The author of this paper (see Zhang et al. [18]) performed biphasic transformation on continuous Gaussian random fields to simulate the pore and matrix phases of rocks and then numerically predicted gas migration properties.
To date, few kinds of research have been conducted to generate models of cement-based materials with stochastic pore space morphology and then study water transport by considering the ink-bottle effect. In the current study, the issue of water transport in an isothermal adsorption-desorption process is investigated using “experimental + numerical” methods. In the experimental part, cement pastes and mortars with different water-binder ratios were prepared. The isothermal adsorption-desorption experiment and mercury intrusion porosimetry (MIP) test were performed to identify the variation in water content and obtain the porosity and pore size distribution of cement-based materials. In the numerical part, 3D pore space models that satisfy the porosity and the pore size distribution of cement-based materials were constructed using biphasic transformation on Gaussian random fields. This method does not rely on an initial setting of pore form, and it can present the heterogeneity and randomness of pore space morphology. On the basis of the generated model, numerical prediction scenarios that use the image processing method of mathematical morphology were proposed and applied to obtain the isothermal adsorption-desorption curve. After comparison with the experimental data, the hysteresis phenomenon caused by ink-bottle pores was verified and water transport characteristics and transport mechanism during the adsorption-desorption cycle were revealed from the microscopic scale, providing theoretical support for the further analysis of the durability of cement-based materials.
2 Adsorption and Desorption Experiments on Cement-Based Materials
The samples of cement paste and mortar are shown in Fig. 1. The cementitious materials used in this experiment consist of 30% Portland cement and 70% ground granulated blast furnace slag (GGBS). The basic physical parameters of cement are listed in Table 1. The chemical composition of the cementitious materials is presented in Table 2. The fine aggregate is made of river sand. The measured water content is 4.8% (mass fraction), the fineness modulus is 2.6 (belongs to medium sand), the mud content is less than 1% (mass fraction), and the apparent density is 2.54 g/cm3. The mix proportions of cement paste (P-0.3, P-0.4, P-0.5) and mortar (M-0.3, M-0.4, M-0.5) are provided in Table 3. The fresh cement pastes and mortars were loaded into ϕ50 mm × 100 mm molds. After 1 day, they were removed and placed in water for curing. After 90 days, hydration was completed and the pore structure was relatively stable. Samples were taken out and cut into 3–5 mm thick slices to shorten the time to reach water equilibrium during the isothermal adsorption–desorption experiment [19].
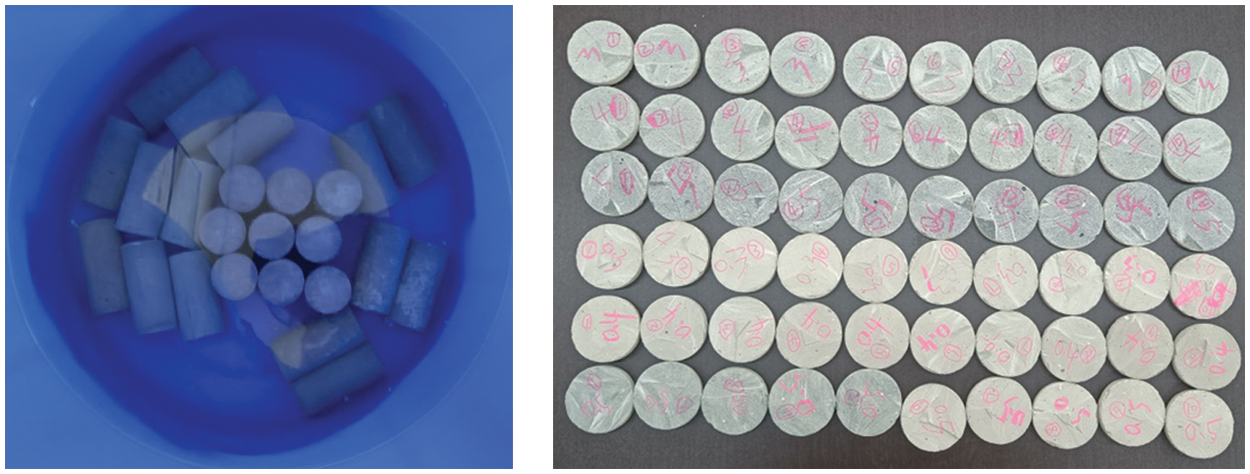
Figure 1: The samples of cement paste and mortar


2.2 Isothermal Adsorption and Desorption Experiments
The samples were divided into two groups: the adsorption group and the desorption group. The desorption group was taken from the saturated samples, while the adsorption group was dried to a constant weight before the experiment. A drying temperature of above 100°C is capable of decomposing C-S-H gel; hence, the selected temperature should not be too high [8]. A temperature of 60°C was set such that the free water could evaporate slowly without damaging the microstructure of the matrix. The mass of a sample was measured using an analytical balance and the temperature and humidity of the experiment were controlled with a constant temperature and humidity box (see Fig. 2a). Temperature was maintained at 20°C; and RH was set as 20%, 40%, 60%, 80% and 100%. For each humidity level, three samples of cement pastes and mortars with different water-binder ratios were placed in the sealed chamber and weighed every 7 days until reaching constant mass. The entire adsorption–desorption experiment took 110 days. Given an RH value, the adsorption and desorption amounts of water can be calculated as:
where
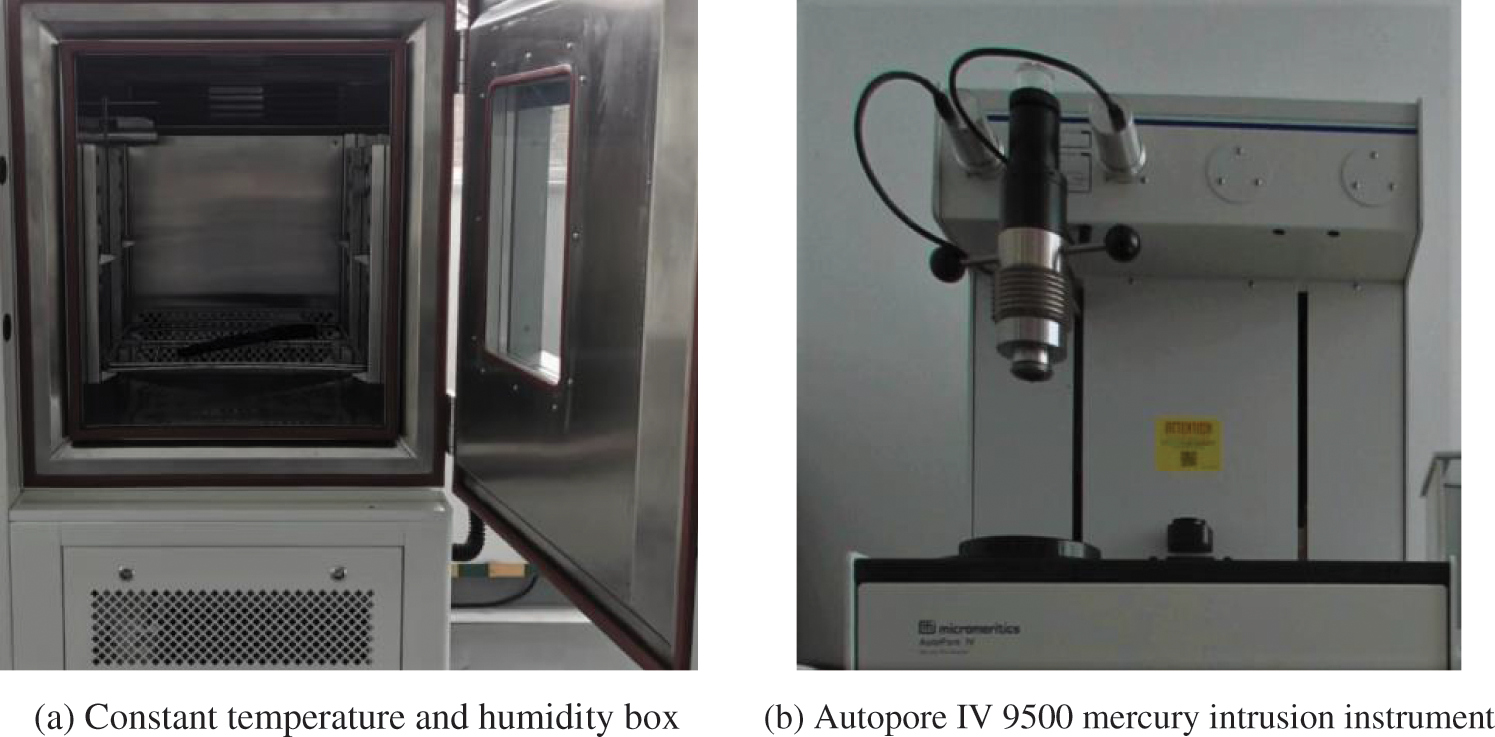
Figure 2: Instruments for isothermal adsorption-desorption experiment and MIP test
The isothermal adsorption-desorption curves that reflect the variation of water content with RH are shown in Fig. 3. The results indicate evident hysteresis between the desorption and adsorption processes.
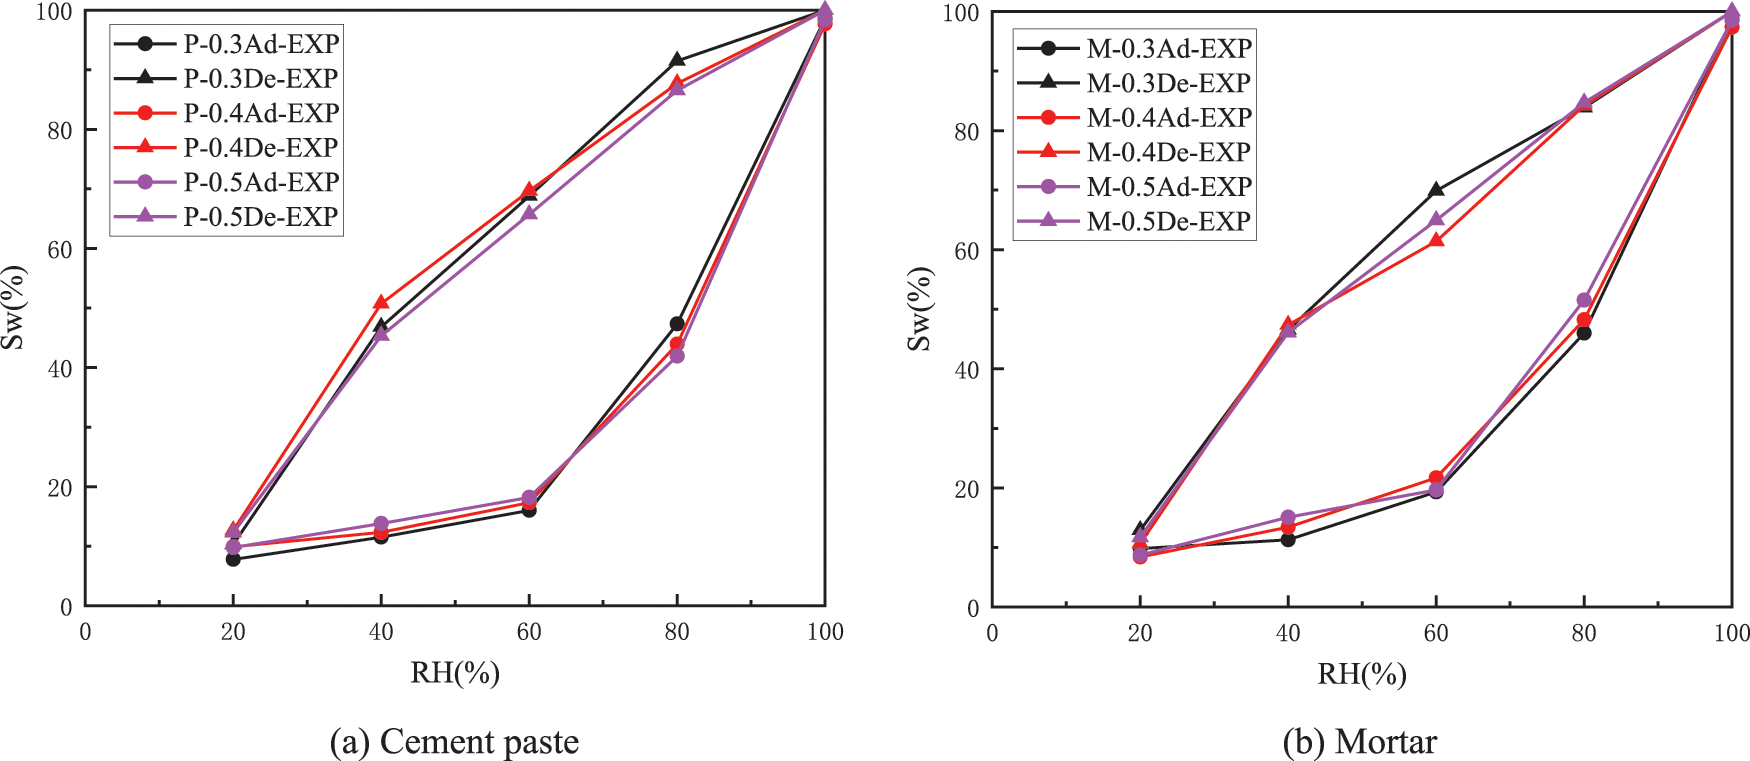
Figure 3: Isothermal adsorption-desorption curves of cement-based materials
The dried cement paste and mortar samples were subjected to MIP test by using an Autopore IV 9500 fully automatic mercury intrusion instrument (Fig. 2b). The cumulative pore size distribution curves of cement-based materials are presented in Fig. 4. The open porosities of P-0.3, P-0.4 and P-0.5 are 19.39%, 23.74% and 32.34%, respectively. Pore diameter ranges are 0.003–0.09 μm in P-0.3 and 0.003–0.2 μm in P-0.4 and P-0.5. With regard to the mortar samples, the open porosities of M-0.3, M-0.4 and M-0.5 are 10.91%, 17.77% and 19.86%, respectively. Pore size distribution is between 0.003 and 0.05 μm.
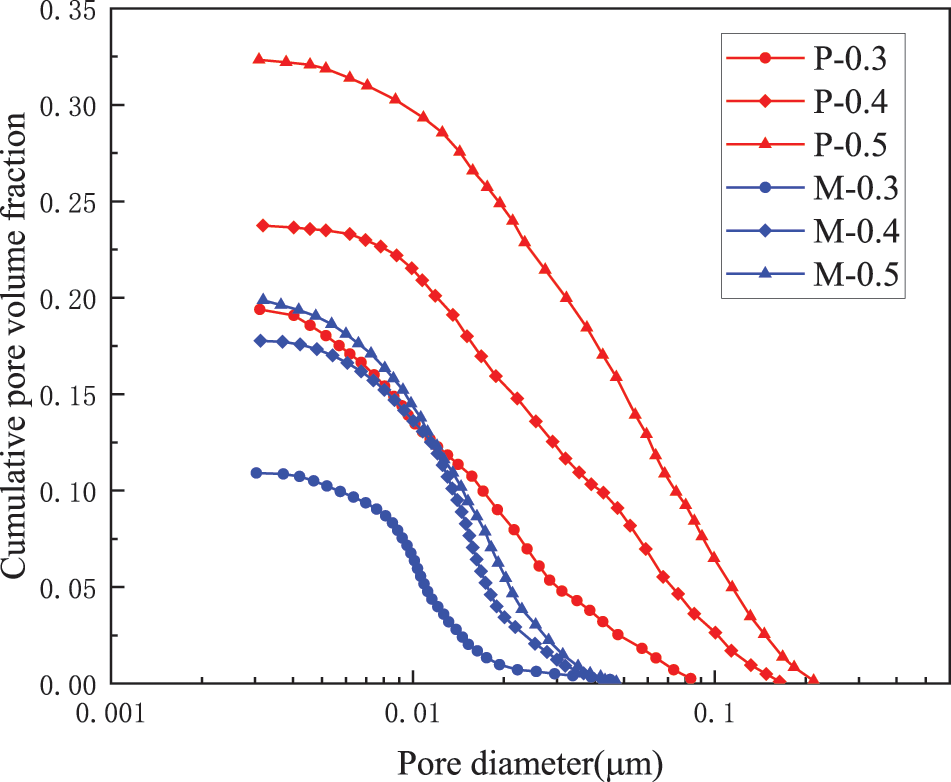
Figure 4: Pore size distribution curves of cement-based materials
3 Generation and Validation of the Pore Space Model
The general idea of model construction can be summarized as follows: by setting a threshold, a continuous Gaussian random field will be transformed into a two-phase field to represent the pores and the matrix of the porous medium.
As illustrated in Fig. 5, the two-phase transformation on random fields RF1 and RF2 is to select a threshold D and then two sets P1 and P2 are obtained where the value of field is within [D, +∞) and (−∞, D). This operation can be expressed as:
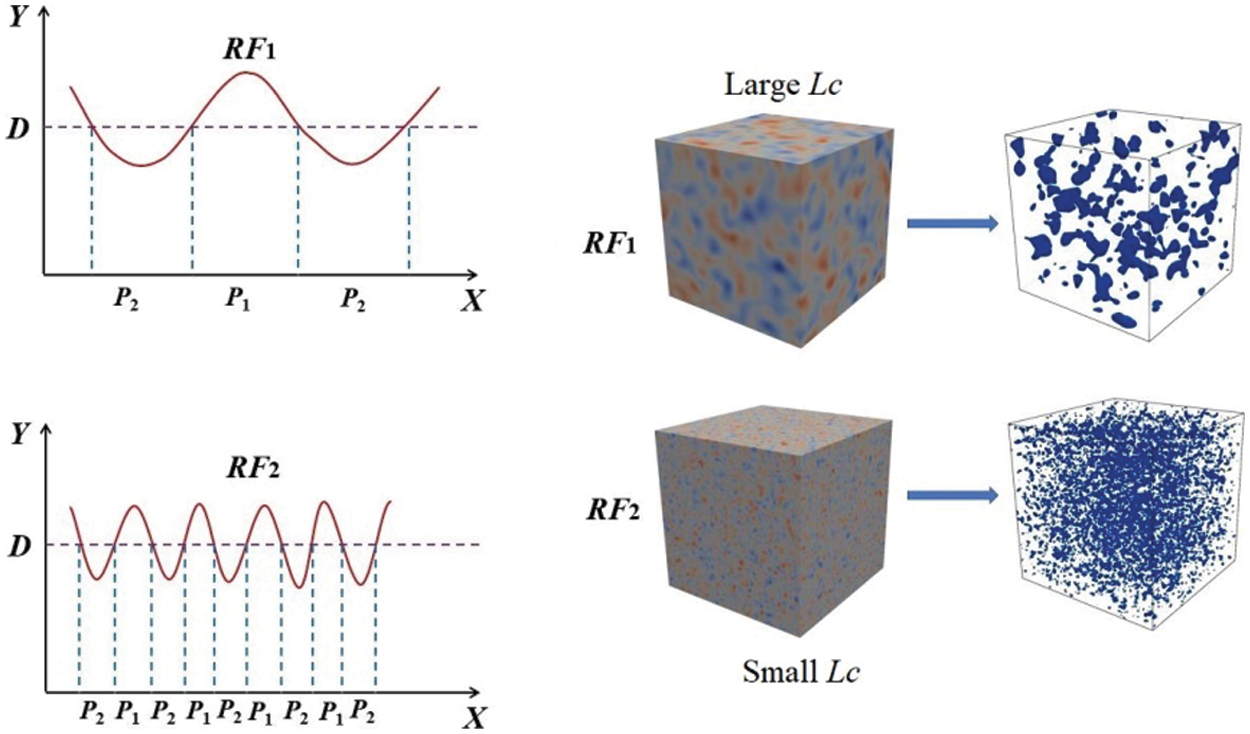
Figure 5: Continuous Gaussian random field transforms into binary field
According to the study of Adler et al. [20,21], For a Gaussian random field that satisfies the standard normal distribution (expectation = 0, standard deviation = 1), the probability density function
Suppose that phase P1 represents the pores and phase P2 stands for the matrix, then the two-phase field is capable of representing porous media. The function
Notably, the fluctuation of a Gaussian random field is determined by correlation length (LC) [20,21]. That is, for any couple of points a and b in a Gaussian random field, the correlation degree of RF(a) and RF(b) is measured by the covariance function:
If a and b denote different points (
The cement paste models (P-0.3, P-0.4, P-0.5) were built in a cube with a side length of 1 μm and a mesh division of 400 × 400 × 400, leading to a cell size of 0.0025 μm. Therefore, the model can cover the pore size ranges of 0.003–0.09 μm and 0.003–0.2 μm. The cement paste models are the results of the superposition of eight independent fields. The mortar models (M-0.3, M-0.4, M-0.5) were generated in cube of 0.3 μm with a grid division of 300 × 300 × 300. The cell size is 0.001 μm, and the investigated pore size range is 0.003–0.05 μm. The pore size range of mortar is relatively smaller compared with that of cement paste; thus, the model is created by superimposing six independent fields with different Lc values. The related parameters are provided in Table 4, and the generated models are shown in Fig. 6. It should be noted that the total porosity of a model includes open and close pores. By contrast, only open porosity can be measured by the MIP test, and thus, the open porosity of the generated model should be further verified (refer to Subsection 3.2).
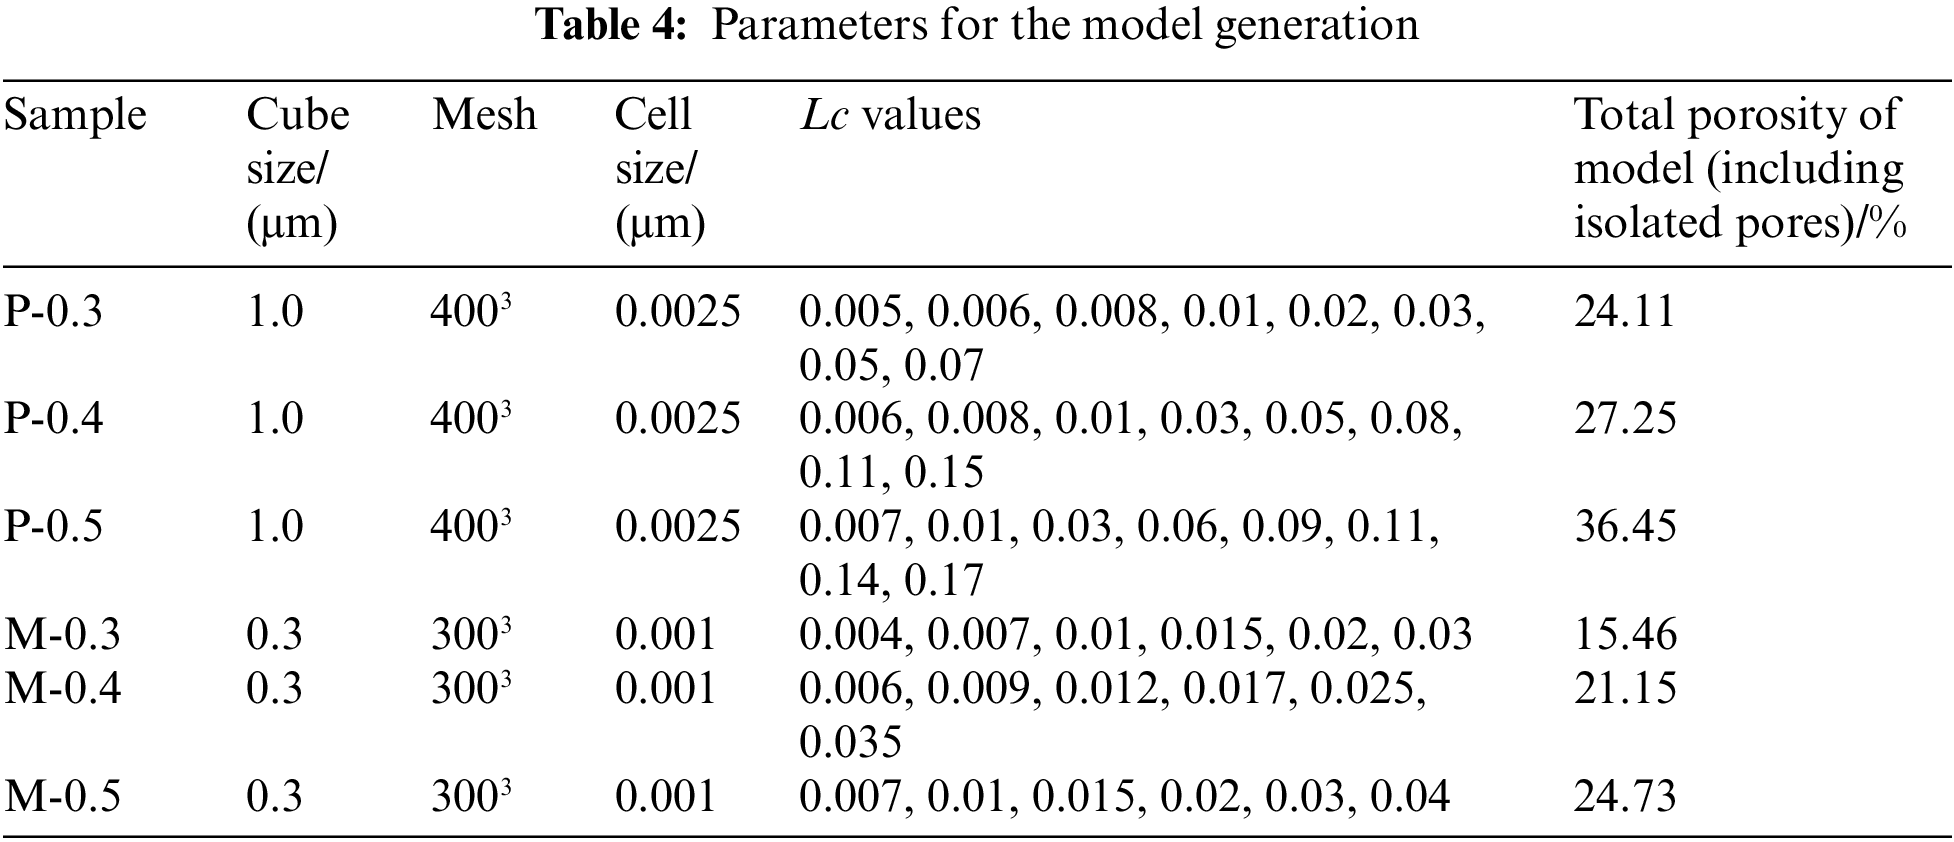
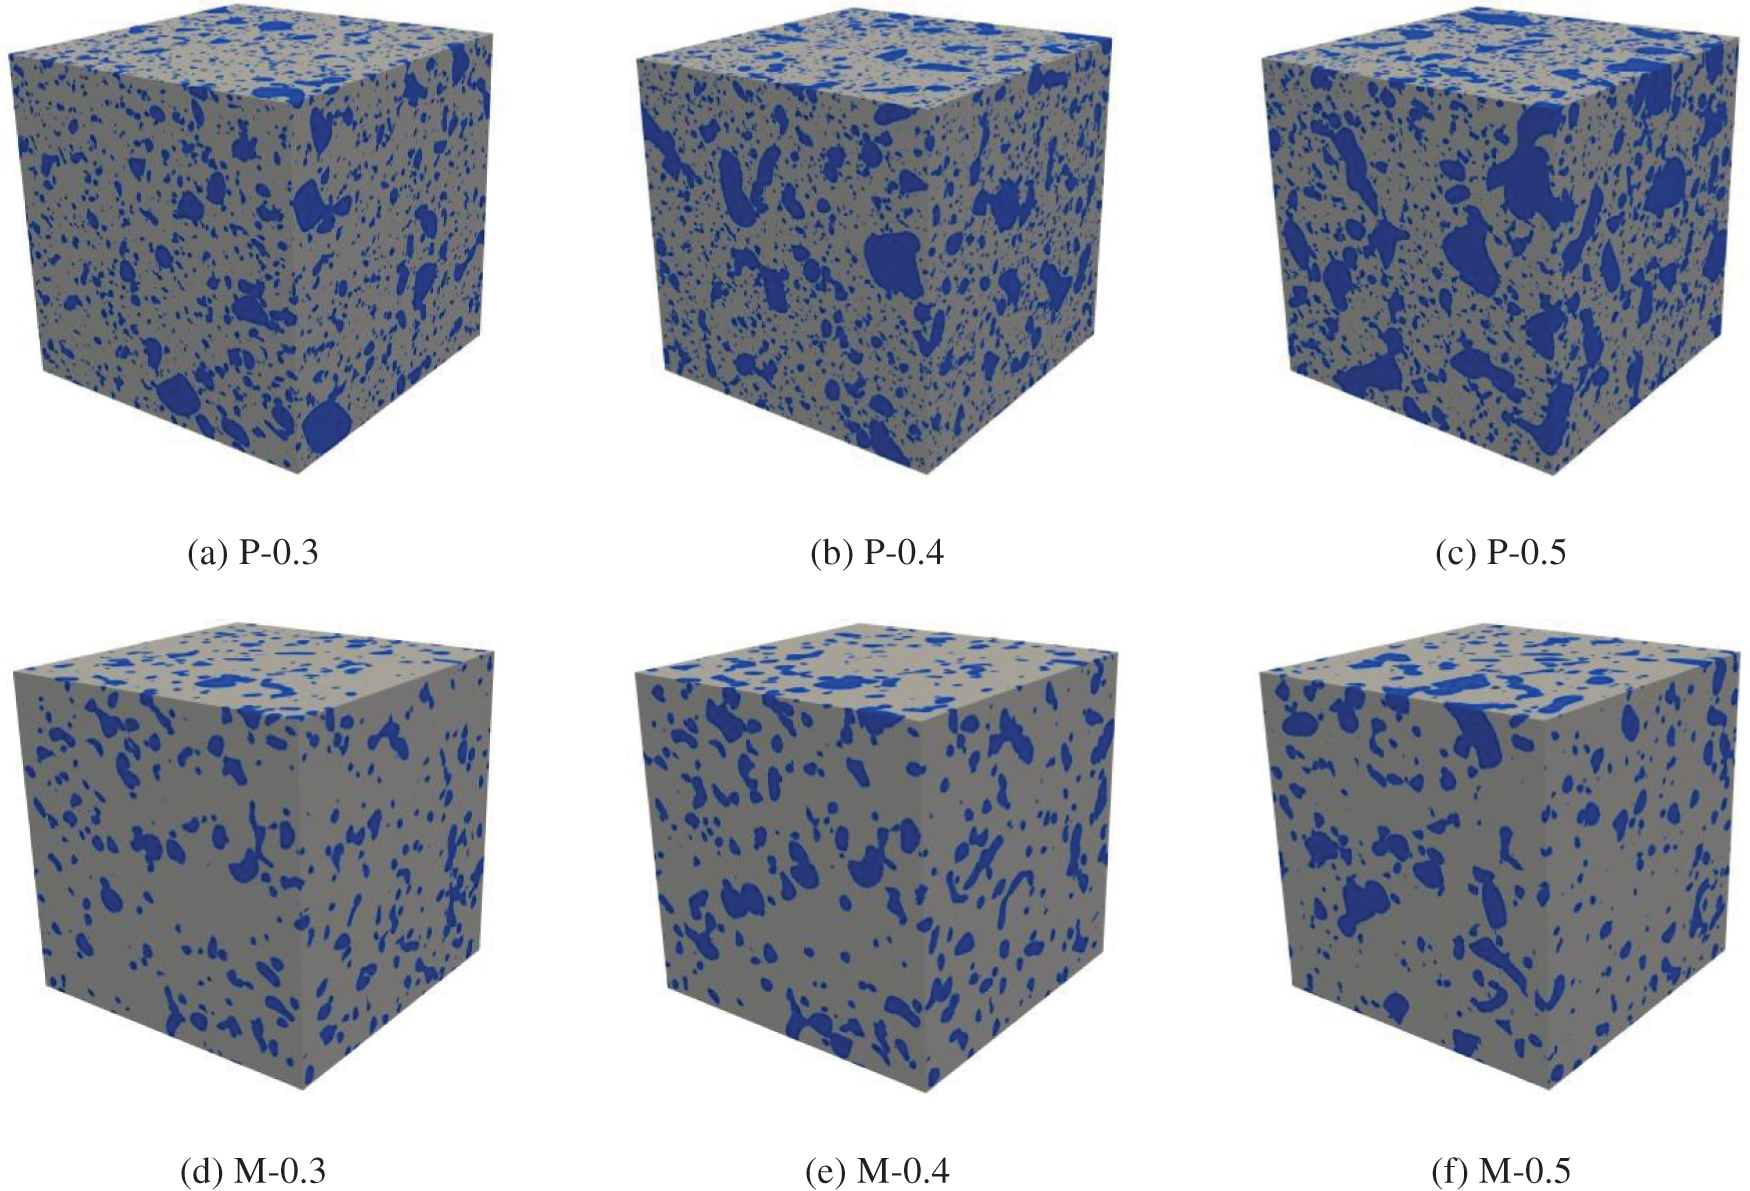
Figure 6: Generated 3D models of cement paste and mortar (gray-matrix, blue-pore space)
Model validation is accomplished by verifying pore size distribution and open porosity by using the image analysis method of mathematical morphology. Mathematical morphology is a theory and technique for analyzing and processing geometric structures; it is commonly used in binary images [23–25]. It contains basic operations such as erosion, dilation, morphological opening, morphological closing and geodesic reconstruction. As shown in Fig. 7a, the morphological opening operation can compare an image with a certain shape (structure element) and eliminate parts of the initial image that are smaller than or equal to it. This operation can be expressed as:
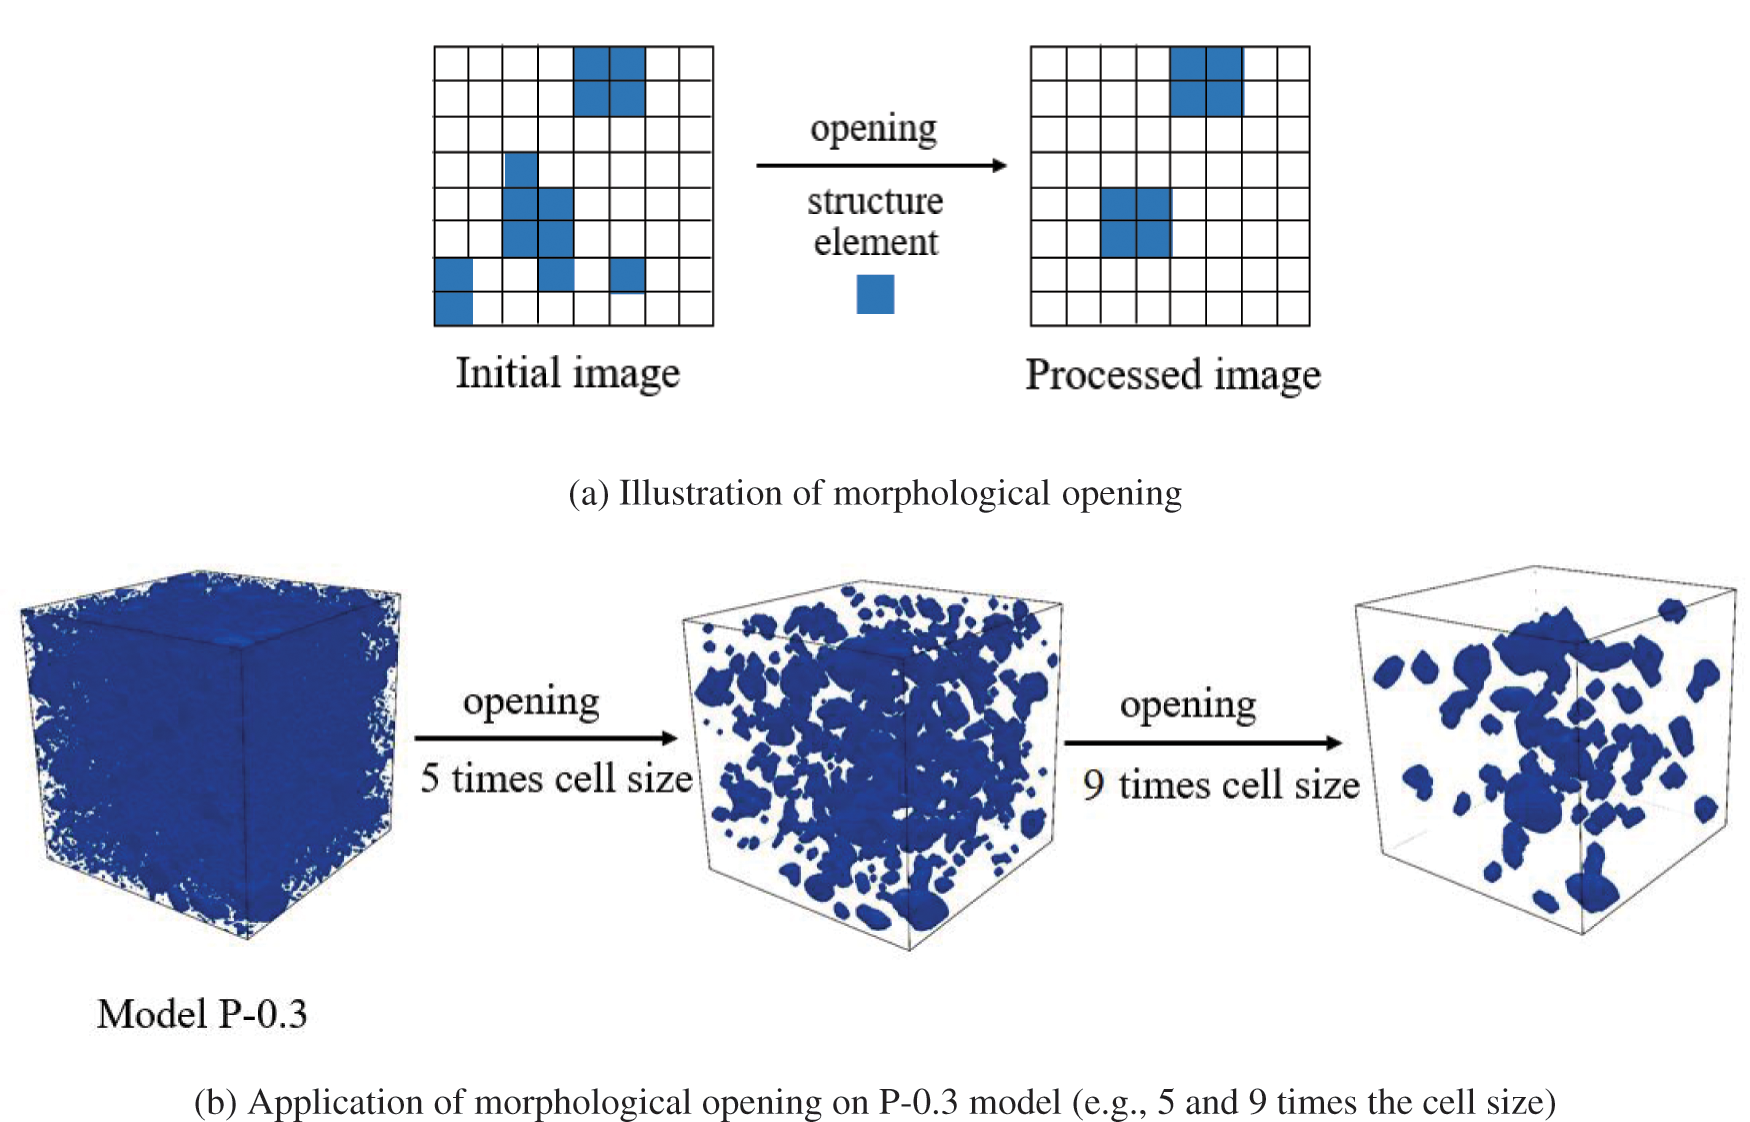
Figure 7: Morphological opening operation
Geodesic reconstruction is used to extract components that are connected to the boundary of an image. In the current work, it is numerically implemented and applied to extract open pores in a pore space model. As illustrated in Fig. 8a, the mechanism of this operation is a recursive algorithm of boundary element dilation for the size of the selected structure element, followed by an intersection with the initial image. The calculation ends when no additional part is identified after the intersection; thus, the components are connected to the boundary will be extracted. This operation can be expressed as:
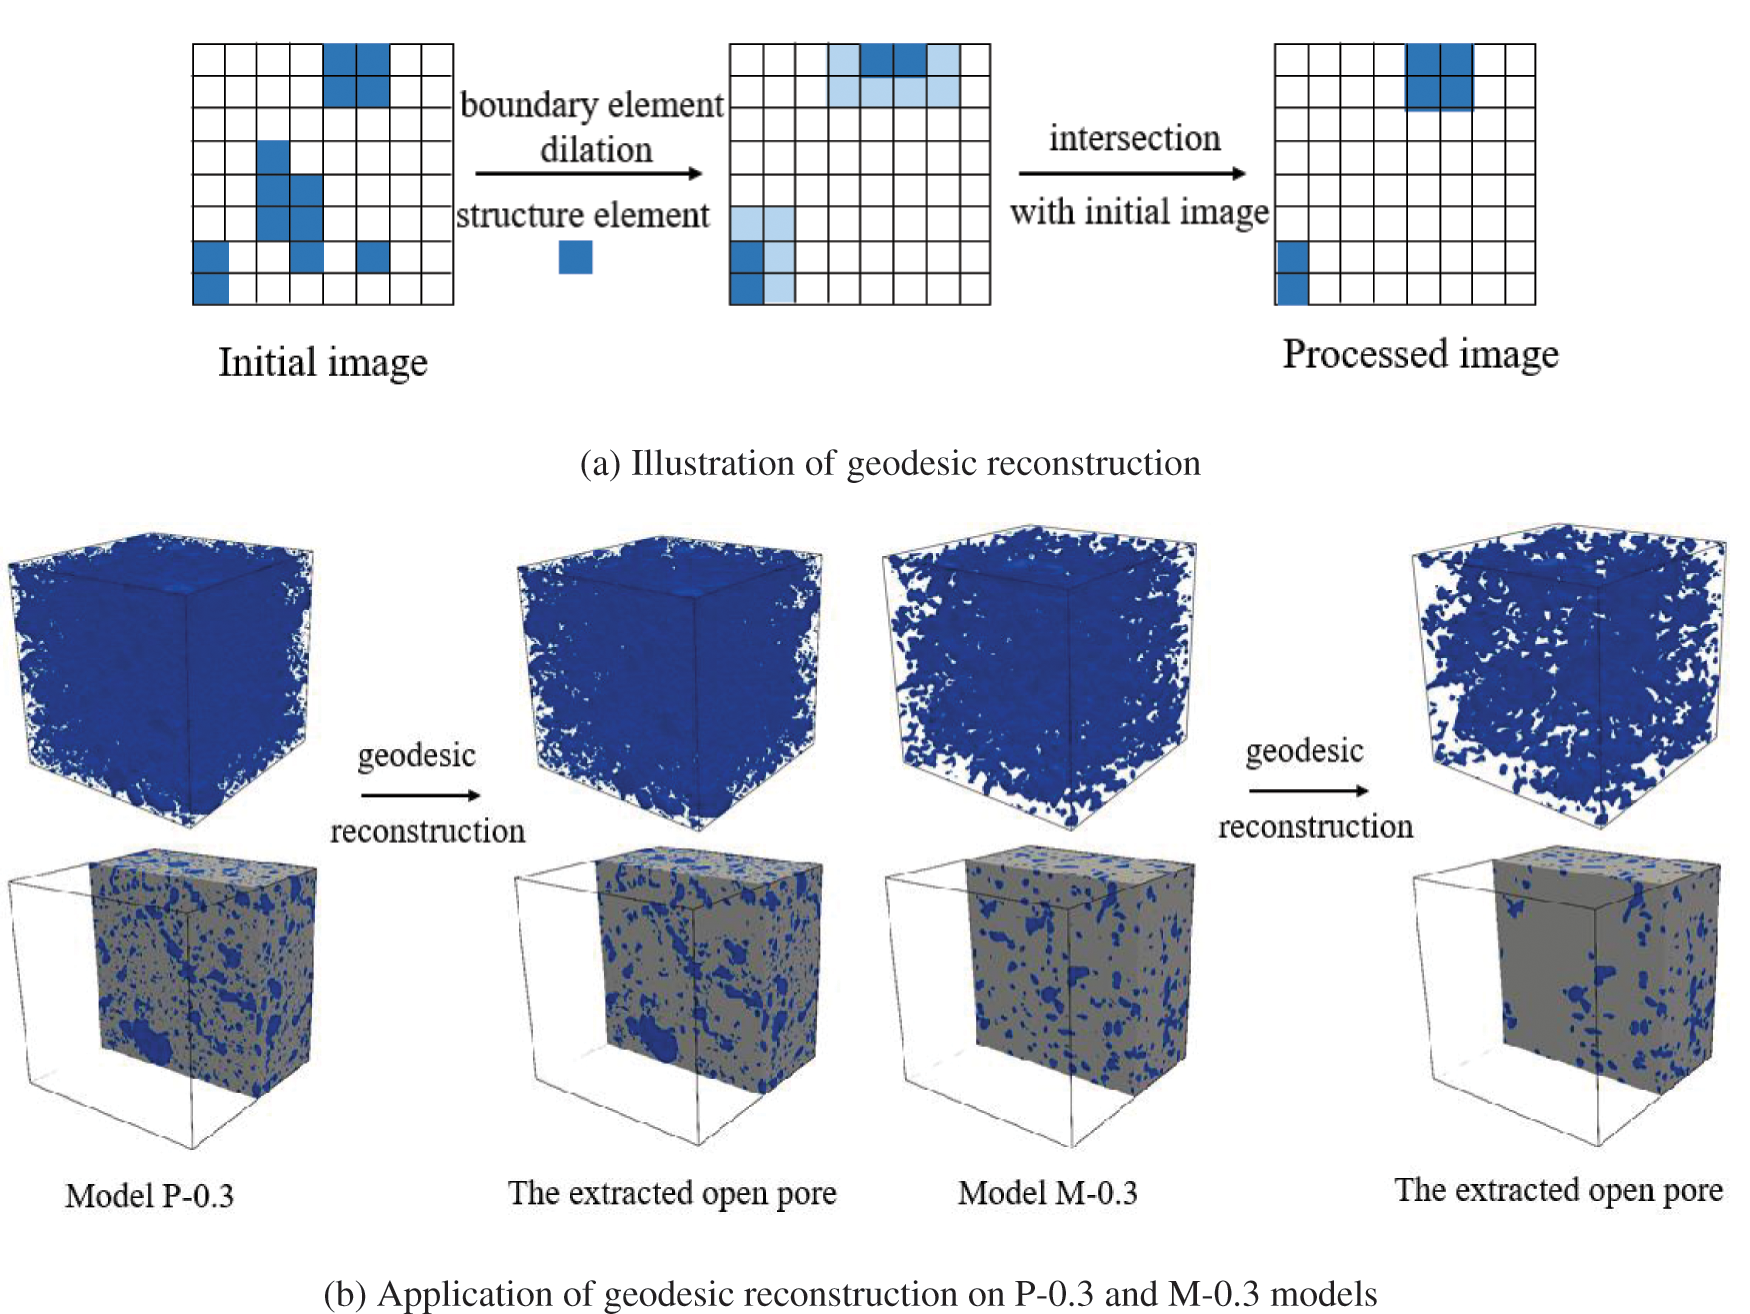
Figure 8: Geodesic reconstruction operation
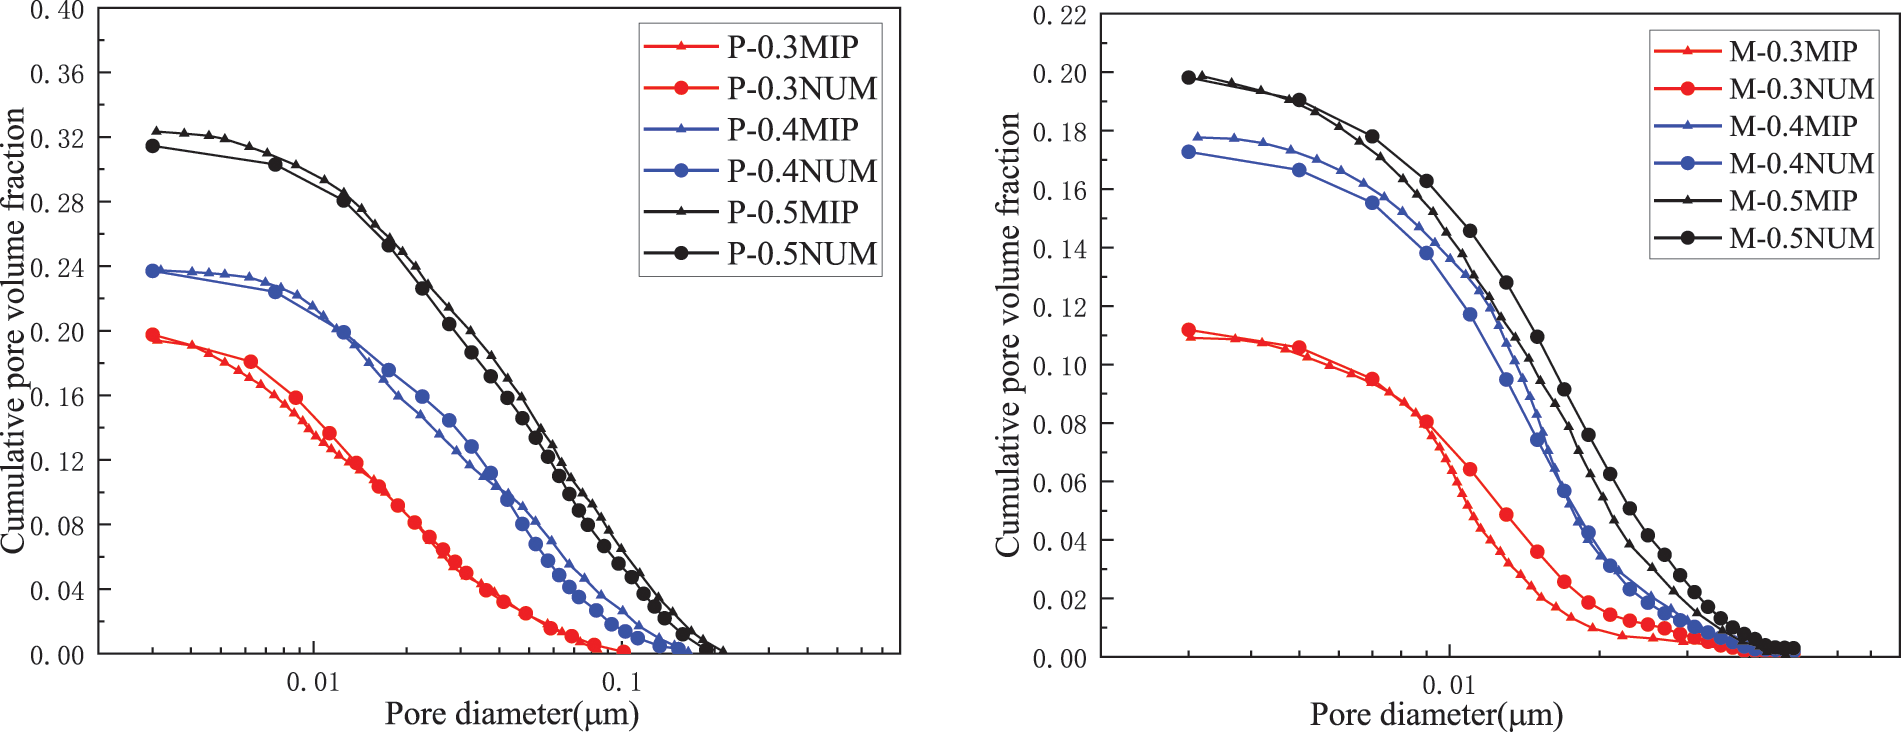
Figure 9: Comparison between the cumulative pore size distribution curves of the generated model and the experimental data
In summary, the model generation and validation are finished following the five steps: 1. investigate the pore space characteristics of the material (open porosity and open pore size distribution obtained from the MIP test) and preset Lcs of random field distributed within the studied pore size range; 2. Investigate the experimental pore size distribution curve, preset a porosity for each field and calculate the threshold; 3. Perform the two-phase transformation; 4. Combine two-phase fields; 5. Numerically investigate the open porosity (using the geodesic reconstruction operation) and the pore size distribution (using the morphological opening operation) of the generated model, and then adjust parameters. The methods of adjustment include: increase or decrease the Lc of each field, increase or decrease the porosity of each field, add or delete field to guarantee all the pores in the studied size range can be simulated with correct proportions.
4 Simulation of Adsorption and Desorption in Cement-Based Materials
d denotes the minimum size of the drained pore during the desorption process and the maximum size of the water-filled pore during the absorption process; it can be estimated via the Kelvin-Laplace equation [27,28]:
Condition: Standard atmospheric pressure and 20°C.
For example,
In accordance with the experimental result, a hysteresis phenomenon occurs between the isothermal adsorption and desorption processes. This phenomenon is attributed to the fact that the sequence of pore drainage depends not only on size but also on arrangement. Large pores that are connected outward through small pores will not drain at the corresponding RH because the path is blocked by small pores. “Large pores” are called “ink-bottle” pores, and this phenomenon is known as the “ink-bottle” effect. The drainage of ink-bottle pores occurs when RH decreases to the value that corresponds to the smallest size in the water migration path. The “ink bottle” effect should be considered in numerical simulation.
A schematic diagram of the desorption process with decreasing RH is shown in Fig. 10. Pores A1 and pore A2 have the same size; however, at the same RH value (third image in the figure), pore A1 drains while pore A2 does not, because pore A1 is connected outward through the larger pore C1, while pore A2 (the belly) is connected outward through the smaller pore B2 (the neck), forming an “ink-bottle” pore that will drain with pore B2 at a lower RH.
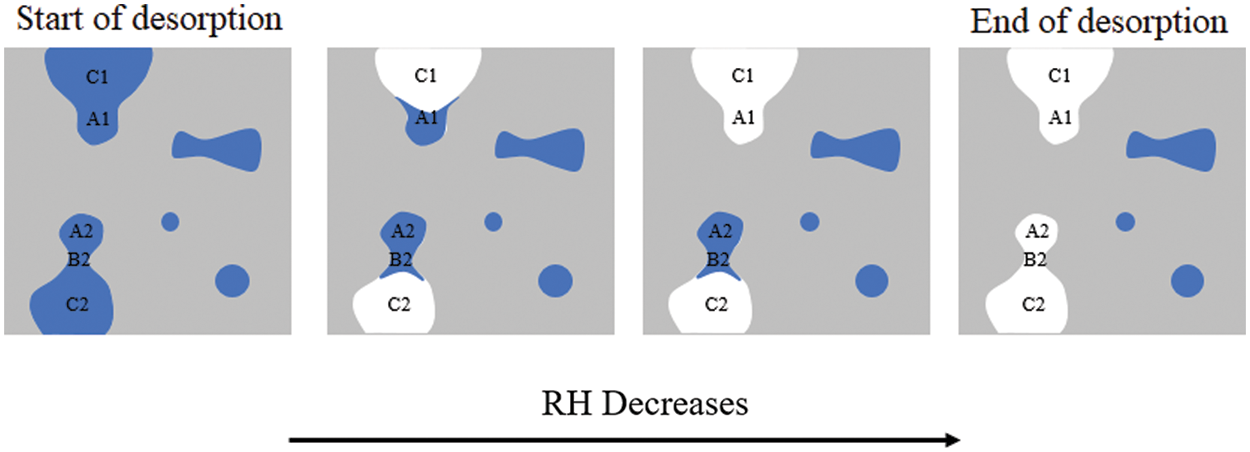
Figure 10: Illustration of desorption process and ink-bottle effect
The scenario of the numerical simulation of desorption is designed on the basic of the image analysis operation of mathematical morphology. In the 1st step, the characteristic diameter d at different RH values is calculated using the Kelvin-Laplace equation and set as the size of structure element, as shown in Fig. 11. The pore network is then processed via the morphological opening operation to filter out pores larger than the structure element. In the 2nd step, the processed image is subjected to geodesic reconstruction to extract pores connected to the boundary, from which the drainage mass is obtained at each RH during the desorption process. In the case of a large pore connected to the outside through a small pore, the small pore will be deleted after morphological opening. Following the geodesic reconstruction, the large pore will be judged as a close pore and thus is without drainage at the current RH. It will wait for a lower RH to be able to drain. m1, m2 and m3 denote the cumulative desorption mass of water as RH decreases.
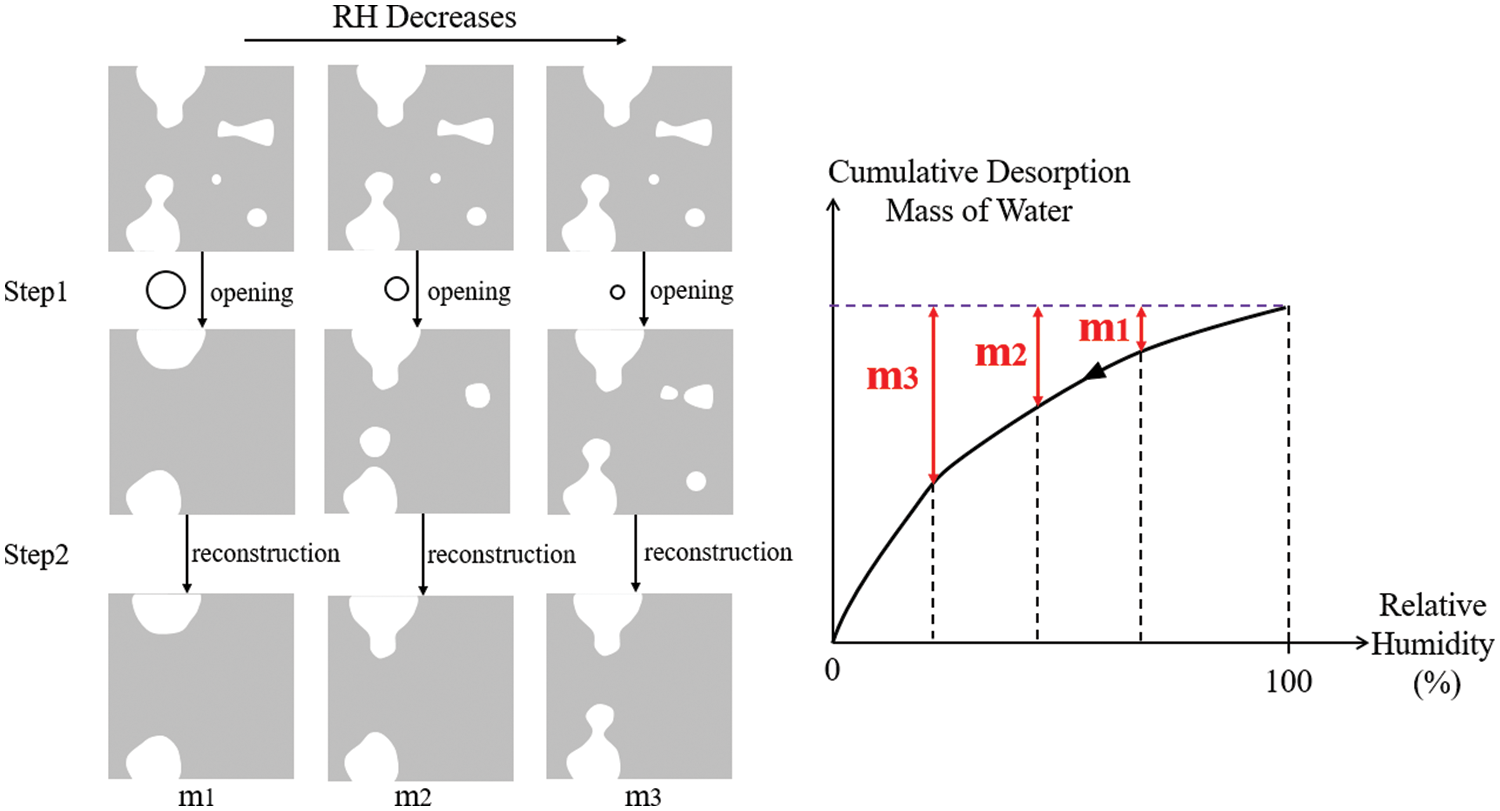
Figure 11: Illustration of the numerical calculation scenario for the drainage mass of water in desorption process
A schematic diagram of adsorption characteristics with increasing RH is shown in Fig. 12. The order of filling during adsorption differs from the order of draining during desorption due to the presence of ink-bottle pores. When RH rises, the small pore B2 is filled first, followed by the large pore A1, and then C1 and C2. The belly of “ink-bottle” A2 will eventually be filled following the dissolution and diffusion of gas molecules.
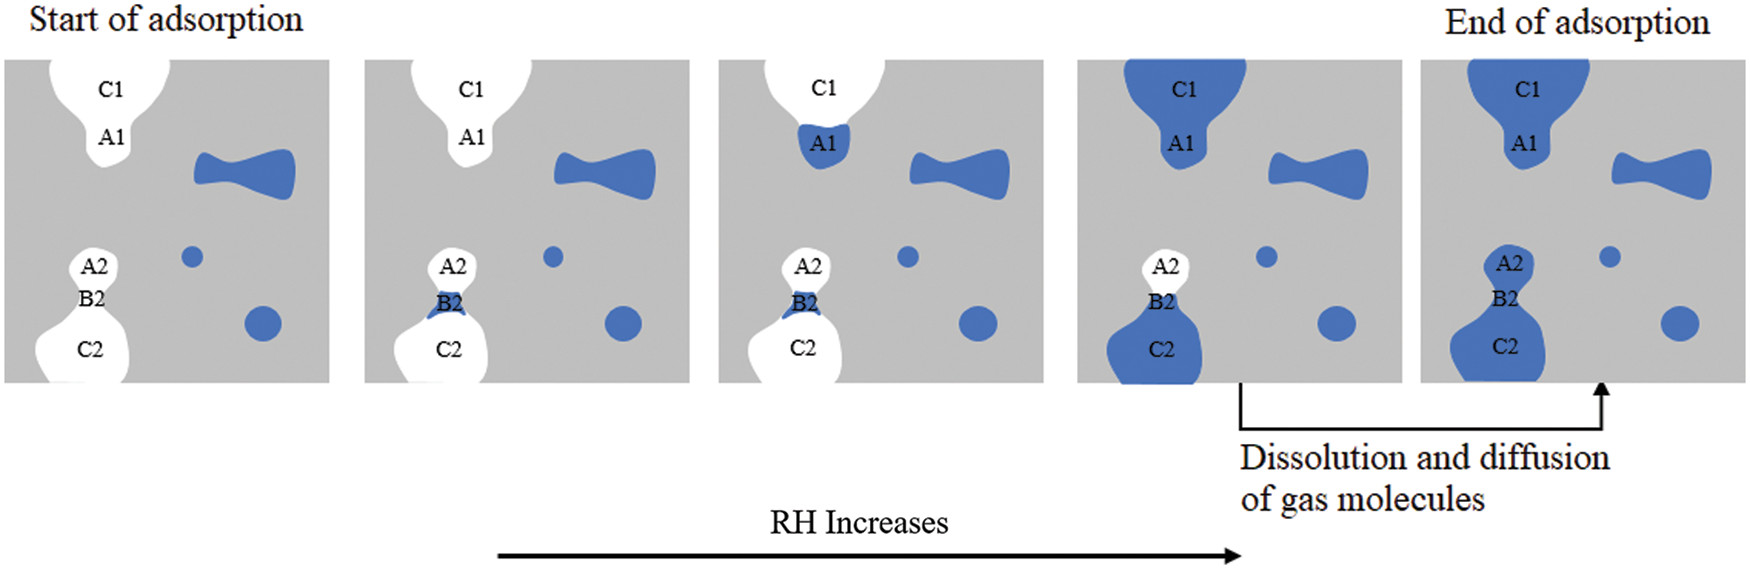
Figure 12: Illustration of adsorption process and ink-bottle effect
The idea of the numerical simulation of adsorption is illustrated in Fig. 13. To calculate filling mass of water from RH A to RH B (B > A) during the adsorption process, the 1st step is to obtain the desorption image at RH A (e.g., m1, m2 and m3 in Fig. 11). The 2nd step is to apply the morphological opening operation to the open pore network (the result of geodesic reconstruction on the initial pore space model). The size of the structural element is the size of the characteristic diameter d at RH B. The 3rd step is to perform a subtraction between the results of the 1st and 2nd steps, and then the new filling parts from RH A to RH B are obtained (blue parts m4, m5, and m6). The combination of Figs. 12 and 13 indicate that m4 = mass of water filling B2, m5 = mass of water filling A1, and m6 = mass of water filling C1 + C2. To provide a specific example of calculating the filling mass of water from 50% RH to 60% RH, the 1st image of desorption at 50% RH is indispensable, and then, the morphological opening is performed on the open pore space by using the size determined by 60% RH (0.004 μm) to obtain the 2nd image. Finally, the 2nd image is subtracted from the 1st image to calculate the filling mass of water from 50% RH to 60% RH.
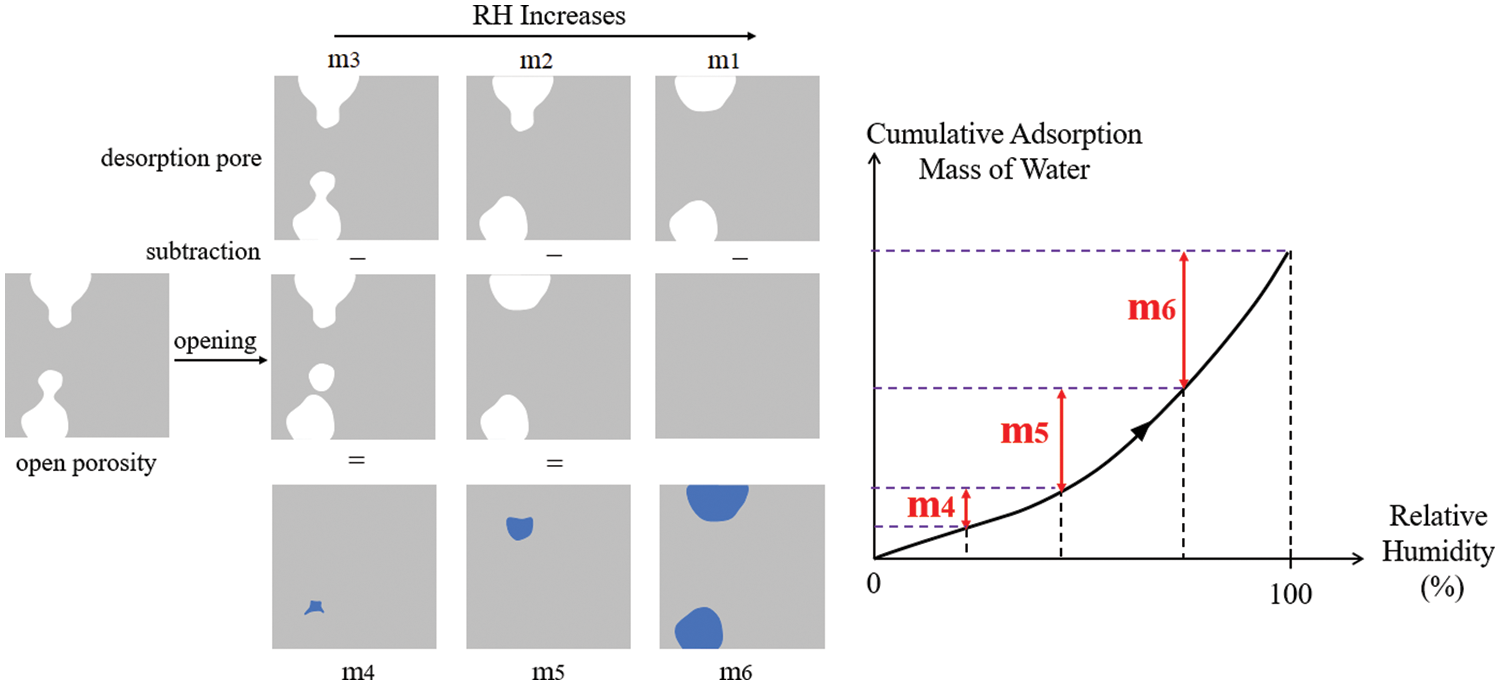
Figure 13: Illustration of the numerical calculation scenario for the filling mass of water in adsorption process
In the simulation work, as illustrated in Figs. 11 and 13, by defining structure elements with different sizes and applying in the morphological opening operation, RH values can be determined according to the Kelvin-Laplace equation, and the cumulative desorption and adsorption mass of water can be obtained via the proposed calculation scenario. The isothermal adsorption and desorption processes were simulated on the basis of the constructed pore structure models of cement paste and mortar. The results are compared with the experimental data in Fig. 14. The simulated desorption curve always locates above the adsorption curve, and the hysteresis behavior exists in the whole RH interval, further verifying the existence of “ink-bottle” pores in the microscopic pore network. Notably, five RH values (20%, 40%, 60%, 80% and 100%) were selected for the adsorption-desorption experiment conducted in this work, and the points of the saturation degree that corresponded to two adjacent humidity levels were connected by a straight line. In fact, the saturation degree does not necessarily satisfy linear variation, and thus, it will cause a certain difference between the experimental and numerical results. The simulated curves can better reflect the characteristic of water transport during the adsorption-desorption process. When 100% RH is reached, the saturation degree of adsorption is about 75%–85%, indicating the existence of 15%–25% ink-bottle pores, which will be filled subsequently following the dissolution and diffusion of gas molecules, as shown in Fig. 12.
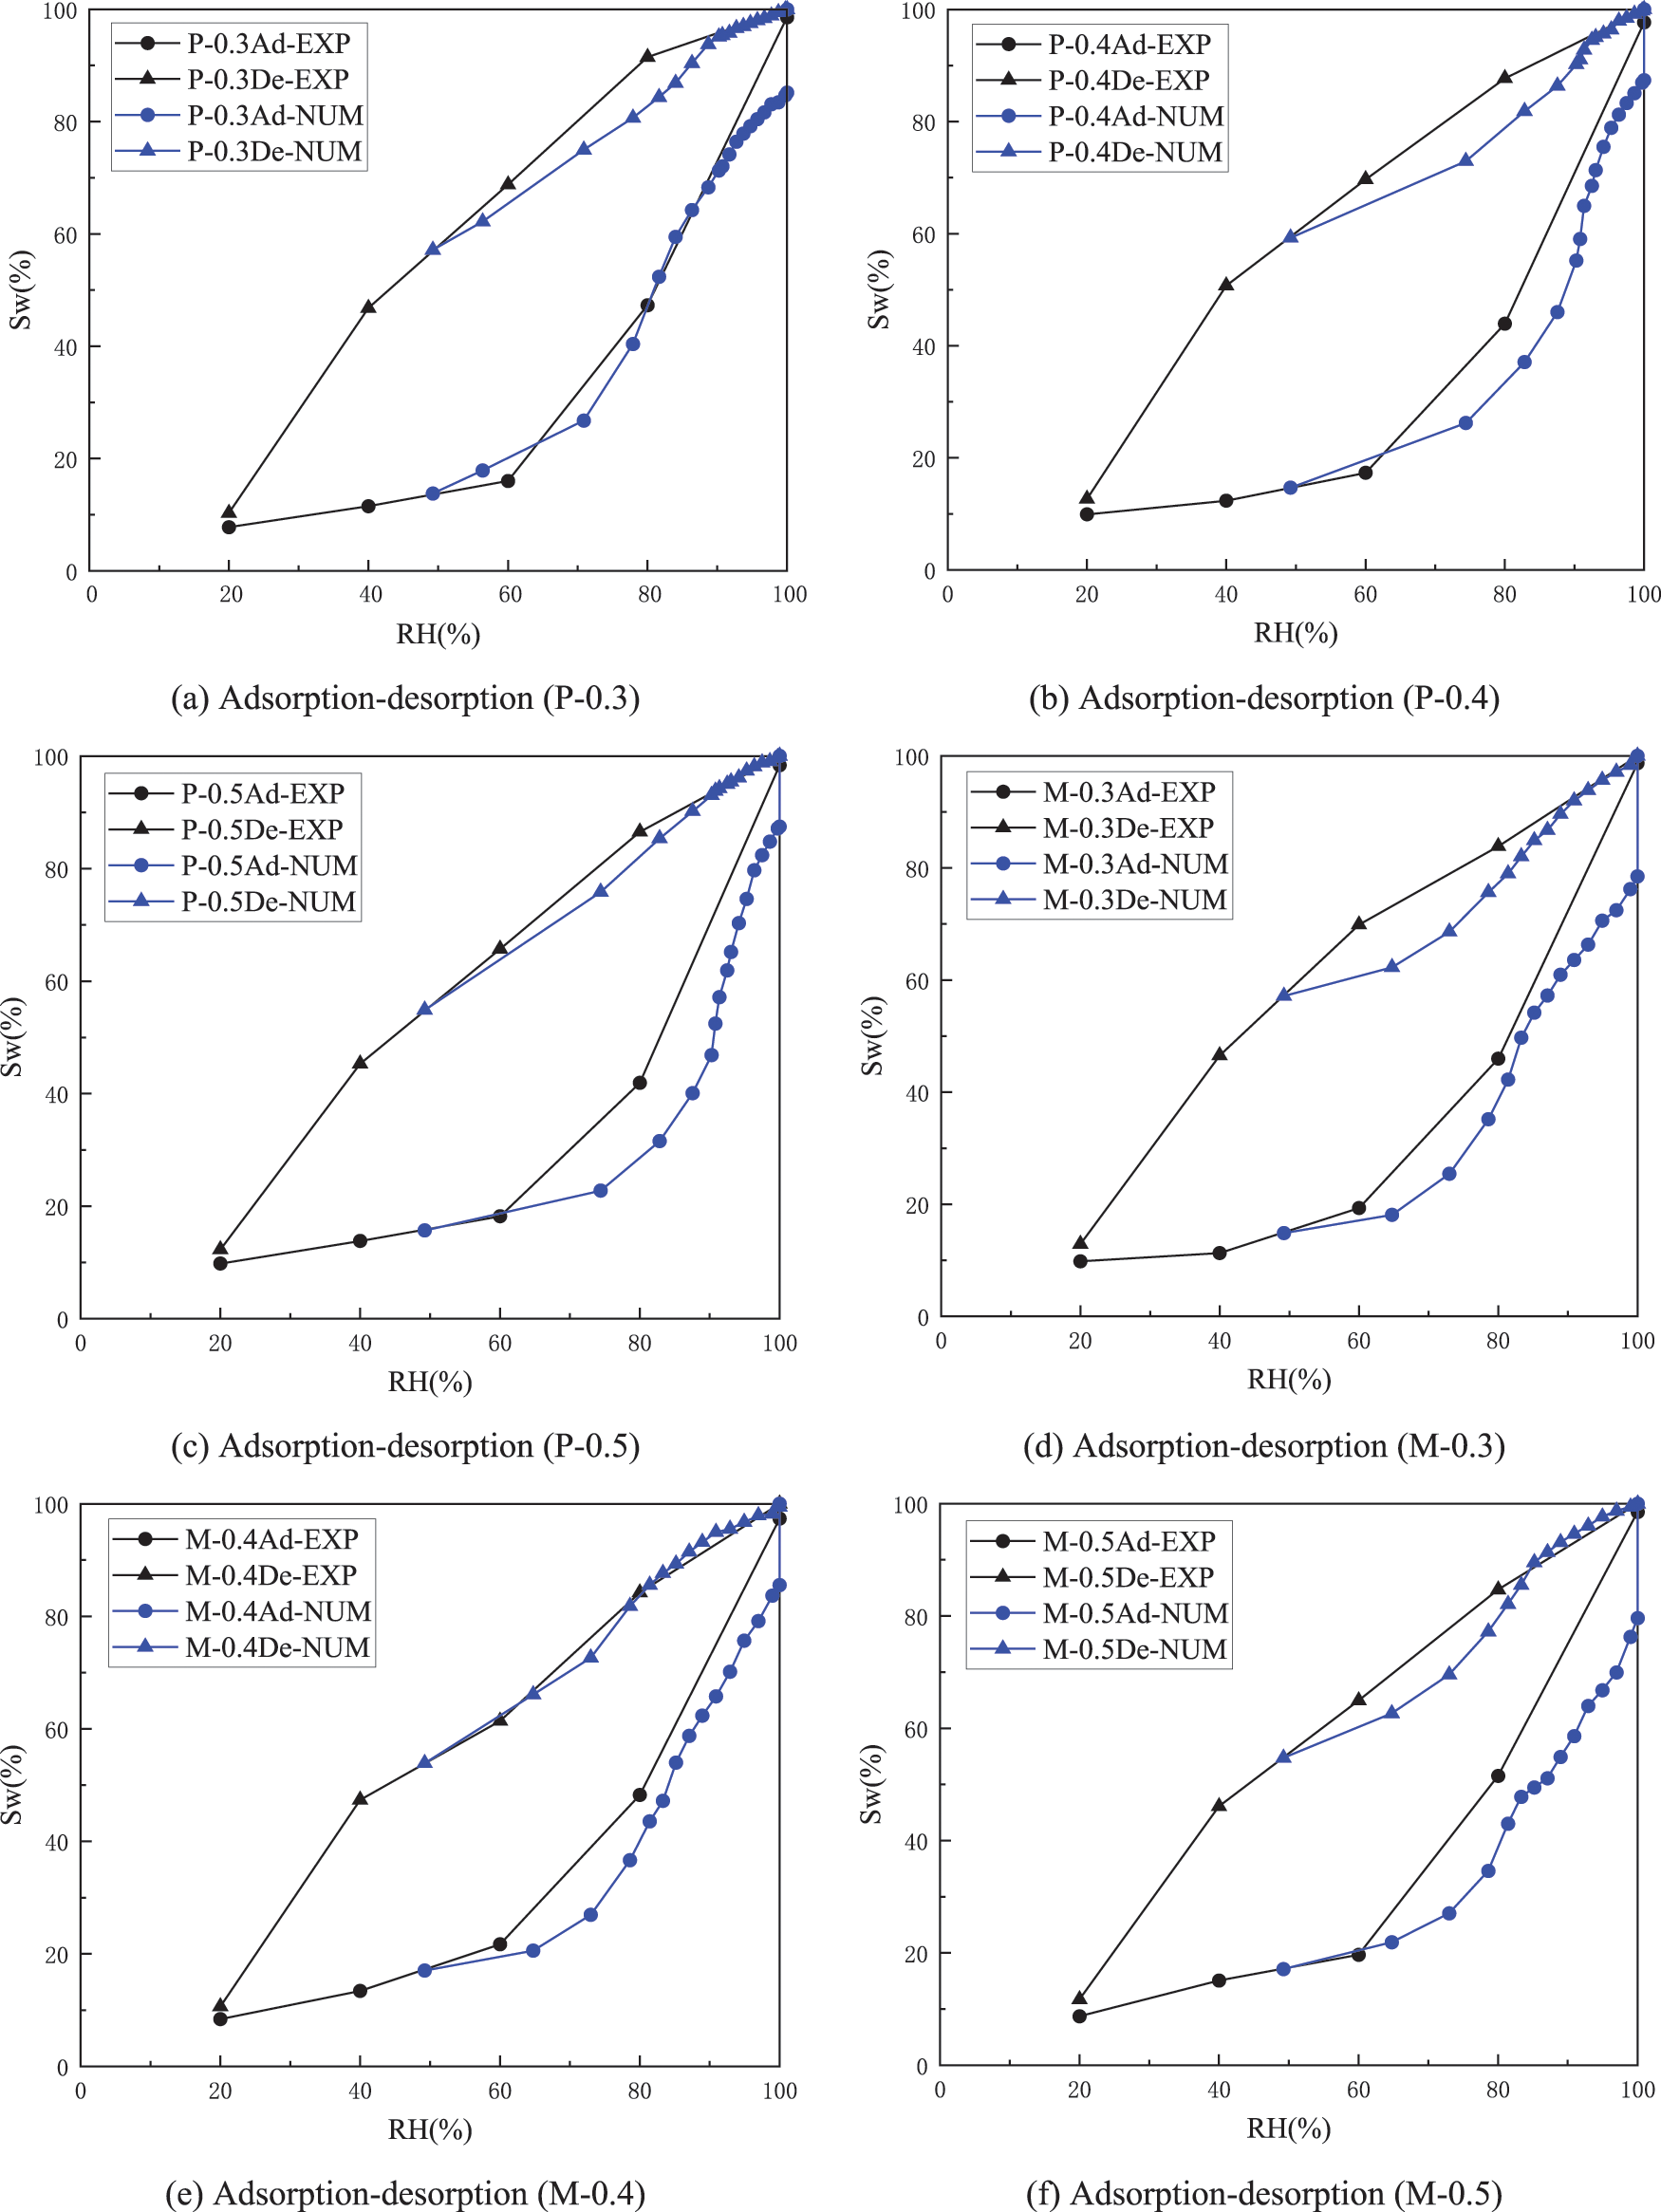
Figure 14: Comparison between the experimental and numerical results of isothermal adsorption-desorption in cement-based materials
In addition, the model was generated on the basis of the pore size distribution obtained from MIP test. The pore size ranges are 0.003–0.09 μm for P-0.3, 0.003–0.2 μm for P-0.4/P-0.5, and 0.003–0.05 μm for M-0.3/M-0.4/M-0.5. No pores smaller than 0.003 μm are found inside. According to the Kelvin-Laplace equation, this size is the characteristic diameter that corresponds to 49% RH. Therefore, the starting point of the simulated adsorption curve and the end point of the desorption curve are chosen to be the experimental values at 49% RH. The investigation is focused on 49%–100% RH interval. The experimental curve shows that a certain adsorption effect still exists in the 0%–49% RH interval. This phenomenon may be attributed to two reasons. 1. The sample may have a part with tiny pores that measure less than 0.003 μm. Limited by the performance of Autopore IV 9500, the smaller the pores, the more difficult they are to detect. The part with tiny pores might not have been traced in the MIP test, and therefore, was omitted from the model creation. However, they will complete water saturation during the growth of 0%–49% RH. 2. Water saturation is a gradual accumulation process. It is not that the corresponding pores are filled instantly when a certain RH value is reached, but water is progressively adsorbed as humidity increases, and the filling is completed in the corresponding pores when the RH value is reached. Consequently, a certain adsorption effect still exists in 0%–49% RH. From this perspective, it also explains why the major part of the simulation curve lies below the experiment curve. In general, the simulation results are close to the experimental ones, verifying the effectiveness of the adsorption-desorption theory and the numerical simulation scenarios.
Figs. 15a–15f show the adsorption and desorption of the P-0.3 model considering 56%, 71% and 78% RH. Meanwhile, (g), (h), (i), (j), (k) and (l) present the results of the M-0.3 model considering 65%, 73% and 79% RH. Since the structure element defined in morphological operations is related to the cell size which is different for the cement paste and mortar models, choosing the same RH values for comparison is impossible, and only values that are closer can be selected. These images illustrate that as RH decreases, an increasing number of small pores and ink-bottle pores are drained. As humidity increases again, large pores are gradually filled, eventually leaving a part of ink-bottle pores to be filled following gas dissolution and diffusion.
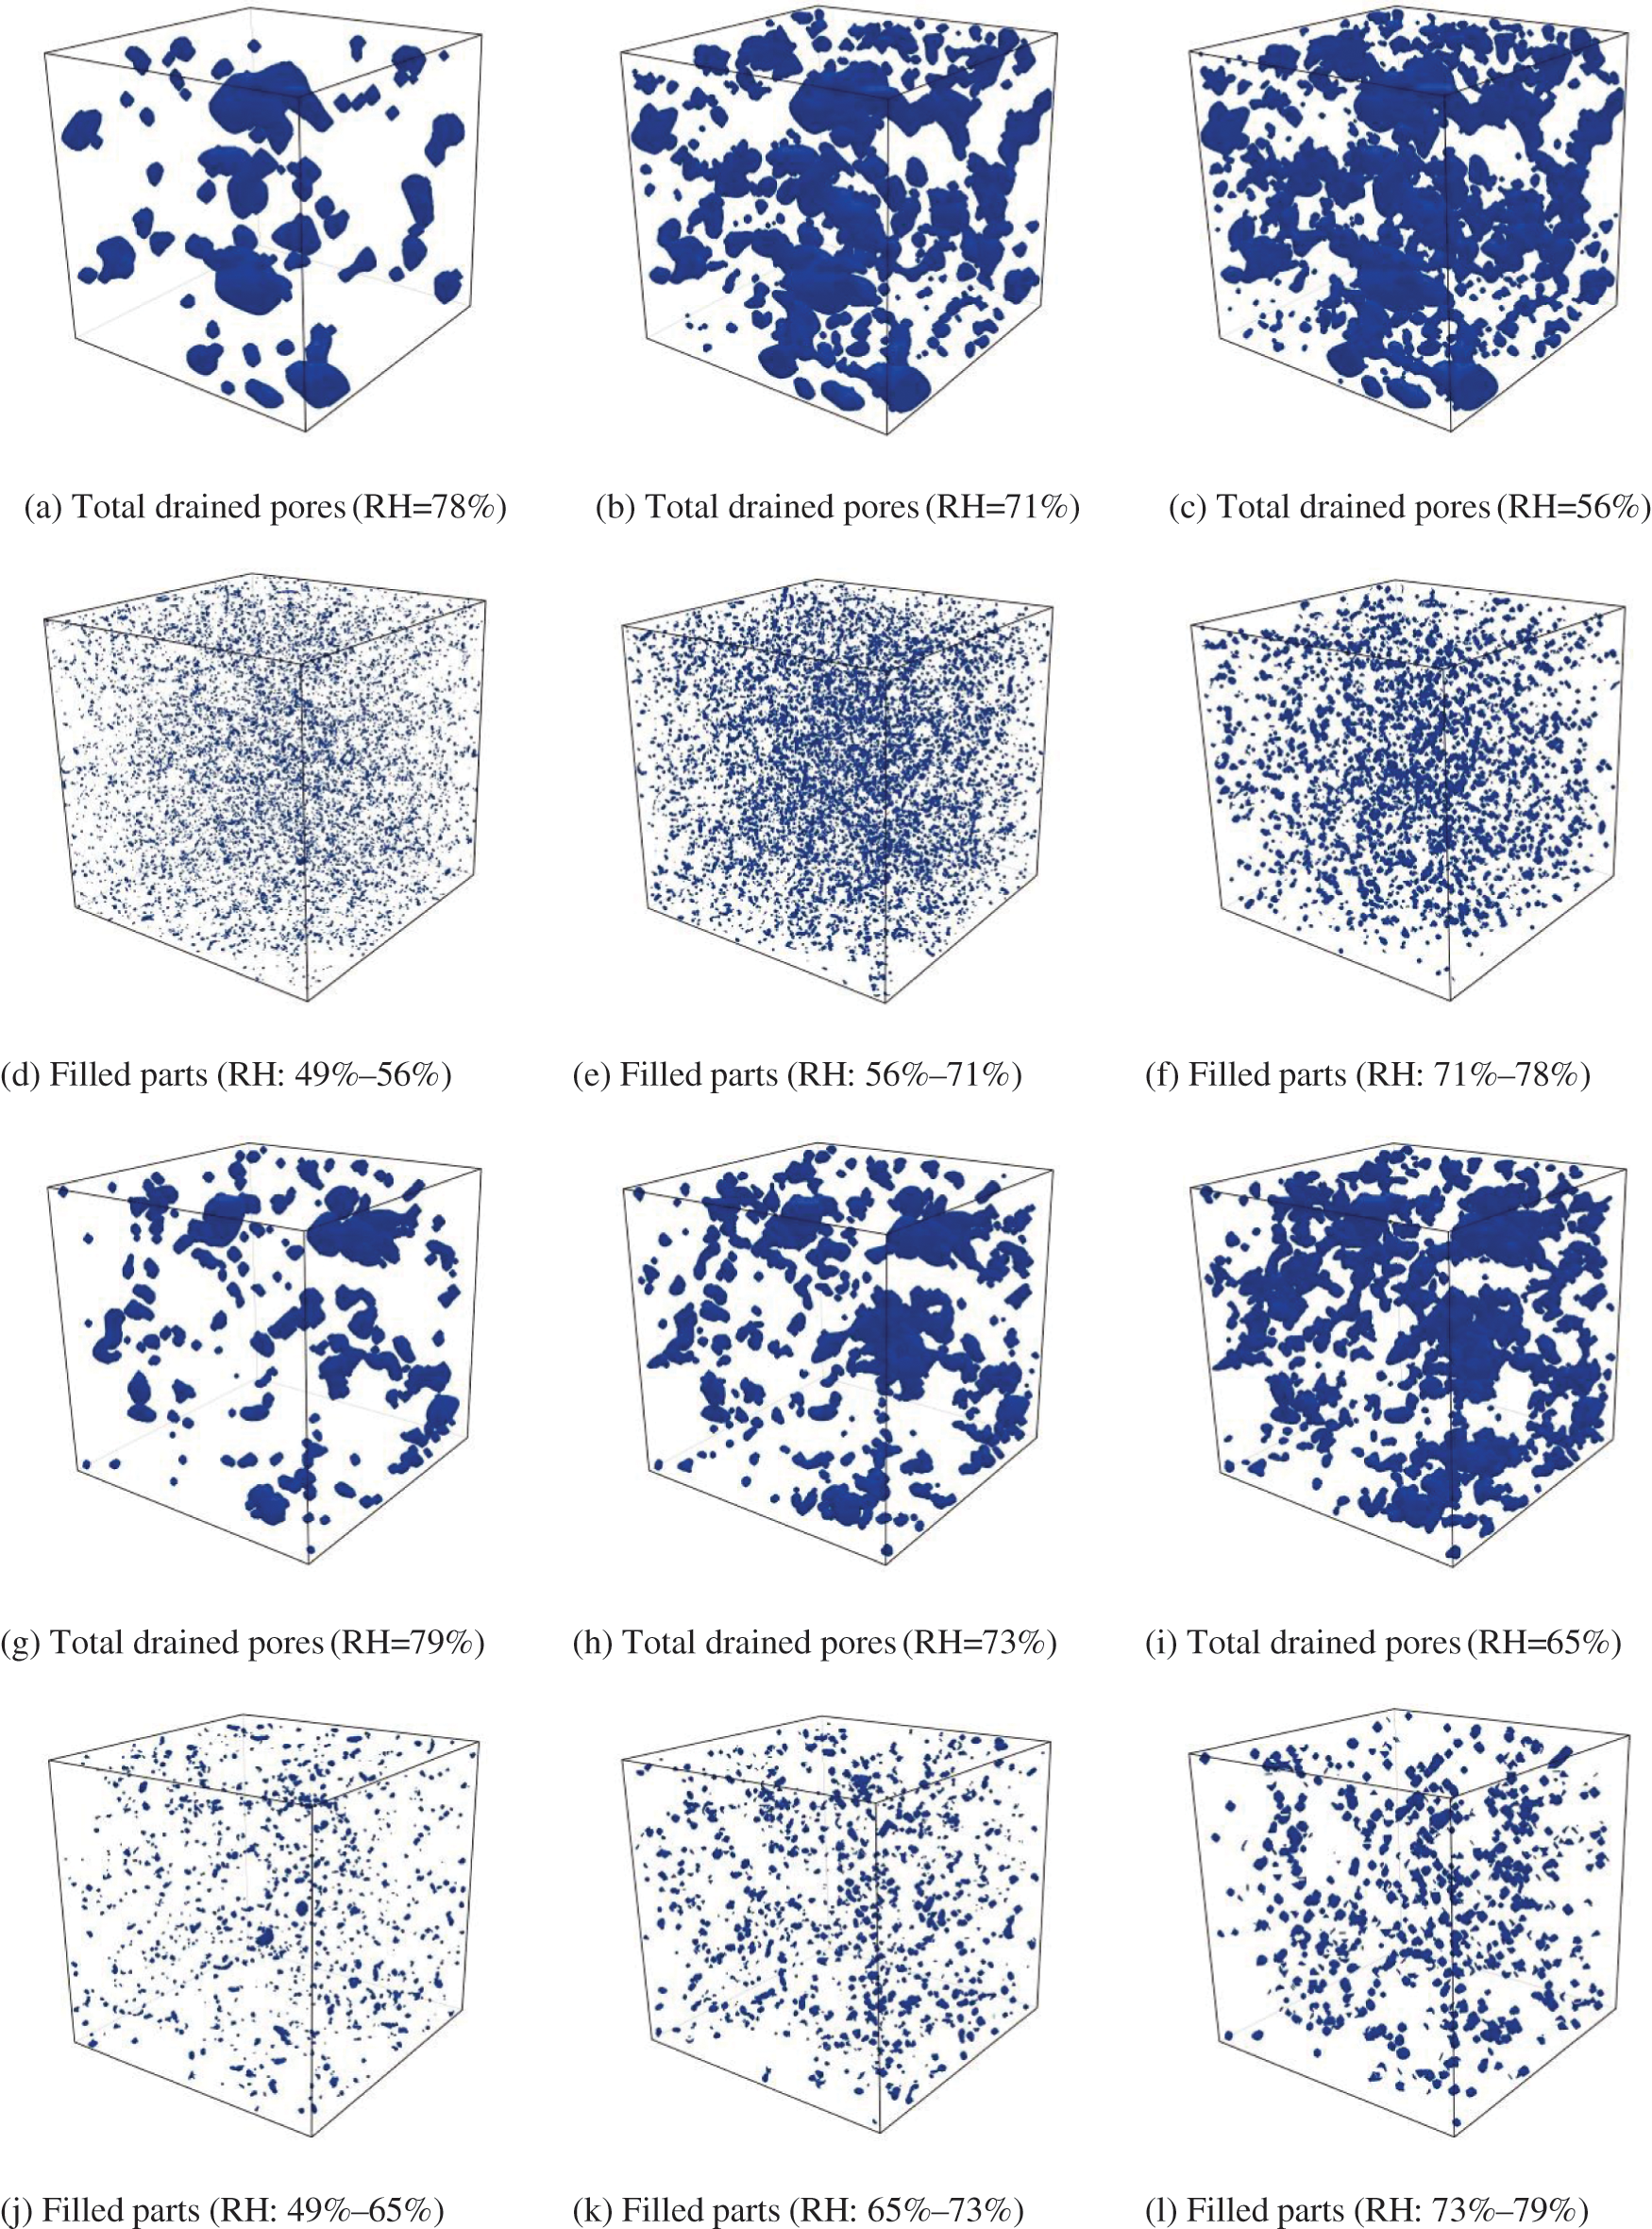
Figure 15: 3D adsorption-desorption images considering different RH values, P-0.3 model: (a)–(f), M-0.3 model: (g)–(l)
The subsequent research can be further improved from the following two aspects: 1. A study on the microstructure of cement-based materials with the use of instruments and means with greater measuring range and accuracy can determine the existence and proportion of tiny pores, and thus, improve the 3D pore structure model of material; 2. With regard to the numerical simulation, the grid division will affect the simulation results to a certain extent. The denser the grid division and the smaller the cell size, the larger the pore size range that the model can contain, on the one hand, and the more accurate the adsorption-desorption simulation will be, on the other hand. As shown in Fig. 16, the principle of searching for open pore space in a model by using the geodesic reconstruction method can be summarized as making the pore cell on the boundary dilate with a certain size (size of the selected structure element) and then intersect with the initial image to determine whether new pore cells are added. The cycle of “dilation + intersection” repeats until the processed image is unchanged and then the open pores are extracted. In Fig. 16, pores a and b have the same size and position but different grid densities. By using the same structure element size (e.g., two times the cell size) for geodesic reconstruction, the calculated open pore in the small grid is only a, while in the large grid, a and b will be defined as connected pores, increasing the proportion of large pores in the model. Therefore, using the smallest element is important in the application of geodesic reconstruction. Meanwhile, a smaller cell size allows the model to contain a larger range of pores and improve the accuracy of the calculation. However, the demands on computer performance will also increase.
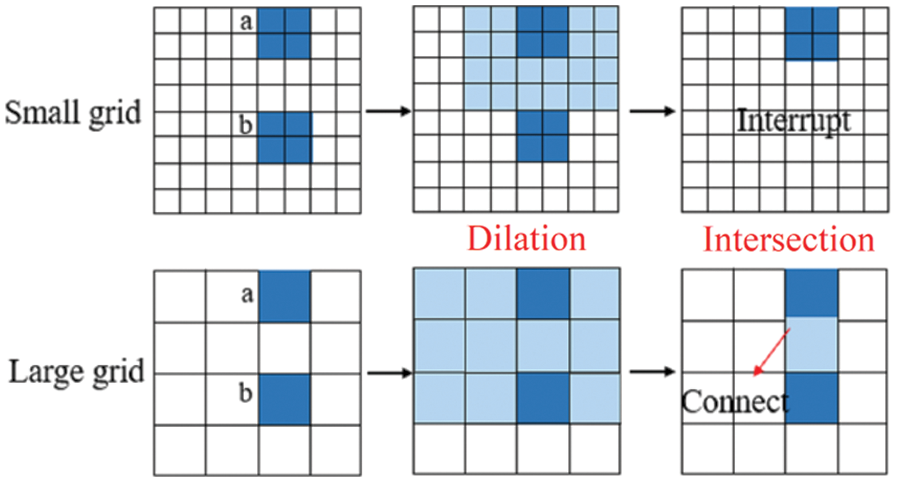
Figure 16: Influence of grid density on the result of numerical calculation
To investigate water transport during the isothermal adsorption and desorption of cement-based materials, the following research has been conducted:
1. Cement paste and mortar samples with water-binder ratios of 0.3, 0.4 and 0.5 were prepared. Isothermal adsorption and desorption experiments were performed by considering 20%, 40%, 60%, 80% and 100% RH. Significant hysteresis occurs between the two curves due to the “ink-bottle” effect. Pore structure parameters, such as pore size distribution and porosity, were obtained by conducting MIP test. The open porosities of P-0.3, P-0.4 and P-0.5 are 19.39%, 23.74% and 32.34%, respectively. Pore diameter mostly ranges from 0.003 to 0.09 μm in P-0.3, from 0.003 to 0.2 μm in P-0.4 and P-0.5. The open porosities of M-0.3, M-0.4 and M-0.5 are 10.91%, 17.77% and 19.86%, respectively. Pore size distribution is between 0.003 and 0.05 μm.
2. Based on the pore structure parameters, the 3D pore structure models of cement paste and mortar were constructed using two-phase transformation on the continuous Gaussian random field and the superposition of multiple fields. The generated models were numerically investigated and validated using the operations of morphological opening and geodesic reconstruction from the mathematical morphology image analysis method.
3. Water transport during the adsorption and desorption of cement-based materials is not only influenced by pore size but also by the spatial location. Considering the Kelvin-Laplace equation and the influence of “ink-bottle” pores, two numerical calculation scenarios based on mathematical morphology were proposed and applied to the generated model to simulate the adsorption-desorption process. The investigation was focused on 49%–100% RH interval. The simulated adsorption and desorption curves are close to those of the experiment, verifying the effectiveness of the presented model and methods. The results show that a certain adsorption effect still exists in the low RH range. This effect is due to the existence of tiny pores that are outside the measuring range of MIP, on the one hand, and the gradual accumulation process of adsorption, on the other hand. The simulation also reflects that the saturation degree of adsorption is about 75%–85% at 100% RH, indicating the presence of 15%–25% ink-bottle pores, which must be filled subsequently following gas dissolution and diffusion. In general, the simulated adsorption and desorption curves are close to those of the experiment, verifying the effectiveness of the presented model and methods. The obtained results characterize water transport in cement-based materials during variations in RH and further explain the hysteresis effect due to “ink-bottle” pores from the microscopic scale.
Acknowledgement: The authors wish to express their appreciation to the reviewers for their helpful suggestions. The authors also are deeply thankful for the support and contribution from journal editors.
Funding Statement: This work was supported in part by “The National Natural Science Foundation of China (No. 52168038)”, “Applied Basic Research Foundation of Yunnan Province (No. 2019FD125)”, “Applied Basic Research Foundation of Yunnan Province (No. 202201AT070159)”.
Conflicts of Interest: The authors declare that they have no conflicts of interest to report regarding the present study.
References
1. Homan, L., Ababneh, A. N., Xi, Y. (2016). The effect of moisture transport on chloride penetration in concrete. Construction and Building Materials, 125(25), 1189–1195. DOI 10.1016/j.conbuildmat.2016.08.124. [Google Scholar] [CrossRef]
2. Dong, B., Guo, B., Liu, Y., Yao, W., Hong, S. et al. (2018). Visualization and quantitative analysis of water transport evolution in cementitious materials. Journal of Shenzhen University Science and Engineering, 35(3), 285–291 (in Chinese). DOI 10.3724/SP.J.1249.2018.03285. [Google Scholar] [CrossRef]
3. Zhang, Q., Kang, Z., Ling, Y., Chen, H., Li, K. (2020). Influence of temperature on the moisture transport in concrete. Crystals, 11(1), 8. DOI 10.3390/cryst11010008. [Google Scholar] [CrossRef]
4. Zhang, Z., Angst, U. (2020). Modeling anomalous moisture transport in cement-based materials with kinetic permeability. International Journal of Molecular Sciences, 21(3), 837. DOI 10.3390/ijms21030837. [Google Scholar] [CrossRef]
5. Ibro, M., Verdier, J., Geoffroy, S., Cagnon, H., Bourbon, X. (2021). Prediction of moisture transfer in cement-based materials: Use of a porous network model to access transfer parameters. Cement and Concrete Research, 142(564), 106310. DOI 10.1016/j.cemconres.2020.106310. [Google Scholar] [CrossRef]
6. Baroghel-Bouny, V. (2007). Water vapour sorption experiments on hardened cementitious materials. Part II: Essential tool for assessment of transport properties and for durability prediction. Cement and Concrete Research, 37(3), 438–454. DOI 10.1016/j.cemconres.2006.11.017. [Google Scholar] [CrossRef]
7. Wu, Q., Rougelot, T., Burlion, N., Bourbon, X. (2014). Experimental investigation of the first desorption isotherm of a high performance concrete with thin sliced samples. Cement and Concrete Research, 72, 389–397. DOI 10.1016/j.conbuildmat.2014.09.032. [Google Scholar] [CrossRef]
8. Miao, L. (2019). Micro pore structure of concrete and permeability model of dual porous media (Ph.D. Thesis). Harbin Institute of Technology, China (in Chinese). [Google Scholar]
9. McBain, J. W. (1935). An explanation of hysteresis in the hydration and dehydration of gels. Journal of the American Chemical Society, 57(4), 699–700. DOI 10.1021/ja01307a502. [Google Scholar] [CrossRef]
10. Espinosa, R. M., Franke, L. (2006). Inkbottle pore-method: Prediction of hygroscopic water content in hardened cement paste at variable climatic conditions. Cement and Concrete Research, 36(10), 1954–1968. DOI 10.1016/j.cemconres.2006.06.011. [Google Scholar] [CrossRef]
11. Baroghel-Bouny, V. (2007). Water vapour sorption experiments on hardened cementitious materials: Part I: Essential tool for analysis of hygral behaviour and its relation to pore structure. Cement and Concrete Research, 37(3), 414–437. DOI 10.1016/j.cemconres.2006.11.019. [Google Scholar] [CrossRef]
12. Ranaivomanana, H., Verdier, J., Sellier, A., Bourbon, X. (2011). Toward a better comprehension and modeling of hysteresis cycles in the water sorption–desorption process for cement based materials. Cement and Concrete Research, 41(8), 817–827. DOI 10.1016/j.cemconres.2011.03.012. [Google Scholar] [CrossRef]
13. Zhang, D., Pang, X., Li, K. (2015). Moisture transport based on water vapor sorption isotherm of cement-based porous materials. Journal of the Chinese Ceramic Society, 43(8), 1024–1031 (in Chinese). DOI 10.14062/j.issn.0454-5648.2015.08.02. [Google Scholar] [CrossRef]
14. Schiller, P., Wahab, M., Bier, T., Mögel, H. J. (2019). A model for sorption hysteresis in hardened cement paste. Cement and Concrete Research, 123, 105760. DOI 10.1016/j.cemconres.2019.05.005. [Google Scholar] [CrossRef]
15. Duveau, G., M’Jahad, S., Davy, C. A., Skoczylas, F., Shao, J. F. et al. (2011). Gas entry through water-saturated argillite: Experimental and numerical approaches. Proceedings of the 45th US Rock Mechanics/Geomechanics Symposium, San Francisco, USA. [Google Scholar]
16. Tian, Y., Chen, C., Jin, N., Jin, X., Tian, Z. et al. (2019). An investigation on the three-dimensional transport of chloride ions in concrete based on X-ray computed tomography technology. Construction and Building Materials, 221(9), 443–455. DOI 10.1016/j.conbuildmat.2019.05.144. [Google Scholar] [CrossRef]
17. Zhang, M., Zhou, B., Ruan, X., Li, Y. (2022). A 3D random porous media model for cement mortar based on X-ray computed tomography. Construction and Building Materials, 341(1), 127750. DOI 10.1016/j.conbuildmat.2022.127750. [Google Scholar] [CrossRef]
18. Zhang, X., Liu, S., Lei, Z., Qu, J. (2022). Research on CO2 transfer in basalt and sandstone using 3D pore space model generation and mathematical morphology. Computers & Geosciences, 165(3), 105147. DOI 10.1016/j.cageo.2022.105147. [Google Scholar] [CrossRef]
19. Luo, M., Zeng, Q., Pang, X., Li, K. (2013). Characterization of pore structure of cement-based materials by water vapor sorption isotherms. Journal of the Chinese Ceramic Society, 41(10), 1401–1408 (in Chinese). DOI 10.7521/j.issn.0454-5648.2013.10.13. [Google Scholar] [CrossRef]
20. Adler, R. J. (1981). The geometry of random fields. USA: Society for Industrial and Applied Mathematics (SIAM). [Google Scholar]
21. Adler, R. J., Taylor, J. E. (2007). Random fields and geometry. USA: Springer. [Google Scholar]
22. Dirschmid, H., Fischer, F. D. (2015). Generalized Gaussian error functions and their applications. Acta Mechanica, 226, 2887–2897. DOI 10.1007/s00707-015-1355-x. [Google Scholar] [CrossRef]
23. Matheron, G. (1975). Random sets and integral geometry. Journal of the Royal Statistical Society. Series A (General), 139(2), 277–278. DOI 10.2307/2345196. [Google Scholar] [CrossRef]
24. Serra, J. (1982). Image analysis and mathematical morphology, vol. 1. USA: Academic Press. [Google Scholar]
25. Serra, J. (1988). Image analysis and mathematical morphology, v.2: Theoretical advances. USA: Academic Press. [Google Scholar]
26. Morales, A. (1993). Statistical analysis of morphological openings. IEEE Transactions on Signal Processing, 41(10), 3052–3056. DOI 10.1109/78.277807. [Google Scholar] [CrossRef]
27. Grasley, Z. C., Lange, D. A. (2007). Thermal dilation and internal relative humidity of hardened cement paste. Materials and Structures, 40(3), 311–317. DOI 10.1617/s11527-006-9108-x. [Google Scholar] [CrossRef]
28. Hossein-Babaei, F., Rahbarpour, S. (2014). Alteration of pore size distribution by sol–gel impregnation for dynamic range and sensitivity adjustment in kelvin condensation-based humidity sensors. Sensors and Actuators B: Chemical, 191, 572–578. DOI 10.1016/j.snb.2013.10.032. [Google Scholar] [CrossRef]
Cite This Article
 Copyright © 2023 The Author(s). Published by Tech Science Press.
This work is licensed under a Creative Commons Attribution 4.0 International License , which permits unrestricted use, distribution, and reproduction in any medium, provided the original work is properly cited.
 Downloads
 Citation Tools