
 Submit a Paper
 Propose a Special lssue
 Open Access
ARTICLE

GraphCWGAN-GP: A Novel Data Augmenting Approach for Imbalanced Encrypted Traffic Classification
1 School of Electronics and Information Engineering, Nanjing University of Information Science and Technology, Nanjing, 210044, China
2 School of Tourism and Geography Science, Qingdao University, Qingdao, 266071, China
* Corresponding Author: Jiangtao Zhai. Email:
(This article belongs to the Special Issue: Cyberspace Intelligent Mapping and Situational Awareness)
Computer Modeling in Engineering & Sciences 2023, 136(2), 2069-2092. https://doi.org/10.32604/cmes.2023.023764
Received 14 May 2022; Accepted 14 September 2022; Issue published 06 February 2023
 View Full Text
 Download PDF
Abstract
Encrypted traffic classification has become a hot issue in network security research. The class imbalance problem of traffic samples often causes the deterioration of Machine Learning based classifier performance. Although the Generative Adversarial Network (GAN) method can generate new samples by learning the feature distribution of the original samples, it is confronted with the problems of unstable training and mode collapse. To this end, a novel data augmenting approach called GraphCWGAN-GP is proposed in this paper. The traffic data is first converted into grayscale images as the input for the proposed model. Then, the minority class data is augmented with our proposed model, which is built by introducing conditional constraints and a new distance metric in typical GAN. Finally, the classical deep learning model is adopted as a classifier to classify datasets augmented by the Condition GAN (CGAN), Wasserstein GAN-Gradient Penalty (WGAN-GP) and GraphCWGAN-GP, respectively. Compared with the state-of-the-art GAN methods, the GraphCWGAN-GP cannot only control the modes of the data to be generated, but also overcome the problem of unstable training and generate more realistic and diverse samples. The experimental results show that the classification precision, recall and F1-Score of the minority class in the balanced dataset augmented in this paper have improved by more than 2.37%, 3.39% and 4.57%, respectively.Keywords
Network traffic classification has been widely employed in the field of application identification, anomaly detection, network management, and so on. As the payload of encrypted traffic cannot be analyzed directly, the traditional traffic classification methods based on payload matching [1,2] cannot effectively handle encrypted traffic. The current typical encrypted traffic classification methods mainly include traditional Machine Learning (ML) [3–7] and Deep Learning (DL) [8–18] methods. These two methods can classify and identify traffic based on statistical characteristics without analyzing its payload. Thus, they are less affected by the encryption technology [19].
However, the existing typical classification methods are always based on the assumption of balanced data. This assumption does not hold in many practical cases. Data imbalance often exists in network traffic [20]. There are huge differences in the number of samples among different traffic classes. Among them, the class which has a large sample size is called the majority class, and the class that has a small size is called the minority class. The class imbalance always leads to the misclassifying problems of the minority class. This seriously affects the performance of the classifier and causes low classification accuracy for the minority class. In most cases, the minority class data often contains more valuable information and the misclassification of it would cause serious consequences. Therefore, the class imbalance of traffic data poses a severe challenge to the classification and identification of network traffic.
The current learning strategies for imbalanced data mainly include classification model improvement and data preprocessing [21]. This paper mainly focuses on the classification of imbalanced traffic data from the data preprocessing level. Data preprocessing refers to preprocessing the original data through some methods before sending it to the classifier. Its purpose is to convert the imbalanced data set into a balanced data set. The main preprocessing methods are under-sampling and oversampling [22–24]. The under-sampling methods can reduce the imbalance ratio between classes by reducing the number of majority class samples. The oversampling methods balance the data set by synthesizing new minority samples. The Synthetic Minority Oversampling Technology (SMOTE) is an improved scheme based on the Random Oversampling (ROS) algorithm. Unlike the ROS which increases the number of minority samples through random replication, SMOTE is not prone to overfitting. That is because it synthesizes new minority samples to reduce the imbalanced ratio.
Over recent years, as an oversampling method, generative models, including Generative Adversarial Network (GAN) [25], have been used to generate minority samples to solve the problem of class imbalance. The concept of GAN was proposed by Goodfellow in 2014. Its inspiration comes from the zero-sum game idea. GAN is widely adopted in computer vision, especially in image generation [26–28]. Compared with other generative models, the concept of adversarial training is introduced into GAN because it can generate images that are of higher quality and more realistic. Concerning the application of GAN in image generation, in this paper, the traffic data is converted into grayscale images, and GAN is used to generate and augment minority classes. GAN is composed of two entities, namely, generator and discriminator. The generator is used to generate samples according to the real data distribution, while the discriminator is used to distinguish the pseudo noise generated by the generator from the real samples. Although GAN has certain advantages over other generative models, it still has the following problems:
• The training process of GAN is unstable and prone to causing gradient explosion and disappearance. Thus, it is difficult for the model to cover. It also makes the generator unable to achieve optimization and causes realistic samples not to be generated.
• The Kullback-Leibler (KL) divergence is used to measure the distance between real and generated distribution. However, the asymmetry of KL is prone to causing mode collapse, which leads to insufficient sample diversity.
In order to address the above-mentioned problems, an improved GAN-based imbalanced encrypted traffic data augmenting method called GraphCWGAN-GP is proposed. The main contributions of this paper can be concluded as:
• We propose a new traffic data augmentation method, called GraphCWGAN-GP, to augment the number of samples in the minority class to balance the number of samples in each class. This method can effectively alleviate the problem that the classifier pays more attention to the majority class but has a poor classification effect on the minority class due to the imbalance of training data categories and improves the practical application value of the traffic classifier.
• In the GraphCWGAN-GP, we introduce the auxiliary conditional information to the Wasserstein GAN with gradient penalty (WGAN-GP). The traffic type labels are used as the precondition to control the mode of traffic data generation. Therefore, we only need to train one model to generate traffic samples for all minority classes at one time, which can reduce the complexity and time consumption.
• The proposed GraphCWGAN-GP method can greatly avoid the problems of unstable training and mode collapse. It can generate more realistic and diverse traffic samples, which has great potential to serve as a new idea for network traffic imbalance.
The rest of this paper is organized as follows. Section 2 introduces the related works of encrypted traffic classification and existing typical methods for imbalanced traffic data classification. In Section 3, the principle and network structure of the WGAN-GP model are introduced. And the methodology of the proposed method is illustrated in Section 4. Section 5 shows the comparison experimental results and analysis. Section 6 demonstrates the conclusions and future works.
2.1 Network Encrypted Traffic Classification
At present, the method based on deep learning has become mainstream in the encrypted traffic identification field. The methods proposed in [11–18] are all DL-based traffic classification methods, which can not only avoid the feature design problems in traditional ML methods, but also achieve higher accuracy in the classification and identification of encrypted traffic. In [11], the authors proposed a DL-based encrypted traffic classification method called “Deep Packet”, which integrates the feature extraction and classification stage into a system. The system framework uses two deep neural network structures of Stacked Auto-Encoders (SAE) and CNN. This system can be used to distinguish VPN and nonVPN traffic, and classify different types of application traffic. Experiments on the ‘UNB ISCX VPN-nonVPN’ data set illustrates that the “Deep Packet” can achieve a high classification accuracy.
In [12], a novel multimodal DL framework named MIMETIC for encrypted mobile traffic classification is proposed. The MIMETIC method adopts features automatically extracted by DL to design a traffic classifier. It allows us to inspect the traffic from complementary views, thus providing an effective solution to the mobile scenario. The MIMETIC can capitalize on traffic data heterogeneity by learning both intra-and inter-modality dependences, and pushing through performance limitations of existing single-modality DL-based TC proposals. Experiments demonstrate the performance improvement of MIMETIC over single-modality DL-based counterparts, state-of-the-art ML-based mobile traffic classifiers, and classifier fusion techniques.
The encrypted traffic classification method called DataNets proposed in [14] is based on three DL schemes, which are MLP, SAE and CNN. The authors proposed a software-defined network (SDN)-HGW framework to better manage distributed smart home networks and support the SDN controller of the core network. The DataNets can be applied to enable distributed application-aware SDN-HGW in future smart home, and can achieve better end-to-end network management.
Dong et al. [15] proposed a semi-supervised Double Deep Q-Network (SSDDQN)-based optimization method for network abnormal traffic detection, mainly based on Double Deep Q-Network (DDQN), a representative of Deep Reinforcement Learning algorithm. In SSDDQN, the current network first adopts the autoencoder to reconstruct the traffic features and then uses a deep neural network as a classifier. The target network first uses the unsupervised learning algorithm K-Means clustering and then uses deep neural network prediction.
2.2 The Classification of Imbalanced Traffic Data
The existing imbalanced traffic data classification research mainly includes two strategies, namely, improvement of the classification model and data preprocessing. In this paper, the imbalanced traffic data classification based on the strategy of data preprocessing is studied. Ma et al. [26–33] introduced the data preprocessing methods which include SMOTE-based method and GAN-based methods for imbalanced traffic classification.
Zhang et al. [29] proposed a novel class imbalance processing technology for large-scale datasets, called SGM. The SGM first combines SMOTE with under-sampling for clustering based on Gaussian Mixture Model (GMM). Then, the SGM is used to combine with the CNN classifier to construct a flow-based intrusion detection model, which is referred to as SGM-CNN. The authors also learned the impact of different numbers of convolution kernels and the learning rate on the model performance. Experiments on UNSW-NB15 and CICIDS2017 public network intrusion datasets demonstrate that the SGM-CNN achieves a higher detection rate over other imbalanced preprocessing methods. However, SMOTE has blindness partly in the selection of nearest neighbors, and it cannot solve the problem of data distribution marginalization. It will result in the blurring of boundaries between positive and negative samples.
To address the imbalance of current network traffic, Dong et al. [30] proposed a traffic identification model based on generating adversarial deep convolutional networks (GADCN), which effectively fits and expands traffic images, maintains a balance between classes of the dataset, and enhances the dataset stability. Experiments on public datasets verify the effectiveness of the method.
In [31], the authors proposed a GAN-based imbalanced traffic data preprocessing method called FlowGAN, which is used to tackle the class imbalance problem in traffic classification. The objective function of FlowGAN is shown as follows, in which the G is Generator, D is Discriminator,
As a data augmentation method, the FlowGAN generates synthetic traffic samples for the minority class to reduce the imbalanced ratio. The MLP-based traffic classifier is trained to evaluate the performance of it. The experiments on the public dataset ‘UNB ISCX VPN-nonVPN’ show that the FlowGAN can outperform the imbalanced dataset and balanced datasets augmented by other oversampling methods.
The method proposed in [32] is a CGAN-based data augmentation method which is called PacketCGAN. In this method, the types of application traffic are added to the input as conditional information, so that the PacketCGAN can control the mode of sample generation. The typical DL-based classifiers are adopted to classify the balanced datasets augmented by PacketCGAN and other data augmentation methods. The experimental results show that the new balanced dataset augmented by PacketCGAN method can achieve better performance than other methods.
Lee et al. [33] proposed a network attack traffic generation method to tackle with the problem of class imbalance in network intrusion datasets. In their method, the network attack traffic is analyzed based on deep packet inspection, and its features are extracted based on common traffic characteristics. The WGAN with gradient penalty algorithm is used to generate new synthetic network attack samples for the minority class. Experiments demonstrate that the dataset augmented by proposed method has an approximate 5% improvement in accuracy. Also, the false detection rate is reduced by approximately 8%.
3 Wasserstein Generative Adversarial Networks-Gradient Penalty
In GAN, the loss function of the generator is shown in Eq. (2). It needs to minimize this loss function when optimizing the generator. It is equivalent to minimize the loss function in Eq. (3), in which the Pg represents the generated sample distribution and the Pdata represents the real sample distribution. The loss function is optimized by reducing the KL divergence but meanwhile increasing the Jensen-Shannon (JS) divergence, which will lead to training instability.
The asymmetry of the KL divergence will cause the problem of mode collapse, which will lead to diversity insufficiency of the generated data. In addition, both KL and JS have the same problem, that is, they cannot measure the distance between two distributions that do not overlap mutually or the overlap is negligible. In this situation, the KL is meaningless, while the value of JS is a constant. It means that the gradient of the Generator disappears and the Generator cannot be optimized.
The Wasserstein GAN with Gradient Penalty (WGAN-GP) [34] introduces the Wasserstein distance to replace JS and KL. Meanwhile, the gradient penalty is introduced to meet the Lipschitz restrictive condition. The model architecture of WGAN-GP is shown in Fig. 1.

Figure 1: The architecture of WGAN-GP
The Wasserstein distance is also called the Earth-Mover (EM) distance, whose definition is shown in Eq. (4).
In Eq. (4),
The gradient penalty is introduced to WGAN-GP to meet the Lipschitz restrictive condition. In order to achieve gradient penalty, a two-norm between the obtained gradient of the discriminator and customized constant K should be established. Considering the high computational consumption in the sampling in the entire sample space, it is only to generate a random number
4 Descriptions of the Proposed Method
The proposed GraphCWGAN-GP method includes three phases which are traffic data preprocessing, traffic data augmentation and traffic data classification. The work process of GraphCWGAN-GP is shown in Fig. 2.

Figure 2: The work process of the GraphCWGAN-GP algorithm
4.1 Traffic Data Preprocessing
The traffic data in the imbalanced encrypted traffic dataset is saved as PCAP or PCAPNG format. It cannot be directly used as the input to the model. Therefore, the original traffic data is converted into gray images by preprocessing. And then the gray images are used as the input to the model for learning. The process of traffic data preprocessing that is shown in Fig. 2 is described as follows.
Packet filtering. For the original PCAP file, some useless packets in it should be removed and filtered firstly, such as TCP retransmission packets and TCP handshake packets. These packets are only used to establish and complete the connection during the TCP triple handshake, and they do not contain any valid load data. In addition, the protocol packets such as ARP, DHCP and ICMP have nothing to do with the application traffic characteristics and traffic classification, thus, they also should be removed by the packet filtering process.
Data packet segmentation. In the original data set, the traffic data packets of each application are stored in a large PCAP file. After removing data packets that are useless for traffic classification, the traffic in the original PCAP file is segmented according to the form of session.
Image generation. According to the definition of the maximum transmission unit (MTU), the maximum length of the data packet transmitted in the Ethernet is 1500 bytes, thus, we choose 784 bytes as the uniform length to truncate and fill the data packets. The data packets that are longer than 784 bytes were truncated, and for the packets whose length is less than 784 bytes, zero-padding was performed at the end of them. The unified-length data packets were converted to 28 * 28 grayscale images, and each byte corresponds to a pixel value of the images.
IDX format transformation. The generated grayscale images are transformed to an IDX file. The IDX file contains the image information and label information. Then we use the IDX file as the input file of the models.
The most critical part of the proposed method is dataset balancing. In this paper, the proposed GraphCWGAN-GP is used to generate new traffic data samples for minority class. The new generated samples are combined together with the imbalanced traffic data samples to build a new balanced dataset. The model architecture of our proposed GraphCWGAN-GP is shown in Fig. 3.

Figure 3: The model architecture of GraphCWGAN-GP
The proposed method combines the advantages of WGAN-GP and CGAN. It is built by adding auxiliary conditional information to the WGAN-GP. Its objective function is shown in Eq. (6), in which the y is class labels,
In GraphCWGAN-GP, the traffic class labels are used as additional condition information to control data generation. The digital label of each traffic sample is converted into a 10-dimensional vector by one-hot encoding. And then, it is combined with samples as the input to the Generator and Discriminator. GraphCWGAN-GP only needs to train one model to generate traffic data samples for all minority class, while the typical GAN is required to train multiple models for each minority class, which greatly reduces the complexity and time consumption.
Meanwhile, the GraphCWGAN-GP adopts the Wasserstein distance to measure the difference between the real and generated samples distribution, which leads to a large extent avoids training instability and mode collapse. The gradient penalty is used to restrict the gradient of discriminator in order to eliminate the gradient explosion and vanish. Therefore, the GraphCWGAN-GP can generate more realistic and diverse samples for minority classes than the typical GAN.
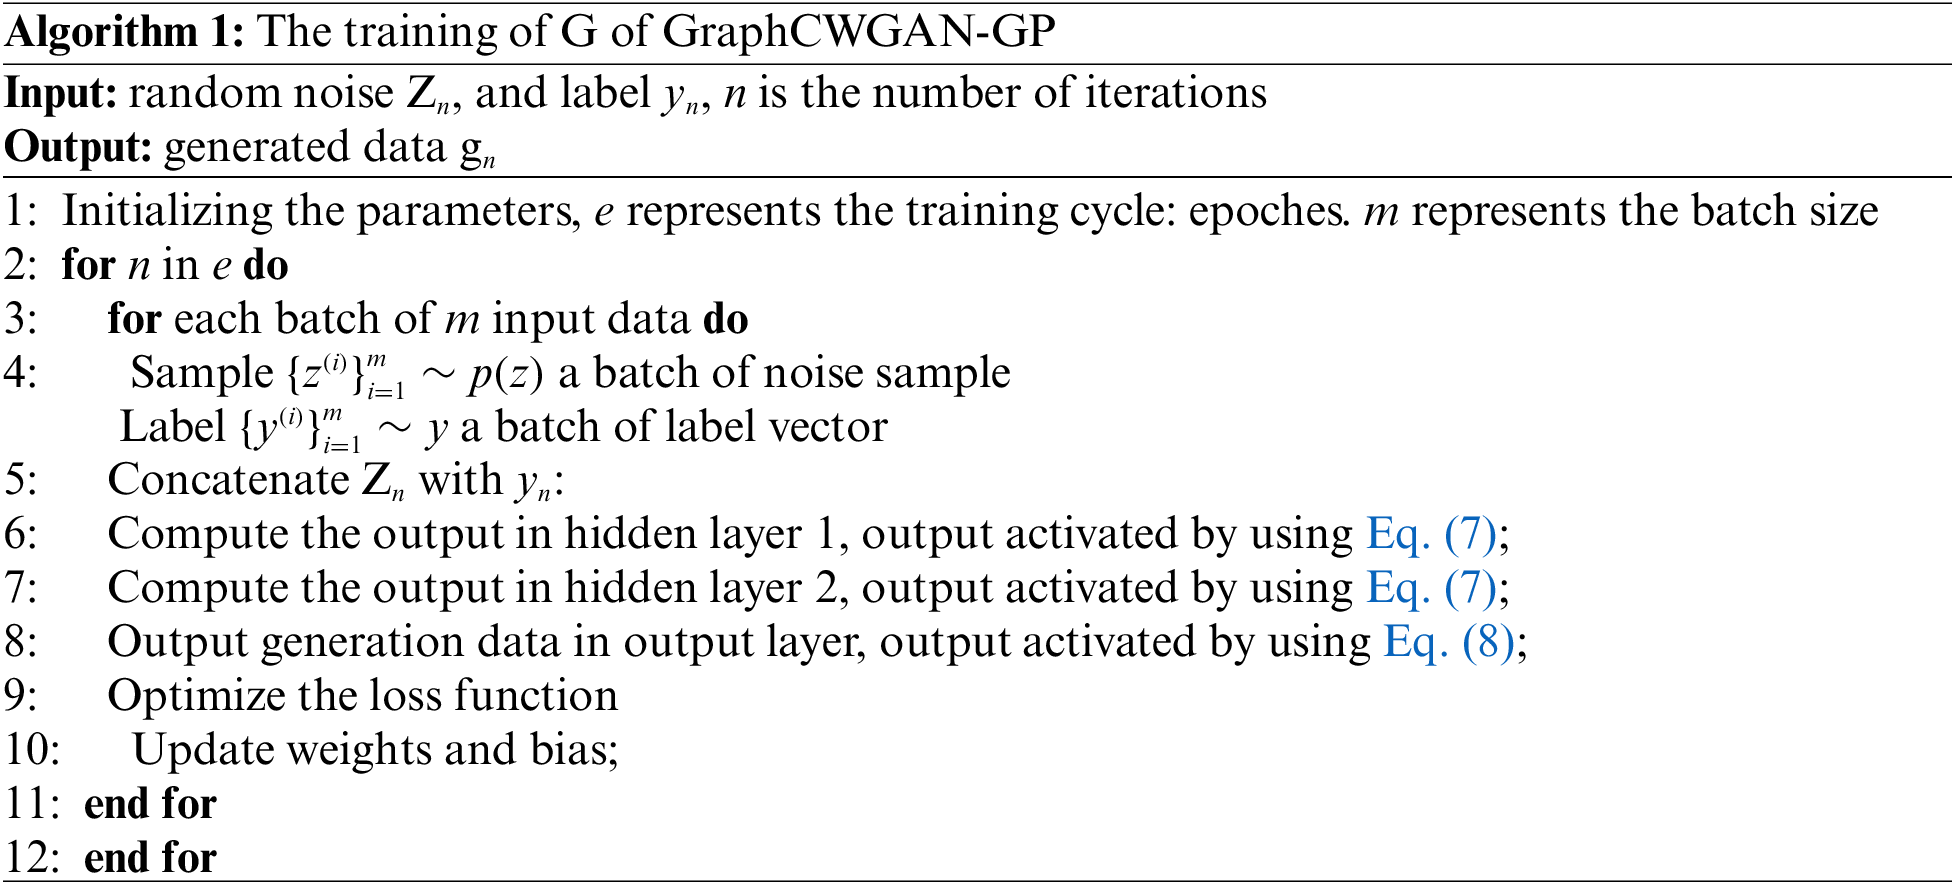
The GraphCWGAN-GP consists of Generator G and Discriminator D. The G model is built by a simple MLP, it consists of three layers: the input layer, two hidden layer and the output layer. Both the hidden layers and the output layer are Fully Connected (FC) layers, in which the number of neuron nodes are 32, 64, and 784, respectively. The 100-dimensional uniform distribution data vector that is generated randomly and the one-hot encoded 10-dimensional random class label vector is put into the G. The activation function of the hidden layers and output layer is a ReLu function which is also called linear correction unit, whose expression is shown in Eq. (7).
The activation function of the output layer uses the tanh, and its expression is shown in Eq. (8). Except for the last layer, each layer in G uses Batch Normalization (BN). It can accelerate and stabilize the training by adding BN. Besides, the dropout layers are added behind the all-link FC layers to prevent over-fitting and enhance the generalization ability of the network.
The overall training process of the G is shown in Algorithm 1, in which the Zn is the 100-dimensional random noise vector, yn is the label vector from ground truth label set.
:
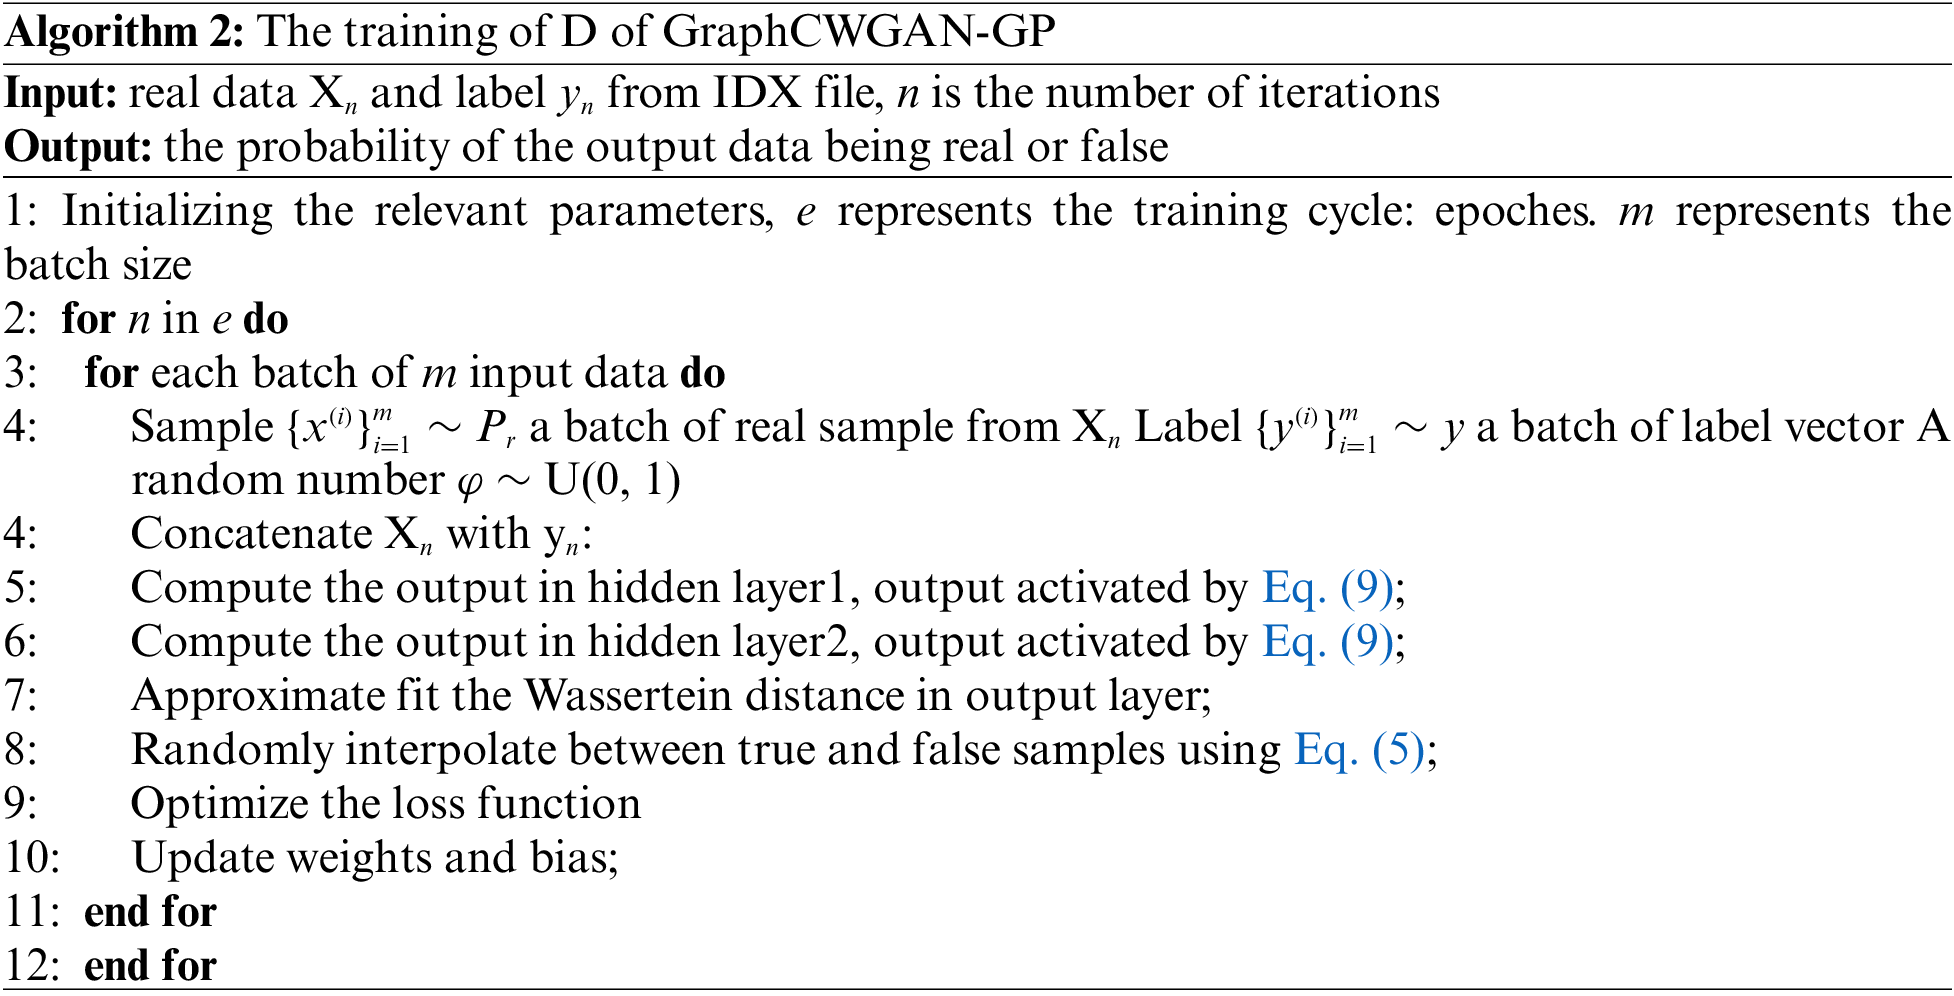
The D of GraphCWGAN-GP also contains four layers. The number of neuron nodes in hidden layers and output layer are 64, 32, and 1, respectively. The input is a 784-dimensional vector which is converted from the 28 * 28 grayscale images that are generated by the G and come from the imbalanced data set, with the one-hot encoded 10-dimensional traffic class label vector that is generated randomly and corresponds to real images. The Leaky ReLu function is used as the activation function of the hidden layers, it is also known as the linear correction unit with leakage, which is a variant of the linear correction function, the expression as following Eq. (9).
The symbol α in Eq. (9) is a fixed minimum value. Compared with the linear correction unit ReLu, the Leaky ReLu can give a small negative gradient to keep the neurons learning even if the input value is negative. Different from the ordinary GAN model, the D of GraphCWGAN-GP does not perform a true-false binary classification task, but a regression task. Thus, the output layer of the D no longer uses the sigmoid activation function. The gradient penalty is added to each sample in each batch, thus, the layers of D cannot use BN. The overall training process of the D is shown in Algorithm 2, in which the Xn is the real data from IDX file, yn is the corresponding label vector.
The Adam optimizer is used to optimize the loss functions of the G and the D in the GraphCWGAN-GP. The traditional GAN is set the same learning rate for the G and the D generally, which leads to that balancing the update rate of G and D is of difficulty. If the G updates too fast, the D will reach the local solution prematurely. And on the contrary, if the D updates too fast, it is detrimental to the parameter update of G. Therefore, the proposed GraphCWGAN-GP in this paper sets different learning rates and parameter update scale for the G and D. During the training, firstly, the parameters of the G are fixed, and the D is optimized three times. Then the parameters of the D are fixed, and the parameters of the G are optimized at one time. Besides, in order to converge faster and find the global optimal solution, the input data are mapped to the range of [−1, 1] by normalization.
4.3 Traffic Data Classification
The new balanced dataset is obtained by augmenting samples for minority classes using GraphCWGAN-GP. The balanced dataset is classified by using the DL classifier. In this paper, the NIN-CNN model is adopted as the classifier. NIN-CNN is a special CNN model which uses micro-network convolution kernel instead of the linear convolution kernel. Compared with the general CNN, the NIN-CNN uses the global average pooling to replace the FC layer to reduce the network parameters and improve the generalization ability. The NIN-CNN used in this paper contains 9 convolutional layers, including 3 ordinary convolutional layers, 6 1 * 1 convolutional layers, 2 max-pooling layers and 1 global average pooling layer. The network structure of the NIN-CNN-based classifier is shown in Fig. 4.
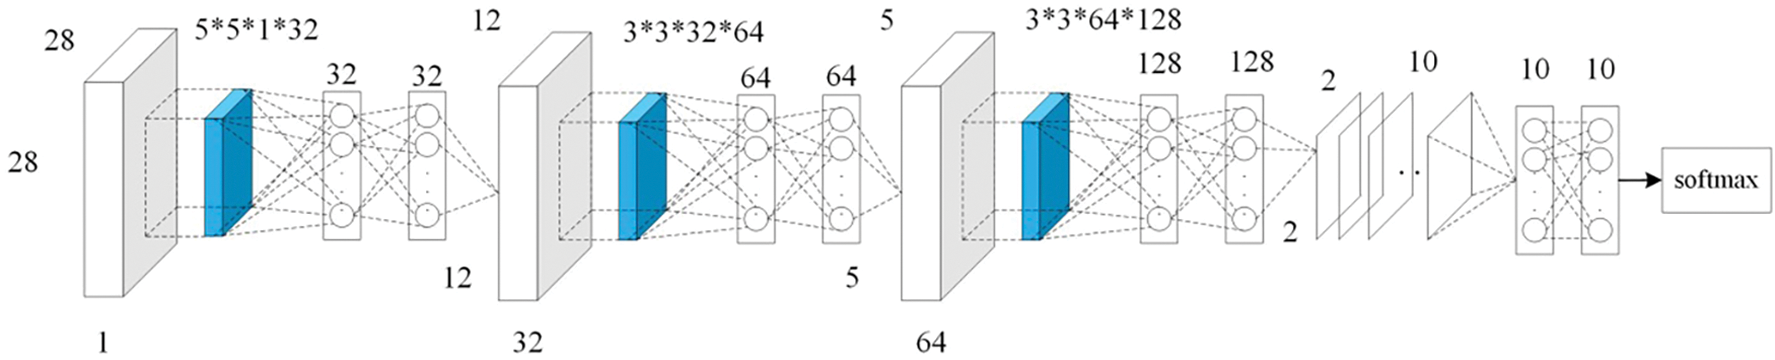
Figure 4: The network structure of NIN-CNN based classifier
The dataset used in the experiment is an imbalanced encrypted traffic dataset which is composed of the traffic that is selected from the ‘UNB ISCX VPN-nonVPN’ [35]. The ‘UNB ISCX VPN-nonVPN’ encrypted traffic dataset contains 15 kinds of application traffic, among which 10 applications are chosen to form a new imbalanced encrypted traffic dataset for the experiment in this paper.
Table 1 shows the number of image samples of ten applications and the proportion in the total image data set. Obviously, the number of samples of various applications in the image data set is extremely imbalanced. The Netflix and YouTube with the largest number of samples account for 26.30% and 25.46%, respectively, while the icq, aim and spotify with the smallest number of samples only account for 0.63%, 1.03% and 2.99%, respectively. The maximum sample number ratio is nearly 42 times, and thus, the data set belongs to the class of imbalanced encrypted traffic data set.

5.1.2 Experimental Environment
The hardware and software configuration used in this paper is shown in Table 2.

In this experiment, the overall performance for classification is evaluated by using indicators that include precision, recall, and F1-Score.
The Precision is also called precision rate which measures the accuracy of the predicted positive samples, it is also to say that how many in the samples predicted to be positive samples are true positive samples. The formula is expressed as follows in Eq. (10).
The recall rate, which measures the proportion of positive samples with correct classification to the total positive samples, can be expressed as follows in Eq. (11).
The F1-Score is the harmonic average of precision rate and recall rate, which can better reflect the overall performance of the classifier since it combines the precision rate and recall rate. It can be expressed as follows in Eq. (12).
Among them, TP refers to the positive sample to be predicted as negative sample; FP refers to the negative sample predicted as positive sample; FN refers to the positive sample predicted as negative sample.
5.2 Experimental Results and Analysis
The traffic data in the imbalanced encrypted traffic dataset is converted into grayscale images through preprocessing. The generated grayscale images that correspond to various traffic classes are shown in Fig. 5.
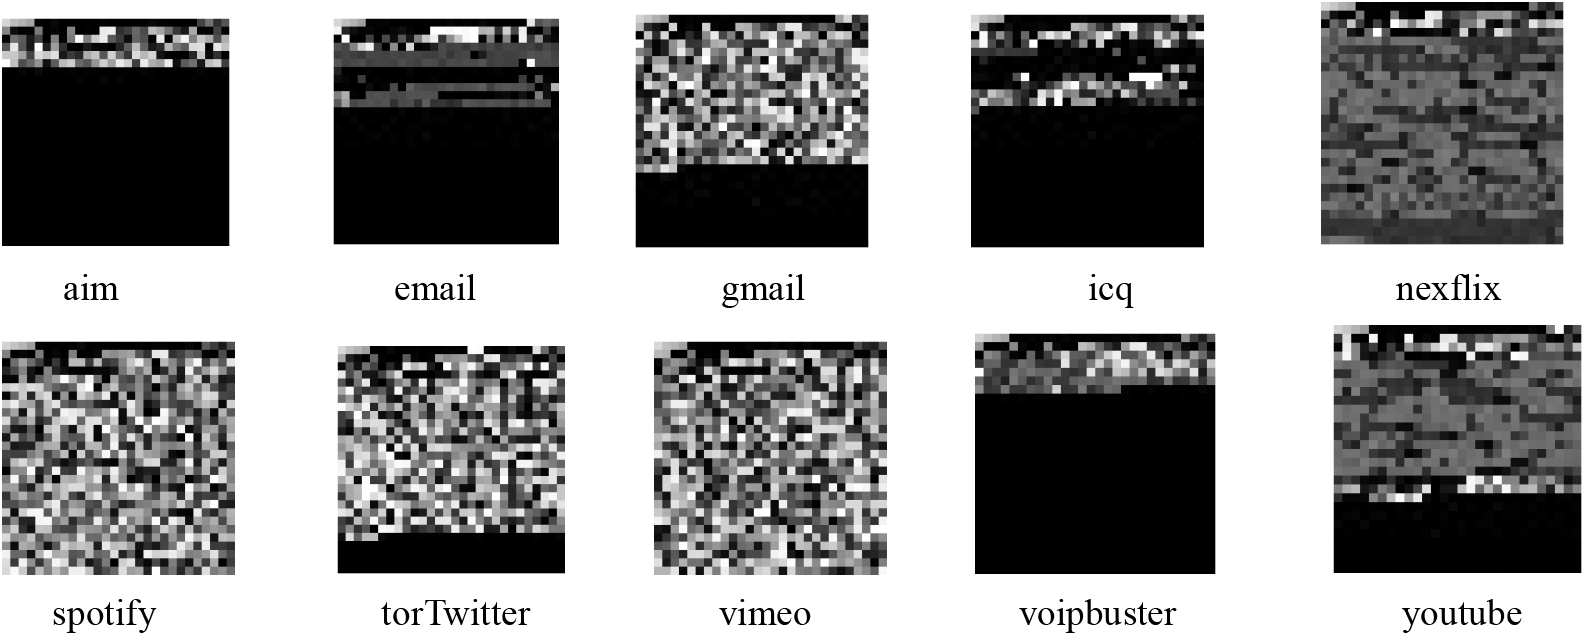
Figure 5: The grayscale images of various traffic classes
The grayscale images are divided into training set and testing set according to the ratio of 9:1. The training set has a total of 130,478 images and the testing set has 14,498 images. The data in both of the two sets are saved as IDX format. In order to prevent the generated image samples from affecting the classification result, the training set is only balanced by using GraphCWGAN-GP, and the testing set is used to verify the performance of the classifier.
In this paper, different scale update rules are used for the Generator and Discriminator in GraphCWGAN-GP to stabilize the training process. In order to select the suitable update ratio, the Generator and Discriminator of GraphCWGAN-GP are trained under the update ratio of 1:1, 1:2, and 1:3, respectively. It is a total of 5,000 rounds of training, and the results are shown in the form of loss value curves during the training process. Fig. 6 shows the loss value curves in three different update ratios.
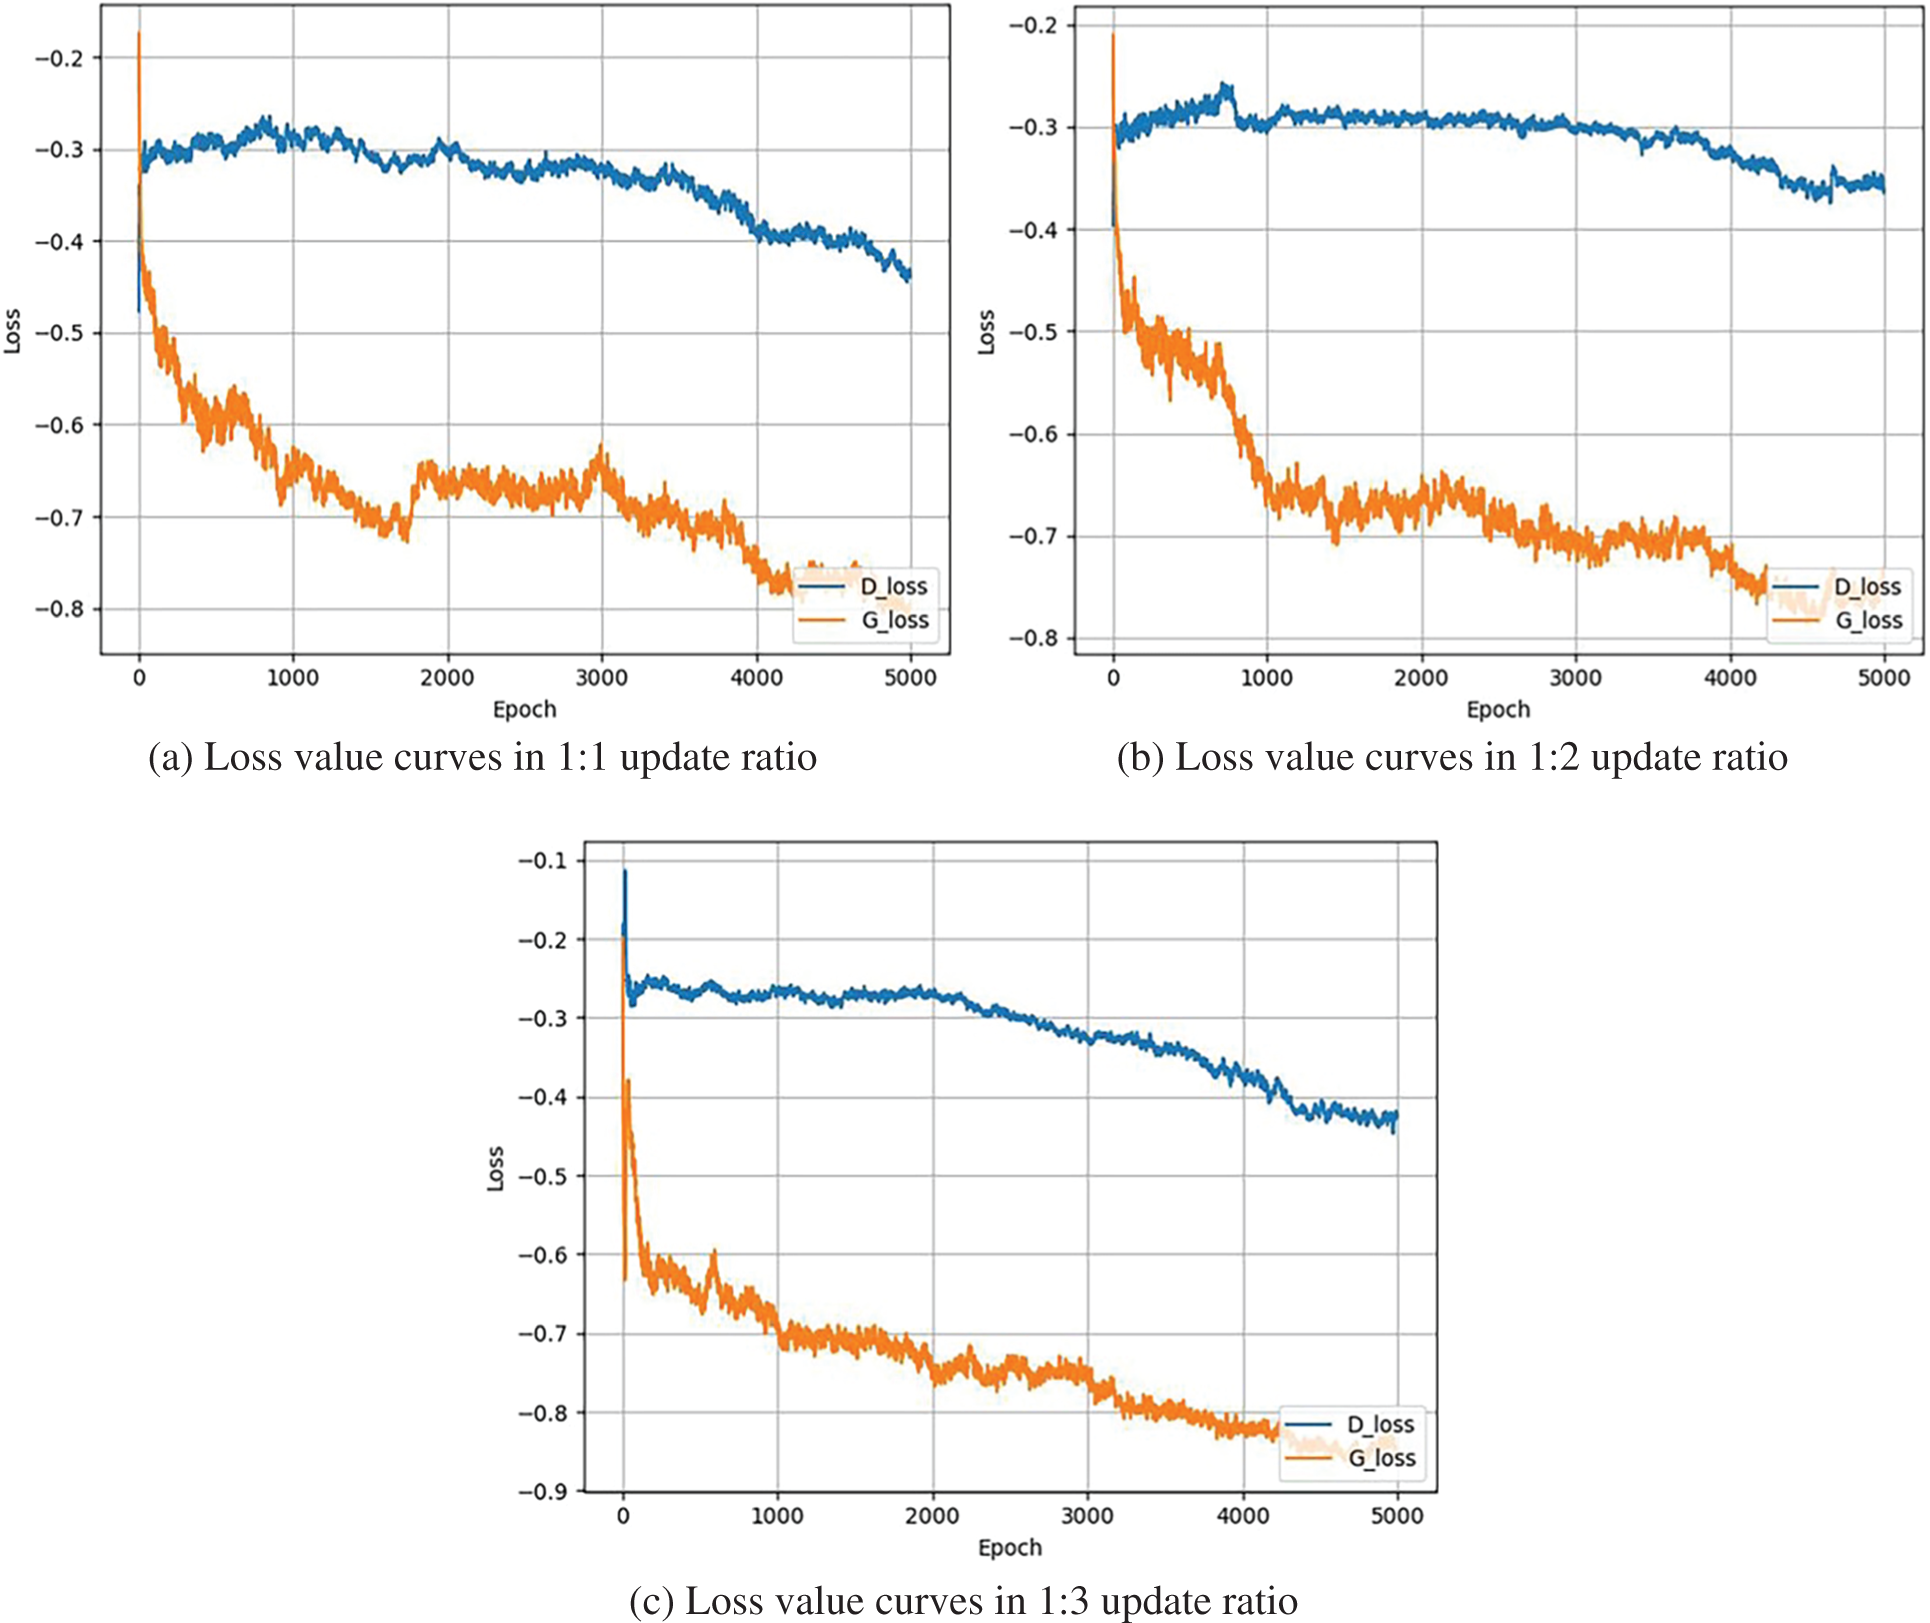
Figure 6: The loss value curves of generator and discriminator in three update ratios
From the results shown in Fig. 6, it can be clearly seen the trend of loss value in the updated ratios of 1:1, 1:2 and 1:3. It can also be seen from (a) that the model does not fully converge after 5,000 rounds of training in the ratio of 1:1. From (b) we can see that the loss value curves of generator converge at −0.75 after 4,200 rounds. When the model training in the ratio of 1:3, the loss value curve gradually stabilized after 4,200 rounds, and the loss value reduces to −0.85. Its loss value curve fluctuates less compared with (b), which means the training is more stable in the ratio of 1:3.
Apart from the updated ratio, different learning rates for the generator and discriminator to balance the update rate are set. In the experiment, the training of the model in several learning rate combinations are tested. In the four combinations, the learning rate is set to the same value for the Generator and a different value for the Discriminator. Table 3 shows four learning rate combinations.

The loss value curves of Generator and Discriminator in the above four learning rate combinations is shown in (a), (b), (c) and (d) of Fig. 7. By comparing (a), (b) and (c), it can be seen that the Generator can converge faster as the learning rate of Discriminator increases. When the learning rate of the Discriminator is set to 0.0002, the loss of Generator converges after 1,000 rounds of training. In (a) and (b), the Generator respectively converges after 4,200 and 4,000 rounds of training. However, it can be seen from (d) that when the learning rate reaches to 0.0003, the Generator fluctuates after 1,500 rounds of training, and the loss value suddenly rises and eventually stabilizes after 3,000 rounds of training. It can be concluded that an appropriate increase in the learning rate of Discriminator can improve the convergence speed, but an excessively high learning rate will lead to unstable training. Therefore, the learning rate combination 3 is chosen to train the model.
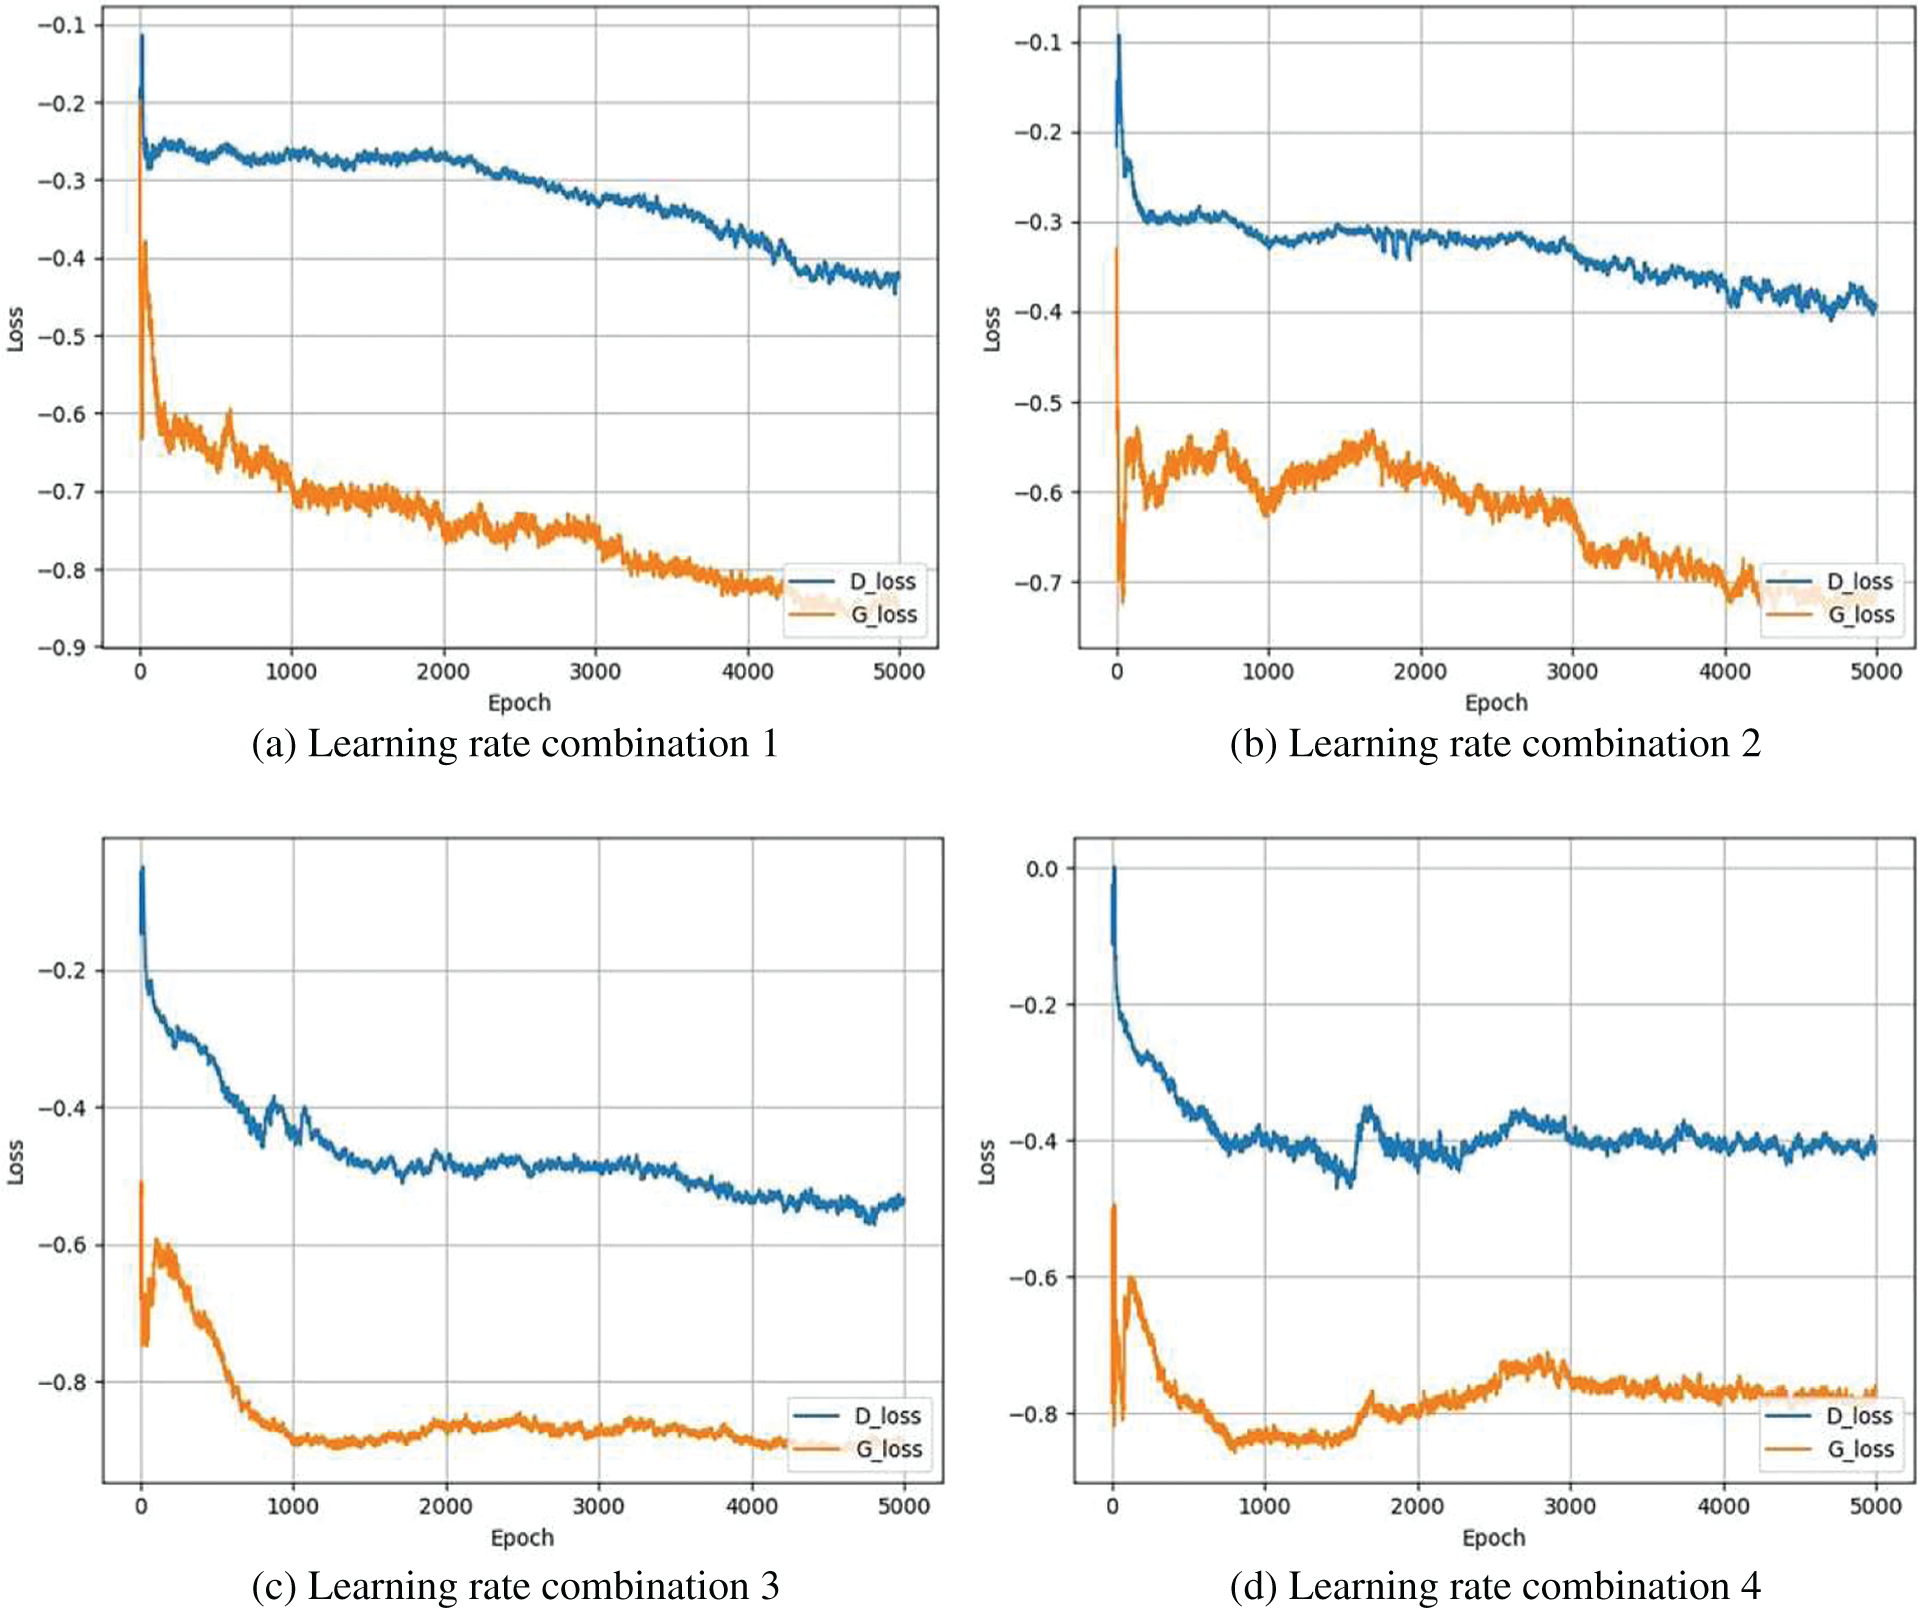
Figure 7: The loss value curves of generator and discriminator
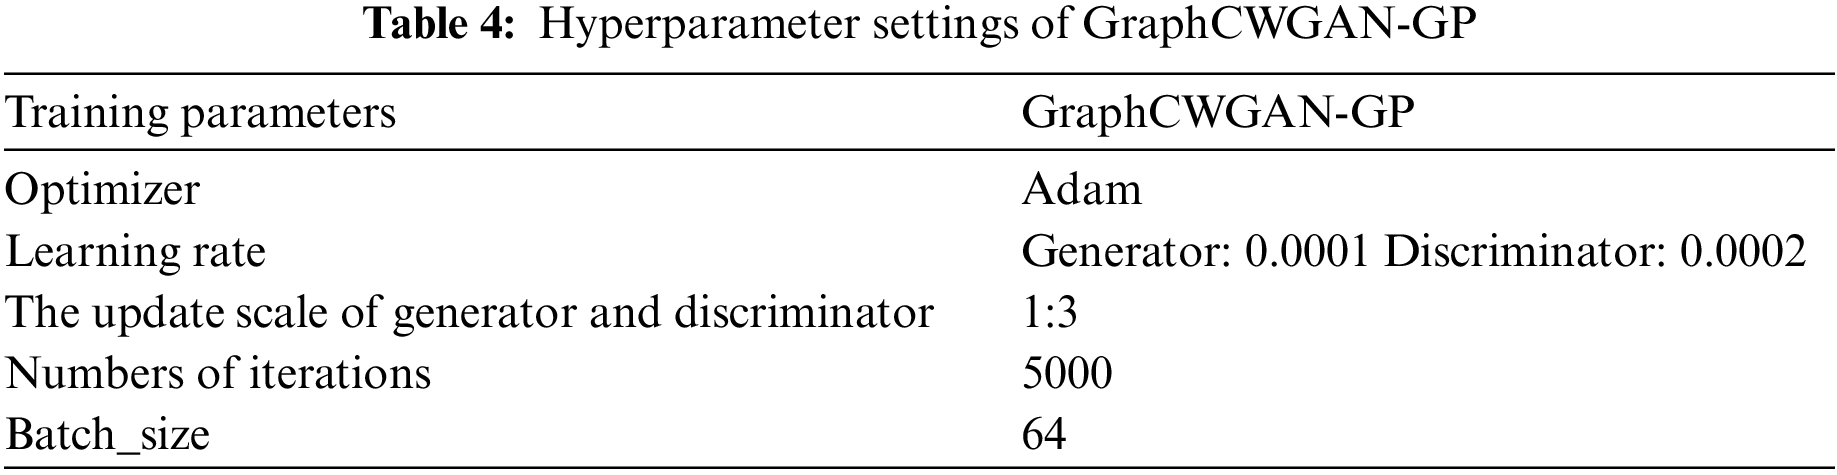
In the experiment, the data is loaded by using batch processing. The batch size in the training process is set to 64, which means 64 gray-scale images are loaded in each batch. The hyperparameter settings of the GraphCWGAN-GP are shown in Table 4.
In order to balance the sample number ratio among different types of application, a part of samples appropriately for the majority class are discarded. The proposed GraphCWGAN-GP is used to generate a certain number of grayscale images to augment the minority class. The dataset is balanced by setting the number of samples in 10 traffic classes to the same value. To explore the suitable value, we evaluate the classification performance on classifier of datasets that are balanced in different samples. The number of traffic samples of the ten categories of applications we selected is in the range of [818, 34,313]. Therefore, we take values at intervals according to a certain number of samples in this interval, and obtain four values of 5,000, 12,000, 20,000, and 30,000, respectively. As the number of samples of each category after expansion, and experiment comparison. We respectively balance the datasets in 5,000, 12,000, 20,000 and 30,000 samples per traffic classes. The four balanced datasets that have different data are classified by using NIN-CNN classifier. The classification performance on the classifier of an imbalanced dataset and four balanced datasets are shown in Table 5.

From Table 5, it can be seen that the balanced dataset which contains 5,000 samples per class has not significantly improved classification performance compared with the imbalanced dataset. It respectively has an increase of 1.65% and 0.09% on recall and F1-Score. Although the dataset is balanced by unifying the sample size of each class to 5,000, there are so many samples deleted in the majority class that some potentially useful information is lost, which influences the classification performance. Compared with the imbalanced dataset, the datasets which are 12,000, 20,000 and 30,000 per traffic class all have an obvious improvement in precision, recall and F1-Score, respectively increasing by 2.03%, 2.65% and 2.04% on the three metrics highest. However, compared with the 12,000-sample size, the datasets with sample sizes of 20,000 and 30,000 each class only increase by 0.39% and 0.64% on precision, but decreased by 0.95% and 0.6% on recall. The improvement in classification performance is not obvious.
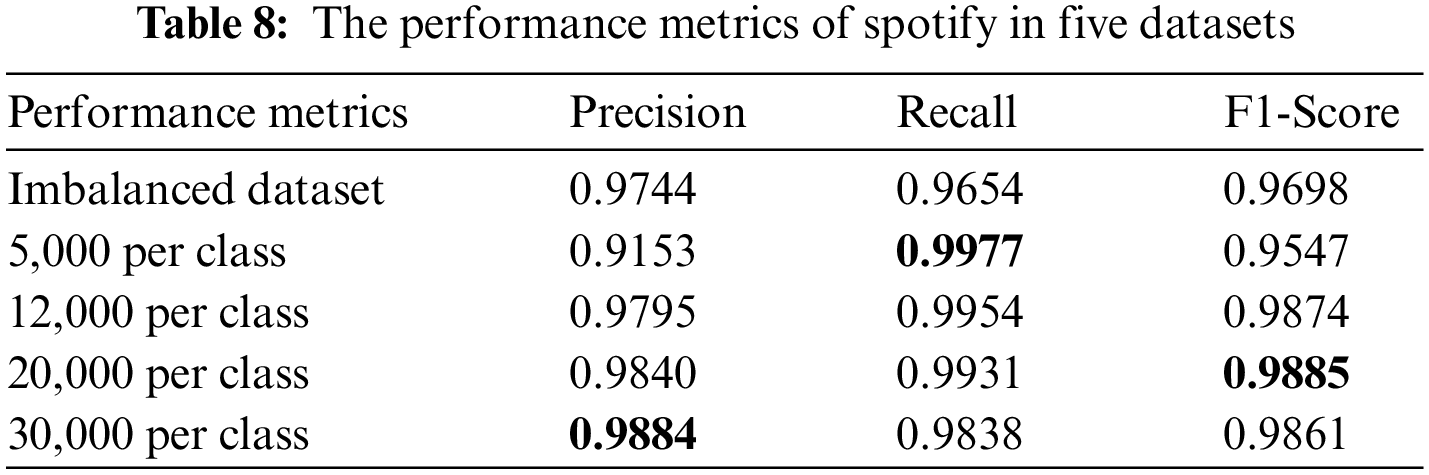
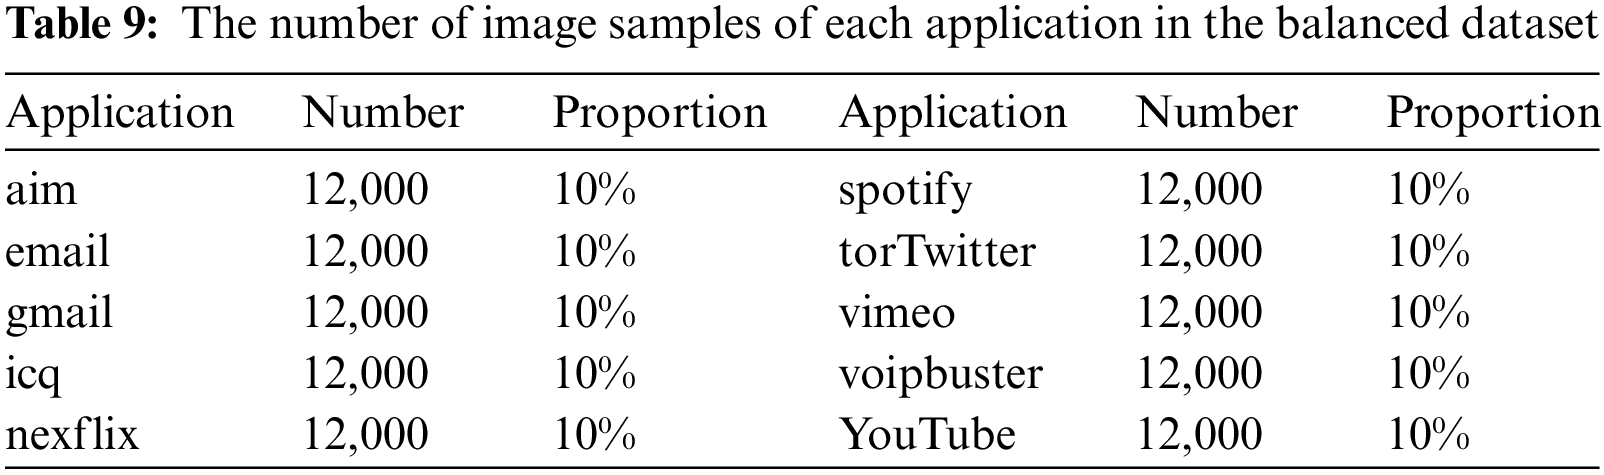
Similarly, the performance metrics of three minority classes in five datasets are shown from Tables 6 to 8. It can be seen that the dataset with 12,000 samples per class outperforms greatly than the imbalanced dataset and dataset with 5,000 sample per classes. However, when we increase the sample size of each class to 20,000 and 30,000 on the basis of 12,000, the final classification performance does not significantly improve. Therefore, considering the problems caused by increasing the number of samples, such as the increase in the consumption of training time, easing to bring redundant data affects the classification performance. We finally set the number of samples for each class to 12,000 to balance the dataset. The number of samples in each class of the balanced dataset is shown in Table 9.

In order to verify the advantages of the GraphCWGAN-GP method compared with others, the CGAN and WGAN-GP are also used respectively to balance the original imbalanced dataset in the same way as the GraphCWGAN-GP method.
After obtaining the balanced dataset by using GraphCWGAN-GP, several typical DL-based classifiers are used to classify it. The classifiers include NIN-CNN, 1-Dimensional CNN (1D-CNN), 2-Dimensional CNN (2D-CNN) and MLP. Fig. 8 shows the confusion matrices of the four classifiers based on the balanced dataset.
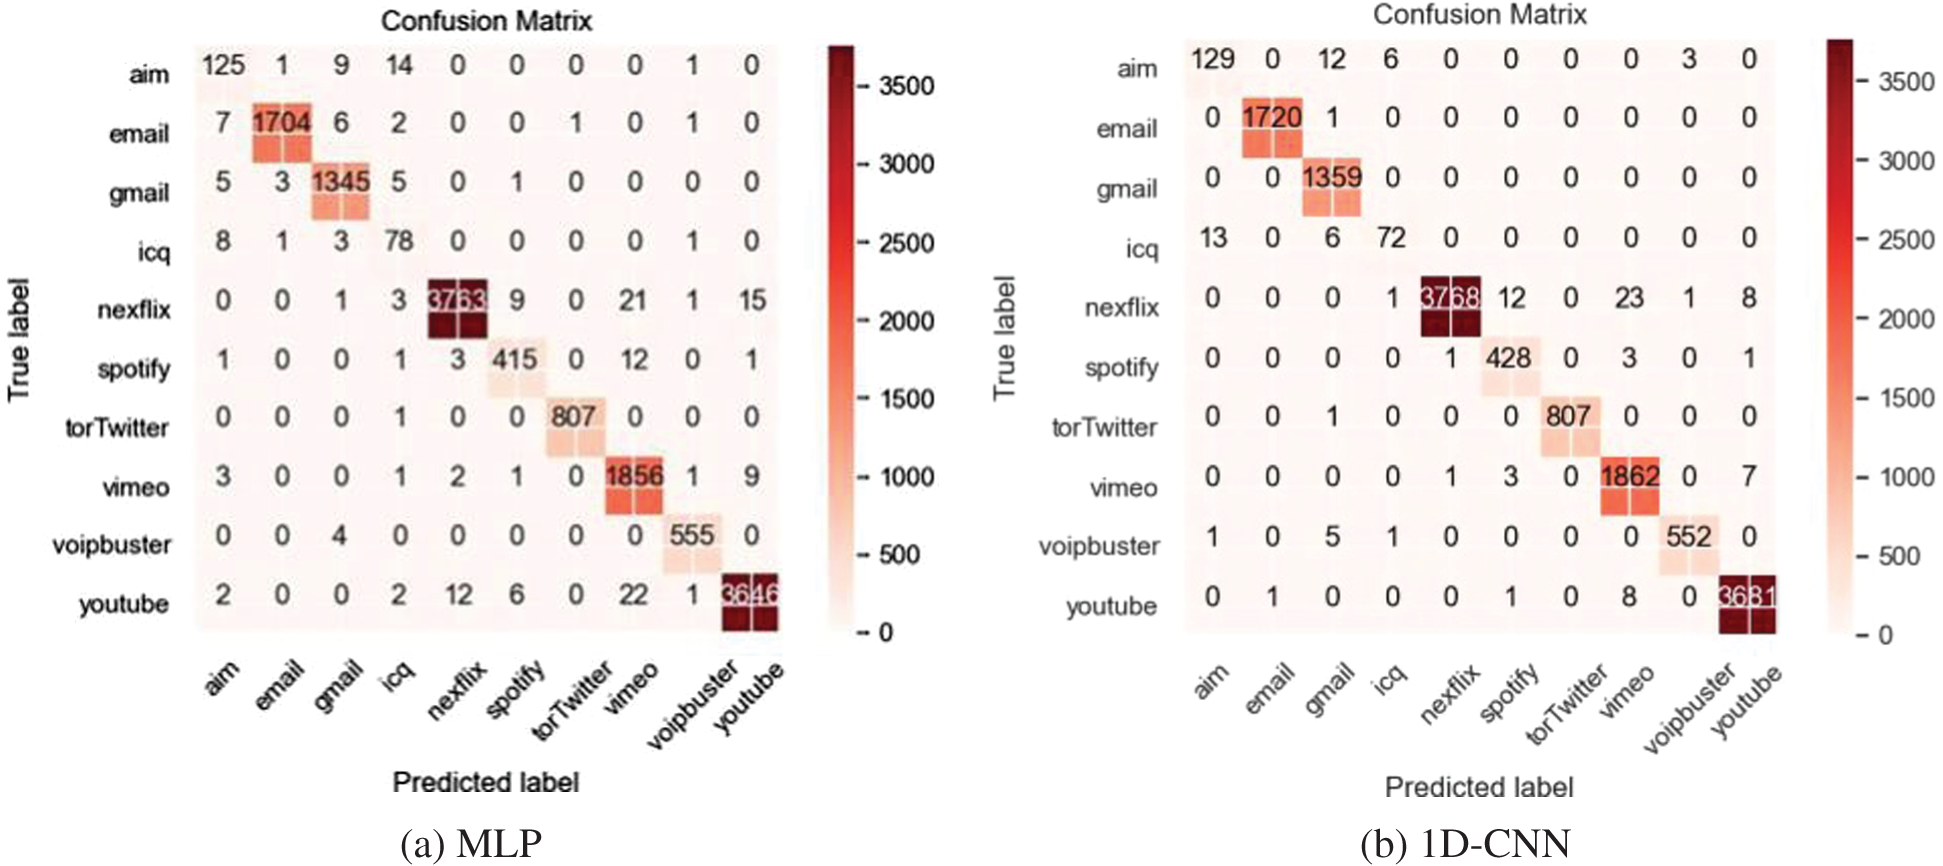
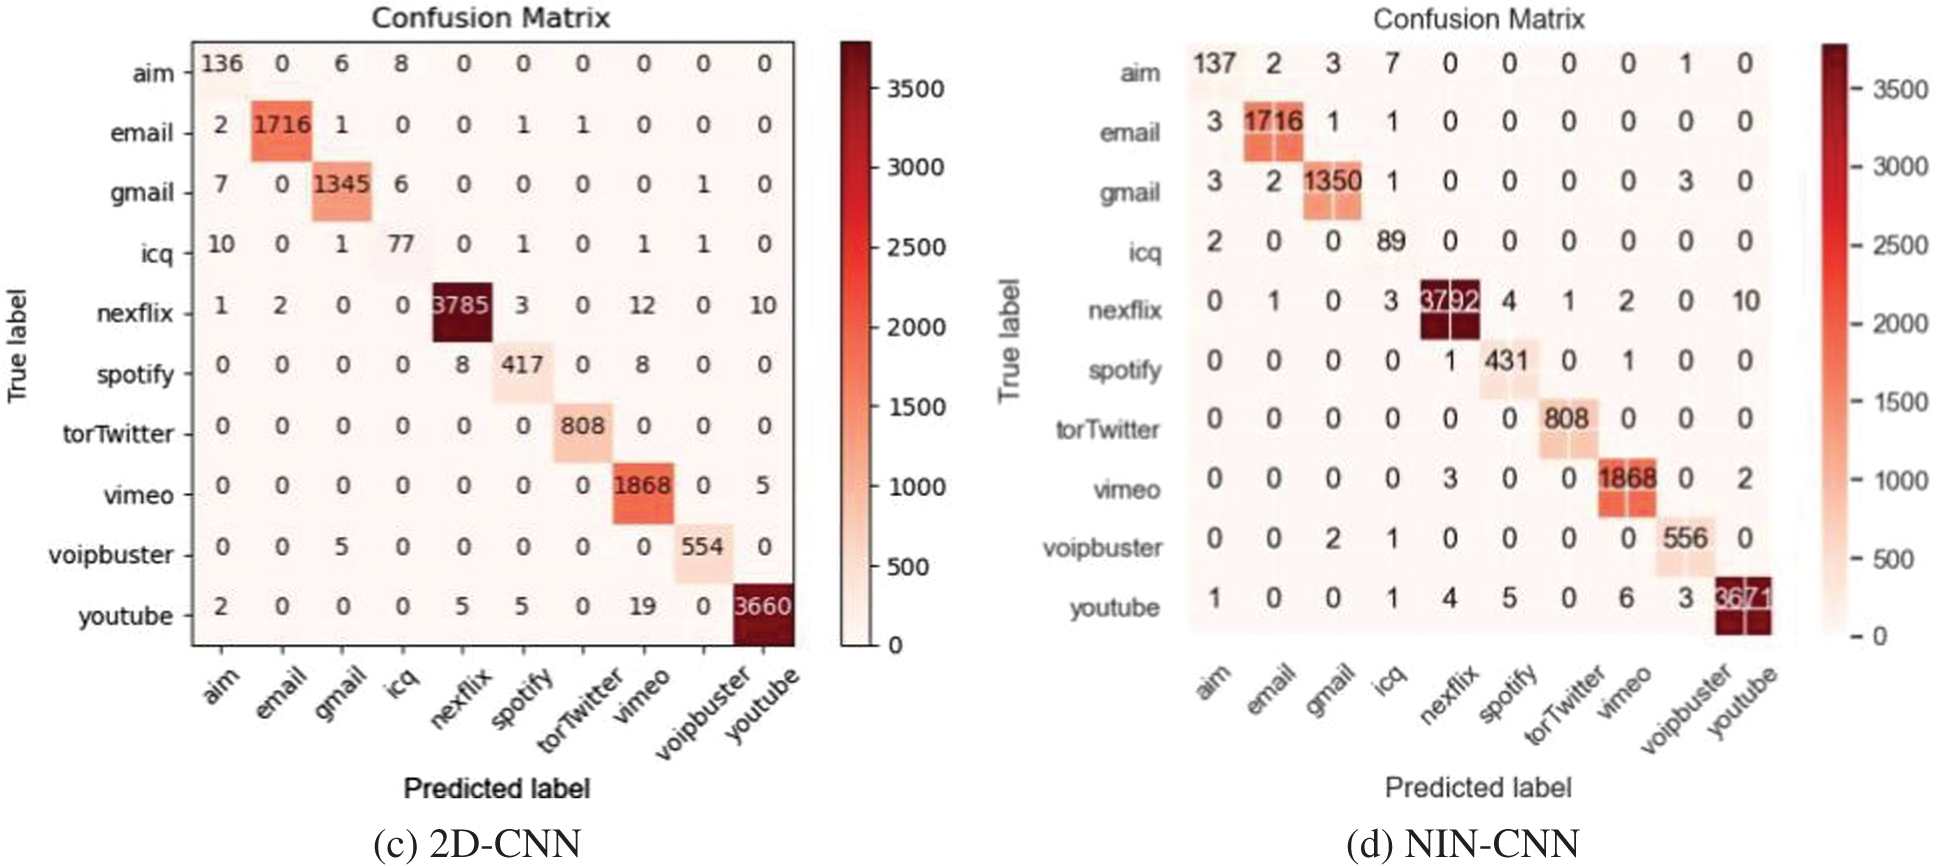
Figure 8: Confusion Matrices of the classification results on the four classifiers
Table 10 shows the classification performance of each classifier based on the balanced dataset. The NIN-CNN outperforms the other three DL-based classifiers in precision, recall and F1-Score. Compared with typical CNN, the NIN-CNN can extract data features better because it adopts a multilayer perceptron convolutional layer to replace the common convolutional layer. Besides, in the NIN-CNN model, the global average pooling layer is used to replace the fully connected layer. It greatly reduces the total network parameters. Therefore, in the next experiment, the NIN-CNN model is used as the classifier to evaluate the data augmenting methods.

In order to illustrate the superiority of the proposed GraphCWGAN-GP method over other methods, we also build CGAN and WGAN-GP models to enhance the imbalanced dataset. Compared with the CGAN, the GraphCWGAN-GP avoids the problem of unstable training and gradient explosion and disappear. The loss value curves of CGAN and GraphCWGAN-GP are shown in Fig. 9. It can be seen that the loss value curve of generator in (a) has a larger fluctuation than (b). Therefore, it can be concluded that the training of the proposed GraphCWGAN-GP is more stable than CGAN.
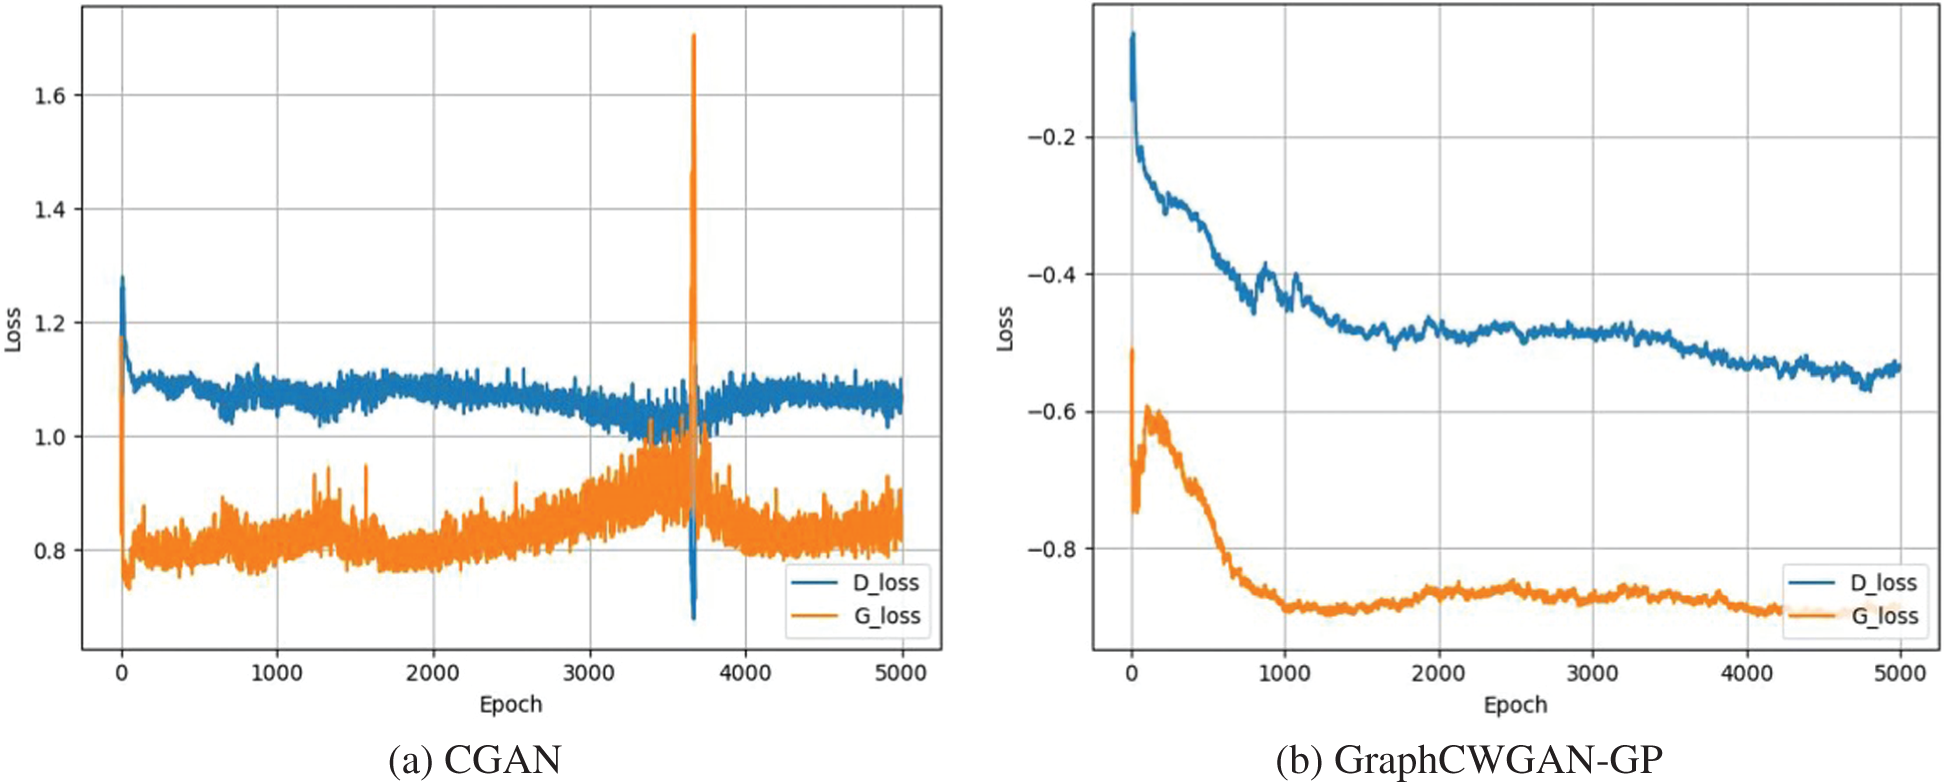
Figure 9: The loss value curves of CGAN and GraphCWGAN-GP
Compared with WGAN-GP, the proposed GraphCWGAN-GP only needs to be trained once to generate samples for all minority classes. We can obtain the synthetic samples of specified classes by adding auxiliary conditional information which is converted by traffic class labels. However, when the WGAN-GP is used to augment the minority classes, it needs to train a model for each minority class separately. In our experiment, it has five classes that need to be augmented. Therefore, five WGAN-GP models should be trained to generate samples for five minority classes. For the sample data of the minority class is too little, it is prone to overfitting when each minority class is trained separately. Therefore, compared with WGAN, the GraphCWGAN-GP has less complexity and is not prone to overfitting.
The data augmenting methods are evaluated and compared through the classification performance on NIN-CNN. Fig. 10 shows the confusion matrices of the NIN-CNN based on the imbalanced dataset and balanced datasets augmented by three methods which are CGAN, WGAN-GP, and GraphCWGAN-GP, respectively.

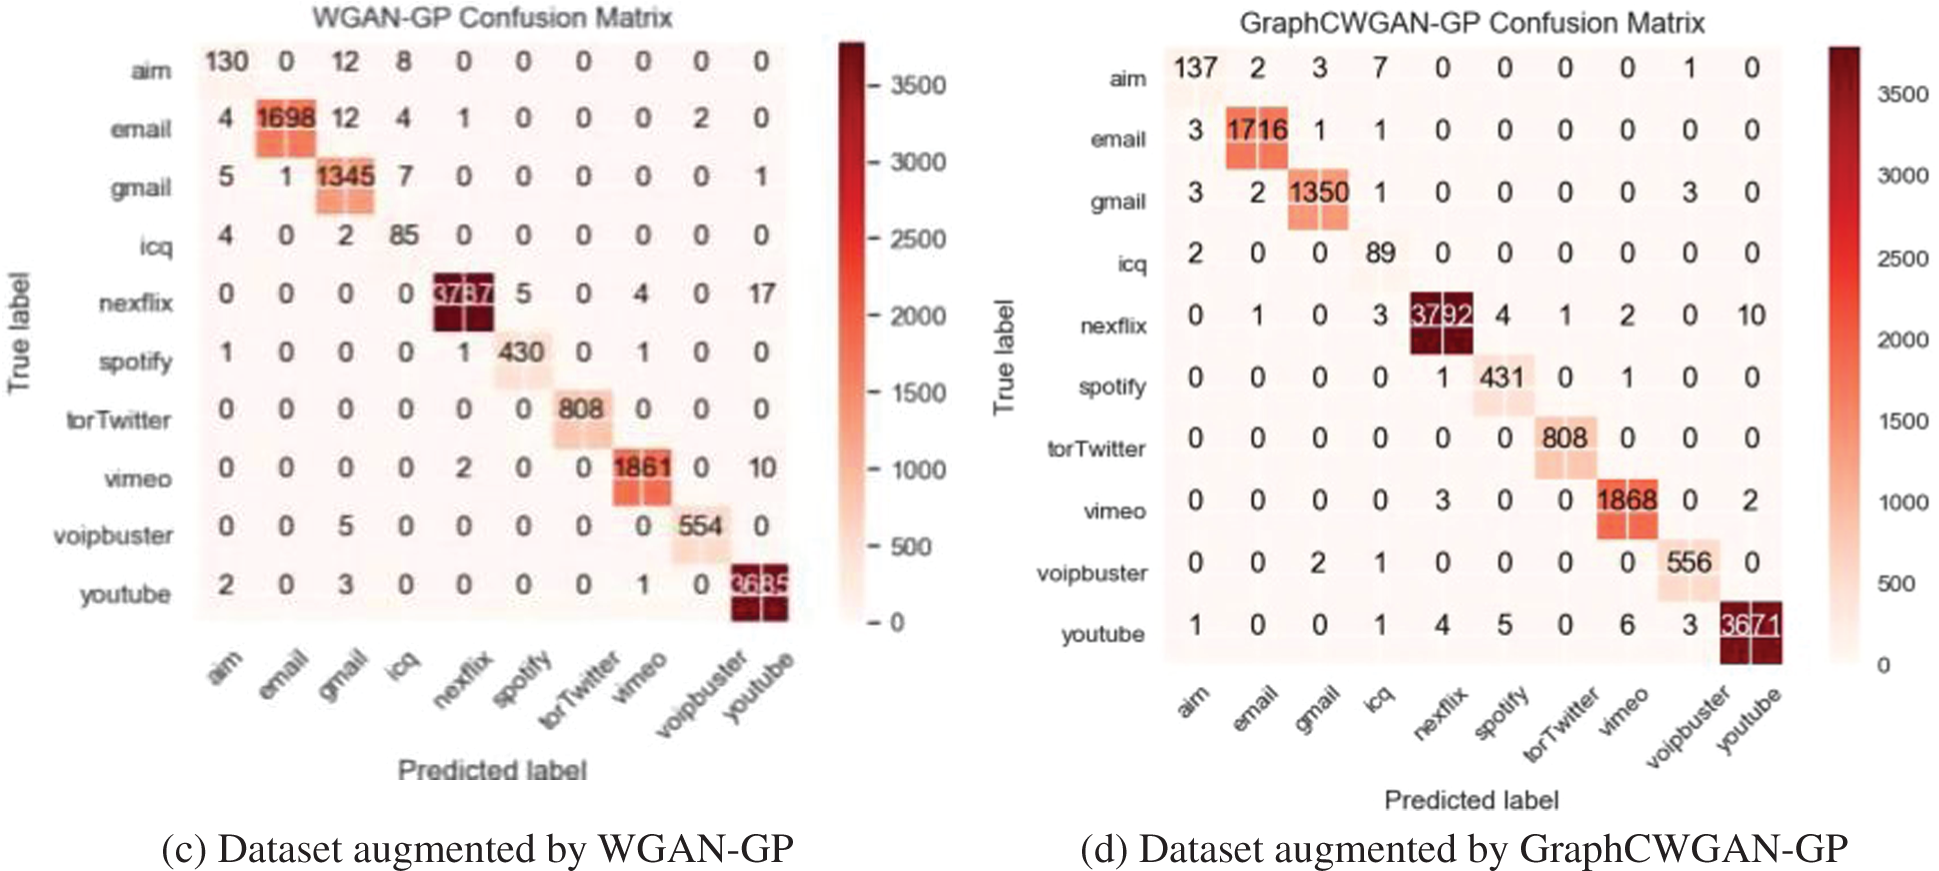
Figure 10: Confusion matrices of the classification results on the NIN-CNN model
The precision recall and F1-Score are used to evaluate the classification performance between the imbalanced dataset and balanced dataset on NIN-CNN. The classification results with 10 classes in a dataset are shown in Fig. 11.
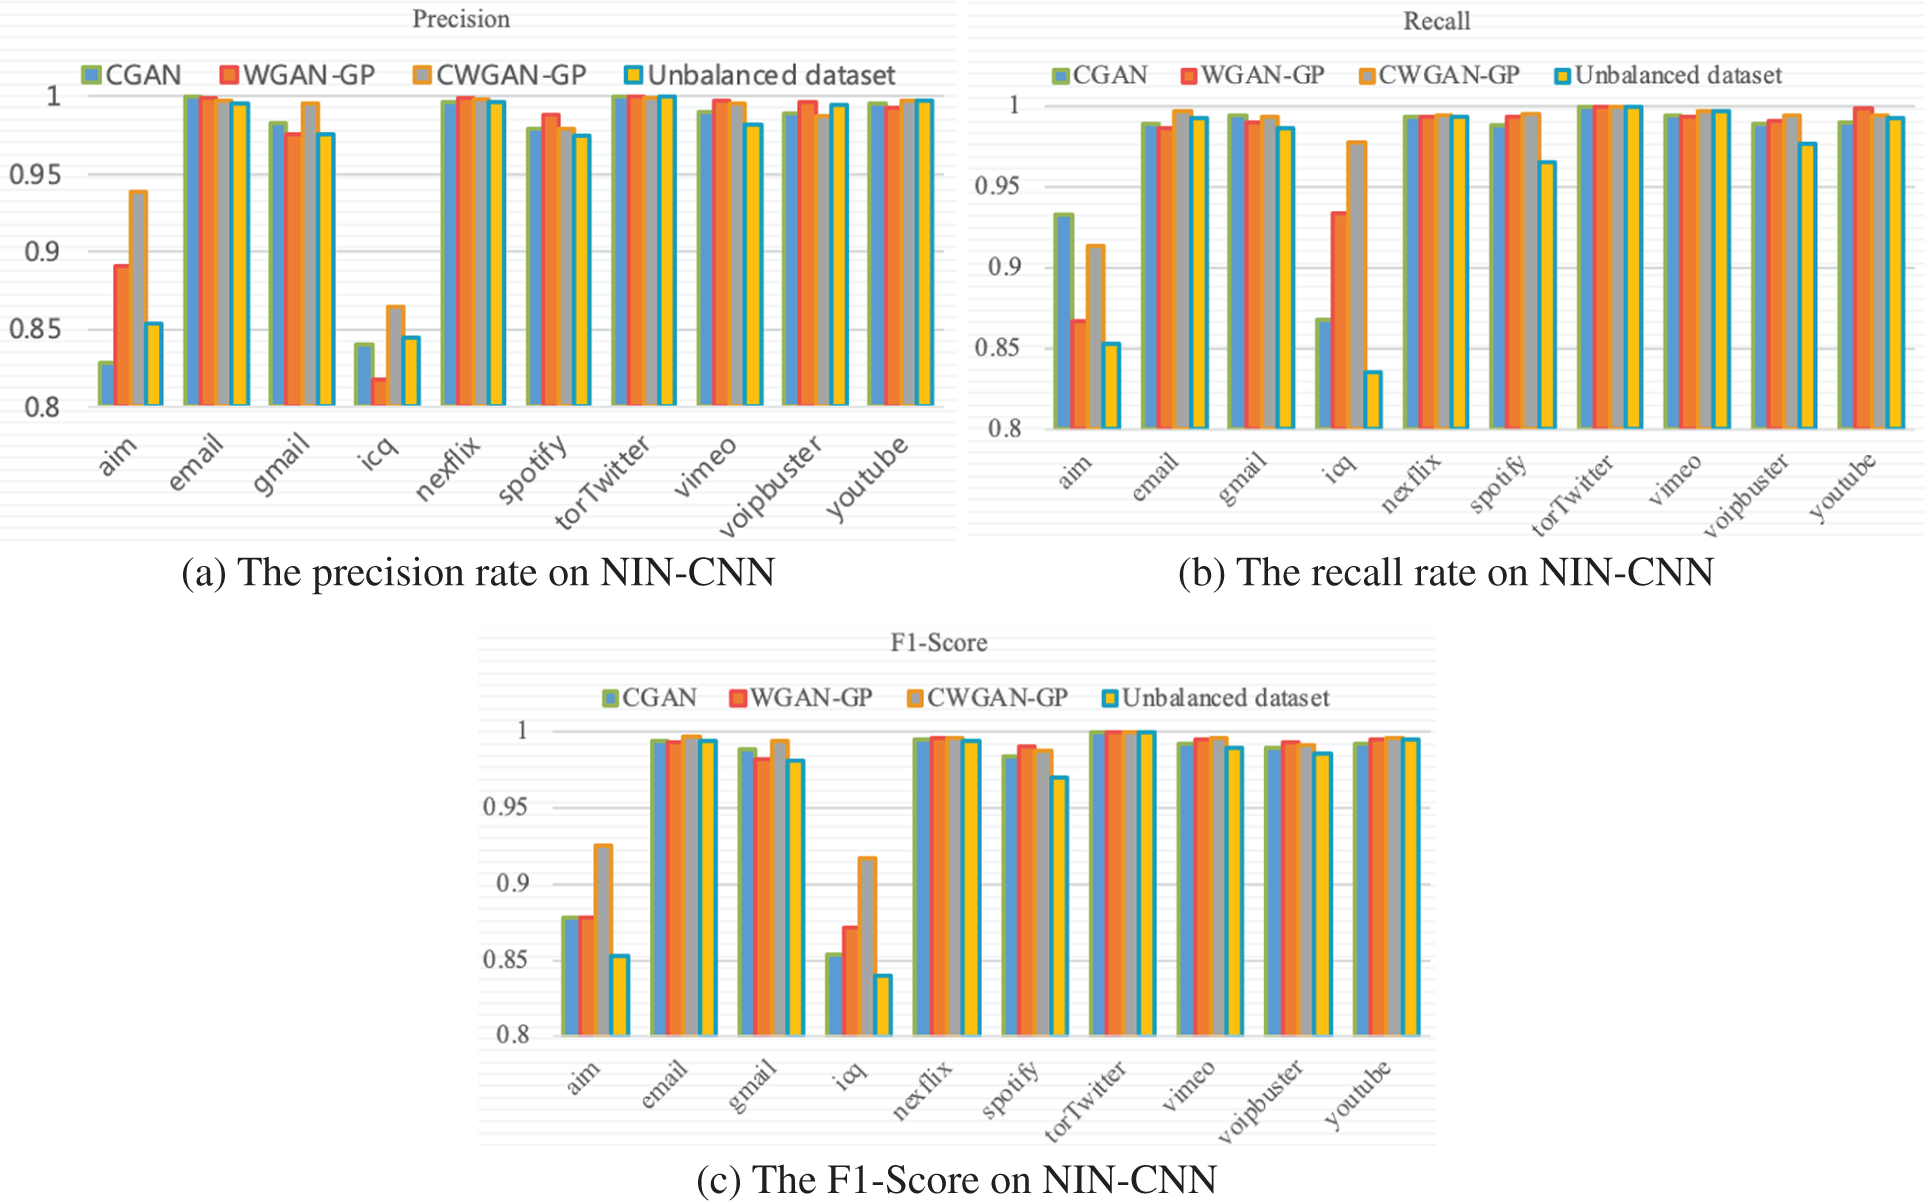
Figure 11: The classification performance of balanced datasets on NIN-CNN
Table 11 shows the overall classification performance on four datasets which include an imbalanced dataset and three balanced datasets augmented by using CGAN, WGAN-GP and GraphCWGAN-GP. It can be seen that the classification performance based on the dataset augmented by GraphCWGAN-GP is better than the other three datasets.

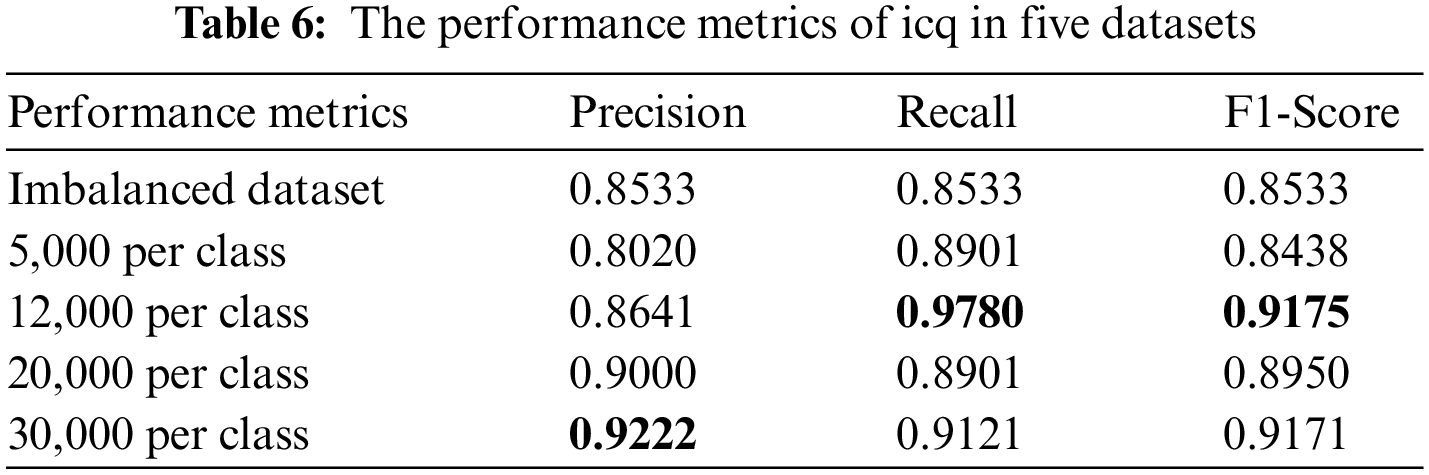
As shown in Table 11, the three applications with the smallest number of samples in the imbalanced dataset are icq, aim, and spotify, which account for 0.63%, 1.03%, and 2.99% of the total sample in the dataset, respectively. Thus, the classification performance is evaluated according to the classification results of these three traffic classes. Tables 12–14 show the performance metrics of icq, aim and spotify in the datasets.

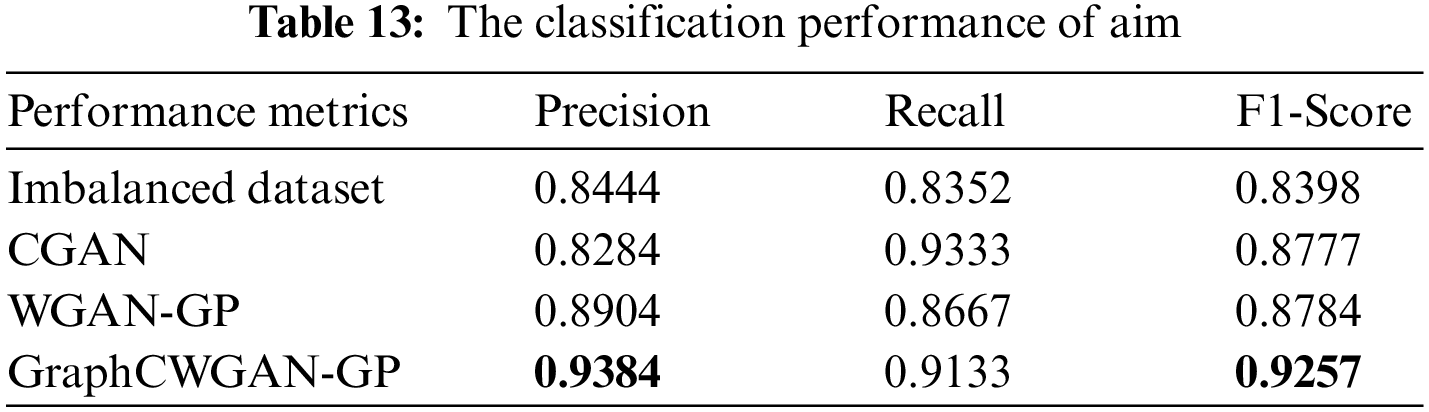
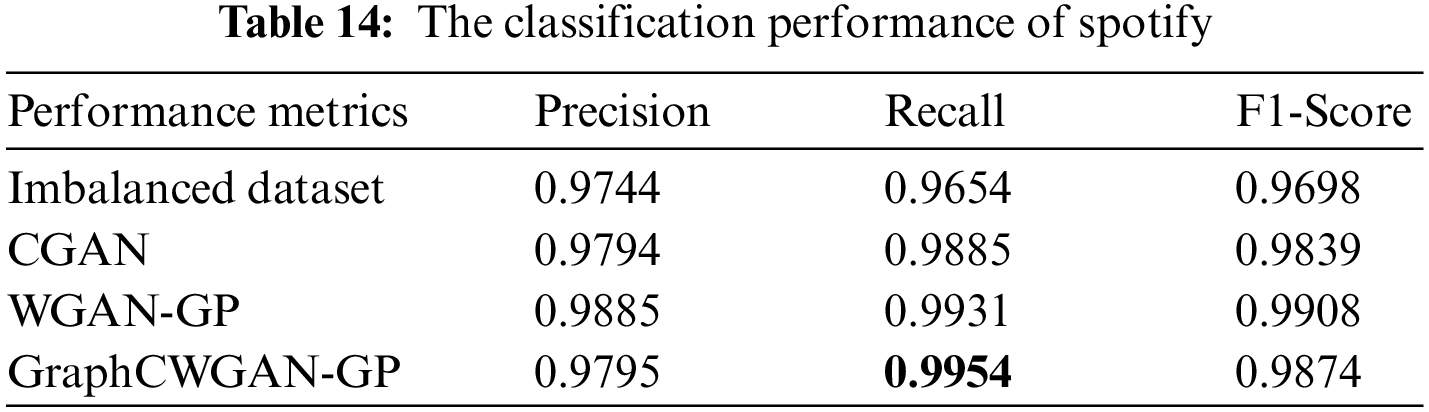
According to the classification performance statistics shown in the above table, it is obvious that the balanced dataset augmented by GraphCWGAN-GP has a significant improvement in classification performance than imbalanced dataset. The precision, recall and F1-Score respectively increase by 9.4%, 12.47% and 8.59% highest in the three minority classes. The statistic verifies the effectiveness of the proposed method in traffic data augmentation. And, the dataset augmented by GraphCWGAN-GP outperforms the other two methods for three minority classes. It proves that the GraphCWGAN-GP can generate more realistic and diverse synthetic samples compared with CGAN and WGAN-GP. Therefore, it can be concluded that the proposed GraphCWGAN-GP is better than the existing data augmenting methods, such as CGAN and WGAN-GP.
6 Conclusions and Future Works
In this paper, we proposed a GraphCWGAN-GP-based traffic data augmenting method for imbalanced encrypted traffic classification. In the method, the traffic data is converted into grayscale images in data preprocessing. The minority class data is augmented with our proposed model, which is built by introducing conditional constraints and a new distance metric in typical GAN. The NIN-CNN classifier is used to classify the balanced dataset, and the classification performance is evaluated by using three performance metrics. The experimental results demonstrate that the GraphCWGAN-GP-based method is superior to the CGAN and WGAN-GP-based methods.
Although the classification performance of the minority class augmented by the GraphCWGAN-GP has a significant improvement compared with other data augmenting methods, there is still a gap in the majority class. We will further improve the generative model to generate more realistic data and tackle the problem of class imbalance in traffic data sets.
Funding Statement: This work was supported by the National Natural Science Foundation of China (Grants Nos. 61931004, 62072250) and the Talent Launch Fund of Nanjing University of Information Science and Technology (2020r061).
Conflicts of Interest: The authors declare that they have no conflicts of interest to report regarding the present study.
References
1. Park, J. S., Yoon, S. H., Kim, M. S. (2011). Software architecture for a lightweight payload signature-based traffic classification system. International Workshop on Traffic Monitoring and Analysis, pp. 136–149. Berlin, Heidelberg. [Google Scholar]
2. Finsterbusch, M., Richter, C., Rocha, E., Muller, J., Hanssgen, K. (2014). A survey of payload-based traffic classification approaches. IEEE Communications Surveys, 16(2), 1135–1156. DOI 10.1109/SURV.2013.100613.00161. [Google Scholar] [CrossRef]
3. Nguyen, T. T. T., Armitage, G. (2009). A survey of techniques for internet traffic classification using machine learning. IEEE Communications Surveys, 10(4), 56–76. DOI 10.1109/SURV.2008.080406. [Google Scholar] [CrossRef]
4. Yuan, R., Li, Z., Guan, X., Xu, L. (2010). An svm-based machine learning method for accurate internet traffic classification. Information Systems Frontiers, 12(2), 149–156. DOI 10.1007/s10796-008-9131-2. [Google Scholar] [CrossRef]
5. Zaklouta, F., Stanciulescu, B., Hamdoun, O. (2011). Traffic sign classification using K-d trees and random forests. The 2011 International Joint Conference on Neural Networks (IJCNN), pp. 2151–2155. San Jose, CA, USA. [Google Scholar]
6. Chawla, N. V. (2003). C4.5 and imbalanced data sets: Investigating the effect of sampling method, probabilistic estimate, and decision tree structure. https://www.eecs.uottawa.ca/~nat/Workshop2003/chawla.pdf. [Google Scholar]
7. Dias, K. L., Pongelupe, M. A., Caminhas, W. M., de Errico, L. (2019). An innovative approach for real-time network traffic classification. Computer Networks, 158, 143–157. DOI 10.1016/j.comnet.2019.04.004. [Google Scholar] [CrossRef]
8. Aceto, G., Ciuonzo, D., Montieri, A., Antonio, P. (2020). Toward effective mobile encrypted traffic classification through deep learning. Neurocomputing, 409, 306–315. DOI 10.1016/j.neucom.2020.05.036. [Google Scholar] [CrossRef]
9. Al-Haija, Q. A., Zein-Sabatto, S. (2020). An efficient deep-learning-based detection and classification system for cyber-attacks in IoT communication networks. Electronics, 9(12), 21–52. DOI 10.3390/electronics9122152. [Google Scholar] [CrossRef]
10. Aceto, G., Ciuonzo, D., Montieri, A., Pescape, A. (2019). Mobile encrypted traffic classification using deep learning: Experimental evaluation, lessons learned, and challenges. IEEE Transactions on Network and Service Management, 445–458. DOI 10.1109/TNSM.4275028. [Google Scholar] [CrossRef]
11. Lotfollahi, M., Zade, R. S. H., Siavoshani, M. J., Saberian, M. (2020). Deep packet: A novel approach for encrypted traffic classification using deep learning. Soft Computing, 24(3), 1999–2012. DOI 10.1007/s00500-019-04030-2. [Google Scholar] [CrossRef]
12. Aceto, G., Ciuonzo, D., Montieri, A., Pescapè, A. (2019). MIMETIC: Mobile encrypted traffic classification using multimodal deep learning. Computer Networks, 165, 1–12. DOI 10.1016/j.comnet.2019.106944. [Google Scholar] [CrossRef]
13. Wang, W., Zhu, M., Wang, J., Zeng, X., Yang, Z. (2017). End-to-end encrypted traffic classification with one-dimensional convolution neural networks. 2017 IEEE International Conference on Intelligence and Security Informatics (ISI), pp. 43–48. Beijing, China. [Google Scholar]
14. Wang, P., Ye, F., Chen, X., Qian, Y. (2018). Datanet: Deep learning based encrypted network traffic classification in SDN home gateway. IEEE Access, 6, 55380–55391. DOI 10.1109/ACCESS.2018.2872430. [Google Scholar] [CrossRef]
15. Dong, S., Xia, Y., Peng, T. (2021). Network abnormal traffic detection model based on semi-supervised deep reinforcement learning. IEEE Transactions on Network and Service Management, 18(4), 4197–4212. DOI 10.1109/TNSM.2021.3120804. [Google Scholar] [CrossRef]
16. Possebon, I. P., Silva, A. S., Granville, L. Z., Schaeffer-Filho, A., Marnerides, A. (2019). Improved network traffic classification using ensemble learning. 2019 IEEE Symposium on Computers and Communications (ISCC), pp. 1–6. Barcelona, Spain. DOI 10.1109/ISCC47284.2019.8969637. [Google Scholar] [CrossRef]
17. Wang, P., Chen, X., Ye, F., Sun, Z. (2019). A survey of techniques for mobile service encrypted traffic classification using deep learning. IEEE Access, 7, 54024–54033. DOI 10.1109/ACCESS.2019.2912896. [Google Scholar] [CrossRef]
18. Dong, S., Li, R. (2019). Traffic identification method based on multiple probabilistic neural network model. Neural Computing and Applications, 31(2), 473–487. DOI 10.1007/s00521-017-3081-x. [Google Scholar] [CrossRef]
19. Dong, S., Wang, P., Abbas, K. (2021). A survey on deep learning and its applications. Computer Science Review, 40, 100379. DOI 10.1016/j.cosrev.2021.100379. [Google Scholar] [CrossRef]
20. Chawla, N. V., Japkowicz, N., Kotcz, A. (2004). Editorial: Special issue on learning from imbalanced data sets. ACM SIGKDD Explorations Newsletter, 6(1), 1–6. DOI 10.1145/1007730.1007733. [Google Scholar] [CrossRef]
21. Sun, Y., Wong, A. K., Kamel, M. S. (2009). Classification of imbalanced data: A review. International Journal of Pattern Recognition and Artificial Intelligence, 23(4), 687–719. DOI 10.1142/S0218001409007326. [Google Scholar] [CrossRef]
22. Laurikkala, J. (2001). Improving identification of difficult small classes by balancing class distribution. 8th Conference on Artificial Intelligence in Medicine in Europe, pp. 63–66. Cascais, Portugal. [Google Scholar]
23. Chawla, N. V., Bowyer, K. W., Hall, L. O., Kegelmeyer, W. P. (2002). SMOTE: Synthetic minority over-sampling technique. Journal of Artificial Intelligence Research, 16(1), 321–357. DOI 10.1613/jair.953. [Google Scholar] [CrossRef]
24. Naseriparsa, M., Al-Shammari, A., Sheng, M., Zhang, Y., Zhou, R. (2020). RSMOTE: Improving classification performance over imbalanced medical datasets. Health Information Science and Systems, 8(8), 30–38. DOI 10.1007/s13755-020-00112-w. [Google Scholar] [CrossRef]
25. Goodfellow, I. J., Pouget-Abadie, J., Mirza, M., Xu, B., Warde-Farley, D. et al. (2014). Generative adversarial nets. Proceedings of NIPS, pp. 2672–2680. [Google Scholar]
26. Ma, D., Liu, B., Kang, Z., Zhou, J., Zhu, J. et al. (2020). Two birds with one stone: Transforming and generating facial images with iterative GAN. Neurocomputing, 396(5), 278–290. DOI 10.1016/j.neucom.2018.10.093. [Google Scholar] [CrossRef]
27. Islam, J., Zhang, Y. (2020). Gan-based synthetic brain pet image generation. Brain Informatics, 7(1). DOI 10.1186/s40708-020-00104-2. [Google Scholar] [CrossRef]
28. Andreini, P., Bonechi, S., Bianchini, M., Mecocci, A., Scarselli, F. (2020). Image generation by GAN and style transfer for agar plate image segmentation. Computer Methods and Programs in Biomedicine, 184, 105268. DOI 10.1016/j.cmpb.2019.105268. [Google Scholar] [CrossRef]
29. Zhang, H., Huang, L., Wu, C. Q., Li, Z. (2020). An effective convolutional neural network based on smote and Gaussian mixture model for intrusion detection in imbalanced dataset. Computer Networks, 177, 107315. DOI 10.1016/j.comnet.2020.107315. [Google Scholar] [CrossRef]
30. Dong, S., Xia, Y., Peng, T. (2021). Traffic identification model based on generative adversarial deep convolutional network. Annals of Telecommunications, 77, 573–587. DOI 10.1007/s12243-021-00876-6. [Google Scholar] [CrossRef]
31. Wang, Z., Wang, P., Zhou, X., Li, S., Zhang, M. (2019). FLOWGAN: Unbalanced network encrypted traffic identification method based on GAN. 2019 IEEE International Conference on Parallel Distributed Processing with Applications, Big Data Cloud Computing, Sustainable Computing Communications, Social Computing Networking, pp. 975–983. Xiamen, China. DOI 10.1109/ISPA-BDCloud-SustainCom-SocialCom48970.2019.00141. [Google Scholar] [CrossRef]
32. Wang, P., Li, S., Ye, F., Wang, Z., Zhang, M. (2020). PacketCGAN: Exploratory study of class imbalance for encrypted traffic classification using CGAN. IEEE International Conference on Communications (ICC), pp. 1–7. Dublin, Ireland. DOI 10.1109/ICC40277.2020.9148946. [Google Scholar] [CrossRef]
33. Lee, W., Noh, B., Kim, Y., Jeong, K. (2019). Generation of network traffic using WGAN-GP and a DFT filter for resolving data imbalance. International Conference on Internet and Distributed Computing Systems, pp. 306–317. Naples, Italy. [Google Scholar]
34. Gulrajani, I., Ahmed, F., Arjovsky, M., Dumoulin, V., Courville, A. (2017). Improved training of wasserstein gans. Advances in Neural Information Processing Systems, 30, 5767–5777. [Google Scholar]
35. Draper-Gil, G., Lashkari, A. H., Mamun, M. S. I., Ghorbani, A. A. (2016). Characterization of encrypted and VPN traffic using time-related features. Proceedings of the 2nd International Conference on Information Systems Security and Privacy (ICISSP 2016), pp. 407–414. Rome, Italy. [Google Scholar]
Cite This Article
 Copyright © 2023 The Author(s). Published by Tech Science Press.
This work is licensed under a Creative Commons Attribution 4.0 International License , which permits unrestricted use, distribution, and reproduction in any medium, provided the original work is properly cited.
 Downloads
 Citation Tools