
 Submit a Paper
 Propose a Special lssue
 Open Access
ARTICLE

A Spacecraft Equipment Layout Optimization Method for Diverse and Competitive Design
College of Aerospace Science and Engineering, National University of Defense Technology, Changsha, 410073, China
* Corresponding Authors: Yong Zhao. Email: ; Bingxiao Du. Email:
(This article belongs to the Special Issue: New Trends in Structural Optimization)
Computer Modeling in Engineering & Sciences 2023, 136(1), 621-654. https://doi.org/10.32604/cmes.2023.025143
Received 03 July 2022; Accepted 15 September 2022; Issue published 05 January 2023
 View Full Text
 Download PDF
Abstract
The spacecraft equipment layout optimization design (SELOD) problems with complicated performance constraints and diversity are studied in this paper. The previous literature uses the gradient-based algorithm to obtain optimized non-overlap layout schemes from randomly initialized cases effectively. However, these local optimal solutions are too difficult to jump out of their current relative geometry relationships, significantly limiting their further improvement in performance indicators. Therefore, considering the geometric diversity of layout schemes is put forward to alleviate this limitation. First, similarity measures, including modified cosine similarity and gaussian kernel function similarity, are introduced into the layout optimization process. Then the optimization produces a set of feasible layout candidates with the most remarkable difference in geometric distribution and the most representative schemes are sampled. Finally, these feasible geometric solutions are used as initial solutions to optimize the physical performance indicators of the spacecraft, and diversified layout schemes of spacecraft equipment are generated for the engineering practice. The validity and effectiveness of the proposed methodology are demonstrated by two SELOD applications.Keywords
The rapid development of space technology and industrialization has put forward new goals for spacecraft design, including shortening the design cycle, reducing development cost and ensuring design reliability. The spacecraft equipment layout optimization design (SELOD) is a vital part of the overall spacecraft design [1–3], which refers to the study of how to make full use of the limited space of the spacecraft and arrange instruments and equipment optimally under the premise of satisfying the engineering and technical conditions and various constraints of the internal and surrounding environment. It requires the integrated use of multidisciplinary knowledge [4,5] like aerospace, mechanics, graphics, and geometry. The pros and cons of the design indicators are directly concerned with the performance, reliability, and cost of the spacecraft.
Several methods have been proposed and applied to solve the layout problem in recent years. These methods have well-established mathematical models, focusing on solving the strong constraint of geometric non-overlap between equipment. Zhang et al. [6] proposed novel methods for optimizing the layout of structural systems, whose key ideas are using level set functions (LSFs) to describe the shapes of arbitrary irregular embedding components and resorting to the concept of the structural skeleton to formulate the distance control constraints explicitly. Fakoor et al. [7] provided a new concept based on the finite circle method (FCM) to express geometric constraints mathematically and proposed a hybrid method to optimize layout design, a combination of simulated annealing optimization and the quasi-Newton method. Chen et al. [8] proposed an enhanced interference algorithm based on the finite circle method and used an accelerated particle swarm optimization to optimize the constructed layout model globally. Qin et al. [9] presented an optimization tool for integrating CAD software as well as optimization algorithms to automatically find solutions for equipment layouts in satellites. Zhong et al. [10] presented a component assignment and layout integration optimization algorithm, aiming to expand the solution space of component layout optimization to further improve the component layout design, which can assign components to each module of the satellite dynamically during the optimization procedure. Chen et al. [11] proposed a novel satellite layout optimization design approach based on the phi-function, which provides a simple, effective and simultaneously accurate way to handle the geometry constraints with an explicit mathematical expression. Sun et al. [12] studied a multimodal optimization method and proposed an improved niching-based cross-entropy method to find multiple solutions simultaneously for more design diversity. These methods can effectively solve the geometric non-overlap problems. LSF, FCM and phi-function methods are the most widely used. FCM uses multiple envelope circles to approximate the equipment with arbitrary geometric shapes. The construction way is simple. However, as an approximate description method, if fewer envelope circles are used to fit the equipment, the approximation error is bound to be large, resulting in a waste of design space. Suppose we want to describe the components more accurately and improve the approximate accuracy. In that case, it is necessary to generate more envelope circles, which will lead to a sharp increase in the number of non-overlap constraints, increasing the computational costs. The method of using LSFs to model the geometry of the equipment is to express the geometric boundary with zero surfaces of level set functions, which can effectively construct the geometry of any shape. It is noted that the calculation of the integral expression is grid-based and parameter-based. Especially when the objects have some sharp angles, it may cause inaccurate overlap detection. If more accurate approximations are to be obtained, denser grids and more parameters are required, which incurs higher computational costs. The phi-function method describes the geometric constraints between components through an explicit analytical expression and geometry constraints between components can be readily quantified by the phi-function value which has certain advantages.
Furthermore, some optimizations are made aiming at the physical performance of the overall spacecraft structure. Cuco et al. [13] presented a multi-objective methodology that was developed to find solutions for a three-dimensional spacecraft equipment layout automatically. It included mass, inertia, thermal, subsystem requirements and geometric constraints using a multi-objective approach that combines CAD and optimization tools in an integrated environment. Fakoor et al. [14] proposed an automatic tool, based on multi-objective optimization methods for a three-dimensional layout of spacecraft subsystems considering essential constraints such as the center of gravity, the moment of inertia, thermal distribution, natural frequencies and structural strength. Qin et al. [15] proposed a multi-objective methodology for satellite cabin layout optimization considering the space debris impact risk whose main goal was to examine the trade relationship between space use, the center of gravity offset, and the space debris impact risk index.
It should be noted that the SELOD problem is a kind of large-scale system problem, usually solved by a gradient-based algorithm. Therefore, it is easy to fall into the local optimal solution. How to get much more and better layout schemes is still an unsolved problem, but it is crucial for designers. Therefore, it is of great significance for developing spacecraft design to form an intelligent algorithm to generate diverse layout solutions by studying the SELOD approaches.
Diverse design methods have achieved remarkable progress in spacecraft design, especially in structural topology optimization considering competitiveness and diversity. Wang et al. [16] presented three graphic diversity measures, cross-correlation, modified cross-correlation and the sum of squared differences to set the desired diversity to find diverse competitive designs for topology optimization problems. Xie et al. [17] and Yang et al. [18] presented some simple and effective strategies for achieving diverse and competitive structural designs which are successfully applied in the computational morphogenesis of various structures. Cai et al. [19] explored two strategies, namely, the penalizing length method and the modifying ground structure method, for generating diverse truss structures while maintaining structural performance. Li et al. [20] proposed a metric named trD which maintains several desired properties for measuring the diversity, considering that the single global optimum may be invalid because of some uncertainties. Dommaraju et al. [21] addressed the problem of finding geometric features that can be used to explore topologically optimized structures and identify diverse designs based on geometrical properties in a design space. Jang et al. [22] proposed a reinforcement learning-based generative design process, with reward functions maximizing the diversity of topology designs. Deng et al. [23] proposed a new parametric level set method for topology optimization based on a deep neural network (DNN) to generate diverse and competitive designs with different network architectures. Ryu et al. [24] developed a novel multi-objective topology optimization method with a configuration-based clustering scheme, simultaneously considering the diversity and uniformity of the optimum solutions in the objective and design variable spaces.
Concerning the approaches of diversity design considered in the structural topology optimization, we present a novel SELOD approach where the diversity between layout schemes is considered in this paper. Two similarity measures are used as diversity metrics between layout schemes, cosine similarity and gaussian kernel function similarity. In the optimization process, the minimum similarity between layout schemes is set as the objective to obtain the schemes with the greatest diversity. Thus, more references are provided for engineering design.
The remainder of this paper is organized as follows. In Section 2, a phi-function method for constructing analytic geometric interference formula is presented. In Section 3, two measures, modified cosine similarity and gaussian kernel function similarity are established. Also, an approach for sampling is summarized called determinantal point processes. Models are established for the diverse SELOD problem and the layout problem considering physical performance in Section 4. Section 5 is devoted to demonstrating the effectiveness of the proposed novel diverse SELOD approach through two examples. Finally, some concluding remarks are provided in Section 6.
2 Non-Overlap Layout Design Method Based on Phi-Function
The spacecraft’s physical performance calculation needs to be carried out under the premise of non-overlap between equipment. While due to the strong constraints of geometric non-overlap, the solution space of layout schemes is characterized by discontinuity and strong nonlinearity. If using Monte Carlo random sampling, most samples are invalid solutions with interference. Therefore, by constructing an analytic geometric overlap formula, gradient optimization methods can be used to efficiently converge to a feasible non-overlap solution from random initial values iteratively.
2.1 Phi-Function for Geometric Non-Overlap
The phi-function method [25,26] is a typical and effective method to describe the relative position between two geometries. The central idea is to calculate the corresponding phi-function value to determine whether two geometries overlap. The phi-function satisfies the properties described in Eq. (1): when
where
In the case of a two-dimensional geometry, for example, a reference point is firstly selected when describing the position information of the geometry. Once the reference point of the geometry has been determined, the position parameters of the geometry can be determined using a set of point coordinates and a rotation angle. The coordinate system is usually based on the geometric centre as the origin. The specific shape of the object can then be characterized based on the geometric information of the object, and the position relationship between the objects can then be calculated as a phi-function. The principles of calculation between two three-dimensional geometries are similar and can be obtained by further derivation. The construction of the phi-function presented in this section can be applied to the geometric description of the distance between the spatial contours of the equipment of the vast majority of spacecraft. Some common phi-functions between two-dimensional geometries are defined as follows.
2.1.1 Phi-Function between Circles
For two circles
2.1.2 Phi-Function between Convex Polygons
In case of a convex m-polygon
where
2.1.3 Phi-Function Between a Circle and a Convex Polygon
Concerning an m-convex polygon K, the vertices are denoted by
where
2.1.4 Phi-Function between Non-Convex Polygons
Suppose
where
2.2 Examples: Packing Problems in a Circular Container
In this sub-section, three simple examples of layout problems are given to demonstrate the effectiveness of using phi-function in calculating interference between geometries. Figs. 1–3 show the layout problems considering four squares, four circles and two circles and two squares, respectively. They are required to be placed compactly within a circular design domain and the calculation target is set to find the radius value of the smallest envelope circle that can enclose these geometries. In these three examples, calculating the interference between circles and squares is the key to solving them. We perform the overlap volume calculation by the phi-function method described above, applying a gradient-based SQP algorithm to the optimization, with the problem described as follows:
where
Figs. 1a–3a show the layout schemes for a random initial position of the equipment, respectively, where the equipment is randomly distributed and irregular interference occurs. Parts of intermediate solutions to the optimization process are also presented. The final optimization obtained is as expected, with the equipment being able to align closely to generate an envelope circle with the smallest radius, as shown in Figs. 1e–3e. Thus, it is reasonable to use the analytic geometric interference formula constructed by phi-function to solve the layout problems.
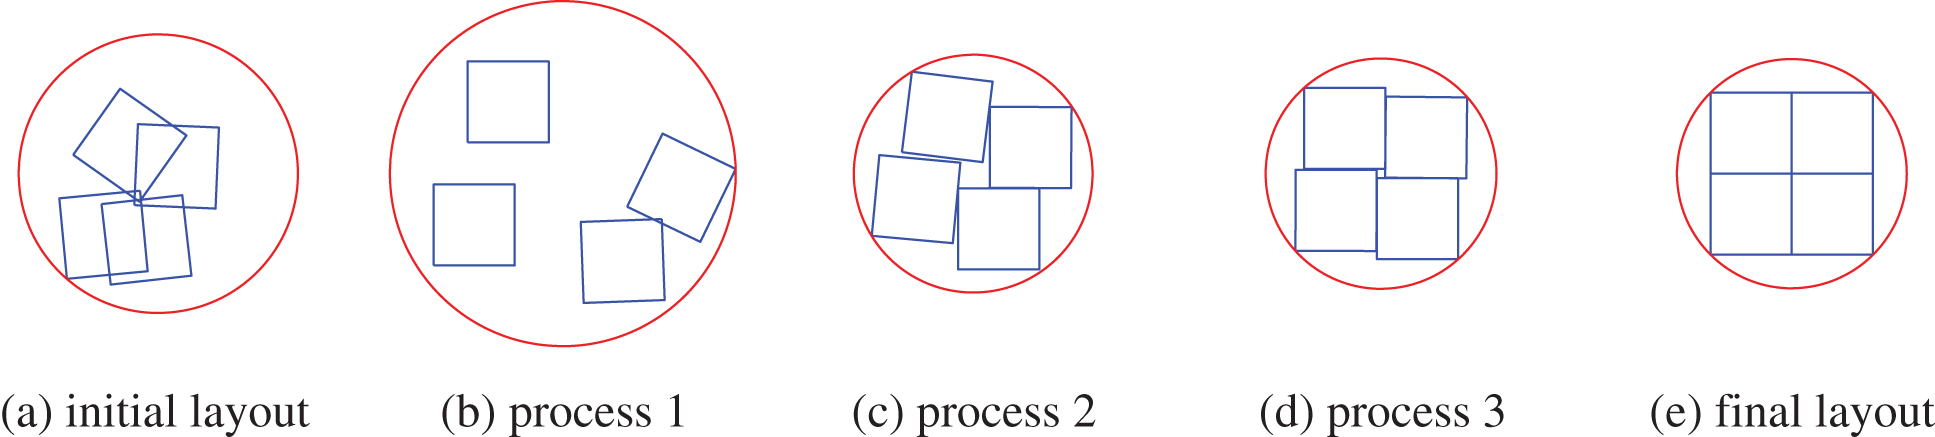
Figure 1: Layout problem with four squares
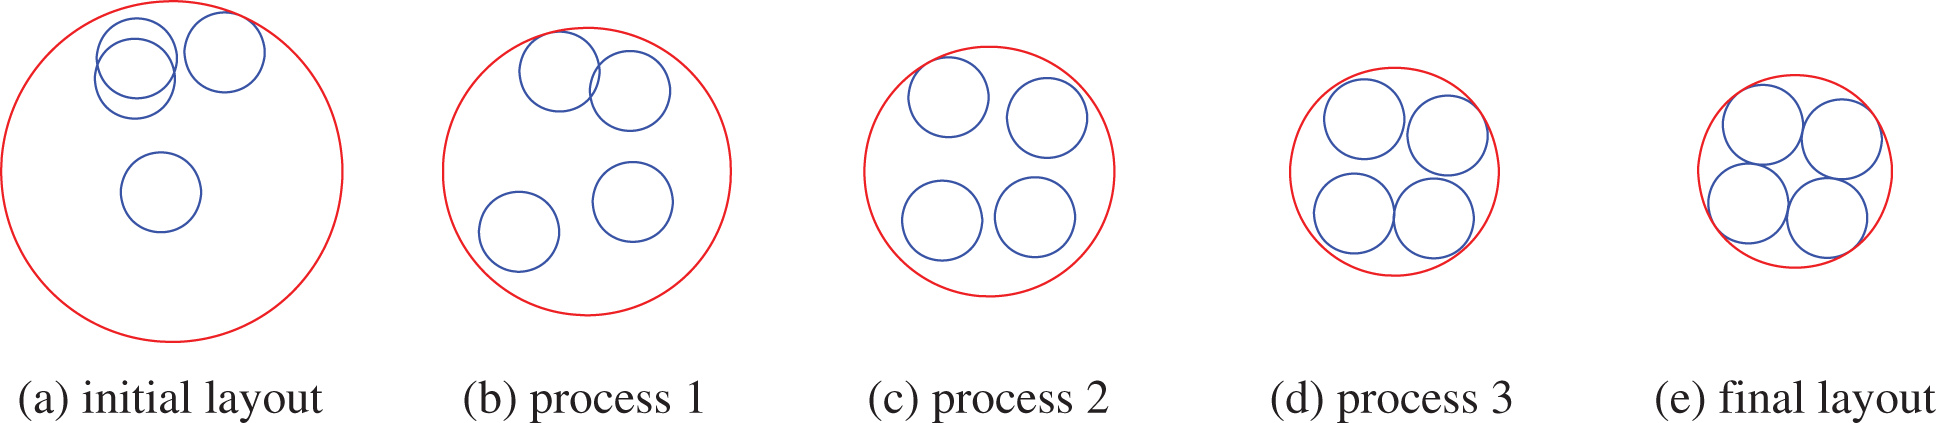
Figure 2: Layout problem with four circles
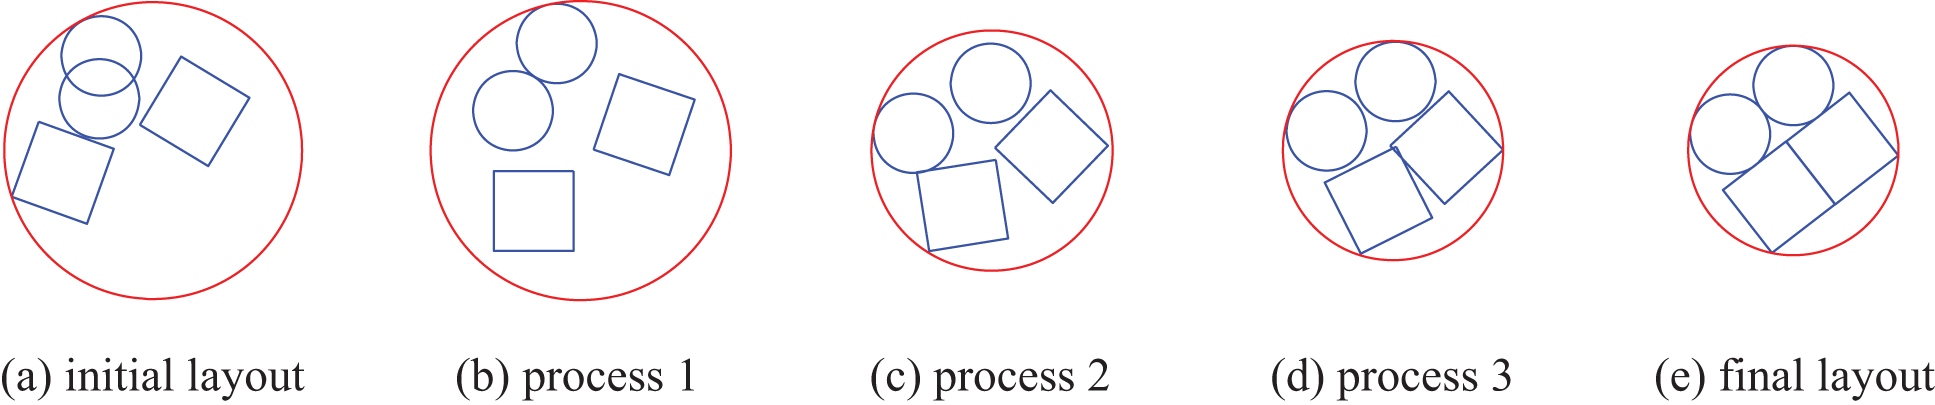
Figure 3: Layout problem with two circles and two squares
3 Diversity Measures and Sample Methods
The SELOD problem considering physical performance often starts with a geometrical non-overlap layout scheme. The optimization process for obtaining geometrical non-overlap layout solutions based on phi-function is usually carried out using gradient-based algorithms. Gradient optimization has a severe initial value dependence, which makes it challenging to obtain a layout with optimal performance because of the tendency to fall into the local optima after iteration. To obtain much more and better layout schemes, we cannot simply optimize by randomly generating many initial layout schemes. This approach is not only time-consuming but also unscientific. This section proposes the idea of adding diversity measure indicators into the optimization process, guiding the optimization of layout schemes that generate diversity. In the SELOD problem, each layout scheme corresponds to a set of vectors describing the coordinates of geometric position, so the chosen measures are based on vector calculations, namely the modified cosine similarity and the gaussian kernel function similarity, respectively.
3.1 Modified Cosine Similarity
Cosine similarity is defined as the cosine of the angle between two vectors. The cosine value determines whether the two vectors are pointing in approximately the same direction. For example, when the two vectors point in the same direction, the cosine value is 1; when the angle between the two vectors is 90°, the cosine value is 0; and when the two vectors point in precisely opposite directions, the cosine value is −1. With this property, we use the cosine similarity to assess the similarity of layout schemes, as shown in Eq. (8).
where
As an example of the distribution of points in the plane, as shown in Fig. 4a, ten points are distributed in a square region with unit side length. The distance of these points from the origin is fixed at 1. Without setting a similarity target, the distribution of points is entirely random. In the coordinate system, each point corresponds to a coordinate, and the similarity between the points can be calculated according to the definition of cosine similarity. By setting the minimum similarity between points as the target for distribution optimization, it can be found that these points are uniformly distributed within a right angle of the square region, as shown in Fig. 4b.
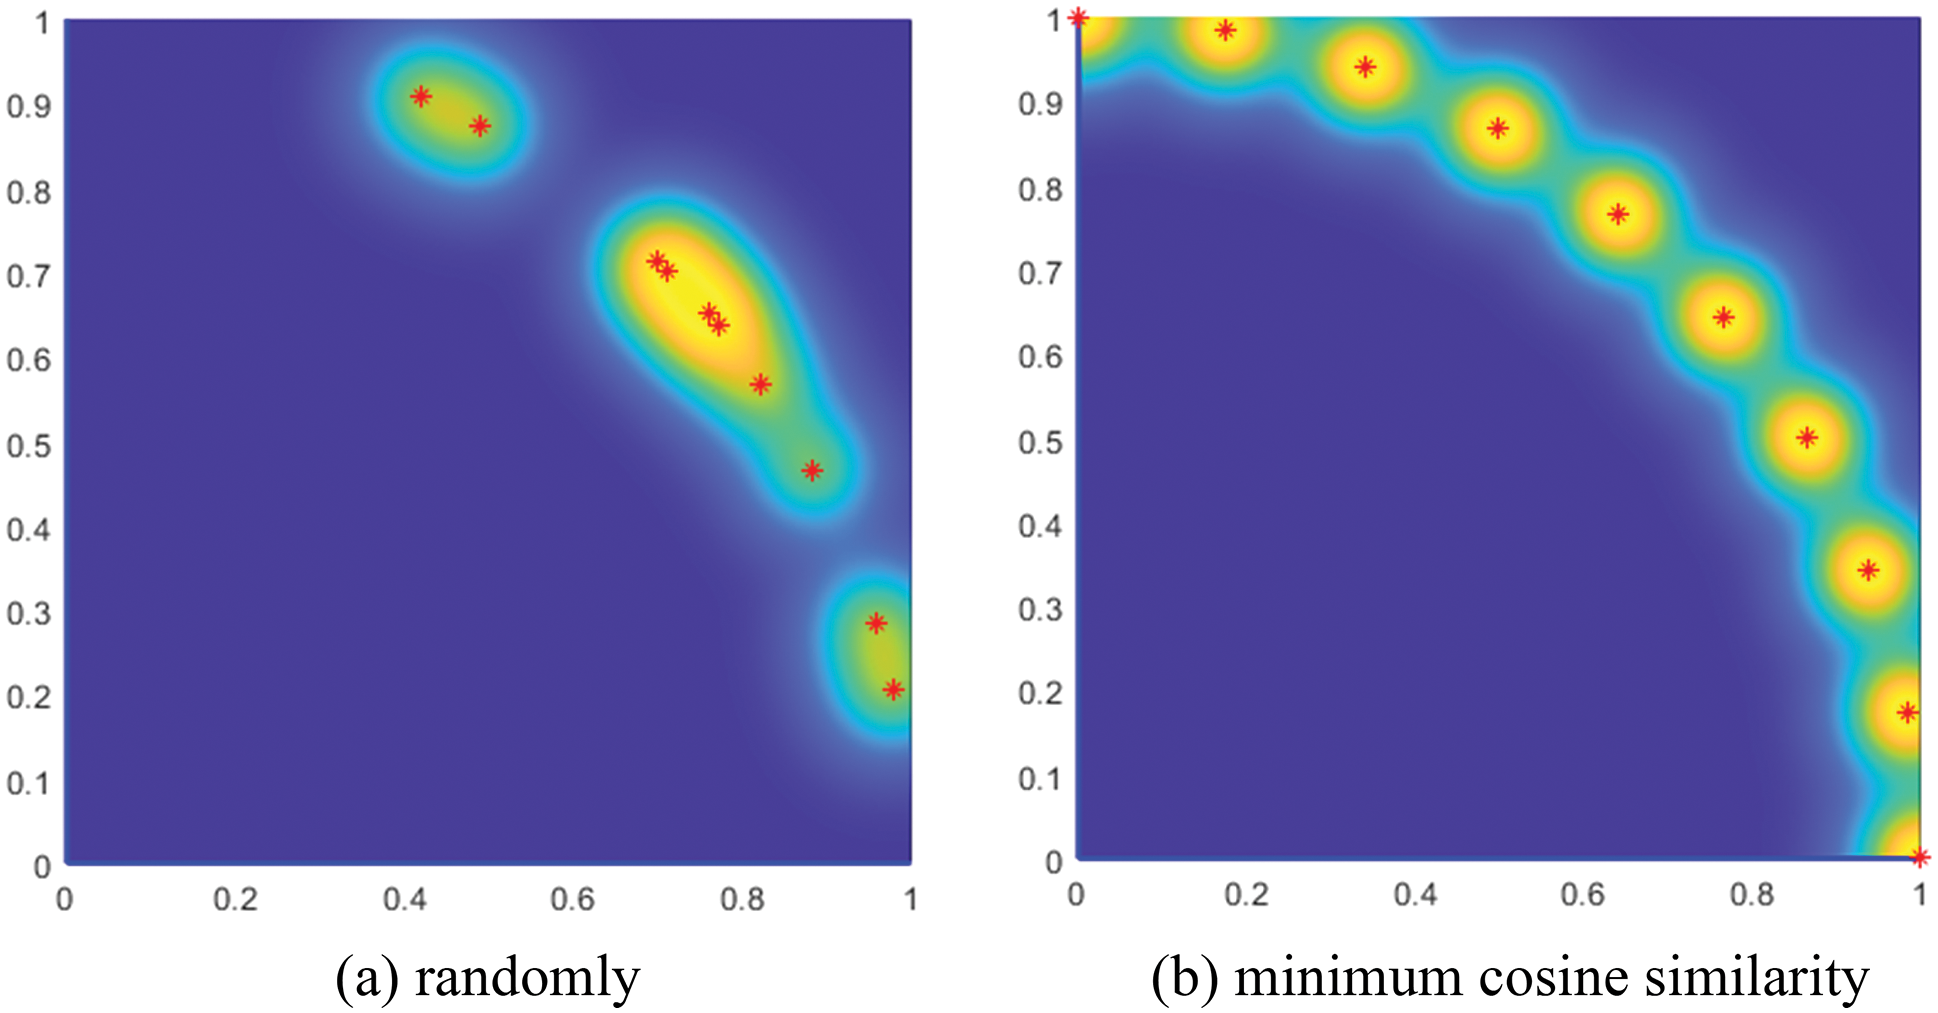
Figure 4: 10 points distributed in a square
However, the attention to cosine similarity focuses on whether the directions of the two vectors point in the same. In the SELOD problem, solutions that can be obtained from each other by simple non-overlap transformations are highly similar, such as those that can be overlapped by rotating a certain angle around the center of mass of the current layout solution. Therefore, we propose an improved method for calculating cosine similarity. Primarily, the coordinates of the equipment are transferred to a coordinate system with the center of mass of the system as the origin and a scheme is chosen to be rotated by a certain angle around the center of mass. Then the cosine similarity to the other fixed layout schemes is calculated using several solutions resulting from the rotation. Finally, the maximum value of the cosine between the rotated schemes and the fixed one is taken as the similarity value between the two schemes, which alleviates the limitations of cosine similarity to some extent.
where
As shown in Fig. 5, there are two layout schemes presented, where one circle and two squares are placed vertically on a circular plate. Respectively, the coordinates of equipment in layout scheme A are set as
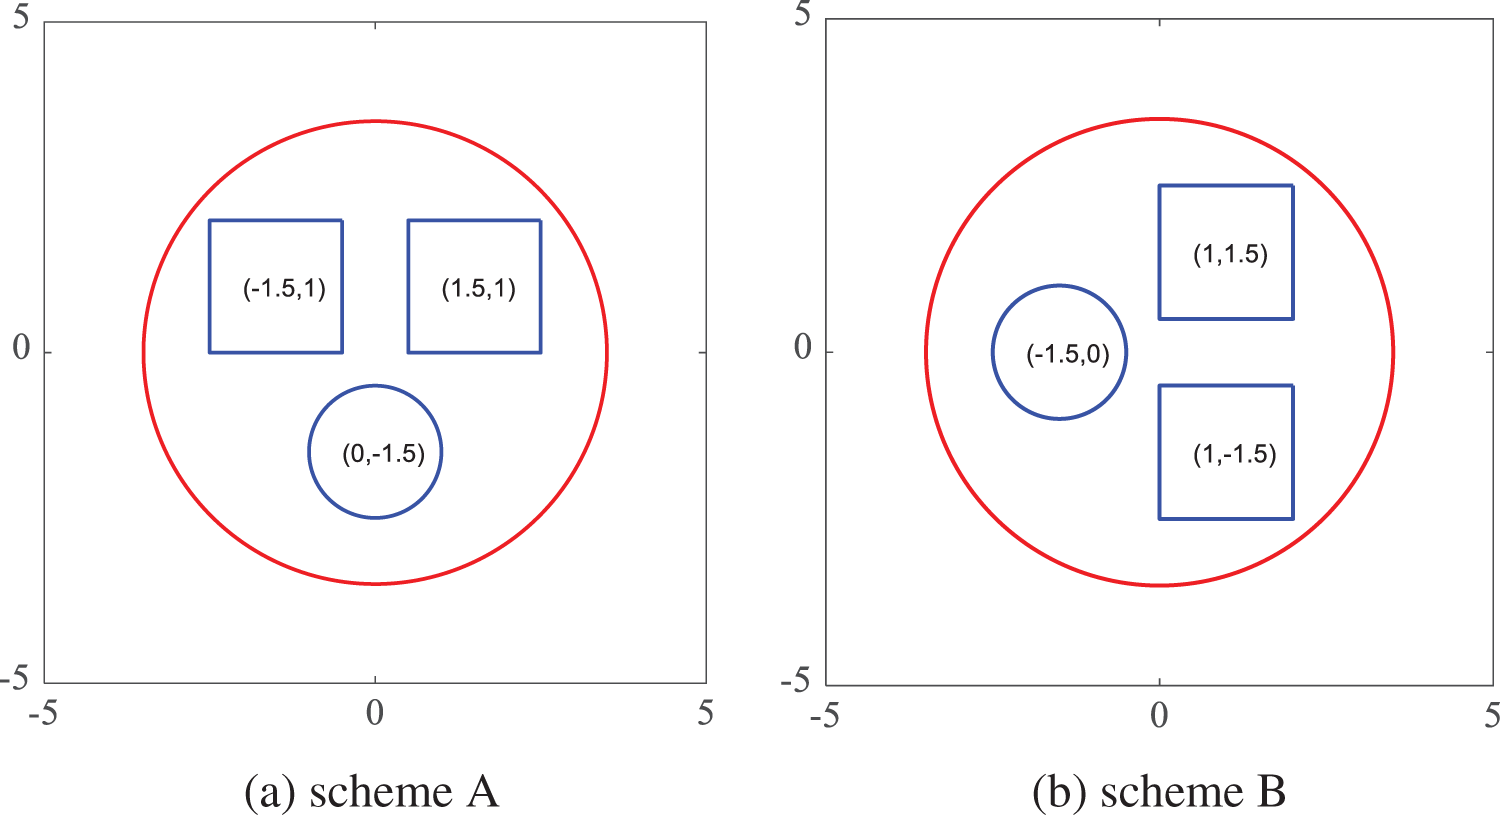
Figure 5: Two “same” layout schemes
3.2 Gaussian Kernel Function Similarity
Gaussian kernel function [27–30], also called radial basis function, is usually defined as a monotonic function of the Euclidean distance between any two points in space and can be written as
where
Similarly, as shown in Fig. 6a, twenty points are distributed in a circular region with a diameter of 1. Without setting a similarity target, the distribution of points is completely random. The gaussian kernel function similarity between the points can also be calculated here. By setting the minimum similarity between points as the target for distribution optimization, it can be found that these points are uniformly distributed in the circular region, as shown in Fig. 6b.
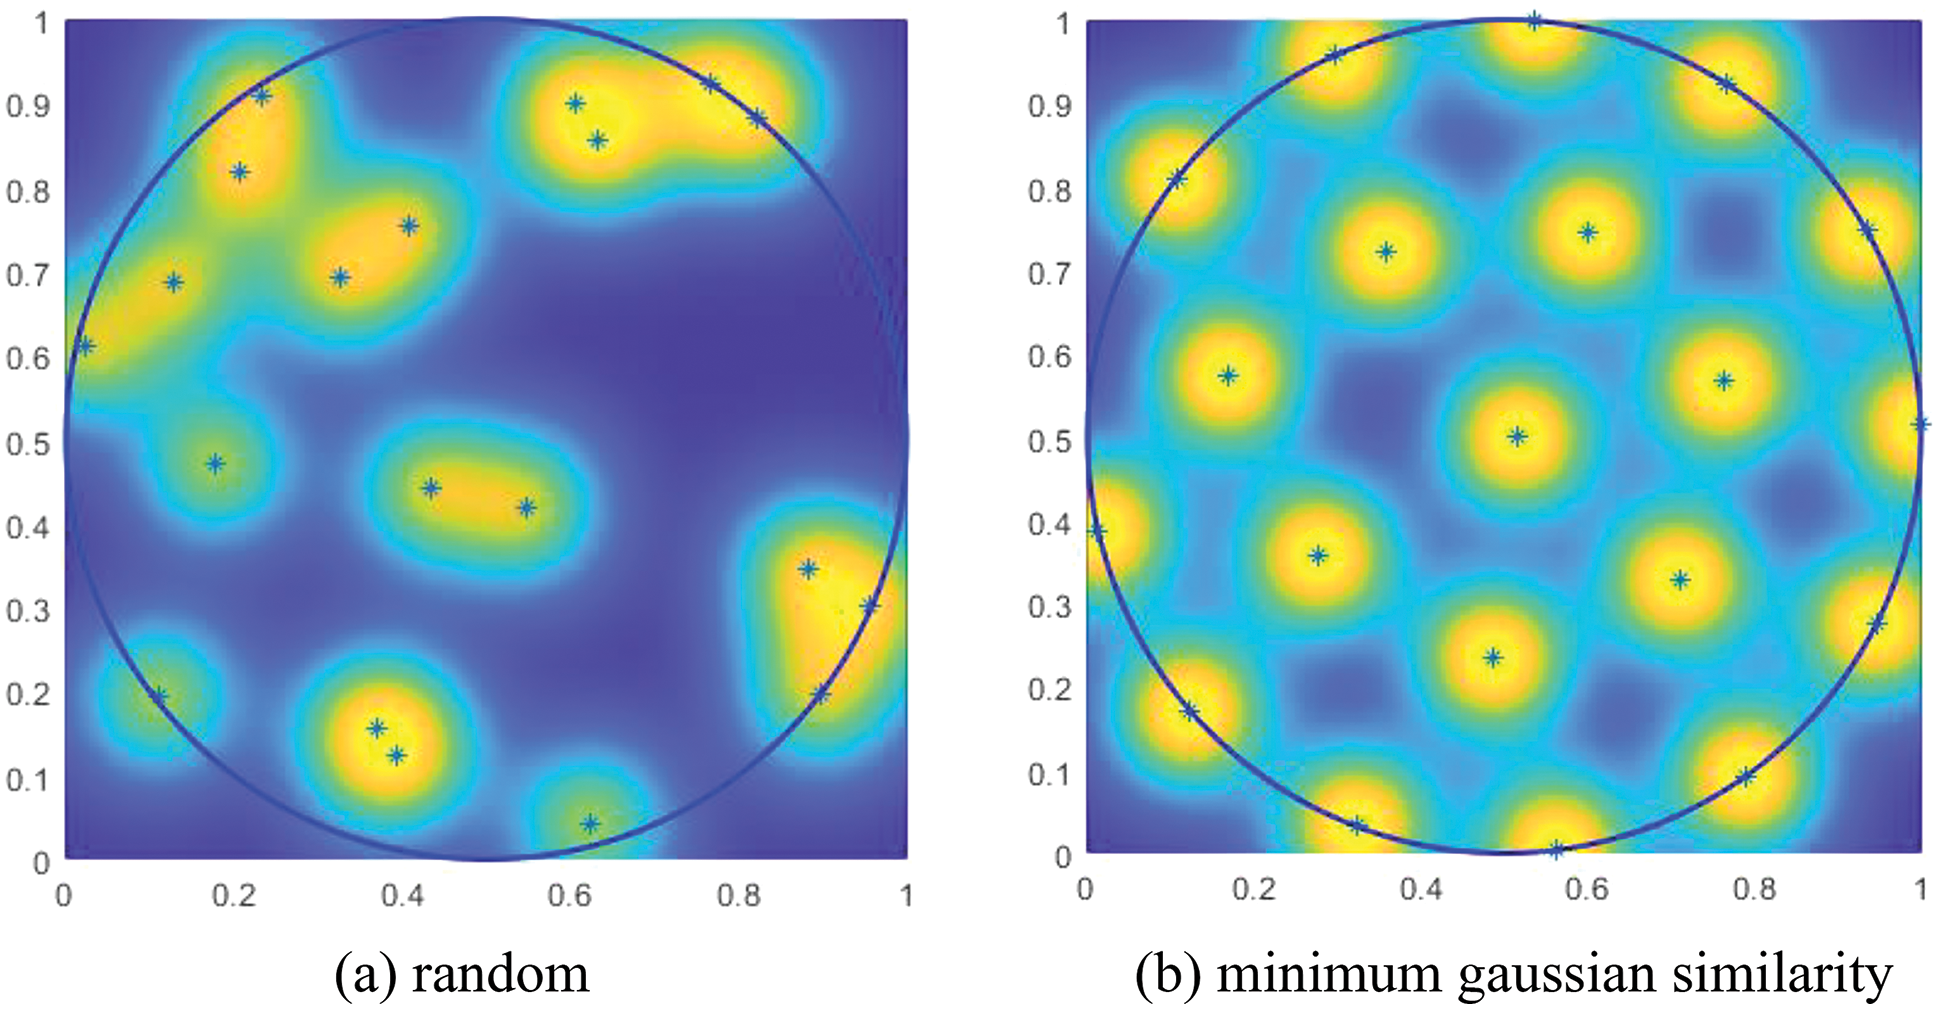
Figure 6: 20 points distributed in a circle
“Gaussian kernel function similarity” and “cosine similarity” are different diversity measures that assess the similarity of layout schemes within their respective scales. As two measures, they are less directly comparable with one another. In general, the gaussian kernel function similarity represents the absolute difference in value, while the cosine similarity represents the difference in direction. The former is a measure of length, and it is defined only by distance and proximity. Whereas the latter is a measure of direction. With a cosine similarity of 1, we cannot say that the two vectors are the same, but only that they are similar, since they are just in the same direction, like (3, 3) and (5, 5). However, the gaussian kernel function similarity measures the length, and the similarity is 1 when the length is 0, so they can be considered the same. In short, the use of measures is case by case, depending on whether the focus is on absolute or relative distance.
3.3 Determinantal Point Processes
The use of selected similarity measures for the diverse SELOD problem allows that a large sample of diverse layout schemes can be generated quickly. Nevertheless, due to the high computational limitations, it is impossible to use all layout schemes obtained as initial solutions for the next step of optimization. Hence, we need to further select the most different and representative new samples from these random samples.
Determinantal point processes (DPPs) are probabilistic models for sampling subsets from the full set, firstly proposed by Kulesza [31]. The method is now widely used in generative learning for sample acquisition, which can generate new samples that cover the design space and are of high quality. Elfeki et al. [32] drew inspiration from DPPs to realize a generative model that alleviates mode collapse while producing higher-quality samples. Chen et al. [33] developed a new variant of GAN, named performance augmented diverse generative adversarial network (PaDGAN) by using a new loss function, based on DPPs for generative models to encourage both high-quality and diverse design synthesis. Zhang et al. [34] presented a many-objective evolutionary algorithm with DPPs (MaOEADPPs) to simultaneously maintain convergence and population diversity in the high-dimensional objective space.
DPPs model the likelihood of selecting a subset of diverse items as the determinant of a kernel matrix. The probability of a subset being selected is equal to the ratio of the kernel matrix determinant of the subset to the kernel matrix determinant of the full set, as shown in Eq. (11).
where
The probability of a and b being sampled at the same time is quite smaller when the similarity between a and b is higher. As shown in Fig. 7, the left shows the distribution obtained by picking points in space using DPPs, and the right shows the distribution obtained by picking points in space using random sampling. Individuals with better distribution in space can be obtained by using DPPs to sample. Therefore, after obtaining several sets of diverse layout schemes, the most diverse feasible solutions can be obtained by using DPPs.
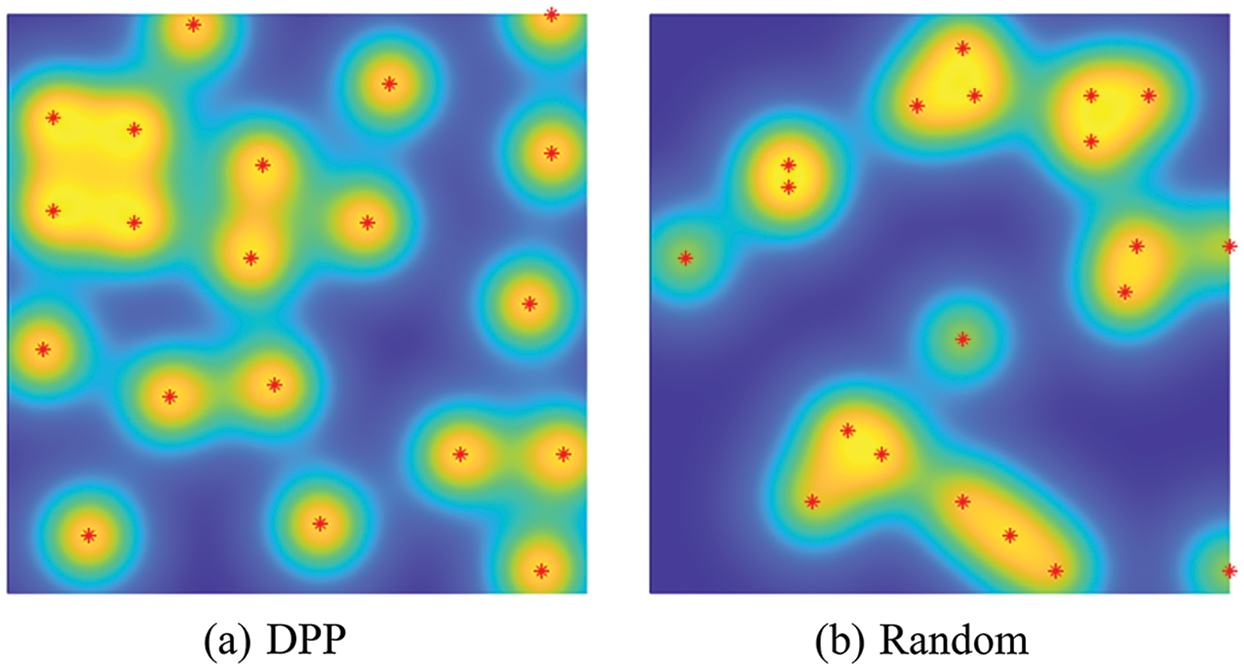
Figure 7: A set of points in the plane drawn from a DPP (a), and the same number of points sampled randomly (b)
Referring to the simplified spacecraft model proposed by Teng et al. [35], we improve the model to study the diverse SELOD problem. One of the spacecraft’s bearing plates is selected, and pieces of equipment to be laid out are placed on this plate. In order for the computational convenience and without losing the generality of the research, we design the spacecraft structure as a columnar shape with a trapezoidal bottom. The equipment is designed as cylindric or cuboid geometry, as shown in Fig. 8. What we are particularly concerned with is the arrangement of equipment on the two-dimensional surface of the bearing plate. For further study, our target is to improve the spacecraft’s physical performance. The moment of inertia is one of the important physical parameters for spacecraft attitude dynamics. As for spacecraft with a smaller moment of inertia, spacecraft attitude control is also easier to implement, and the energy consumption of the spacecraft in orbit is lower. As a result, here we choose the minimum moment of inertia as the objective function for the next optimization.
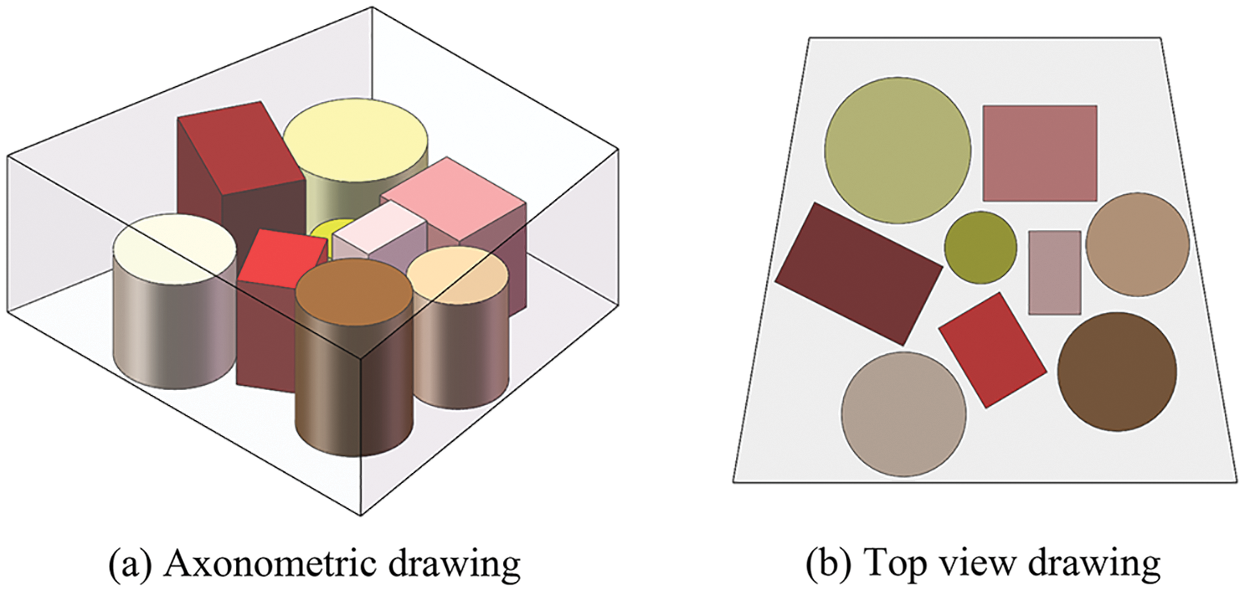
Figure 8: Layout of spacecraft equipment cabin
The entire optimization process of the diverse SELOD problem considering the minimum moment of inertia is shown in Fig. 9.
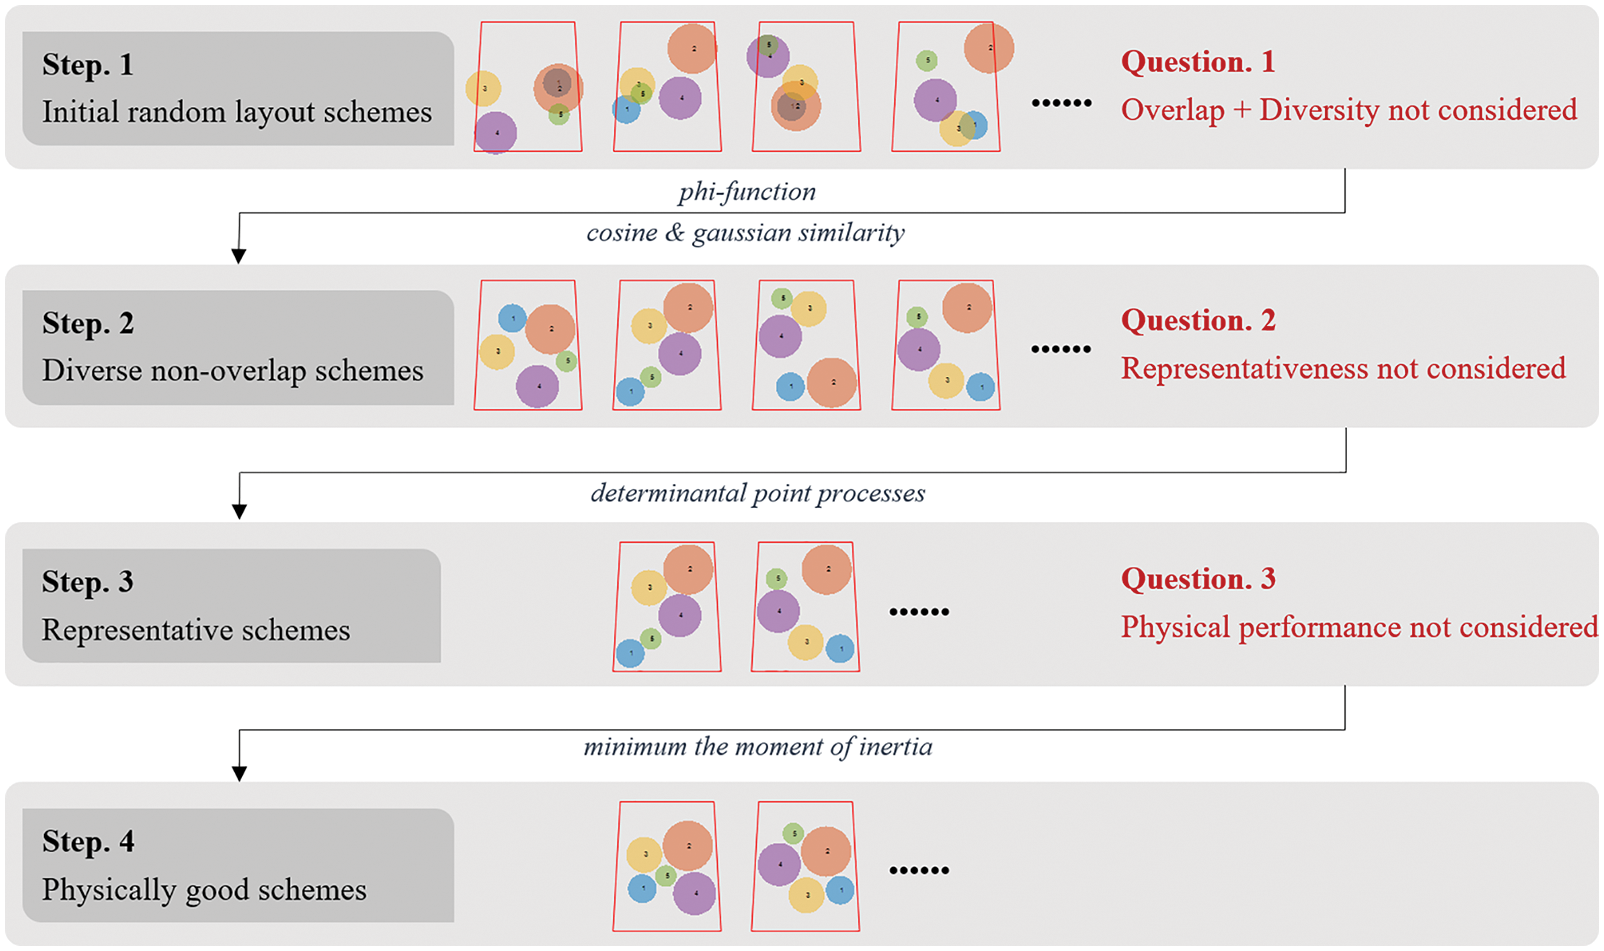
Figure 9: The entire optimization process of the diverse SELOD problem
In the SELOD problem, the three-dimensional layout problem can be simplified to a two-dimensional layout problem since the centre of mass in the height direction is easy to obtain and remains unchanged during the optimization process. In the coordinate system with the geometric centre of the spacecraft system as the origin, the position of each piece of equipment is represented by a set of coordinates
where the value range of
As to the diverse SELOD problem, M layout schemes are selected to optimize the similarity between them in each optimization, and the design variables are written as
For layout problems, the first thing to consider is that there should not be any overlap between the equipment and between equipment and boundaries. Overlap is invalid in spacecraft engineering design. Furthermore, it cannot be handled when further simulating the complex operating environment of spacecraft. The non-overlap constraint can be expressed as
where
In the engineering practice of spacecraft design, it is found that equipment may interact during operation, which may affect the working accuracy of the equipment. In consideration of the processing needs such as the installation of equipment and wiring inside the equipment cabin, a safety distance should be maintained when placing equipment. In addition, some cooperative equipment must be placed within a feasible distance. Once a threshold distance is exceeded, the spacecraft subsystem may not work normally. Therefore, this distance constraint is defined as the safety and feasibility constraint, which can be represented by the minimum distance constraint
or the maximum distance constraint
4.3 Formulation of Diverse SELOD Model
The diverse SELOD problem mainly considers a single objective function, that is, the similarity between layout schemes. Similarity targets can be described as
where
With the aforementioned decision variables and layout constraints, a more general SELOD model can be formulated as follows:
In this optimization problem, we note that the objective function is the maximum of the similarity between the schemes. However, the maximum function cannot be differentiated. In order to apply the gradient algorithm for optimization, we use KS function to approximate the maximum value of similarity according to the obtained similarity matrix, which is differentiable everywhere, that is
4.4 Formulation of SELOD Model Considering the Moment of Inertia
After obtaining several sets of the most diverse geometric non-overlap layout schemes, these schemes are used as the initial solutions of design variables to further optimize the physical performance of the spacecraft. In most spacecraft designs, it is expected to obtain as small as possible the overall moment of inertia of the system to ensure that the spacecraft can operate safely and stably in orbit with small energy consumption. The mathematical model is described as follows:
where
5.1 Case 1: A SELOD Problem with 5 Cylinders
A simple layout problem is presented to test the validity of the proposed optimization method for the diverse SELOD problem. The trapezoid on the bottom of the spacecraft equipment cabin in this example is an isosceles trapezoid with an upper bottom of 260 mm, a lower bottom of 300 mm and a height of 360 mm. The height of the equipment cabin is 120 mm. The three-axis moment of inertia of the equipment cabin around its geometric centre is
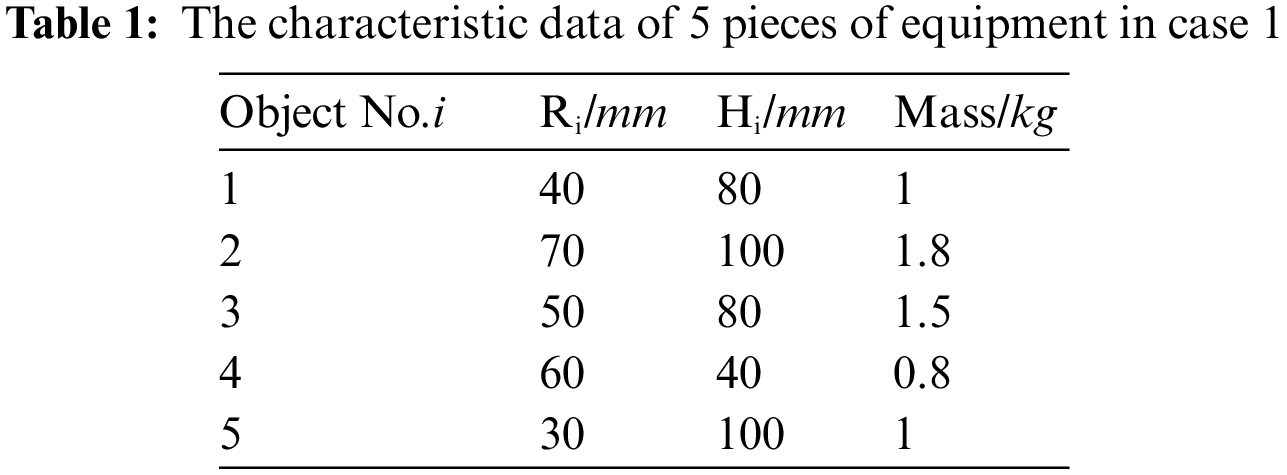
The equipment cabin contains five pieces of cylindrical equipment, and their geometric dimensions and mass information are shown in Table 1, where Ri means the radius of the base of the No.i cylinder and Hi means the height. In order to improve the calculation efficiency and avoid the accidental impact caused by one-time optimization, the number of layout schemes in each optimization is set as ten. Through performing multiple optimization operations, groups of layout schemes with diversity are generated. The design variable can be set as
The results of the optimization schemes considering the diversity among schemes as the objective function and the optimization schemes without considering the diversity objective are compared. As shown in Figs. 10a and 10c, when the diversity target is not considered, the randomly generated initial layout schemes can only be optimized to obtain the schemes that meet the geometric non-overlap, and the corresponding similarity distribution is also random. As shown in Figs. 10b and 10d, after adding the diversity target of cosine similarity or gaussian similarity, it is obvious that the similarity between the optimized layout schemes is greatly reduced. This proves that the feasibility of introducing diversity factors into the optimization process is in line with expectations.
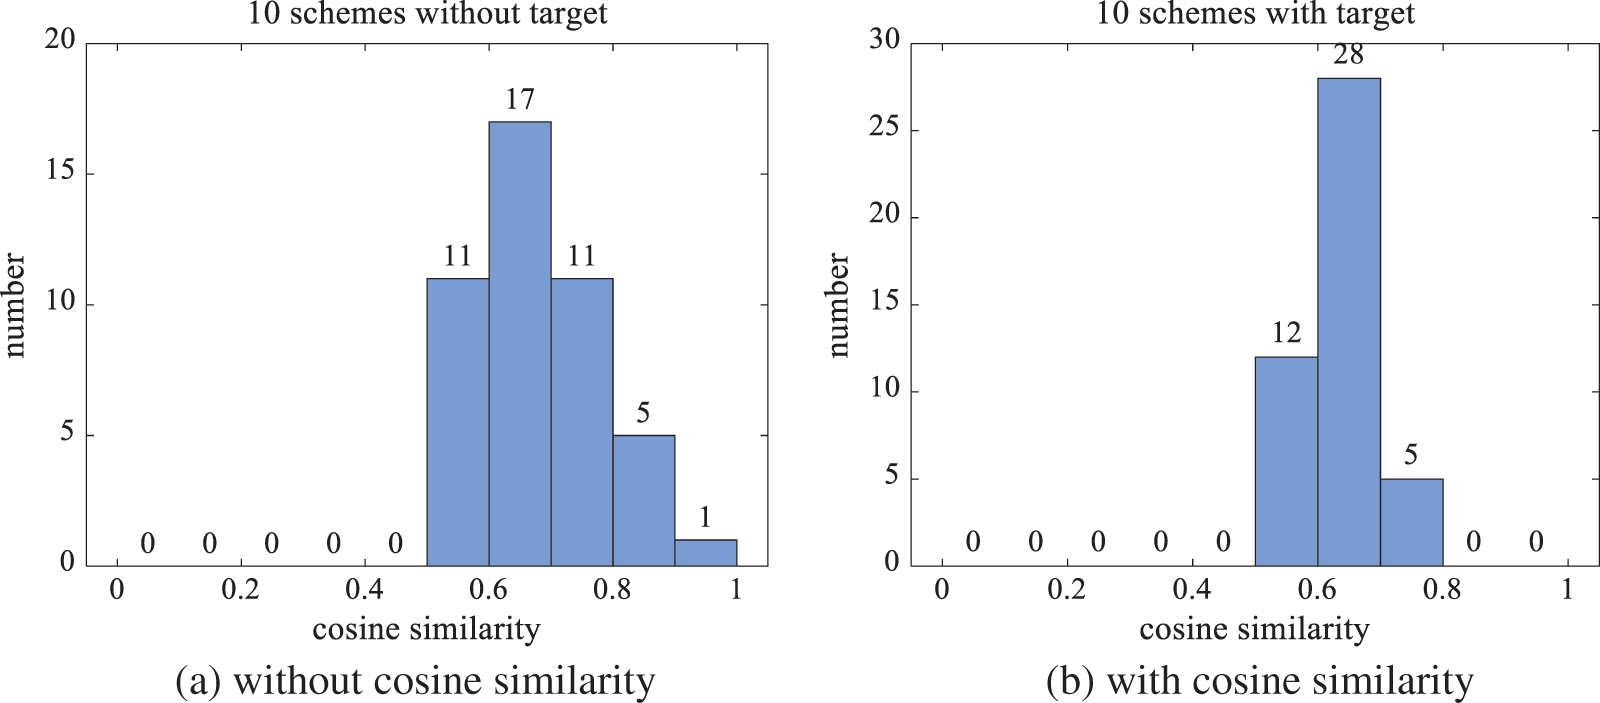
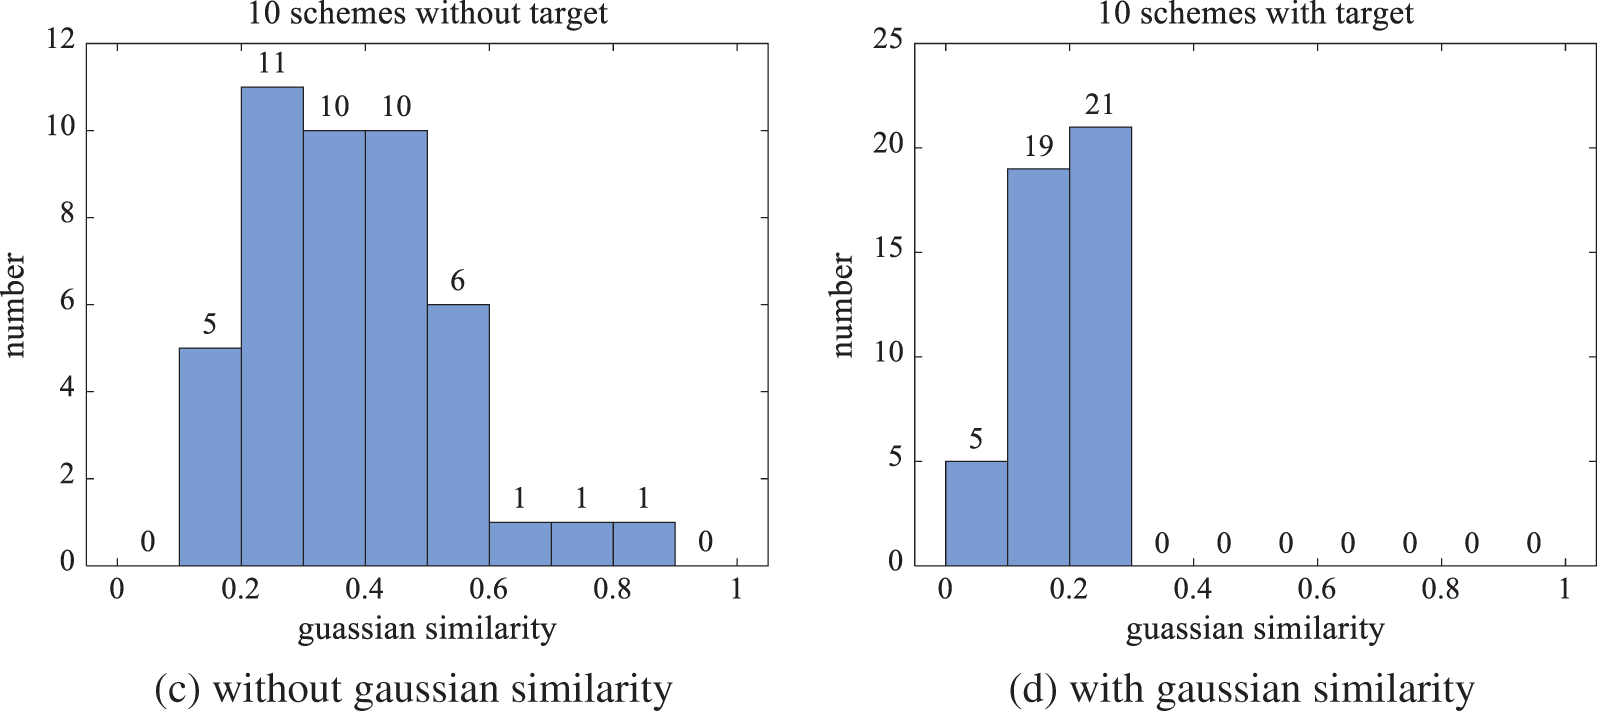
Figure 10: The similarity distribution of layout schemes
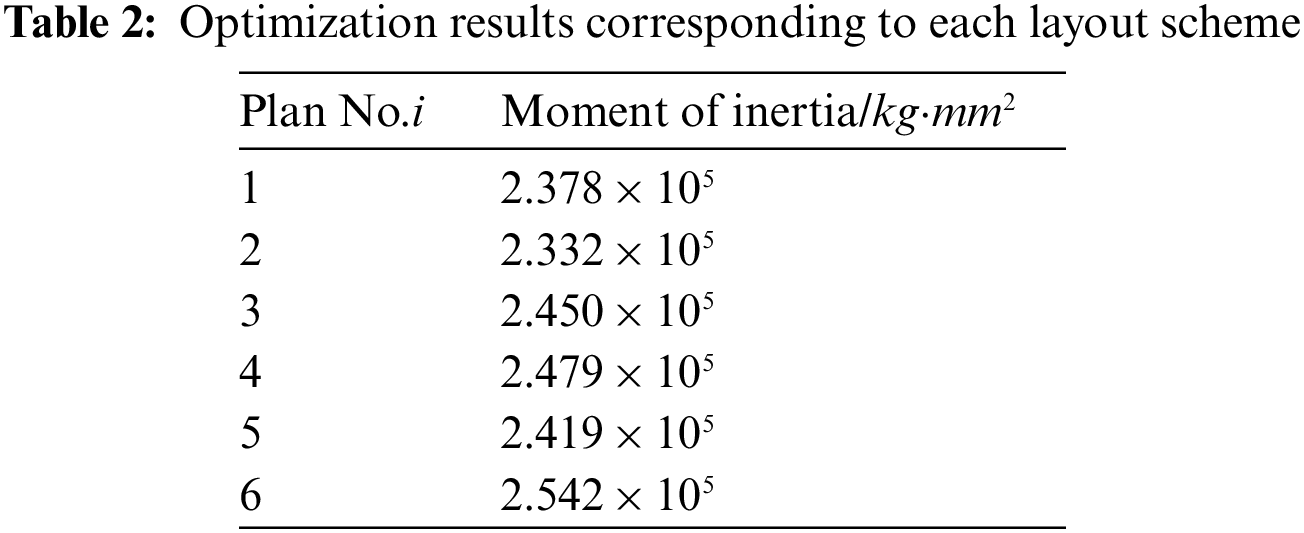
After several optimization iterations, groups of diverse non-overlap layout schemes can be obtained. Then, DPPs are used to select more representative schemes from the obtained schemes as the initial solutions for the optimization of physical field performance in the next step. Six schemes obtained by the DPPs sampling method from the layout schemes according to the modified cosine similarity minimum are shown in Fig. 11. By observing the most diverse layout schemes, it is clear that they have different distribution characteristics, including the absolute positions of equipment and the relative positions between equipment. And Fig. 12 shows the optimized corresponding layout schemes which take the moment of inertia of the spacecraft system as the optimization target. Obviously, compared with the schemes before, all the equipment converges towards the center of mass in optimized schemes. The results of the moment of inertia corresponding to each layout scheme are shown in Table 2, where the difference between the maximum moment of inertia and the minimum is 8.3%.
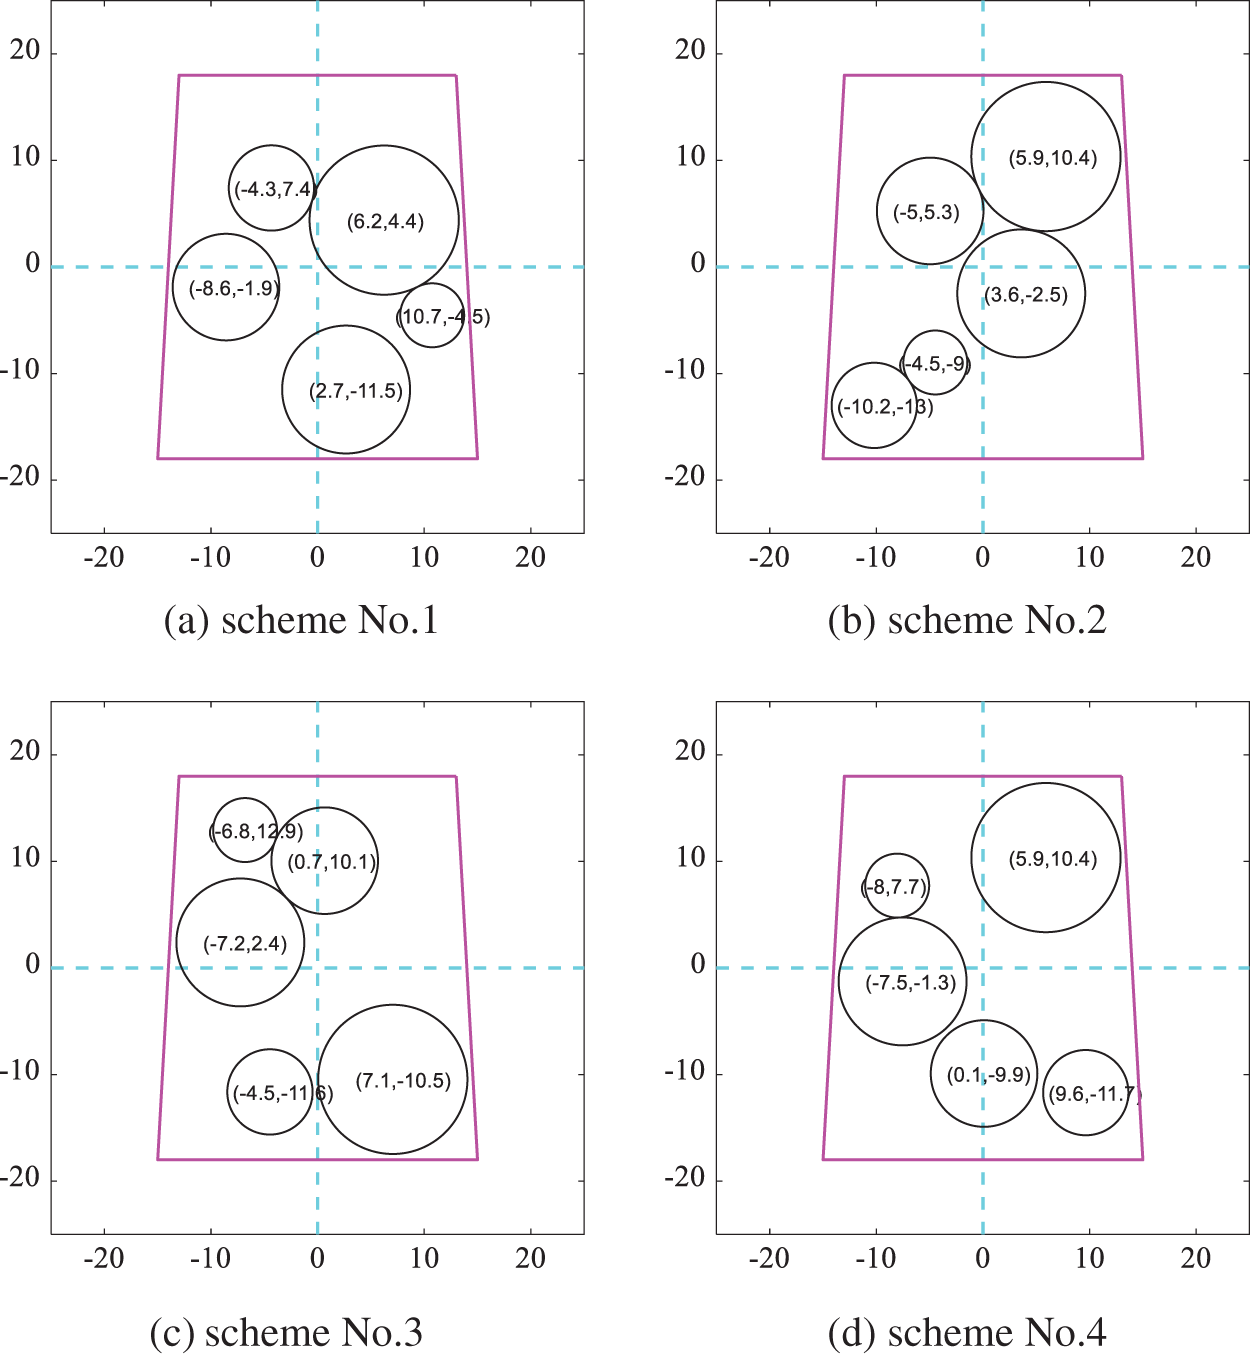
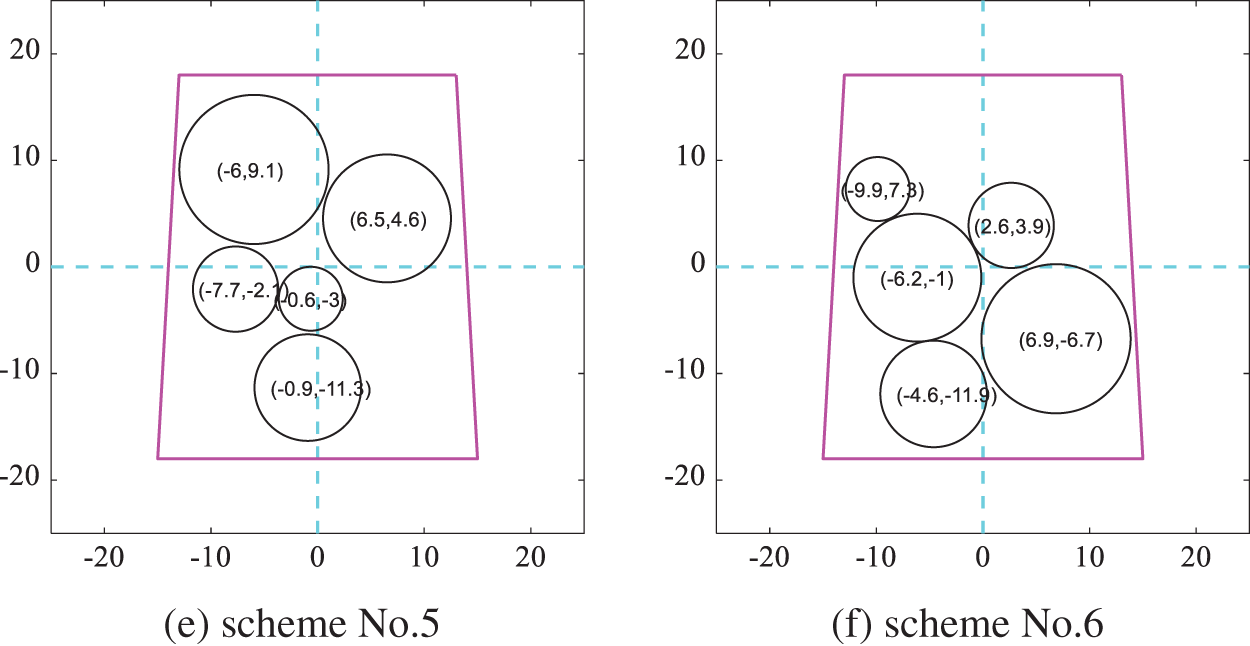
Figure 11: Layout schemes obtained by DPPs according to the modified cosine similarity
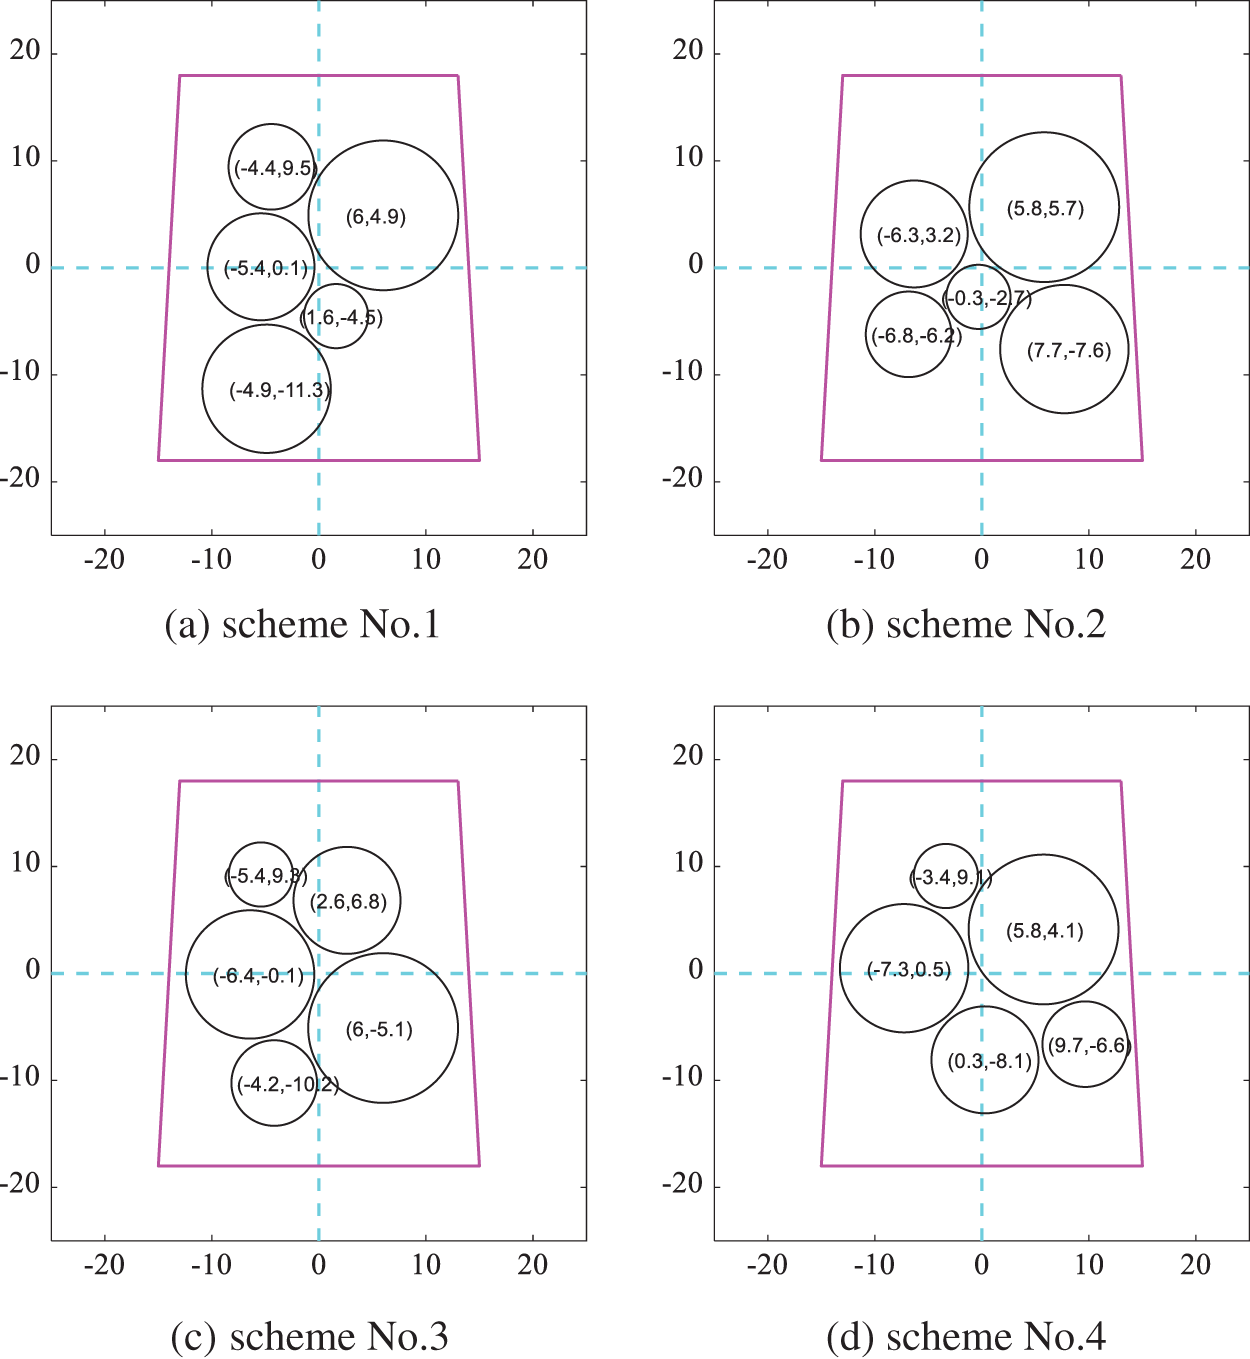
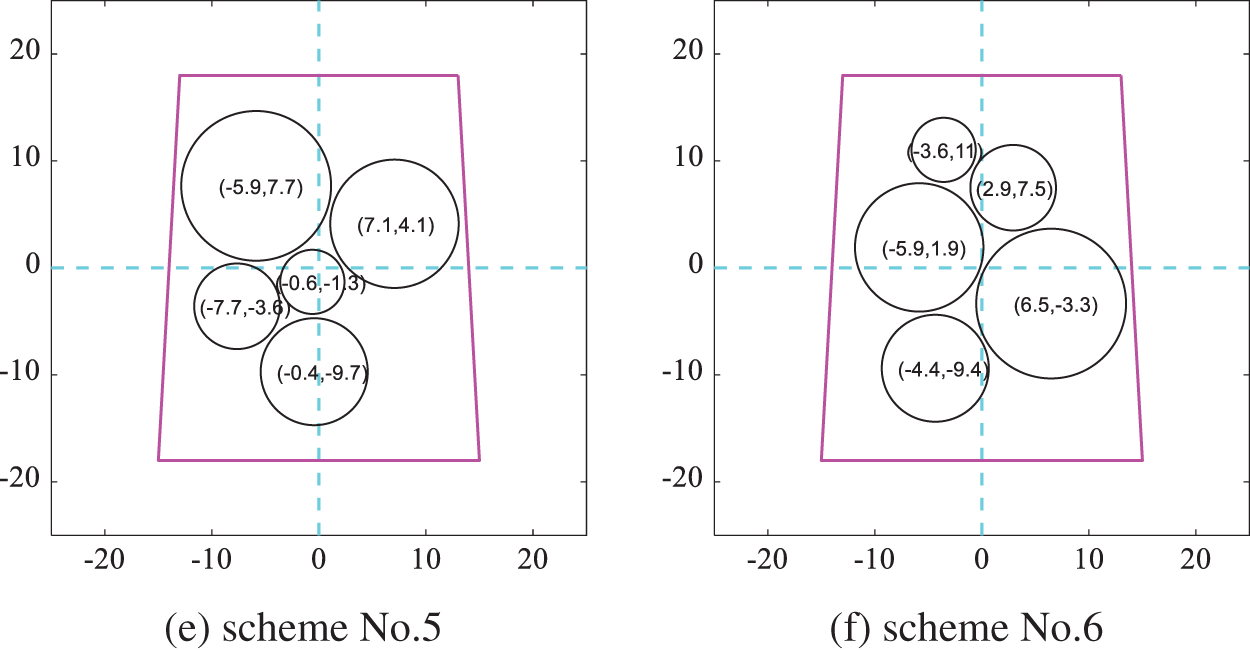
Figure 12: Layout schemes obtained by optimizing the moment of inertia according to the modified cosine similarity
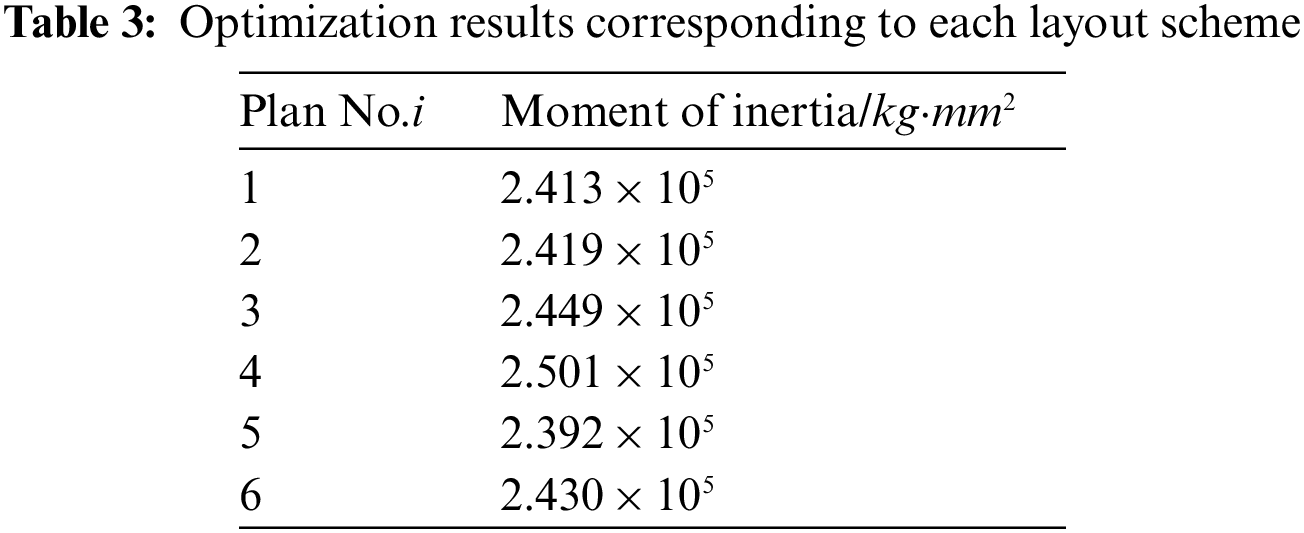
Among the layout schemes obtained according to the gaussian kernel function similarity minimum, six schemes obtained by DPPs are shown in Fig. 13 where they are diverse intuitively by comparing the coordinates of equipment. And Fig. 14 shows the corresponding layout scheme after optimizing the moment of inertia in which equipment become more compact. The results of the moment of inertia corresponding to each layout scheme are shown in Table 3. The difference between the maximum moment of inertia and the minimum is 4.4%. The results show that the method proposed for the diverse SELOD problem can produce multi-group solutions with great target quality for designers to choose from.
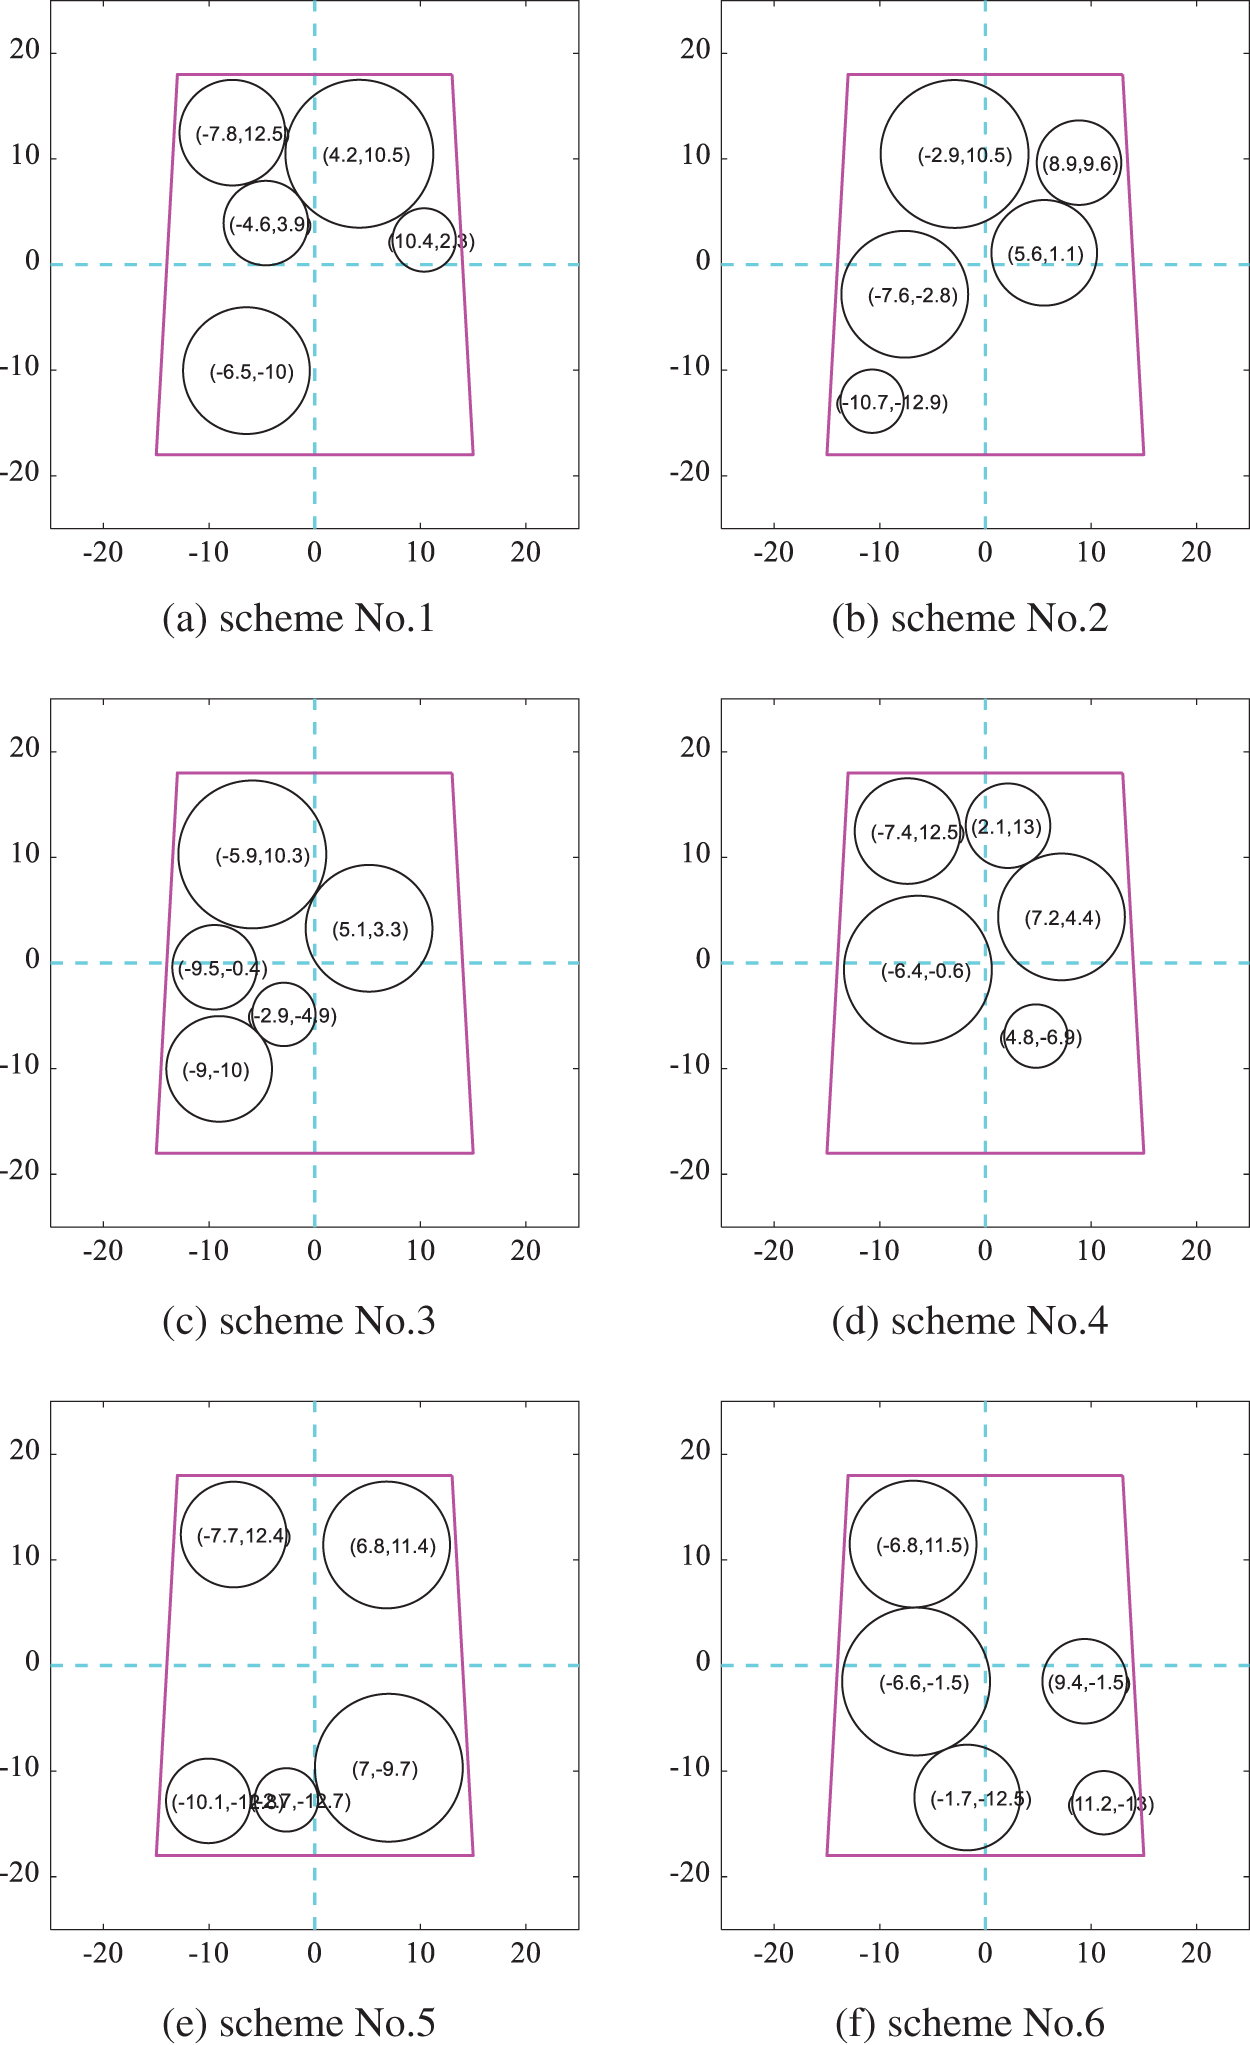
Figure 13: Layout schemes obtained by DPPs according to the gaussian kernel function similarity
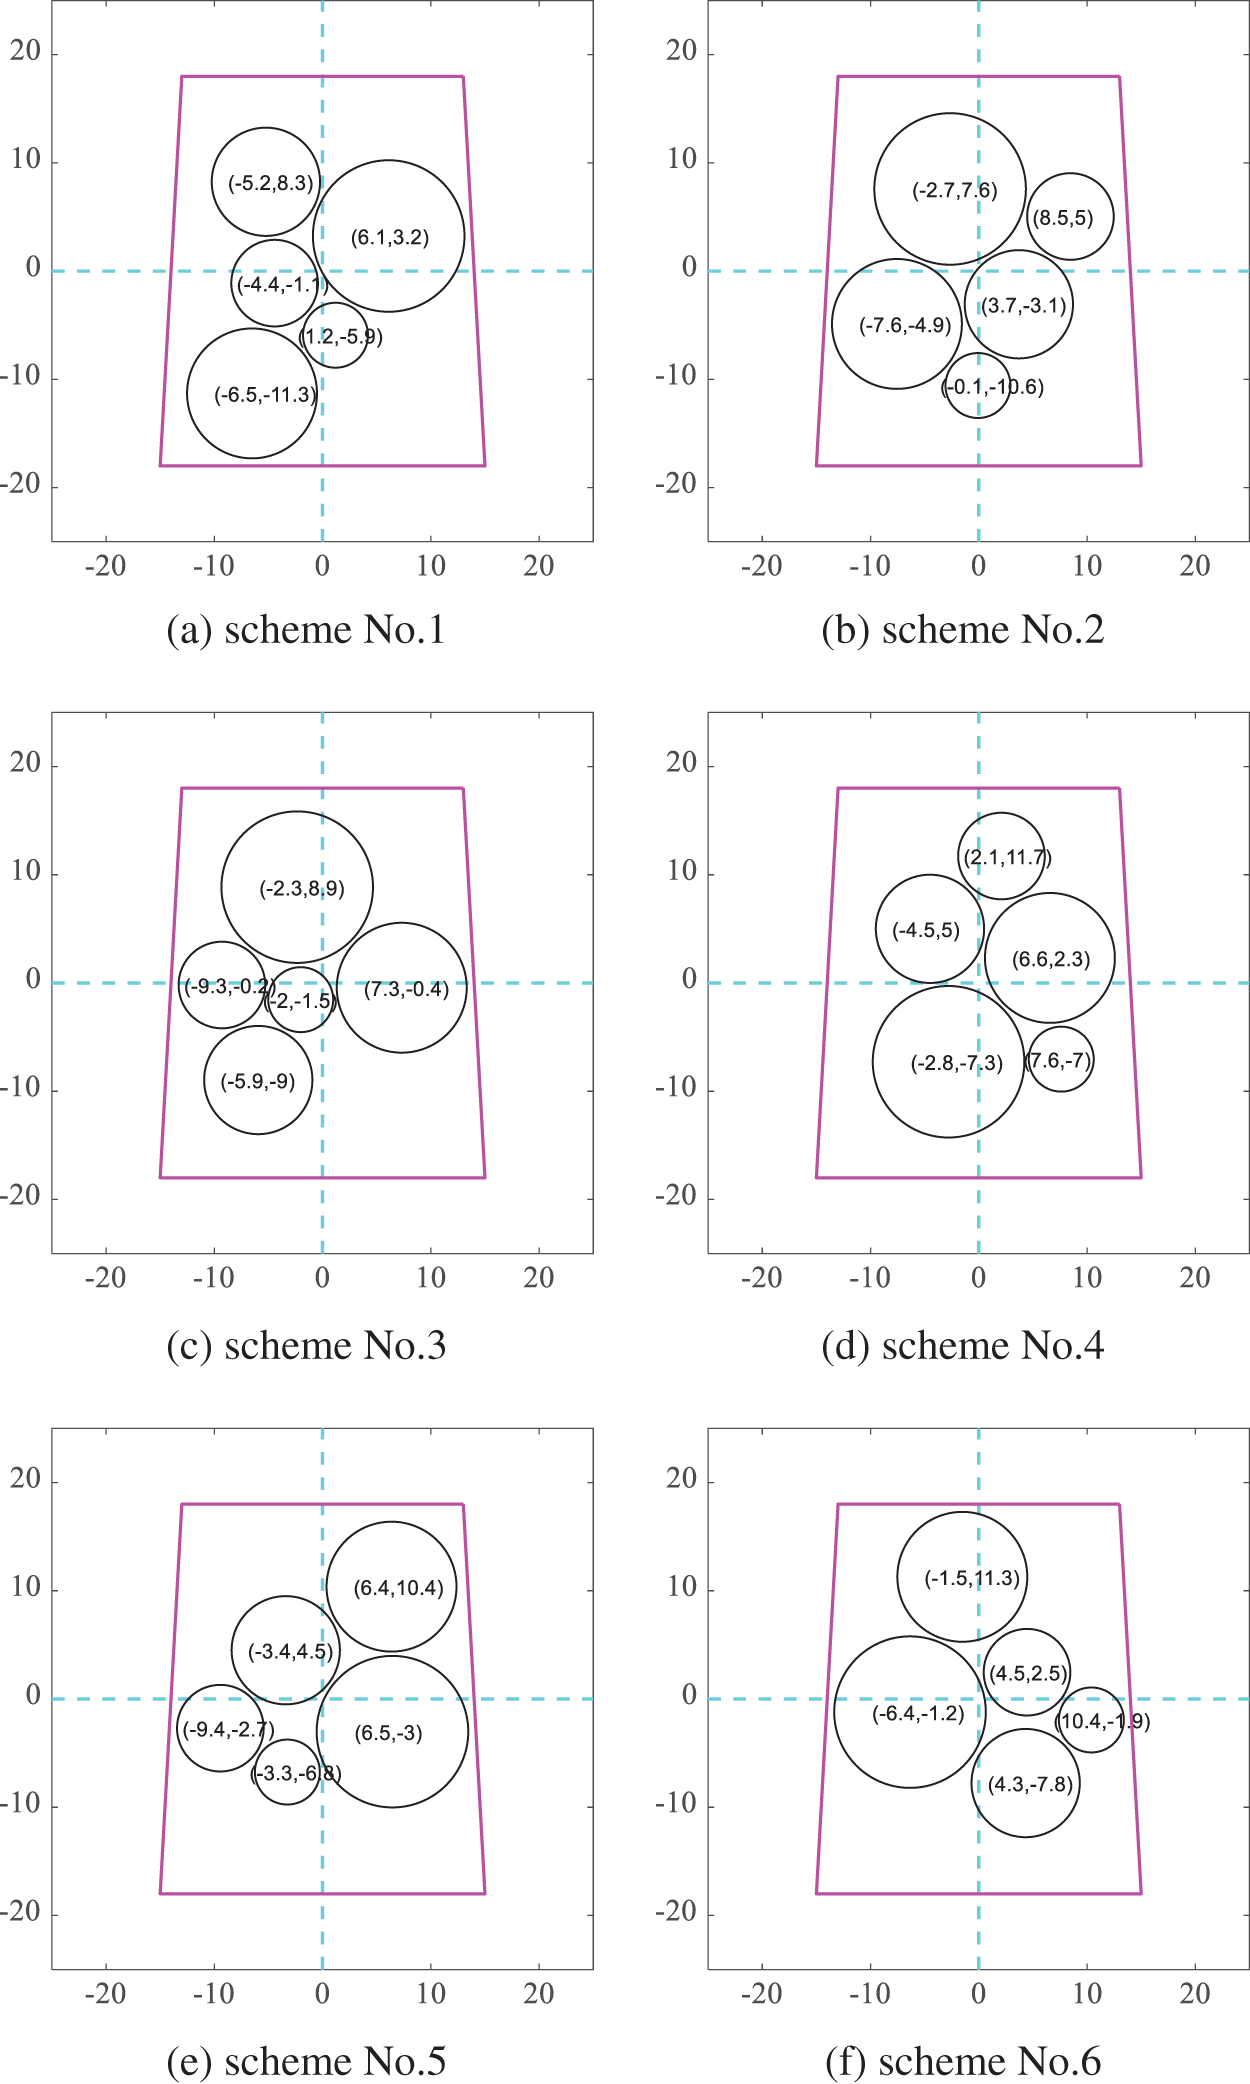
Figure 14: Layout schemes obtained by optimizing the moment of inertia according to the gaussian kernel function similarity
5.2 Case 2: A SELOD Problem with 4 Cuboids and 6 Cylinders
A general layout problem is presented to test the universality of the proposed optimization method for the diverse SELOD problem. The trapezoid on the bottom of the spacecraft equipment cabin in this example is an isosceles trapezoid with an upper bottom of 460 mm, a lower bottom of 500 mm and a height of 560 mm. The height of the equipment cabin is 120 mm. The three-axis moment of inertia of the equipment cabin around its geometric center is
The equipment cabin contains four pieces of cuboid equipment and six pieces of cylindrical equipment, and their geometric dimensions and mass information are shown in Table 4. Ai and Bi mean the length and width of the No.i cuboid, respectively and Ri means the radius of the base of the No.i cylinder. Hi means the height of the No.i cuboid or cylinder. It is noted that the first four are cuboids.
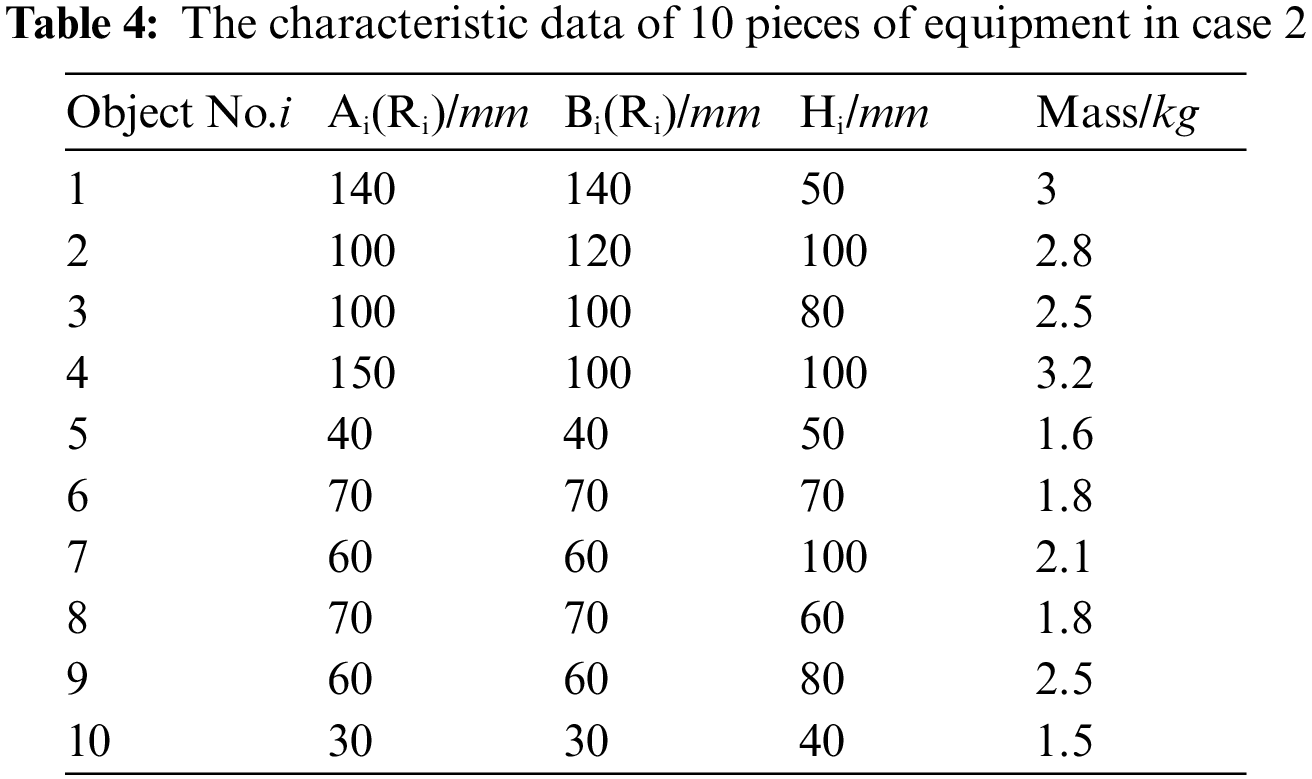
To verify the efficiency, this design case will be resolved under two different conditions, respectively. One assumption condition, denoted by Scenario A, is that all equipment can be placed at a free angle and the other, denoted by Scenario B, is that the cuboid equipment can only be placed orthogonally. In addition, the minimum distance constraint here is set as 1.2 mm between different equipment when optimizing the moment of inertia.
5.2.1 Scenario A: Free Rotation Condition
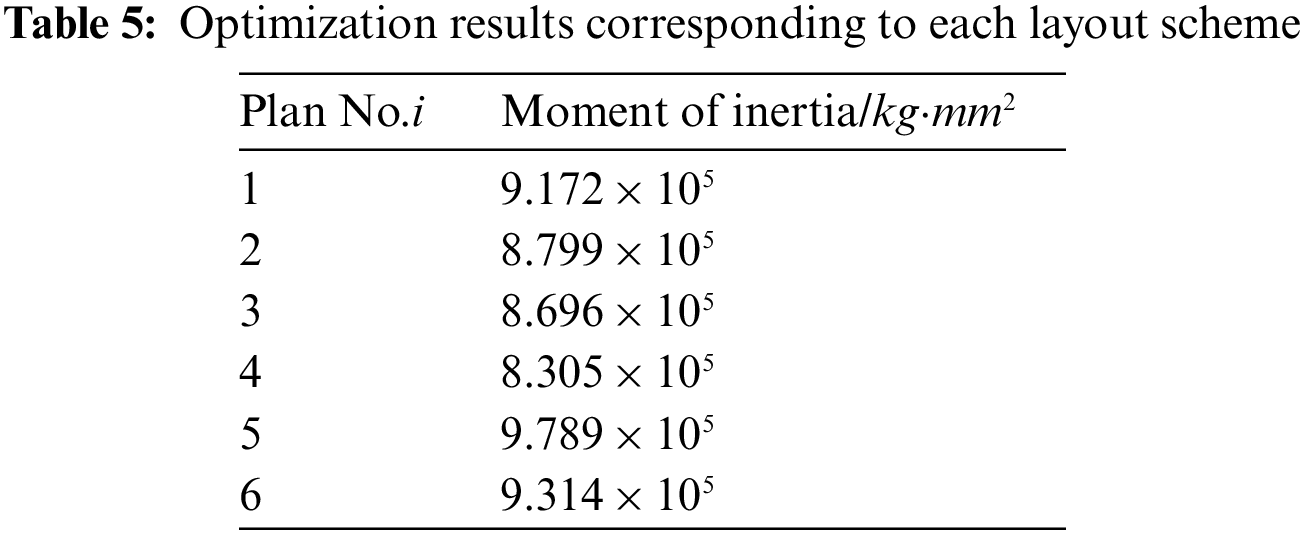
When all equipment can be placed arbitrarily, six schemes obtained by the DPPs sampling methods from the schemes according to the modified cosine similarity minimum are shown in Fig. 15. Nearly no equipment is located in the same place in different layout schemes. Moreover, Fig. 16 shows the optimized corresponding layout schemes which take the moment of inertia of the spacecraft system as the optimization target where equipment is clustered from all sides to the center. The results of the moment of inertia corresponding to each layout scheme are shown in Table 5. The difference between the maximum moment of inertia and the minimum is 15.1%.
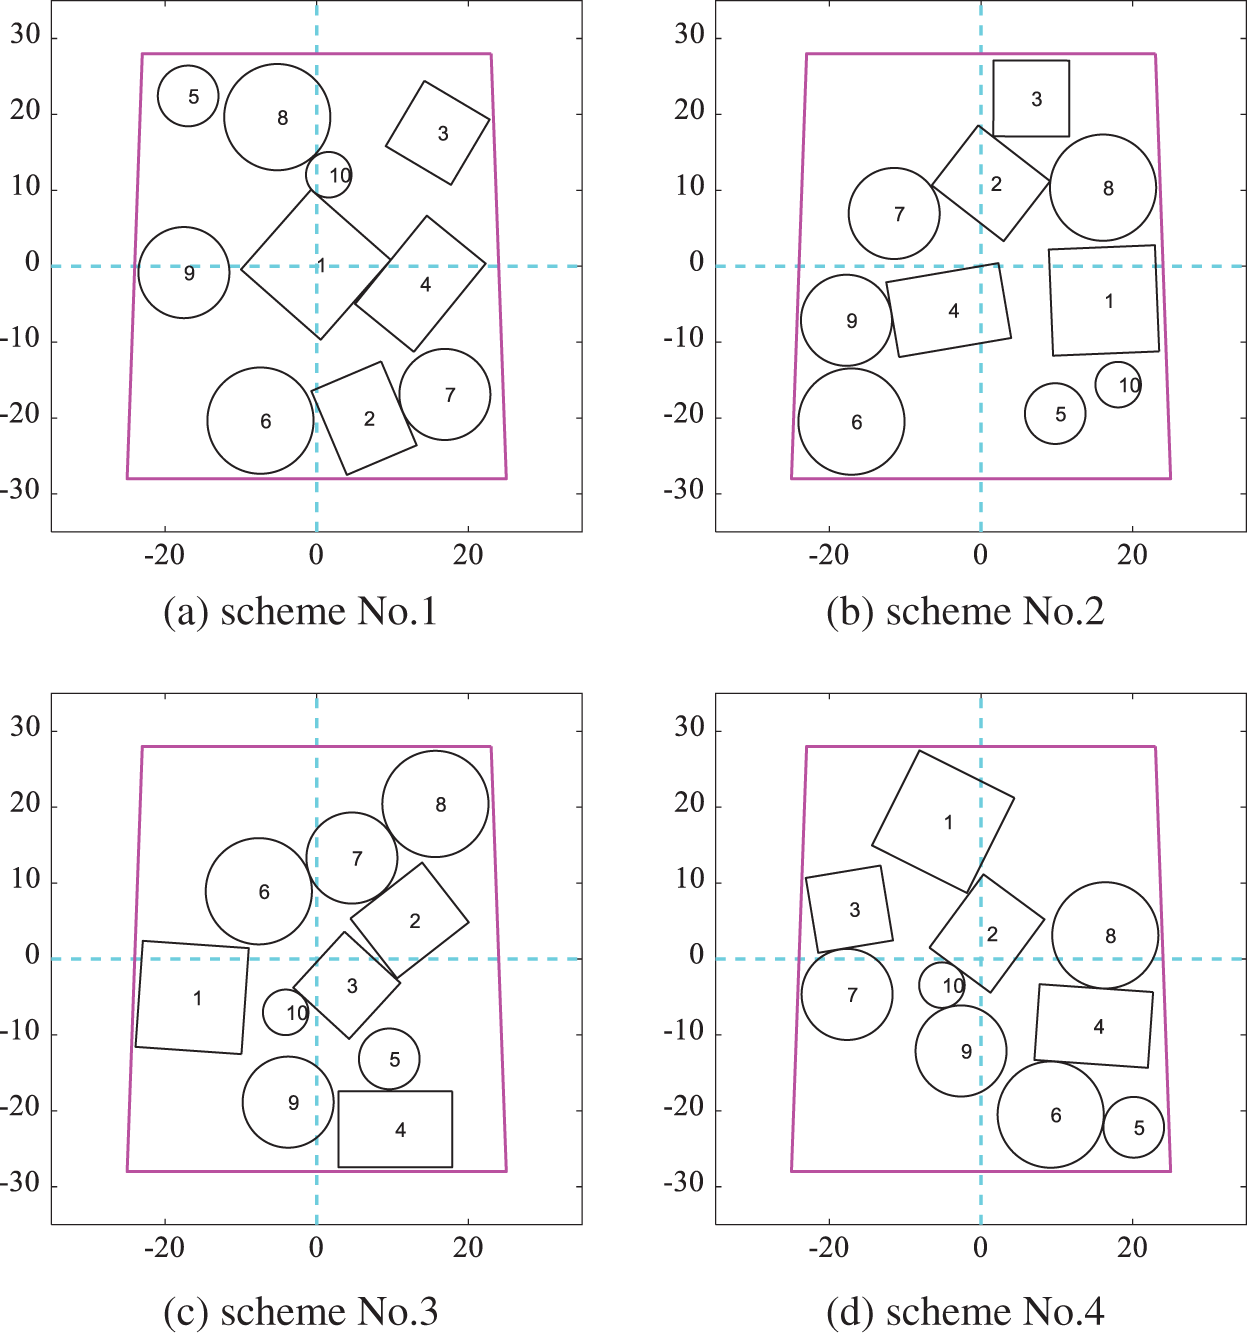
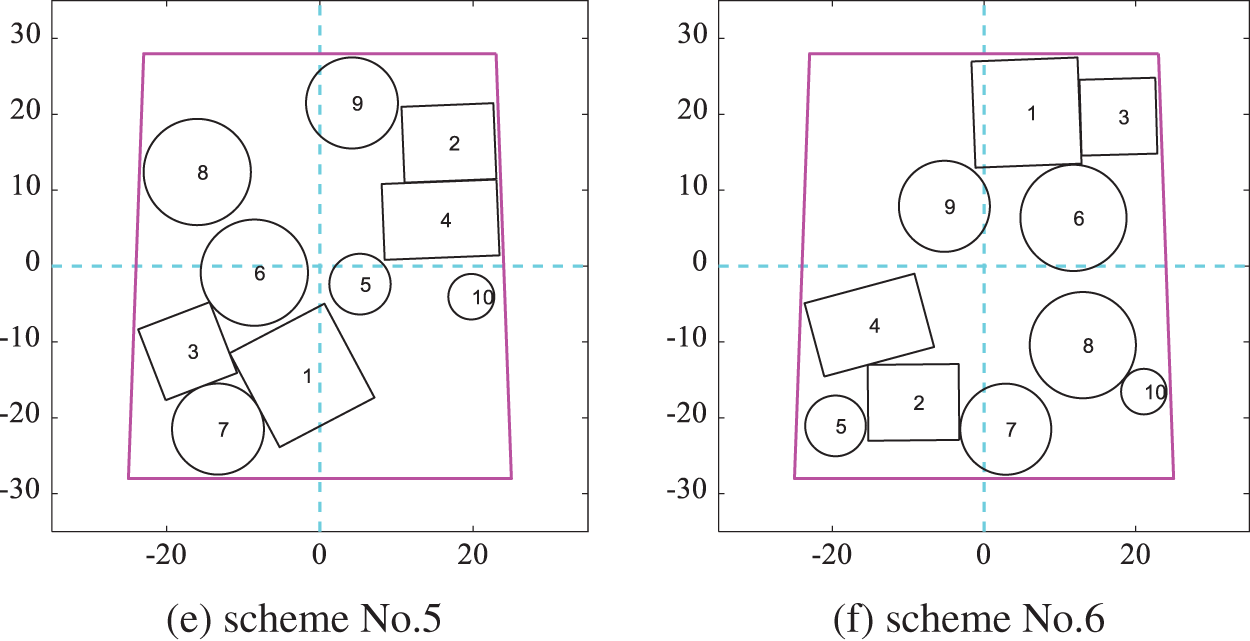
Figure 15: Layout schemes obtained by DPPs according to the modified cosine similarity in Scenario A
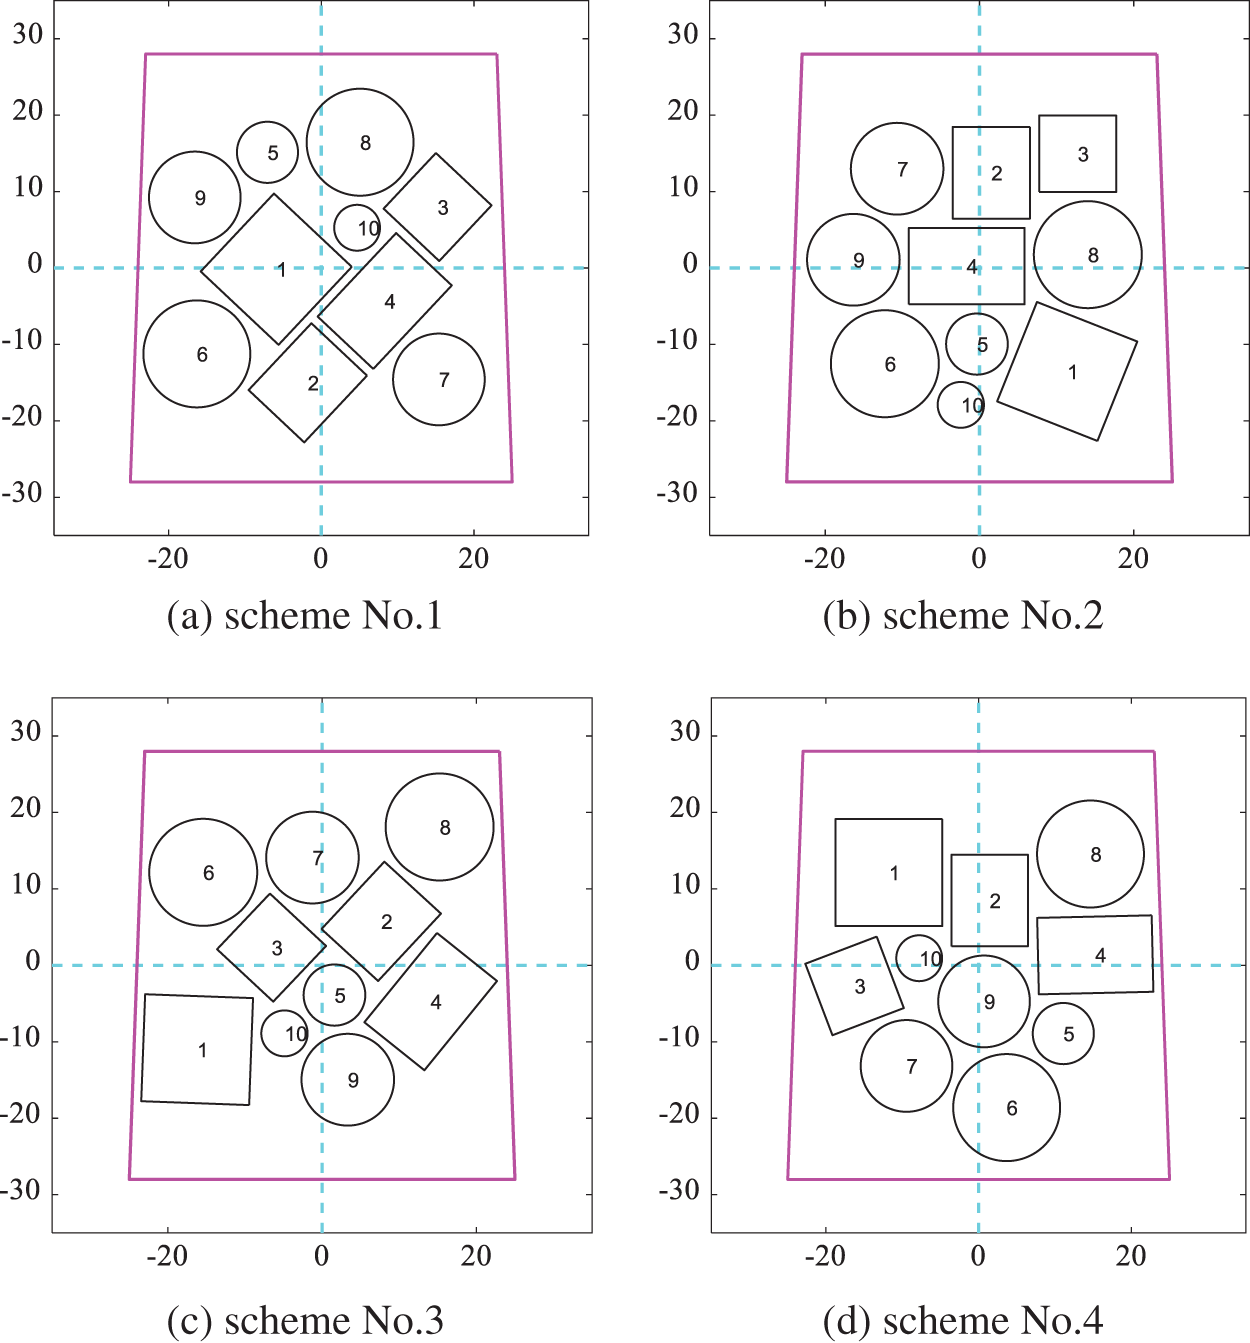
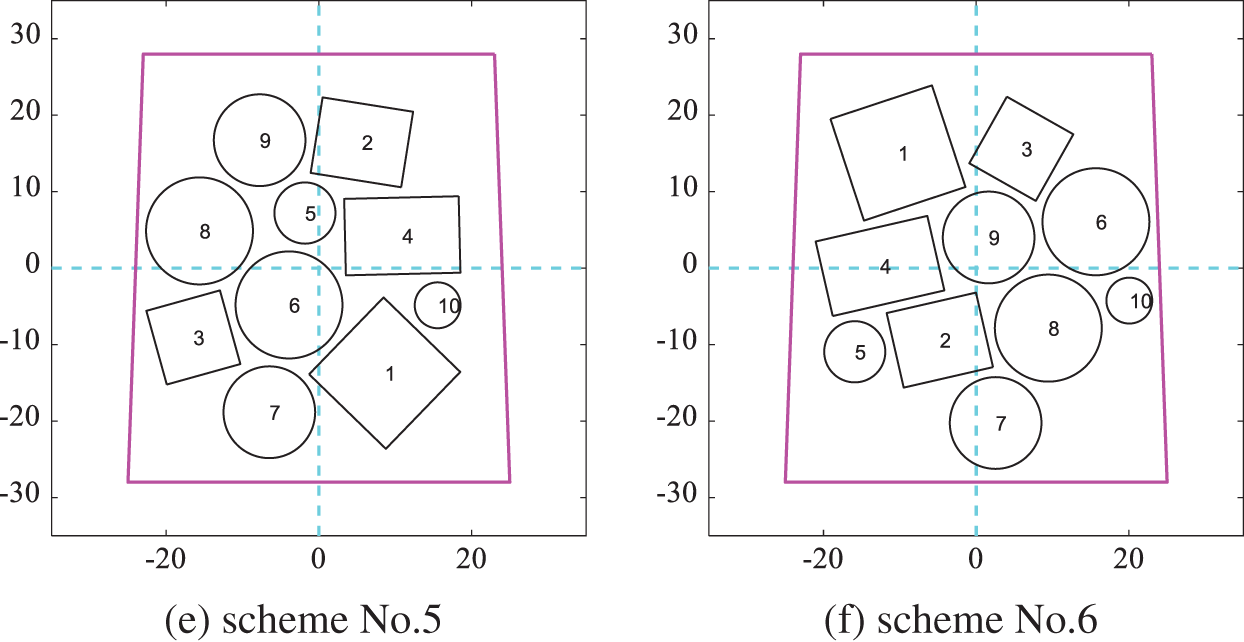
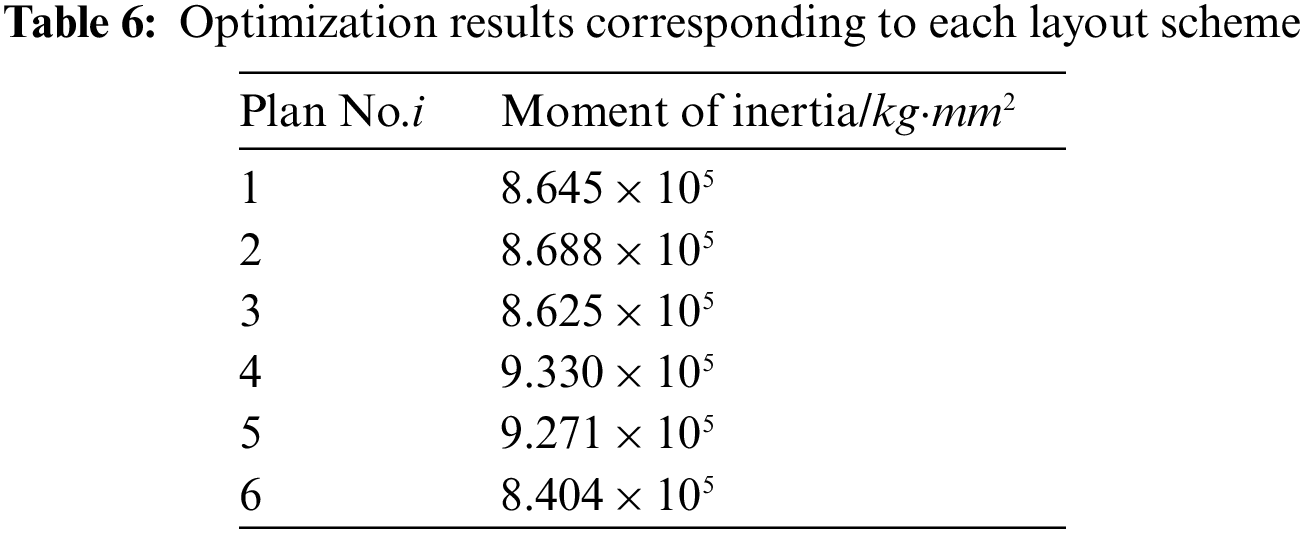
Figure 16: Layout schemes obtained by optimizing the moment of inertia according to the modified cosine similarity in Scenario A
Among the layout schemes obtained according to the gaussian kernel function similarity minimum, six schemes obtained by DPPs are shown in Fig. 17 which are the most diverse ones. Furthermore, Fig. 18 shows the corresponding layout scheme after optimizing the moment of inertia. Finally, the results of the moment of inertia corresponding to each layout scheme are shown in Table 6. The difference between the maximum moment of inertia and the minimum is 9.9%.
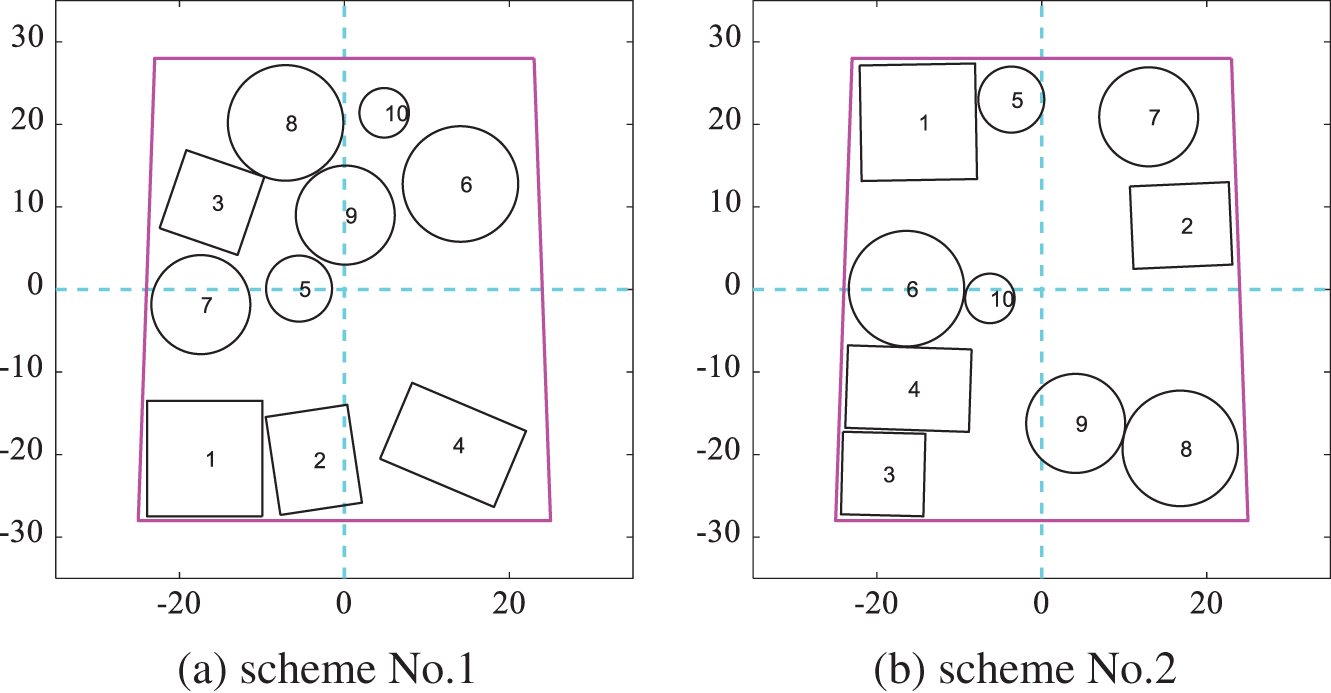
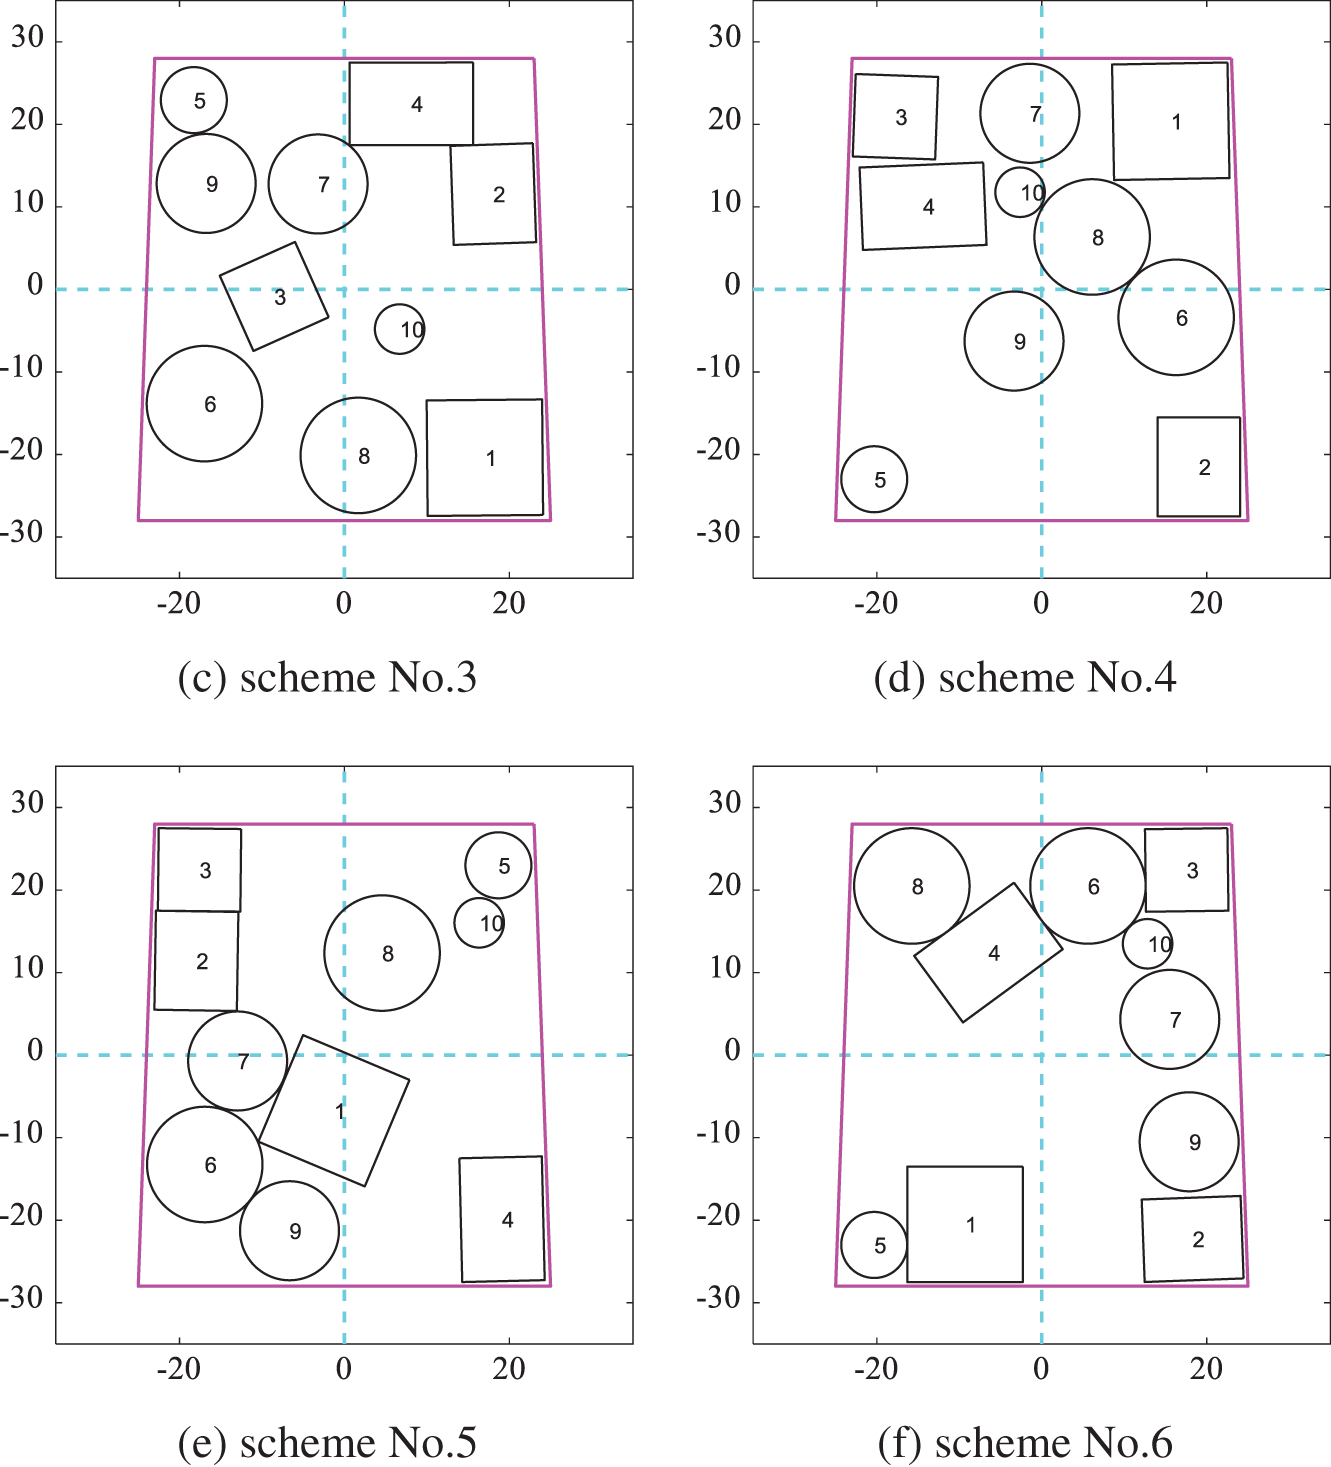
Figure 17: Layout schemes obtained by DPPs according to the gaussian kernel function similarity in Scenario A
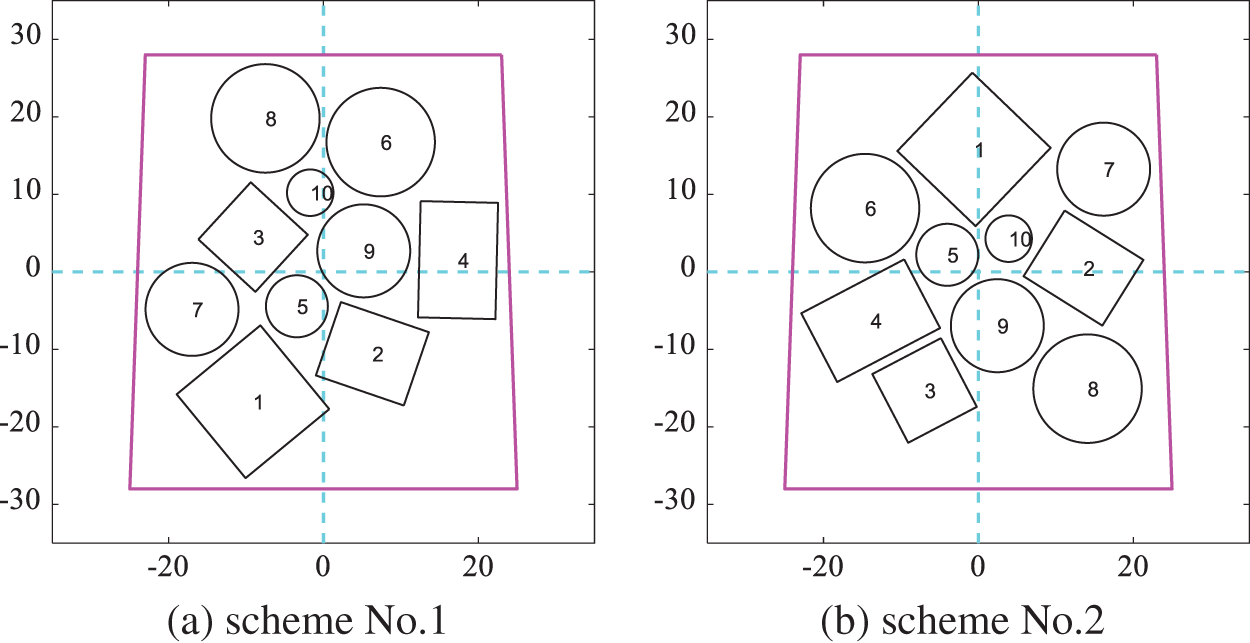
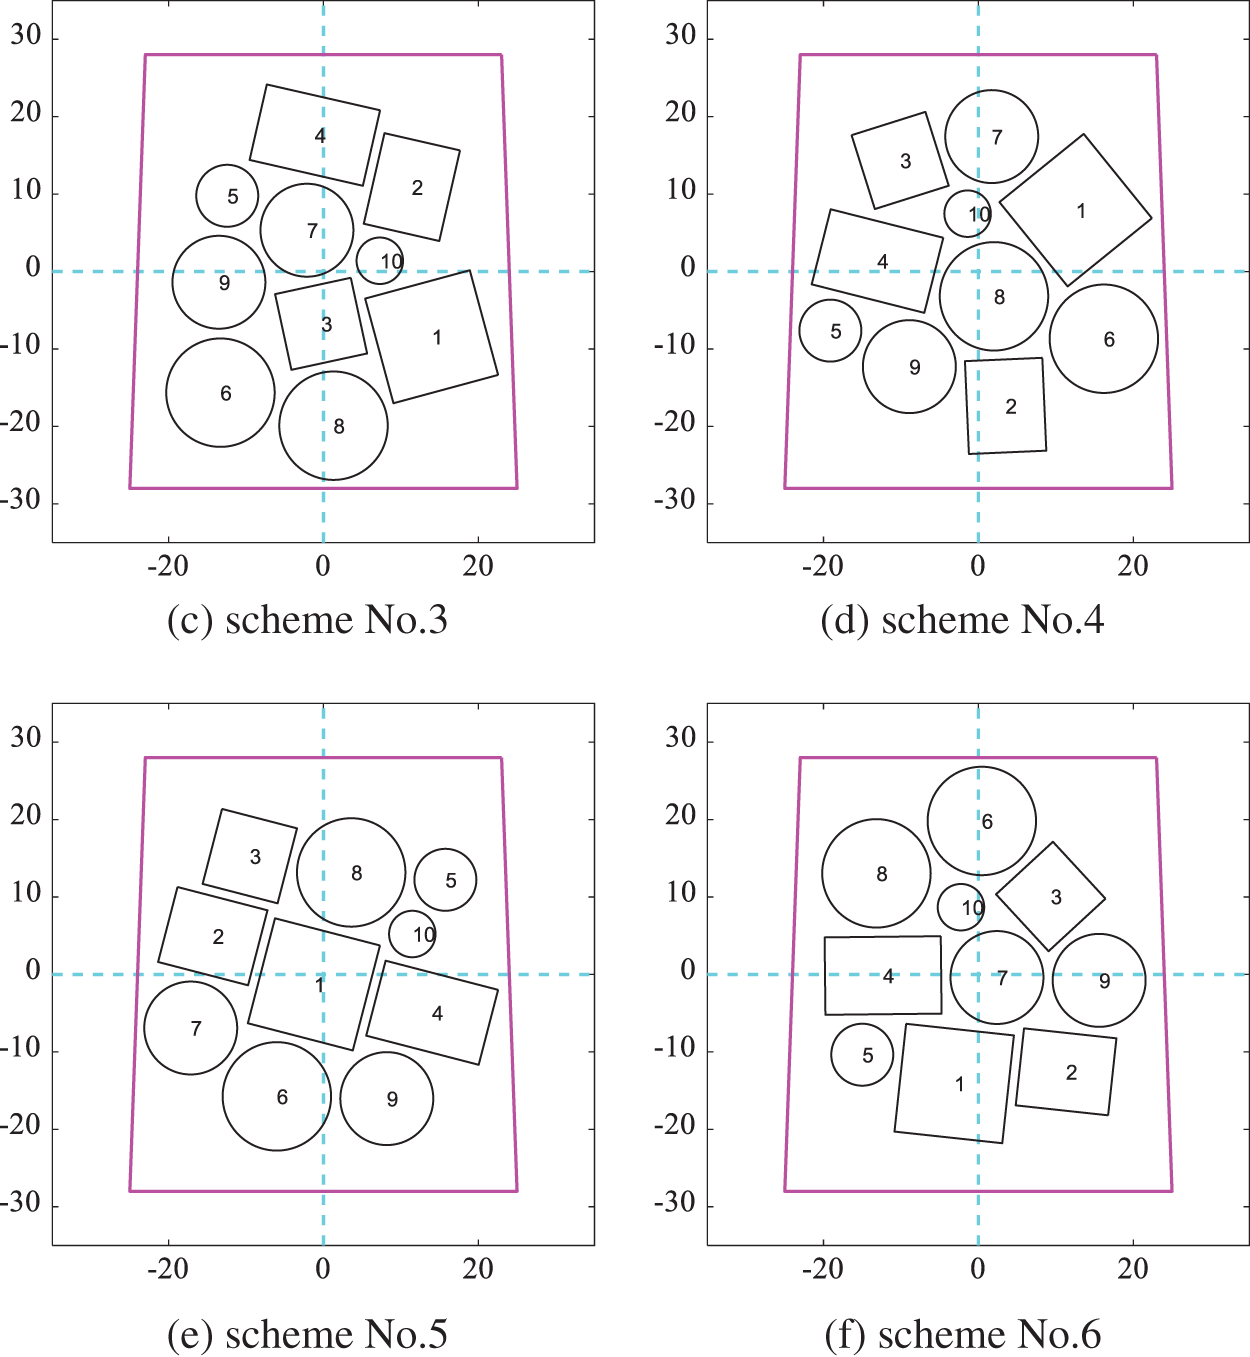
Figure 18: Layout schemes obtained by optimizing the moment of inertia according to the gaussian kernel function similarity in Scenario A
5.2.2 Scenario B: Fixed Rotation Condition
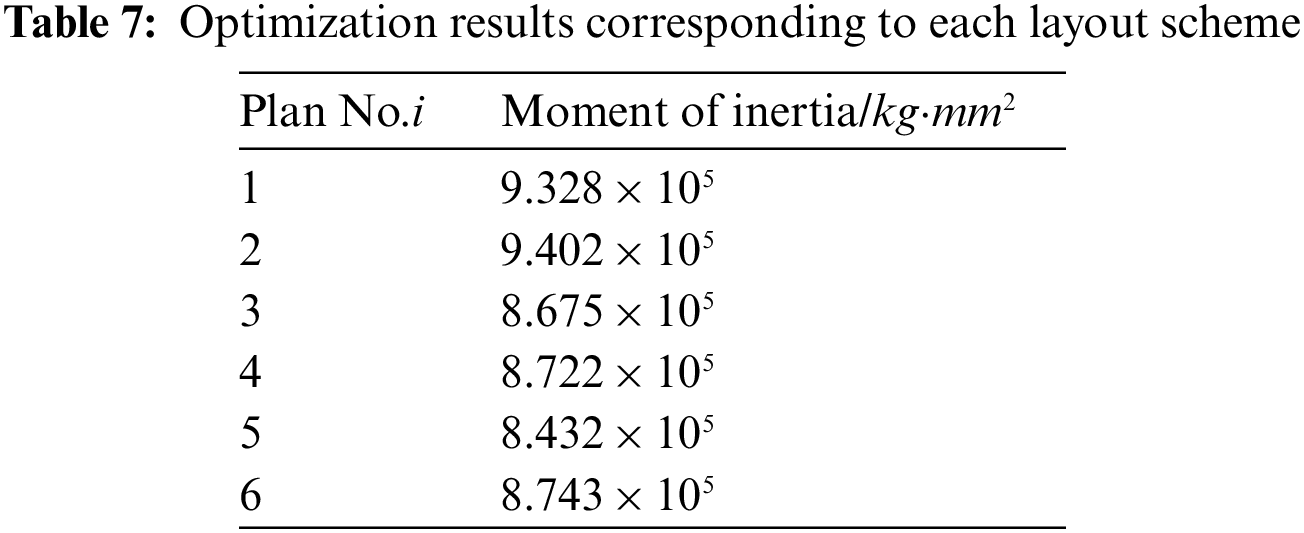
When the cuboid equipment can only be placed orthogonally, similarly, Fig. 19 shows six schemes obtained by the DPPs sampling method from the schemes according to the modified cosine similarity minimum. The optimized corresponding layout schemes which take the moment of inertia of the spacecraft system as the optimization target are shown in Fig. 20. The results of the moment of inertia corresponding to each layout scheme are shown in Table 7. The difference between the maximum moment of inertia and the minimum is 10.3%.
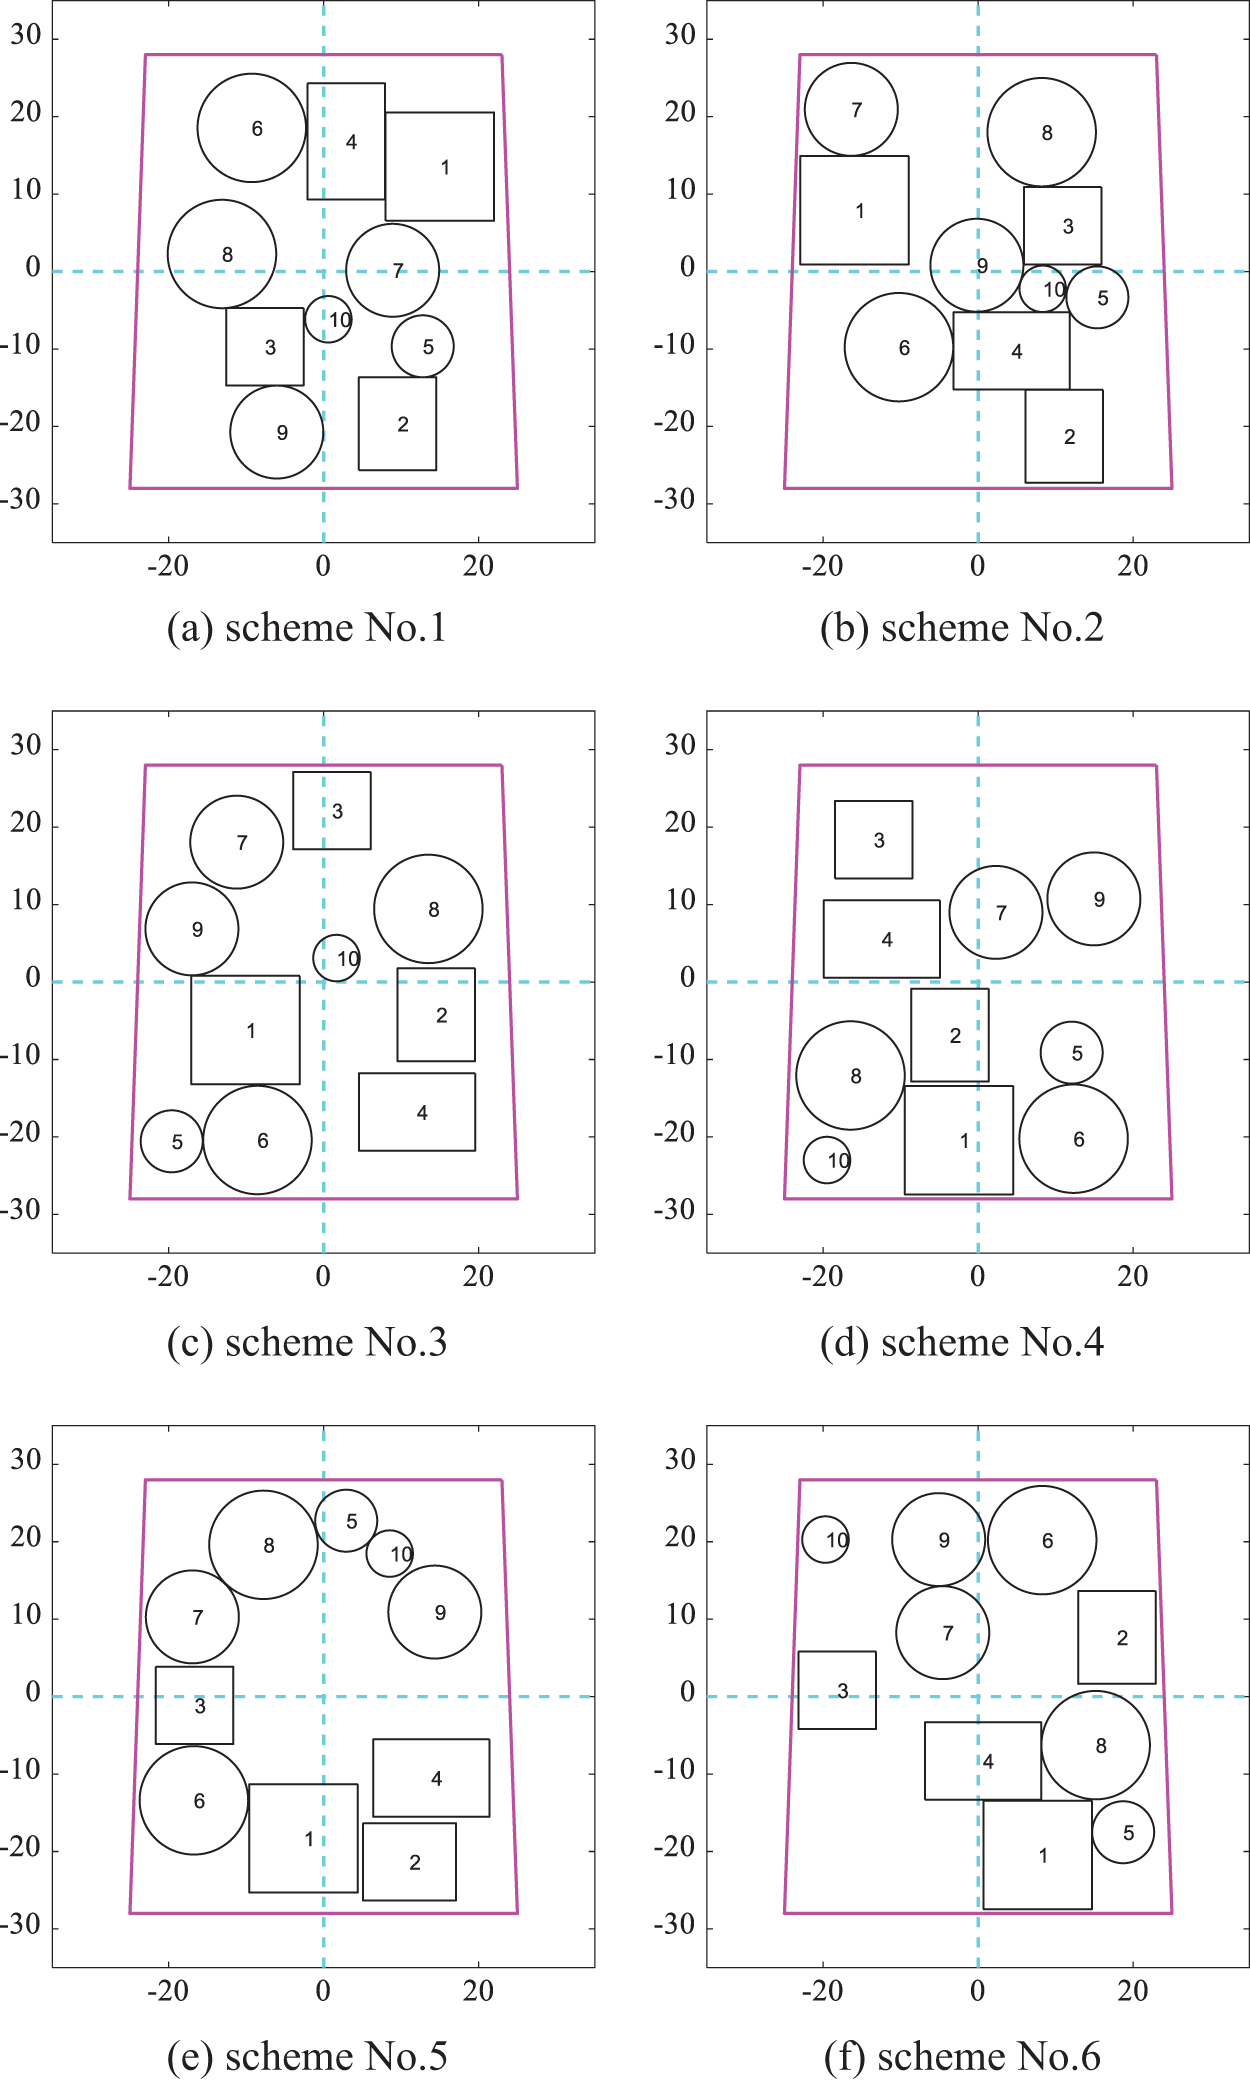
Figure 19: Layout schemes obtained by DPPs according to the modified cosine similarity in Scenario B
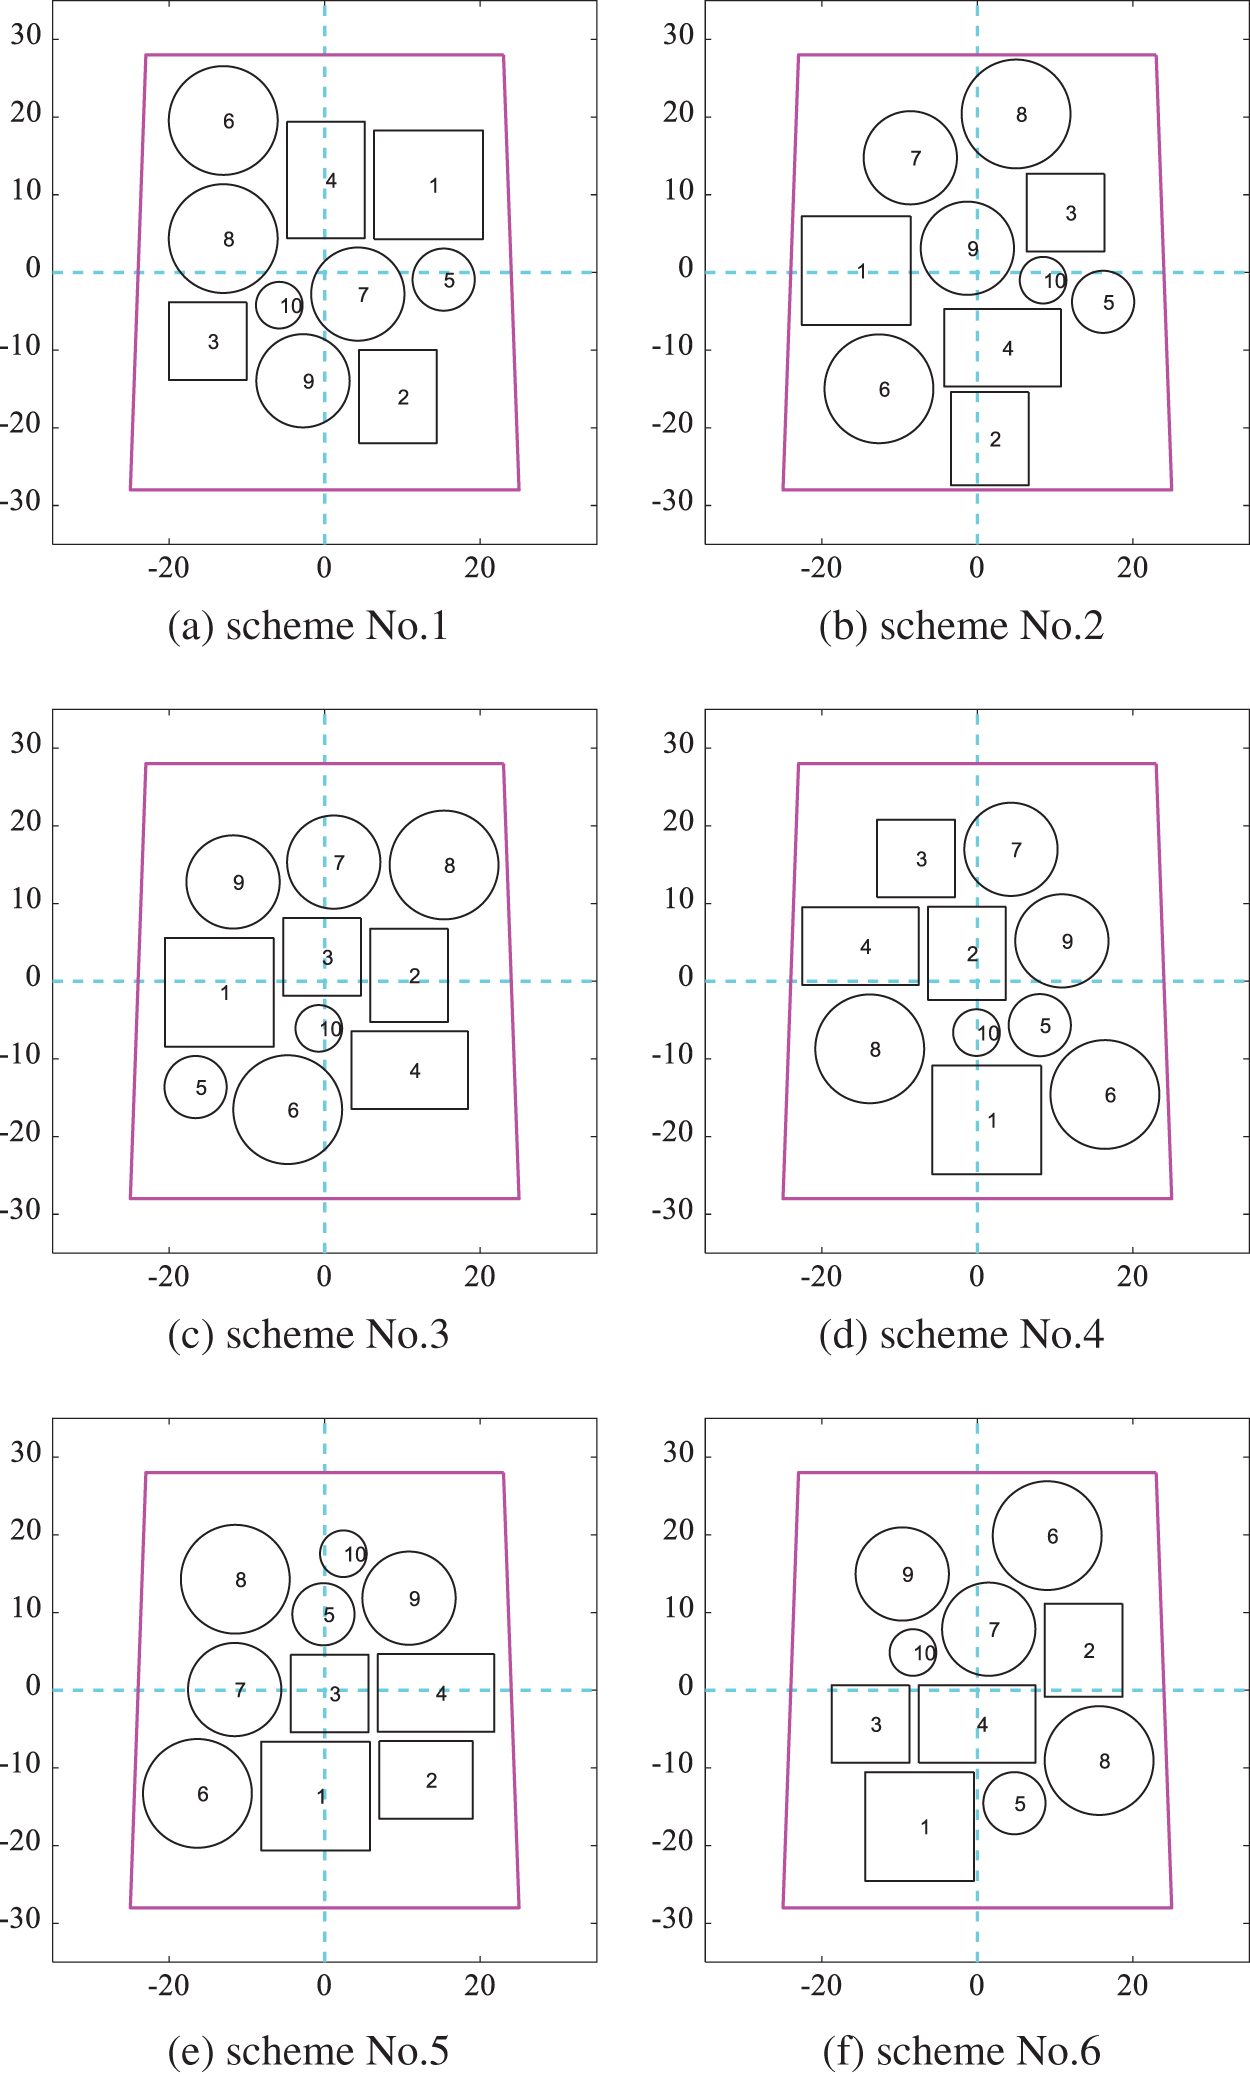
Figure 20: Layout schemes obtained by optimizing the moment of inertia according to the modified cosine similarity in Scenario B
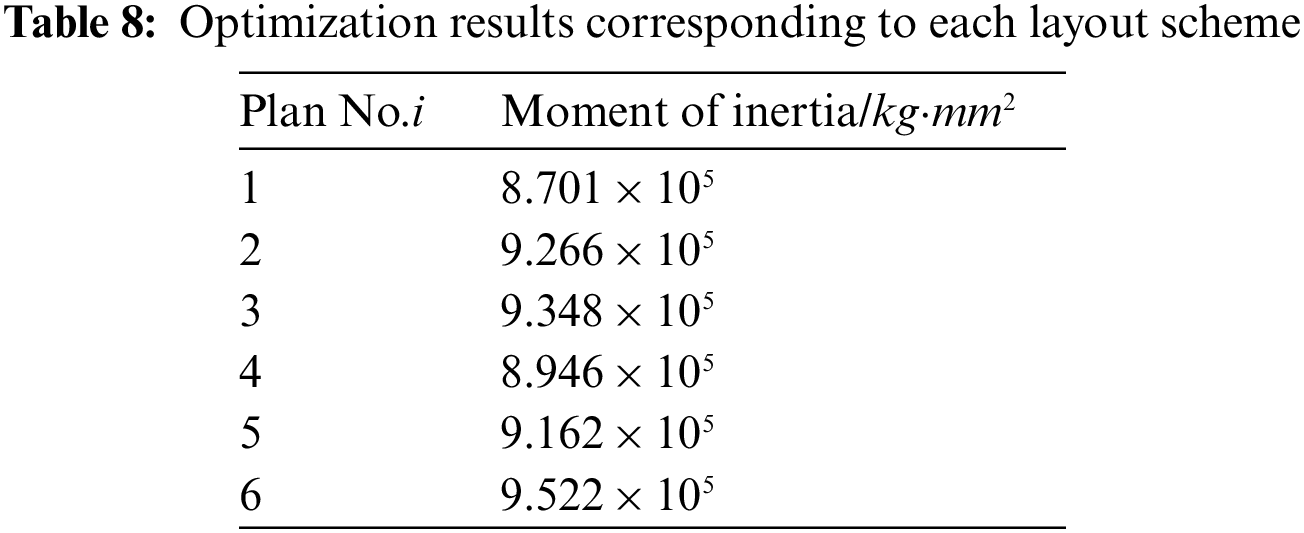
Among the layout schemes obtained according to the gaussian kernel function similarity minimum, Fig. 21 shows six schemes obtained by DPPs. The corresponding layout schemes after optimizing the moment of inertia are shown in Fig. 22. The results of the moment of inertia corresponding to each layout scheme are shown in Table 8. The difference between the maximum moment of inertia and the minimum is 8.6%.
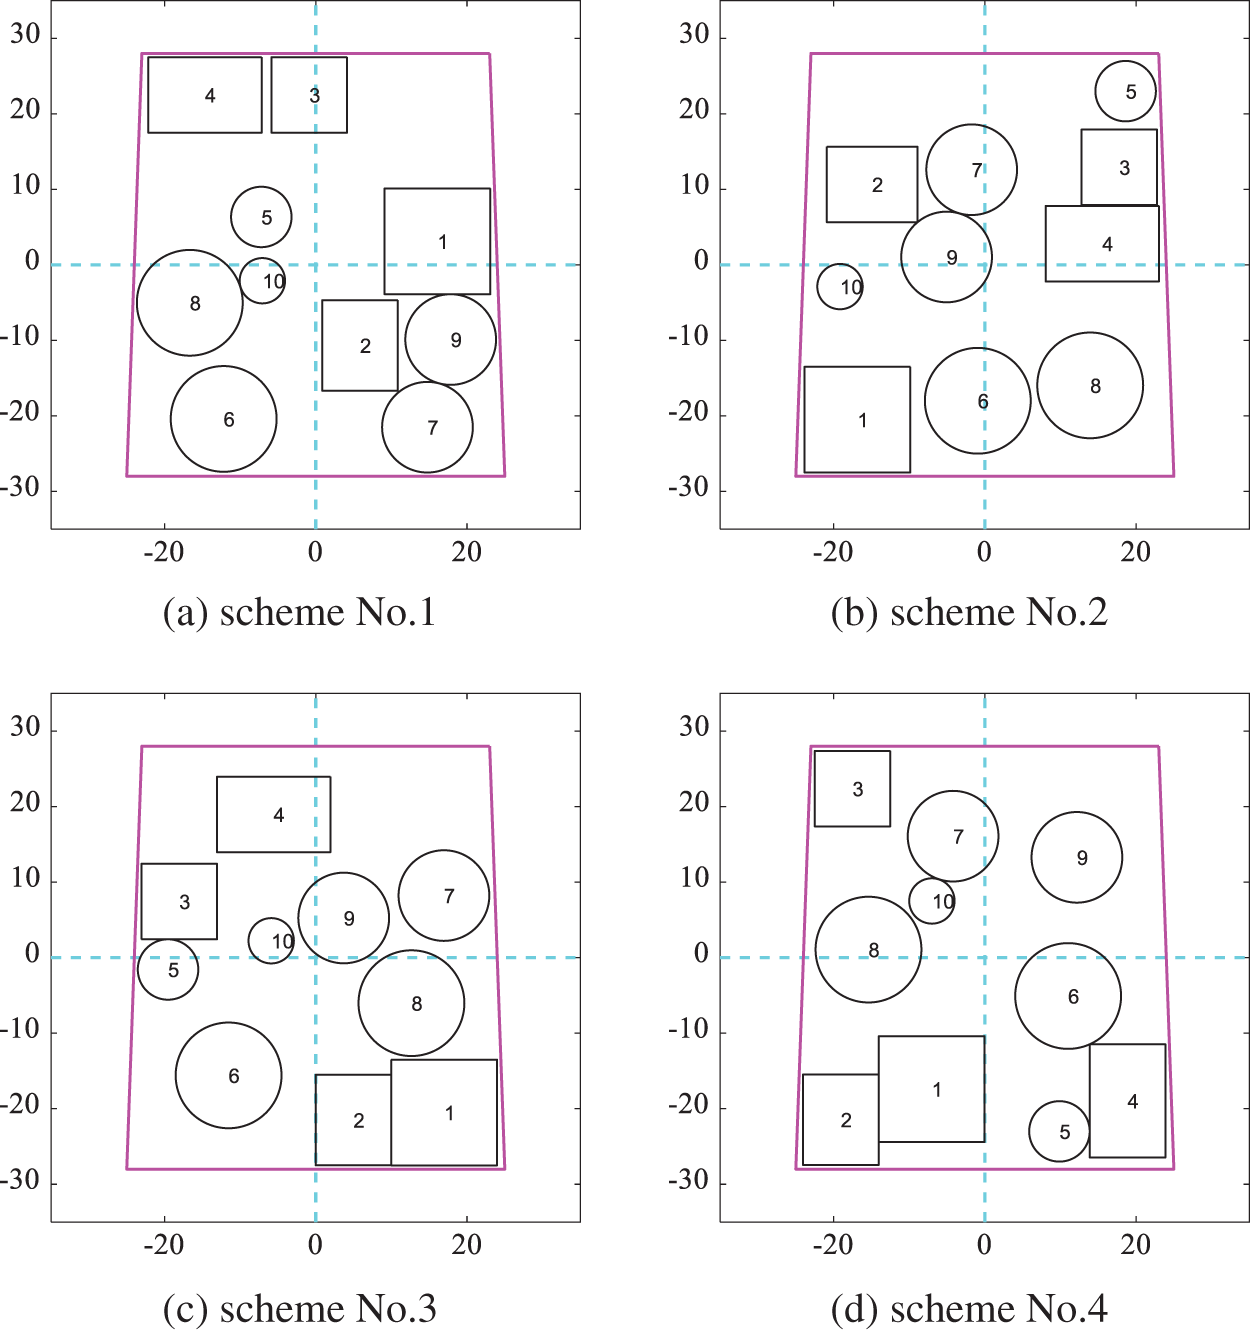
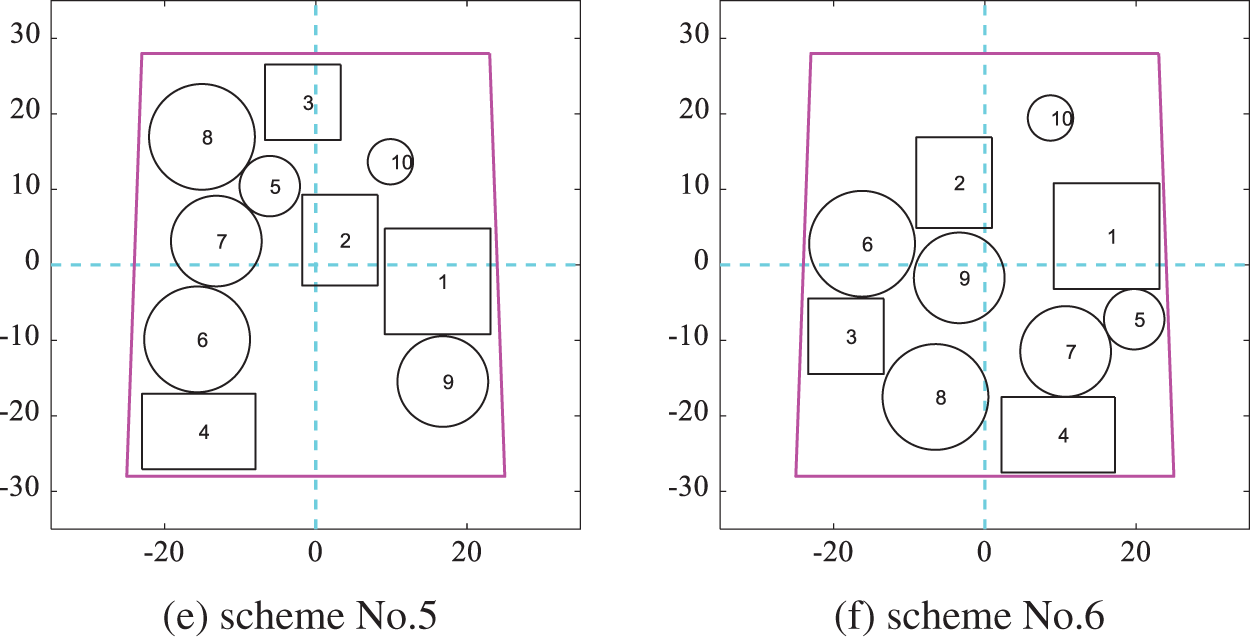
Figure 21: Layout schemes obtained by DPPs according to the gaussian kernel function similarity in Scenario B
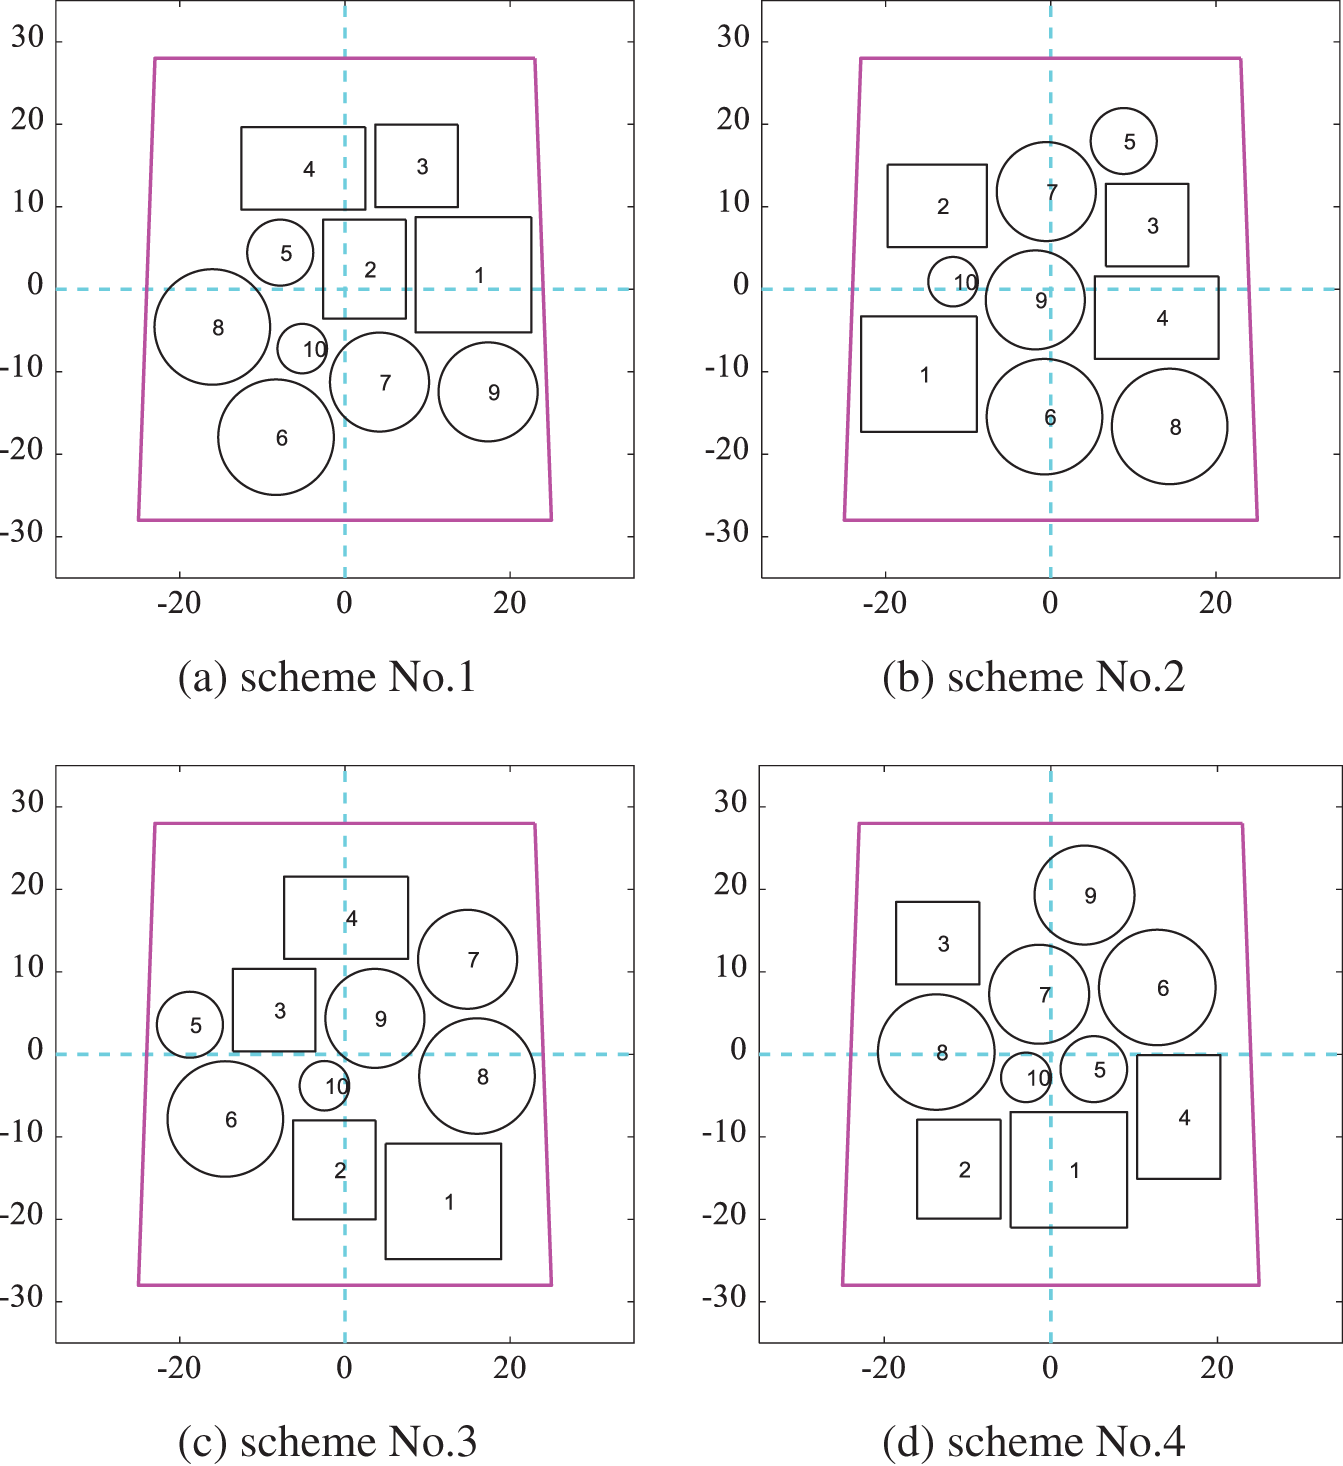
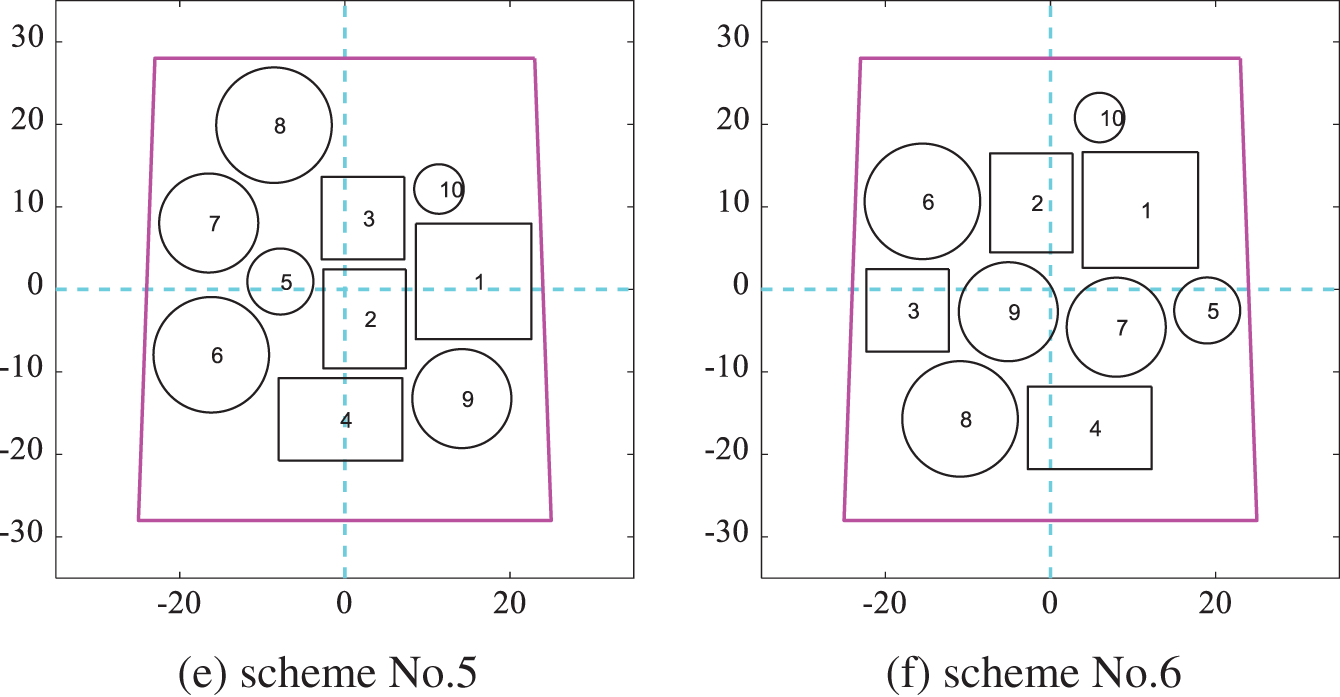
Figure 22: Layout schemes obtained by optimizing the moment of inertia according to the gaussian kernel function similarity in Scenario B
The results show that for general SELOD problems, setting diversity constraints to the optimization process can generate a variety of layout schemes with better performance and diversity, providing a greater reference for practical spacecraft engineering design.
This paper presents an innovative approach to the SELOD problem that takes into account diversity, based on the fact that traditional optimization algorithms tend to fall into local optimality. Two measures, modified cosine similarity and gaussian kernel function similarity, are designed as similarity measures for the layout schemes, guiding the optimization to generate multiple sets of layout solutions with good objective functions and some diversity. The proposed method is validated by presenting two examples of the SELOD problem. Given the complex and changing environment of spacecraft operations, applying our proposed method to engineering practice can provide some reference value for spacecraft equipment layout design. In future research, the spacecraft equipment layout design under multi-physical field conditions such as dynamic field, thermal field, and electromagnetic field will be considered to match the realistic spacecraft operation in orbit further.
Acknowledgement: We thank Dr. Zeping Wu from National University of Defense Technology for providing helpful suggestions when preparing this manuscript.
Funding Statement: This work was supported by Aerospace Frontier Inspiration Project (Grant No. KY0505072113) from College of Aerospace Science and Engineering, NUDT, which are gratefully acknowledged by the authors.
Conflicts of Interest: The authors declare that they have no conflicts of interest to report regarding the present study.
References
1. Delorme, M. (2017). Mathematical models and decomposition algorithms for cutting and packing problems. 4OR, 16(2), 229–230. DOI 10.1007/s10288-017-0365-z. [Google Scholar] [CrossRef]
2. Zhu, J. H., Gao, H. H., Zhang, W. H., Zhou, Y. (2014). A multi-point constraints based integrated layout and topology optimization design of multi-component systems. Structural and Multidisciplinary Optimization, 51(2), 397–407. DOI 10.1007/s00158-014-1134-7. [Google Scholar] [CrossRef]
3. Zhu, J. H., Guo, W. J., Zhang, W. H., Liu, T. (2016). Integrated layout and topology optimization design of multi-frame and multi-component fuselage structure systems. Structural and Multidisciplinary Optimization, 56(1), 21–45. DOI 10.1007/s00158-016-1645-5. [Google Scholar] [CrossRef]
4. Yao, W., Chen, X. Q., Luo, W. C., van Tooren, M., Guo, J. (2011). Review of uncertainty-based multidisciplinary design optimization methods for aerospace vehicles. Progress in Aerospace Sciences, 47(6), 450–479. DOI 10.1016/j.paerosci.2011.05.001. [Google Scholar] [CrossRef]
5. Yao, W., Chen, X. Q., Ouyang, Q., van Tooren, M. (2011). A surrogate based multistage-multilevel optimization procedure for multidisciplinary design optimization. Structural and Multidisciplinary Optimization, 45(4), 559–574. DOI 10.1007/s00158-011-0714-z. [Google Scholar] [CrossRef]
6. Zhang, W. S., Zhong, W. L., Guo, X. (2015). Explicit layout control in optimal design of structural systems with multiple embedding components. Computer Methods in Applied Mechanics and Engineering, 290, 290–313. DOI 10.1016/j.cma.2015.03.007. [Google Scholar] [CrossRef]
7. Fakoor, M., Taghinezhad, M. (2015). Layout and configuration design for a satellite with variable mass using hybrid optimization method. Proceedings of the Institution of Mechanical Engineers, Part G: Journal of Aerospace Engineering, 230(2), 360–377. [Google Scholar]
8. Chen, X. Q., Yao, W., Zhao, Y., Chen, X. Q., Zheng, X. H. (2018). A practical satellite layout optimization design approach based on enhanced finite-circle method. Structural and Multidisciplinary Optimization, 58(6), 2635–2653. DOI 10.1007/s00158-018-2042-z. [Google Scholar] [CrossRef]
9. Qin, Z., Liang, Y. G., Zhou, J. P. (2018). An optimization tool for satellite equipment layout. Advances in Space Research, 61(1), 223–234. DOI 10.1016/j.asr.2017.10.030. [Google Scholar] [CrossRef]
10. Zhong, C. Q., Xu, Z. Z., Teng, H. F. (2019). Multi-module satellite component assignment and layout optimization. Applied Soft Computing, 75, 148–161. DOI 10.1016/j.asoc.2018.11.021. [Google Scholar] [CrossRef]
11. Chen, X. Q., Yao, W., Zhao, Y., Chen, X. Q., Liu, W. (2021). A novel satellite layout optimization design method based on phi-function. Acta Astronautica, 180, 560–574. DOI 10.1016/j.actaastro.2020.12.034. [Google Scholar] [CrossRef]
12. Sun, J. L., Chen, X. Q., Zhang, J., Yao, W. (2021). A niching cross-entropy method for multimodal satellite layout optimization design. Complex & Intelligent Systems, 7(4), 1971–1989. DOI 10.1007/s40747-021-00302-3. [Google Scholar] [CrossRef]
13. Cuco, A. P. C., de Sousa, F. L., Silva Neto, A. J. (2014). A multi-objective methodology for spacecraft equipment layouts. Optimization and Engineering, 16(1), 165–181. DOI 10.1007/s11081-014-9252-z. [Google Scholar] [CrossRef]
14. Fakoor, M., Ghoreishi, S. M. N., Sabaghzadeh, H. (2016). Spacecraft component adaptive layout environment (SCALEAn efficient optimization tool. Advances in Space Research, 58(9), 1654–1670. DOI 10.1016/j.asr.2016.07.020. [Google Scholar] [CrossRef]
15. Qin, Z., Liang, Y. G. (2018). Multiobjective methodology for satellite cabin layout optimization considering space debris impact risk. Journal of Spacecraft and Rockets, 55(1), 232–235. DOI 10.2514/1.A33908. [Google Scholar] [CrossRef]
16. Wang, B., Zhou, Y., Zhou, Y. M., Xu, S. L., Niu, B. (2018). Diverse competitive design for topology optimization. Structural and Multidisciplinary Optimization, 57(2), 891–902. DOI 10.1007/s00158-017-1762-9. [Google Scholar] [CrossRef]
17. Xie, Y. M., Yang, K., He, Y. Z., Zhao, Z. L., Cai, K. (2019). How to obtain diverse and efficient structural designs through topology optimization. Proceedings of the IASS Annual Symposium 2019–Structural Membranes 2019, Barcelona, Spain. [Google Scholar]
18. Yang, K., Zhao, Z. L., He, Y. Z., Zhou, S. W., Zhou, Q. et al. (2019). Simple and effective strategies for achieving diverse and competitive structural designs. Extreme Mechanics Letters, 30, 100481. DOI 10.1016/j.eml.2019.100481. [Google Scholar] [CrossRef]
19. Cai, Q., He, L. W., Xie, Y. M., Feng, R. Q., Ma, J. M. (2021). Simple and effective strategies to generate diverse designs for truss structures. Structures, 32, 268–278. DOI 10.1016/j.istruc.2021.03.010. [Google Scholar] [CrossRef]
20. Li, Z., Liu, H., Cheng, G. D., Zhou, Y. M. (2021). A diversity metric based on Gaussian process model for diverse and competitive design. Structural and Multidisciplinary Optimization, 64(5), 2975–2997. DOI 10.1007/s00158-021-02967-3. [Google Scholar] [CrossRef]
21. Dommaraju, N., Bujny, M., Menzel, S., Olhofer, M., Duddeck, F. (2022). Evaluation of geometric similarity metrics for structural clusters generated using topology optimization. Applied Intelligence, 1–26. DOI 10.1007/s10489-022-03301-0. [Google Scholar] [CrossRef]
22. Jang, S., Yoo, S., Kang, N. (2022). Generative design by reinforcement learning: Enhancing the diversity of topology optimization designs. Computer-Aided Design, 146(C), 103225. DOI 10.1016/j.cad.2022.103225. [Google Scholar] [CrossRef]
23. Deng, H., To, A. C. (2021). A parametric level set method for topology optimization based on deep neural network. Journal of Mechanical Design, 143(9), 091702. DOI 10.1115/1.4050105. [Google Scholar] [CrossRef]
24. Ryu, N., Seo, M., Min, S. (2021). Multi-objective topology optimization incorporating an adaptive weighed-sum method and a configuration-based clustering scheme. Computer Methods in Applied Mechanics and Engineering, 385, 114015. DOI 10.1016/j.cma.2021.114015. [Google Scholar] [CrossRef]
25. Bennell, J., Scheithauer, G., Stoyan, Y., Romanova, T. (2008). Tools of mathematical modeling of arbitrary object packing problems. Annals of Operations Research, 179(1), 343–368. DOI 10.1007/s10479-008-0456-5. [Google Scholar] [CrossRef]
26. Chernov, N., Stoyan, Y., Romanova, T. (2010). Mathematical model and efficient algorithms for object packing problem. Computational Geometry, 43(5), 535–553. DOI 10.1016/j.comgeo.2009.12.003. [Google Scholar] [CrossRef]
27. Wu, Z., Wang, D., Okolo N, P., Hu, F., Zhang, W. (2016). Global sensitivity analysis using a Gaussian radial basis function metamodel. Reliability Engineering and System Safety, 154, 171–179. DOI 10.1016/j.ress.2016.06.006. [Google Scholar] [CrossRef]
28. Wu, Z., Wang, D., Okolo, N. P., Jiang, Z., Zhang, W. (2016). Unified estimate of Gaussian kernel width for surrogate models. Neurocomputing, 203, 41–51. DOI 10.1016/j.neucom.2016.03.039. [Google Scholar] [CrossRef]
29. Wu, Z., Wang, D., Okolo, P. N., Zhao, K., Zhang, W. (2017). Efficient space-filling and near-orthogonality sequential latin hypercube for computer experiments. Computer Methods in Applied Mechanics and Engineering, 324, 348–365. DOI 10.1016/j.cma.2017.05.020. [Google Scholar] [CrossRef]
30. Wu, Z., Wang, D., Wang, W., Zhao, K., Zhou, H. et al. (2020). Hybrid metamodel of radial basis function and polynomial chaos expansions with orthogonal constraints for global sensitivity analysis. Structural and Multidisciplinary Optimization, 62(2), 597–617. DOI 10.1007/s00158-020-02516-4. [Google Scholar] [CrossRef]
31. Kulesza, A. (2012). Determinantal point processes for machine learning. Foundations and Trends® in Machine Learning, 5(2–3), 123–286. DOI 10.1561/2200000044. [Google Scholar] [CrossRef]
32. Elfeki, M., Couprie, C., Riviere, M., Elhoseiny, M. (2018). GDPP: Learning diverse generations using determinantal point process. Statistics, 3, 1–16. [Google Scholar]
33. Chen, W., Ahmed, F. (2021). PaDGAN: Learning to generate high-quality novel designs. Journal of Mechanical Design, 143(3), 031703. DOI 10.1115/1.4048626. [Google Scholar] [CrossRef]
34. Zhang, P., Li, J. L., Li, T. F., Chen, H. H. (2021). A new many-objective evolutionary algorithm based on determinantal point processes. IEEE Transactions on Evolutionary Computation, 25(2), 334–345. DOI 10.1109/TEVC.2020.3035825. [Google Scholar] [CrossRef]
35. Teng, H. F., Chen, Y., Zeng, W., Shi, Y. J., Hu, Q. H. (2010). A dual-system variable-grain cooperative coevolutionary algorithm: Satellite-module layout design. IEEE Transactions on Evolutionary Computation, 14(3), 438–455. DOI 10.1109/TEVC.2009.2033585. [Google Scholar] [CrossRef]
Cite This Article
 Copyright © 2023 The Author(s). Published by Tech Science Press.
This work is licensed under a Creative Commons Attribution 4.0 International License , which permits unrestricted use, distribution, and reproduction in any medium, provided the original work is properly cited.
 Downloads
 Citation Tools