
 Submit a Paper
 Propose a Special lssue
 Open Access
ARTICLE

Modeling, Analysis and Simulation of a High-Efficiency Battery Control System
1 College of Engineering Technology, National University of Science and Technology, Dhi Qar, Iraq
2 Aksaray University, Faculty of Engineering, Department of Electrical and Electronics Engineering, Aksaray, Turkey
* Corresponding Author: Yunus Uzun. Email:
(This article belongs to the Special Issue: Artificial Intelligence in Renewable Energy and Storage Systems)
Computer Modeling in Engineering & Sciences 2023, 136(1), 709-732. https://doi.org/10.32604/cmes.2023.024236
Received 26 May 2022; Accepted 28 August 2022; Issue published 05 January 2023
 View Full Text
 Download PDF
Abstract
This paper explains step-by-step modeling and simulation of the full circuits of a battery control system and connected together starting from the AC input source to the battery control and storage system. The three-phase half-controlled rectifier has been designed to control and convert the AC power into DC power. In addition, two types of direct current converters have been used in this paper which are a buck and bidirectional DC/DC converters. These systems adjust the output voltage to be lower or higher than the input voltage. In the buck converters, the main switch operates in conduction or cut-off mode and is triggered by a Pulse-Width Modulated (PWM) signal. The output and input voltage levels ratio are used to calculate the PWM signal’s duty cycle. Therefore, the duty cycle indicates the operation mode of the converter in steady-state operation. In this study, we analyze and control of a buck converter with the PWM signal. Besides, the bidirectional DC/DC converter has been achieved and optimized by PI control methods to control the battery charging and discharging modes. The simulation has been applied via the Matlab/Simulink environment. The results show the activity of each part of the designed circuits starting from the converters and the battery control system in charge and discharge modes.Keywords
The present electronic gadgets have higher portability and are greener than at any time in recent memory. Batteries energize a wide range of devices, from electric vehicles to wireless sensor nodes. Batteries not only provide energy to devices, they also contribute to the reduction of carbon dioxide emissions [1,2]. Due to the ever-increasing demand for energy, the interest in energy conversion and storage has increased [3]. Batteries are widely used in energy storage, and they can be used alone in systems, or sometimes with other elements [4–6]. In particular, Lithium-Ion batteries are widely used in many systems, such as electric vehicles and ships [7,8]. The continuous change of battery innovation has incited numerous newcomers to find out about planning battery charging systems. The working principles of the rectifier, converter and Battery Management System (BMS), which are the most important parts of such systems [9–12] are explained separately and their simulations are realized. Today, thanks to various artificial intelligence applications, it is possible to predict the battery or supercapacitor life and charge-discharge times with high accuracy [13,14].
Three-phase fully controlled converters are exceptionally common in numerous mechanical applications, especially in circumstances where power recovery from the DC side is basic. It can handle sensibly high forces and has satisfactory input and output consonant contortion [15]. The design additionally fits simple series and parallel associations to increase the voltage and current rating or improve symphonious conduct [16]. In any case, this adaptability of three-phase fully controlled converters is acquired at the expense of increased circuit intricacy because of the utilization of six thyristors and their related control circuit. This intricacy can be impressively decreased in applications where power recovery is not essential. Overall, three thyristors of the top gathering or the base gathering of a three-phase fully controlled converter can be supplanted by three diodes. In this case, the converter is known as a three-phase half controlled converter. Supplanting three thyristors with three diodes diminishes the circuit multifaceted nature and yet forestalls negative voltage showing up at the output whenever [11,12,17]. The output voltage is periodic more than 33% of the input cycle as opposed to one-6th just like the case with fully controlled converters and the half-controlled three-phase converters are not as famous as their fully controlled partner. Although the design of the half-controlled converter is relatively simple and inexpensive, its analysis is more difficult and complex than a full-control converter.
Direct current converters in power electronic circuits are used in a large application area, from home appliances, automotive applications, smartphones and tablets to information technologies [14]. Efficiency has become the most critical parameter in designs according to international quality standards. Therefore, low loss and high efficiency have become one of the most important factors in converters. The aim of using the control algorithm strategies, to keep the value of the output voltage at the desired levels with respect to the load value and the variation line. The control methods that use power converters could be classified as; the linear controllers and nonlinear controllers [18]. The root locus technique is a pole placement method that assigns a dominant closed loop pole. Nonetheless, this technique requires controller gain tuning to meet specification requirements. This technique is only useful for controller design [19]. The root locus is a graphical method for determining the eigenvalues of a control system when the system’s parameters, typically a gain in a feedback system, are changed from zero to infinity [20]. The main steps to designing the controller depend on the mathematical model of the converters that have been used. Therefore, the linear control strategy has been designed according to the classic control system approach, which is the small-signal model of the converter. A more accurate model is necessary to achieve good performance under the changes in the operation points, such as load variations, but the design of the model will be more complex. In this case, the trial and error strategy will be the solution to avoid the error states. For control of the buck converters, various nonlinear methods are PI controller coefficients were determined by the genetic algorithm by using the closed-loop design on a single switch type in the simulation environment. This paper offers multiple designs that use different methodologies to convert current and voltage into two separate AC/DC and DC/DC systems. Additionally, the PI controller has connected and used the bidirectional. In the study, the battery charging system was considered as a whole and all parts were simulated separately. In addition, real battery values were used in the simulations. Thus, the behavior of a real battery in the system could be observed clearly.
2 The Three Phase Half Wave Controlled Rectifier
Traditionally, the units of energy conservation in any electrical and electronic systems dealing with batteries are equipped with direct current, and the main sources of equipment are running on alternating current [15]. So, it is necessary to transfer this energy from the main source to the system of energy conservation in electrical and electronic devices, and-herein lies the importance of using the transformer [21,22]. In this design, the three-phase half-controlled rectifier is used to convert the AC into a DC source. Therefore, the average DC value of the output voltage waveform from the three-phase half-controlled rectifier is given in Eq. (1) below:
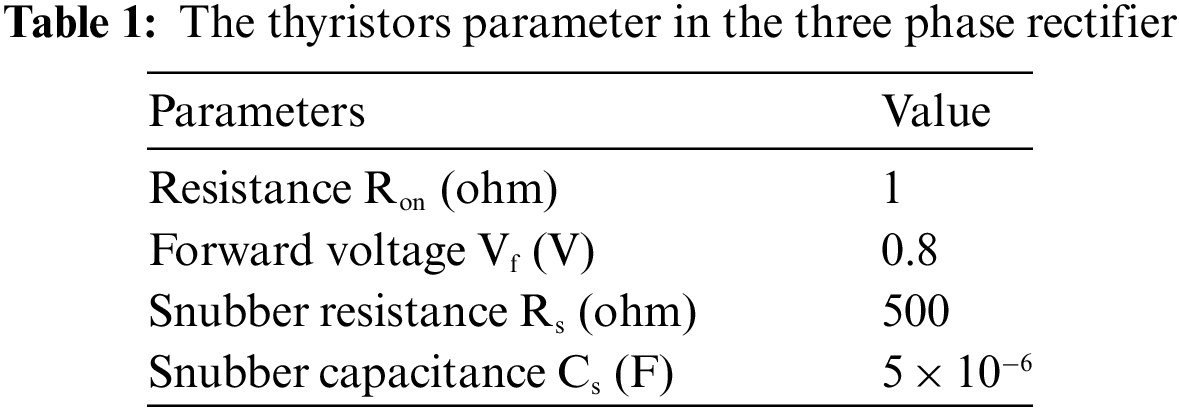
The design of the three-phase rectifier depends on three thyristors and three diodes are connected as shown in Fig. 1. In addition, each of the thyristors and the diodes has the same parameters as shown in Table 1 below:

Figure 1: The simulation design of the three phase rectifier
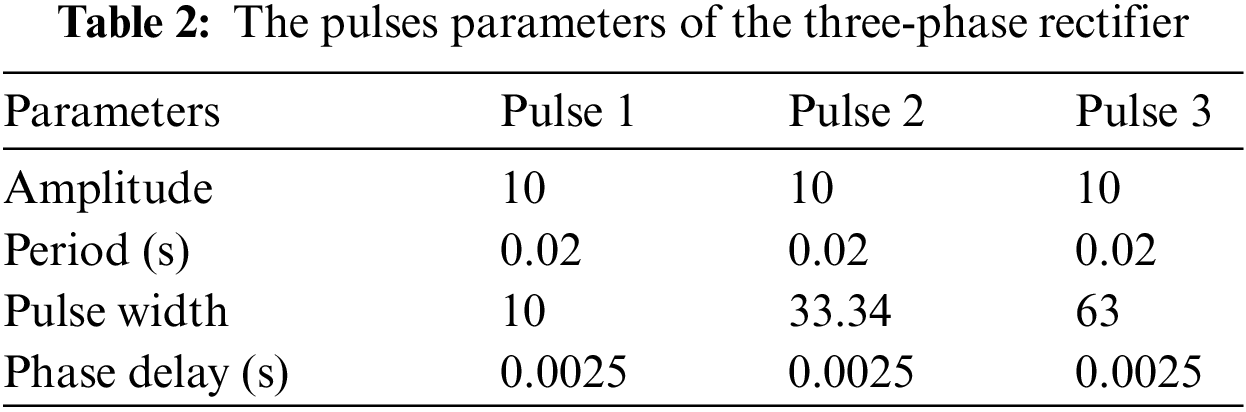
Besides, the three thyristors are supported by three pulse generator systems as shown in Fig. 1 to control the pulse width of the output signals of the three phase half-controlled rectifier and the parameters of the pulse generator are explained in Table 2. The three-phase half-controlled rectifier has a 10 ohm resistor connected to it to control the voltage and current.
In such systems, single-phase rectifiers can be used instead of three-phase. But, in contrast to a single-phase rectifying circuit, such as that shown in Fig. 2, the three-phase circuit, which has a constant voltage and frequency, can be used through a rectification circuit to produce and grant a constant DC voltage strength, which can then be filtered to produce an output DC voltage with much less ripple. In addition, the input three-phase power source that feeds the three-phase half-controlled rectifier has been simulated as the typical power source available in many countries and used to charge electric vehicles. It consists of a 220 voltage of peak amplitude and 50 Hz of the frequency with a (0 degree) angle for the phase A, (−120 degree) angle for the phase B and (120 degree) angle for the phase C.
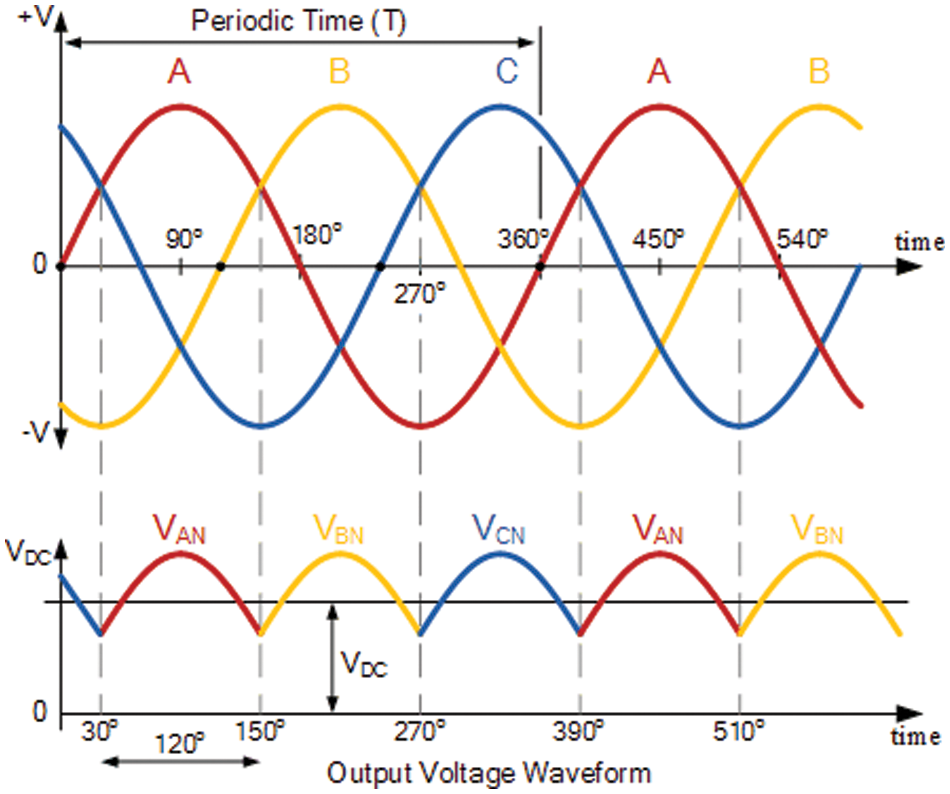
Figure 2: Rectification of three phase supply using thyristor
The buck converter is utilized to keep the value of the output voltage at the desired levels with respect to the load value and the variation line. Instead of controlling a variable resistance as in the linear regulators, the output of the switching regulator is controlled by rapidly switching a series of devices on and off [23]. How much charge is transferred to the load is controlled by the duty cycle of the switch, which is controlled by a similar feedback mechanism to a linear control. The switching design is efficient because the series element dissipates almost no power when it is either fully conducting or switched off [21]. One of the impossibilities of the linear control design that switching regulators are not capable of generating a higher output voltage than the input. Hence, the aim of using the buck converter is to control the output of the three-phase half connected rectifier by the PWM signal, supply the load in charging and discharge mode, and feed the battery voltage in charging mode.
Moreover, switching voltage regulators differ from linear regulators in how PWM is carried out and are typically utilized for both step-up and step-down applications. The switching regulators control the output voltage by using constant frequency values and variable duty-cycle ratios. The switch duty-cycle ratio controls how much and how quickly the output supply voltage increases or decreases depending on the load state and input source voltage [24]. The advantage of switching regulators is efficiency as minimal power is dissipated in the power path (switches) when the output supply voltage is sufficient for the load state [22].
The disadvantage of switching regulators is complexity. It requires some extra components for the design and implementation. To obtain the calculated output voltage, an open-loop converter simply has a fixed duty cycle. In contrast, the output voltage of a closed-loop converter is continuously measured and fed back to the microcontroller. The controller continuously adjusts the duty-cycle based on the mismatch between the desired voltage and the actual output voltage. But in a battery control system, the output voltage does not need to be extremely sensitive. In this work, an open loop converter was preferred in order not to cause complexity and to reduce the cost in real application. The calculation of some parameters of the Buck converter is shown below:
where, D is maximum duty cycle, Vo is output voltage, Vi(max) is maximum input voltage, η is efficiency of the converter (used as 90%), L is inductor value, ΔIL is estimated inductor ripple current (0.2 to 0.4 × Io), fs is minimum switching frequency, C is minimum output capacitance and ΔVo is desired output voltage ripple. According to the calculations, the inductor and capacitor values were chosen as approximately 150 and 300 μF, respectively.
The parameters used for the buck converter design are shown in Table 3. The buck converter supported by PWM simulation design is shown in Fig. 3. The duty cycle simulation design is shown in Fig. 4.
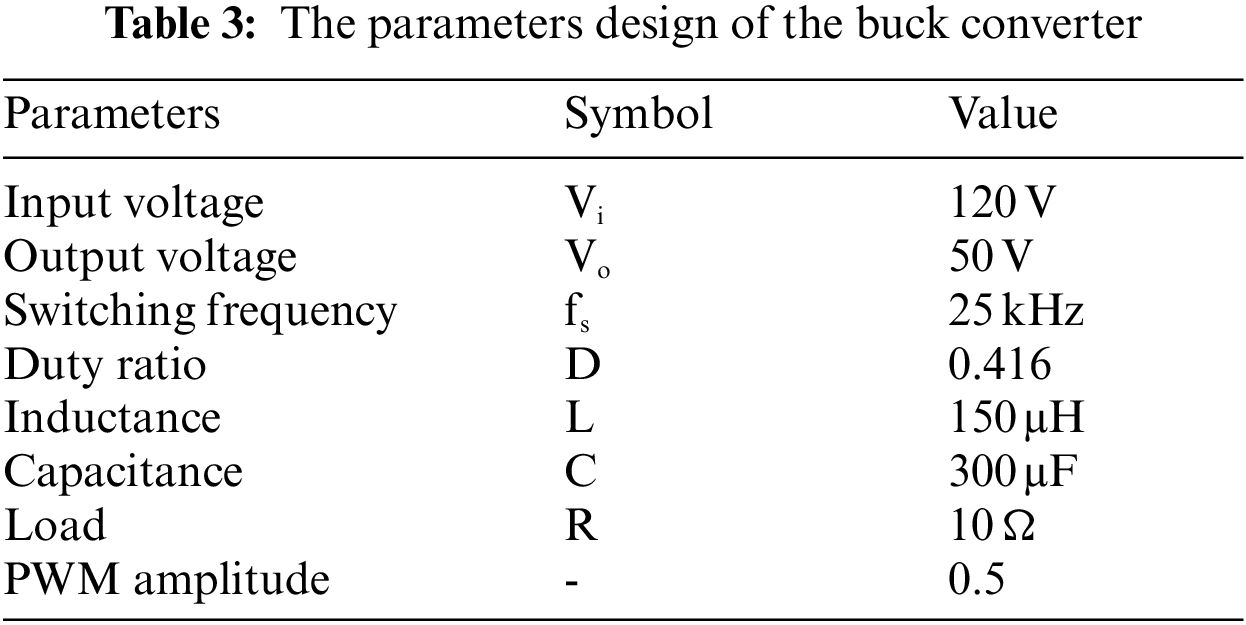

Figure 3: The simulation design block of buck converter with PWM

Figure 4: The duty cycle simulation design
4 The Bidirectional DC/DC Converter Design
Generally, electric devices use two different power systems; a high-voltage battery (100 to 450 VDC) for traction and a low-voltage battery (12 V) for supplying common electric and electronic applications. Traditionally, the low-voltage battery was charged from the alternator in low electrical applications, but in today’s most electrical applications, such as electrical vehicles, the power comes from the high-voltage battery pack [16]. In specific electric vehicle architectures, the low-voltage battery should be ready to help recharge the high-voltage battery pack in order to provide energy for cranking the parts of the electrical and electronic circuits of the devices [25]. That means, the onboard DC-DC converter must be bidirectional and very efficient as well as highly reliable in order to run the complex control algorithms needed to ensure an energy-efficient solution [26]. This part of the control system is responsible for charging and discharging of the battery in the electric devices that control the output power between the three-phase rectifier, the buck converter and the battery [26]. In this paper, the design of the bidirectional DC/DC converter depends on two main MOSFETs that are connected directly with the DC/DC converter circuit as shown in Fig. 5. The parameters of the two MOSFETs consist of 0.1 ohm for FET resistance (Ron), 0.01 ohm for internal diode resistance (Rd) and 1 × 10⁻⁵ ohm for Snubber resistance (Rs). There is a series branch of RLC that is connected in parallel with two MOSFETs and the parameters are 0.01 ohm for resistance and 1000

Figure 5: The simulation design of bidirectional DC/DC converter
The suggested Bidirectional DC/DC (BDC) converter works as a buck converter in the charging mode. In order to charge the battery with current Ibatt, the suggested load power flow direction is from the DC bus to the battery bank. This method of operation has two states, each of which is characterized as follows: This mode of operation is divided into two states and described as follows [27].
Case 1: The power MOSFET 1 is turned on, the power MOSFET 2 is turned off, and the body diode D2 is reversed. Thus, the filtering inductor LP is charged up linearly by the voltage.
The current in filtering inductor (LP) begins to increase linearly with slope
Case 2: When the power MOSFETs 1 and 2 are turned off. The body diode D2 starts conducting, the voltage across the filtering inductor LP is about
The current in the filtering inductor LP begins to decrease linearly with slope.
The filtering inductor current ILP can be expressed as
where
In the current control mode, the BDC works as a boost converter. In order to discharge the battery with current Ibatt, the proposed BDC’s power flow direction is from the battery bank to the DC bus. To prevent needless dissipation, the battery bank’s discharge energy is specifically recovered to the DC bus capacity Cbus. This method of operation has two states, each of which is characterized as follows [27]:
Case 1: In this situation, the power MOSFETs 1 and 2 are both on, the filtering inductor LP is receiving zero current, and the polarity is then charged. the voltage across the filtering inductor LP is:
In order for the current to start increasing linearly with the slope in the filtering inductor LP.
Case 2: In this situation, the body diode D1 begins to receive current while the power MOSFETs 1 and 2 are off. Roughly 0.1 volts are present across filtering inductor LP.
In order for the current in the filtering inductor LP to start decreasing linearly with slope.
The filtering inductor LP has just been released. The battery bank discharge current begins to charge the DC bus capacitor Cbus. The state’s filtering inductor current, ILP, may be written as
where
Moreover, another mode which is (Trickle Charging Mode) often referred to as the resting phase. Power MOSFETs 1 and 2 are disabled in this mode to separate the battery bank and DC bus. In order to reduce electrolyte density, boost battery charging efficiency, and lengthen battery life, the electrolyte ions are diffused and distributed in this mode.
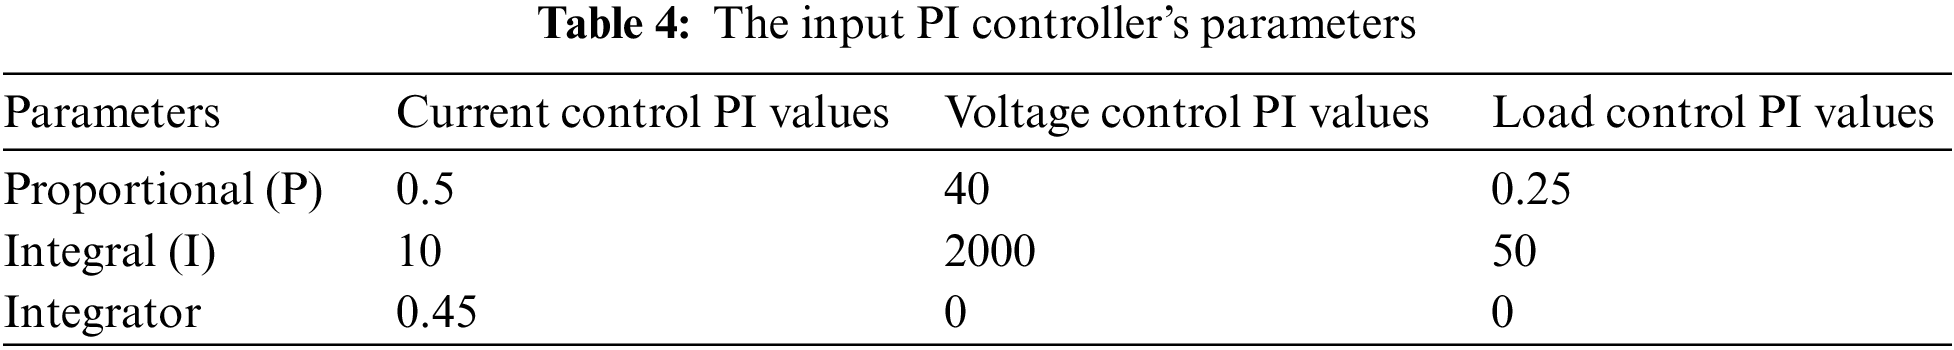
The bidirectional converter is used to control the battery voltage and current in two modes: charging and discharging mode, by connecting via the PI controller. The control system controls the battery through the two MOSFETs of the bidirectional converter. The system as shown in Fig. 6 contains four parts; switch control, current control, voltage control and load control [9,22]. These components have been integrated into a single system known as a battery control management system. Battery management systems are very important in electric vehicles in terms of safety, battery life and cost [28,29]. As is known, the PI controllers depend on the trial and error strategy to determine the suitable values to use in any controller. The parameters on the PI controllers for each part of the battery control system are shown in Table 4. The PI design is dependent on Eq. (2). Hence, the charge mode, discharge mode, and load of the battery cell have been controlled by using the battery control system with several strategies.

Figure 6: The battery control system simulation design
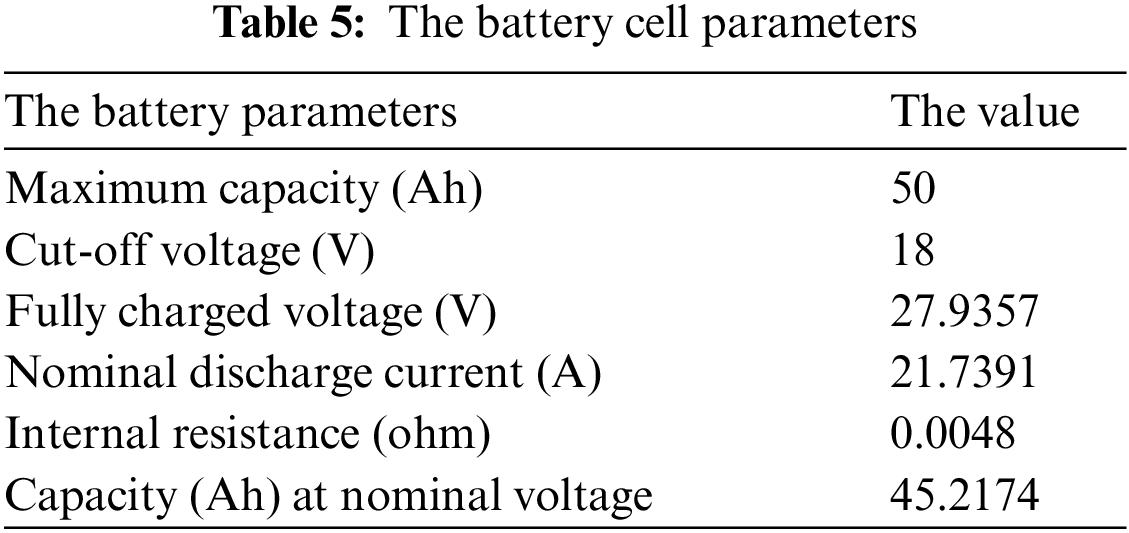
One of the most important parts that determine the efficiency of any electric-electronic device is the battery and its management; it is considered the soul of the device. There are many battery types, capacities and manufacturers. Therefore, the battery control systems also differ from one device to another, and there are a number of different strategies and methods used previously to manage the battery and provide the necessary electric power under different operation conditions [9,30]. In this study, we have carried out a comprehensive simulation of lithium-ion batteries, which are widely used in many fields such as electric vehicles and fans. Also, the functionality and effectiveness of using the three-phase rectifier with a bidirectional DC/DC converter controlled using a buck converter and a PI controller were tested. The battery that isused in the work has a nominal voltage equal to 24 V and a rated capacity equal to 50 Ah. The efficiency of any battery could be determined by using the State of Charge (SOC), which is the level of charge of an electric battery relative to its capacity. An important factor of any electric device battery, the battery should have good charging and discharging State of Charge characteristics for safety, reliability and better life [31]. The units of SOC are percentage points (0% = empty; 100% = full) as an ideal value. Thus, the simulation of the battery has tried to reach the maximum point of charging about 100% and shows the effectiveness of the voltage and current at the load, which act like the parts of the electric device. Besides, the parameters of the battery cell that was used in the work are shown in Table 5.
7 The Main Systems Simulation and Results
In this section, detailed simulation studies and results of the rectifier, buck converter, bidirectional DC-DC converter, and battery will be explained.
7.1 The Three Phase Half Wave Controlled Rectifier
The three-phase rectifier half-connected rectifier is fed directly from the input three-phase AC source with 220 V for each phase as shown in Fig. 7. The work of the rectifier depends on the input parameters of its design, as explained previously in the design part.

Figure 7: The input voltage of the three-phase rectifier
The simulation result of the three-phase half-controlled rectifier output voltage as shown in Fig. 8 will be equal to 180 V in DC. The results show there are two cases of the output that could be found; a normal signal and an affected signal. The first one that started from (0 to 2.5 s) is affected by the PWM signal generated by the buck converter, and this signal has many properties to be used in this system in charging mode to supply the battery with a high band of voltage. Another signal can be found as shown in the simulation Fig. 8 that started from (2.5 to 5 s). It can be described as the normal output signal for the three-phase half controller rectifier, and this signal will be fewer characteristics than the previous one because of the low bandwidth and this signal has been founded in cases of the turn of the buck converter.

Figure 8: The output voltage of the three-phase rectifier with and without PWM signal
The top-level test bench is created to simulate the control output buck converter design. As a first step, the output capacitance and the inductance must be chosen as a first step since they are put into the test bench as ideal components. 300 and 150 μH typical capacitance, and inductance value is chosen, respectively. As seen in Fig. 9, the PWM voltage signal acts as a Continuous Current Mode (CCM). The conduction loss is reduced and allows the bidirectional inductor current flow. Thus, the buck converter is always maintained in CCM. The buck converter has higher efficiency at full load because of the forward voltage drop of the diode. The simulation graph is shown in the following two figures; the first is the current that crosses the buck converter, and it is about 35 A. The second figure shows the voltage that crosses through the buck converter and it is about 45 V. The result has shown how the output signal of the three-phase rectifier has been affected by the PWM signal through the buck converter and how it has become more bandwidth without losing any of its properties. This can be seen in the miniature form of both current and voltage waves in the figures.

Figure 9: PWM buck converter capacitance voltage and inductance current
7.3 The Bidirectional DC/DC Converter
Generally, there are two cases for any battery status in the electronic systems with respect to the load of the device, which are charging and discharging modes. When the voltage source is disabled, the battery will supply the load. When the voltage source is enabled, the battery will charge and the load will be supplied from the voltage source. Besides, the power that feeds the battery in charging mode or the power that feeds the load in discharge mode must be controlled to be suitable for the battery requirements without damage. The bidirectional DC/DC converter is responsible for controlling the battery status by connecting the converter with a control system using a PI controller after trial and error searching. The aim of using a PI controller is to control the output and be as constant values for the system. The efficiency of any battery control system is also related to the time it takes for the battery to reach a charge level from 0% to 100%. In the discharge mode, the battery should be carrying the load requirements of the device for a longer time. Hence, to achieve these aims, there are several strategies that have been applied to the system to be as efficient as possible.
7.4 The Battery Charging and Discharging Modes
i. Current control strategy: Basically, the batteries are controlled in two modes: constant current control and constant voltage control methods. Technically, each battery management system should check the allowed maximum current for the battery that is connected to the system [21,32–34]. As shown in Table 3, the allowed maximum current for the battery is 21.7391 A as the maximum required to charge. Some battery companies separated the constant current control and constant voltage control sides at an 80% SOC level or 100% SOC level depending on the battery manufacturing requirements and the scientific strategies that have been applied in the system to get high efficiency. Therefore, the open circuit has been applied to determine the required voltage to the maximum level of charging and the result for this application is 28.04 volts. The current control strategy has been utilized to test the efficiency of the battery-charging mode. This strategy has been done by using the PI controller with pulse width modulation generator (DC-DC) as shown in Fig. 10 which is connected to the battery management system directly with two MOSFETs. The PWM parameters that were used in the simulation are; 10 kHz for switching frequency and 5 μS for sample time. Generally, the PI controller is a manual controller and it has been used to test the functionality of the system. By using a constant simulation block next to the PI controller, the input values are enforced as they are (−5, −25, −40, 0, 25) and it has been started from a minus part because of the battery in the charging mode.

Figure 10: The simulation of the current control strategy
Fig. 11 explains the current control strategy that has been applied to the system. The values entered into the PI controller move in red in the simulation, and when the red line changes depending on the input parameters, it is seen that the current value also changes, that is, the current direction will also change depending on the current control strategy. Fig. 12 explains the change of voltage values in the charging mode because the relationship between the current and the voltage is inverse. Therefore, the voltage values in the charging mode are decreased, and in the discharge mode, when the load fed by the battery and the current values are increasing, the voltage values also decrease.
ii. Voltage based control strategy: The voltage-based control strategy has been applied to the system to determine the reference battery current that needs to charge the battery and to show the eligibility for charging the battery SOC level to 100% [33,35]. Another PI controller has been used and applied to determine the reference battery current and it is connected with the previous PI controller. This means that the first PI will control the current and the second PI will control the voltage with respect to the maximum charging voltage of the battery. As shown in Fig. 13, the maximum charging voltage that is determined by the open circuit is 28.04 V and it is used as the input parameter for the voltage control PI.
iii. The load control: The load in any electrical device is considered an important part because it depends on the result of all electrical-electronic working parts of the device. The load of any system has a known range of voltage that should be fed by the converter of the electrical device without losses because it effects directly the device’s working and efficiency [21,33,34]. In this work, another PI controller has been used to control the load and-ensure it delivers the needed voltage to the load of the device. The minimum voltage that is assumed is 48 V in the discharge mode. Therefore, the load could be carried at a voltage between (48 to 220) volts DC, depending on the type of the device on the load. Moreover, to open and close the voltage gates between charge and discharge mods, a switch control has been designed and considered as a master switch for all parts of the battery control system to control the load voltage. The load control PI with the switch control is shown in Fig. 14 below.

Figure 11: The change of the current value during current control strategy
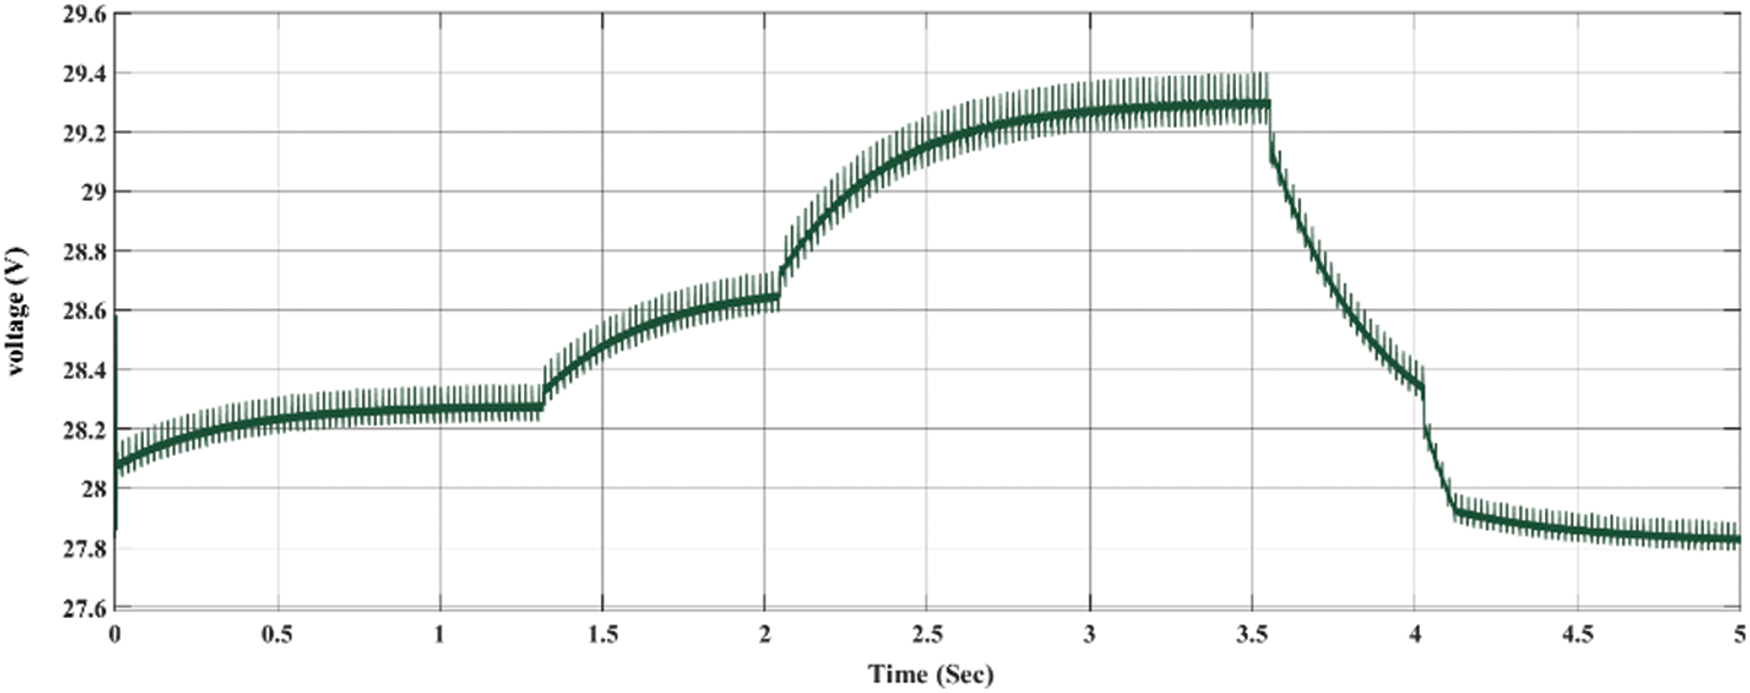
Figure 12: The change of the voltage value during current control strategy

Figure 13: The simulation of voltage control by using PI controller

Figure 14: The simulation of the load control PI with the switch control
8 The Battery Status Simulation and Results
Fig. 15 shows the simulation result of the voltage over the load in charging mode. As shown in Fig. 15a, the charge mode began from (0 to 5 s) depending on the input voltage source that feeds the load from the buck converter, which is the feed voltage overload in charge mode of approximately 180 V. Figs. 15b and 15c show a close look at the charge signal. As shown in the figure, the voltage signal has taken the shape of the half controlled rectifier and is supported by a PWM signal after being controlled by the buck converter to feed the load of the electric device directly.

Figure 15: (a) the voltage over load in charging mode, (b) the inner signal of the load voltage affected by the rectifier signal (zoomed in), (c) the internal structure of the load voltage affected with PWM signal wave (more zoomed in)
Fig. 16 shows the battery current in the charging mode as seen from (0 to 5 s) and how the current control strategy works to control the current in the charging mode. The maximum charging current as shown in Fig. 16a is about 22 A. Figs. 17b and 17c are a close look at the embedded wave signal of the half-connected rectifier on the current signal in charge mode, and they show how the current signal is affected by the PWM of the buck converter.

Figure 16: (a) the battery current in charging mode, (b) the inner signal of the battery current affected by the rectifier signal (zoomed in), (c) the internal structure of battery current affected with PWM signal wave (more zoomed in)

Figure 17: (a) the battery voltage in charging mode, (b) the inner signal of the battery voltage in charge mode affected by the rectifier signal (zoomed in), (c) the internal structure of the battery voltage in charge mode affected with PWM signal wave (more zoomed in)
Fig. 17 shows the battery charging voltage. As seen in Fig. 17a, the maximum charging voltage that feeds the battery in charging mode is about 26.35 V. It comes directly from the source through the buck converter and is controlled via the bidirectional DC/DC converter. Figs. 17b and 17c are described as the embedded wave signal of the charging voltage affected by the PWM of the buck converter.
Fig. 18a explains the battery situation in discharge mode. As seen, the simulation of the discharge mode has started from the second 5 to the second 10 of the simulation. It shows the maximum DC voltage over the load is about 120 V. Figs. 18b and 18c show a close look at the embedded wave signal of voltage supported by PWM only through the buck converter.

Figure 18: (a) the voltage over load in discharging mode, (b) the inner signal of the load voltage affected by the rectifier signal (zoomed in), (c) the internal structure of the load voltage affected with PWM signal wave (more zoomed in)
Fig. 19a shows the battery current that supports the load in discharge mod. This part describes the maximum current at discharge mode and it is about 3 A as shown in the 5th second of the simulation. The red line, as described before, is pointing to the battery current status for changing situations in charging mode. In discharge mode, the battery storage has been used to feed the load, and the red line has stopped at zero in the fifth second of the simulation. By the end of the working time, the current value decreases gradually to reach the red line at zero value when the battery storage runs out. Therefore, the blue line that points to the battery current value has been increased on the positive side, which means the battery control is working well and stable to feed the load with the maximum current. Figs. 19b and 19c are a close look at the embedded wave signal of the current in discharge mode supported by the PWM signal.
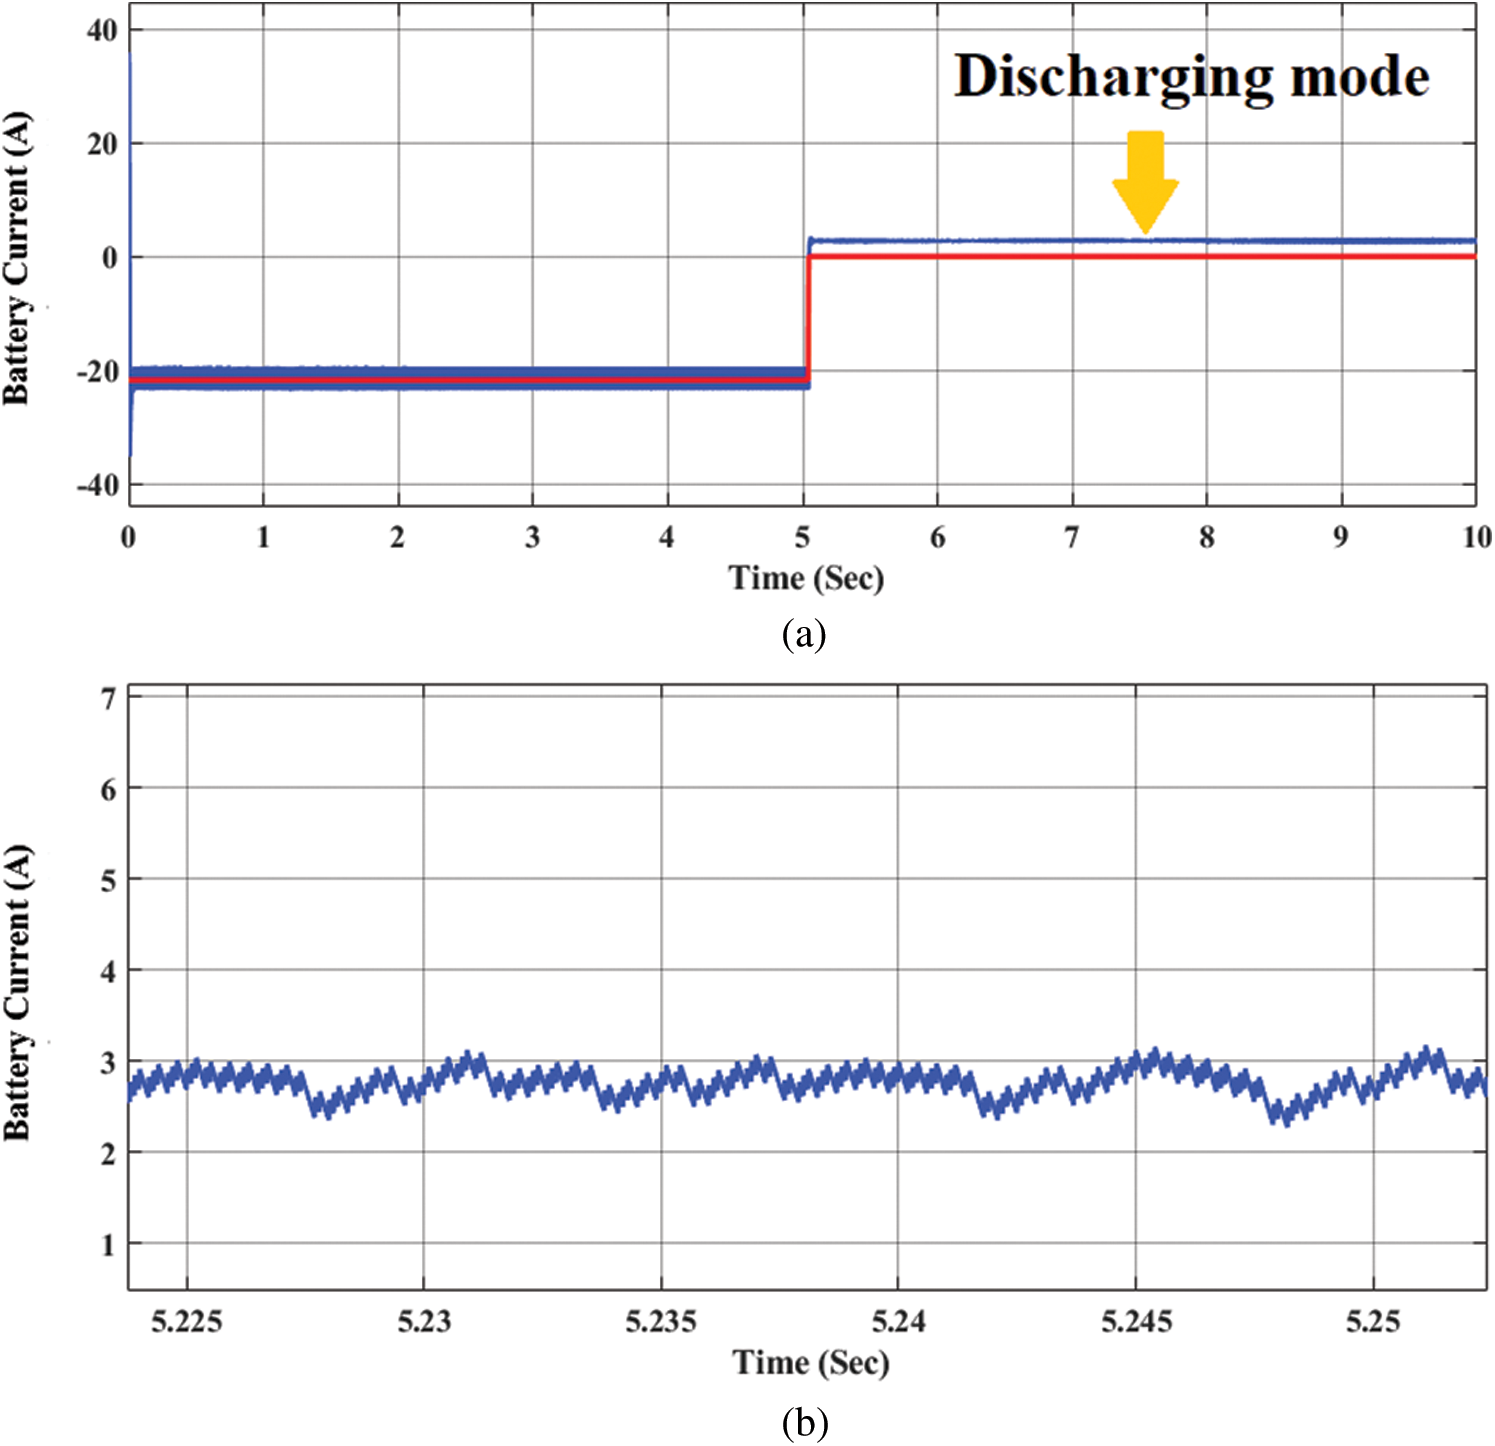

Figure 19: (a) The battery current in discharge mode, (b) Close look of the battery current in discharge mode, (c) Close look of the battery current signal supported with PWM signal in discharge mode
Fig. 20a shows the battery voltage value in the discharge mode. As shown in Fig. 20a, the voltage curve changed from the charge mode to the discharge mode at the fifth second of the simulation. The voltage value of the battery has been decreased from 26.35 V in charging mode to 25.95 V in discharge mode as shown between seconds (5 and 6) of the simulation time. Figs. 20b and 20c are described as the embedded wave signal of the battery voltage in discharge mode. Fig. 20b shows the decrease in the voltage value by the simulation time systematically until it reaches the zero value when the battery storage will run out. Hence, the maximum voltage of the battery that supports the load is 25.9 V.


Figure 20: (a) the battery voltage in discharging mode, (b) the inner signal of the battery voltage in discharging mode and displays a decrease of voltage levels (zoomed in), (c) the internal structure of the battery voltage in discharging mode affected with PWM signal wave (more zoomed in)
Fig. 21 explains the battery SOC level at both charge and discharge mode. When looking at the figure and making a time comparison between the charging and discharging modes, we will note that the charging mode has started from zero-second at the beginning of the simulation to the second five and the discharge mode has started from the second five to the second tenth of the simulation time, assuming that battery SOC level is 80%. Therefore, the battery charge is faster than the discharge mode; it reaches 80.06% in 5 s only. While in discharging mode, the battery evacuates its charge from 80.06% to 80.05% in the fifth second of the simulation time. This result shows the activity of the battery control system, which uses the PI controller connected to the bidirectional DC/DC converter and the PWM on the buck converter to control the charging and discharging modes of the battery.
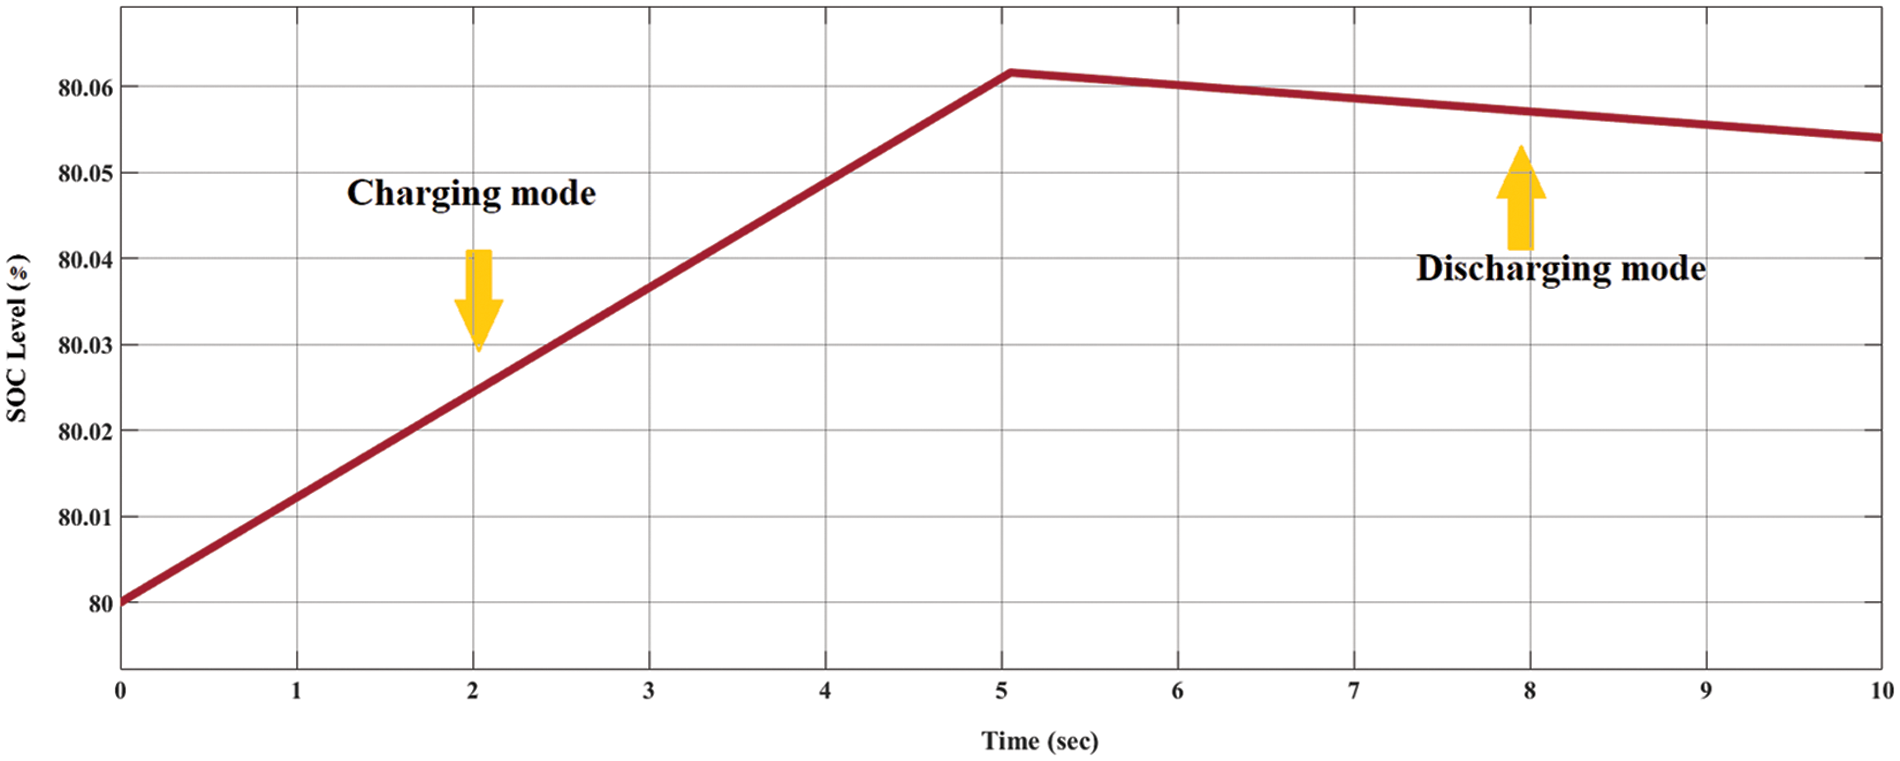
Figure 21: The SOC levels for charging and discharging modes
In this study, the analysis and simulations of all components of a battery control system were carried out separately, and the parameters affecting the system efficiency were determined. The previous methods in the literature to improve efficiency, such as Pulse Width Modulation (PWM), the digital controller provides the capability to implement a flexible control algorithm. In the digital controller, the nonlinear PI function with trial and error method power coefficients, which can be easily applied to irregularities much faster than the conventional method and has a lower steady-state error, is preferred. In the charge mode, the battery can be affected by two signals that are the half-controlled rectifier and the PWM signal. Therefore, the battery will be powered up in a short time. In the discharge mode, the battery output will also support the rectifier signal by the PWM signal, but it will be a lower amplitude and frequency from the charging mode status. Therefore, the power will be discharged in an ideal long time, and the reason for supporting the output signal of the battery via the rectifier signal even if there is no input power source is that the full system is working with a close loop. Hence, each circuit support feeds the other.
Funding Statement: The authors received no specific funding for this study.
Conflicts of Interest: The authors declare that they have no conflicts of interest to report regarding the present study.
References
1. Pucker-Singer, J., Aichberger, C., Zupancic, J., Neumann, C., Bird, D. N. et al. (2021). Greenhouse gas emissions of stationary battery installations in Two renewable energy projects. Sustainability, 13(11), 1–19. DOI 10.3390/su13116330. [Google Scholar] [CrossRef]
2. Haxhiu, A., Kyyrä, J., Chan, R., Kanerva, S. (2021). The variable DC approach in fuel cell and battery powered marine power systems: Control of the fuel cell power converter. International Journal of Electrical and Computer Engineering Research, 1(2), 13–21. DOI 10.53375/ijecer.2021.33. [Google Scholar] [CrossRef]
3. Ondrejka, P., Kemeny, M., Dubina, M., Novak, P., Hotovy, I. et al. (2021). Supercapacitors and energy conversion structures based on WS2 and MoS2 disulfides. Journal of Electrical Engineering, 72(4), 256–261. DOI 10.2478/jee-2021-0035. [Google Scholar] [CrossRef]
4. Roy, P., He, J., Liao, Y. (2020). Cost minimization of battery-supercapacitor hybrid energy storage for hourly dispatching wind-solar hybrid power system. IEEE Access, 8, 210099–210115. DOI 10.1109/Access.6287639. [Google Scholar] [CrossRef]
5. Hamanah, V. M., Abido, M. A., Alhems, L. M. (2020). Optimum sizing of hybrid PV, wind, battery and diesel system using lightning search algorithm. Arabian Journal for Science and Engineering, 45, 1871–1883. DOI 10.1007/s13369-019-04292-w. [Google Scholar] [CrossRef]
6. Wu, X., Zhao, W., Wang, X., Li, H. (2021). An MILP-based planning model of a photovoltaic/Diesel/Battery stand-alone microgrid considering the reliability. IEEE Transactions on Smart Grid, 12(5), 3809–3818. DOI 10.1109/TSG.2021.3084935. [Google Scholar] [CrossRef]
7. Cui, Z., Dai, J., Sun, J., Li, D., Wang, L. et al. (2022). Hybrid methods using neural network and kalman filter for the state of charge estimation of lithium-ion battery. Mathematical Problems in Engineering, 2022, 1–11. DOI 10.1155/2022/9616124. [Google Scholar] [CrossRef]
8. Li, Q., Li, D., Zhao, K., Wang, L., Wang, K. (2022). State of health estimation of lithium-ion battery based on improved ant lion optimization and support vector regression. Journal of Energy Storage, 50, 1–9. DOI 10.1016/j.est.2022.104215. [Google Scholar] [CrossRef]
9. Lawder, M. T., Suthar, B., Northrop, P. W. C., De, S., Hoff, C. M. et al. (2014). Battery energy storage system (BESS) and battery management system (BMS) for grid-scale applications. Proceedings of the IEEE, 102(6), 1014–1030. DOI 10.1109/JPROC.2014.2317451. [Google Scholar] [CrossRef]
10. Chakroun, J., Hamam, H. (2018). General study for energy recovery from used batteries using fuzzy logic and PI controllers. International Journal of Intelligent Engineering Informatics, 6(3–4), 308–324. [Google Scholar]
11. Hemmati, R., Azizi, N. (2017). Advanced control strategy on battery storage system for energy management and bidirectional power control in electrical networks. Energy, 138, 520–528. DOI 10.1016/j.energy.2017.07.071. [Google Scholar] [CrossRef]
12. Zurfi, A., Zhang, J. (2016). Exploitation of battery energy storage in load frequency control-A literature survey. American Journal of Engineering and Applied Sciences, 9(4), 1173–1188. DOI 10.3844/ajeassp.2016.1173.1188. [Google Scholar] [CrossRef]
13. Liu, C., Li, D., Wang, L., Li, L., Wang, K. (2022). Strong robustness and high accuracy in predicting remaining useful life of supercapacitors. APL Materials, 10, 061106. DOI 10.1063/5.0092074. [Google Scholar] [CrossRef]
14. Fei, Z., Yang, F., Tsui, K. L., Li, L., Zhang, Z. (2021). Early prediction of battery lifetime via a machine learning based framework. Energy, 225, 120205. DOI 10.1016/j.energy.2021.120205. [Google Scholar] [CrossRef]
15. Geeta, Aspalli, M. S. (2020). Proportional resonant controller for semi converter three PhaseVSI Fed induction motor drive to enhance time response. International Conference on Power Electronics & IoT Applications in Renewable Energy and its Control (PARC), pp. 169–174. Mathura, India. [Google Scholar]
16. Alkhafaji, M. A., Uzun, Y. (2020). Design and speed control of SynRM using cascade PID controller with PSO algorithm. International Journal of Renewable Energy Development, 9(1), 69–76. DOI 10.14710/ijred.9.1.69-76. [Google Scholar] [CrossRef]
17. Khan, A. A., Lu, Y. W., Khan, U. A., Wang, L., Eberle, W. et al. (2020). Novel transformerless buck–Boost inverters without leakage current. IEEE Transactions on Industrial Electronics, 67(12), 10442–10454. DOI 10.1109/TIE.41. [Google Scholar] [CrossRef]
18. Kobaku, T., Jeyasenthil, R., Sahoo, S., Ramchand, R., Dragicevic, T. (2021). Quantitative feedback design-based robust PID control of voltage mode controlled DC-DC boost converter. IEEE Transactions on Circuits and Systems II: Express Briefs, 68(1), 286–290. DOI 10.1109/TCSII.8920. [Google Scholar] [CrossRef]
19. Suksri, T., Tunyasrirut, S. (2008). 2-DOF smith predictor control system design by root locus technique. 5th International Conference on Electrical Engineering/Electronics, Computer, Telecommunications and Information Technology, pp. 577–580. Krabi, Thailand. [Google Scholar]
20. Chen, X. X., Zeng, S. H. (2015). Vehicle roll stability analysis based on root locus. International Conference on Intelligent Transportation, Big Data & Smart City, pp. 977–980. Halong Bay, Vietnam. [Google Scholar]
21. Ayad, A., Karamanakos, P., Kennel, R. (2017). Direct model predictive current control strategy of quasi-Z-source inverters. IEEE Transactions on Power Electronics, 32(7), 5786–5801. DOI 10.1109/TPEL.2016.2610459. [Google Scholar] [CrossRef]
22. Mallik, A., Ding, W., Shi, C., Khaligh, A. (2017). Input voltage sensorless duty compensation control for a three-phase boost PFC converter. IEEE Transactions on Industry Applications, 53(2), 1527–1537. DOI 10.1109/TIA.2016.2626247. [Google Scholar] [CrossRef]
23. He, M., Xu, J. (2007). Nonlinear PID in digital controlled buck converters. Twenty-Second Annual IEEE Applied Power Electronics Conference and Exposition, pp. 1461–1465. Anaheim, CA, USA. [Google Scholar]
24. Khubalkar, S., Chopade, A., Junghare, A., Aware, M., Das, S. (2016). Design and realization of stand-alone digital fractional order PID controller for buck converter Fed DC motor. Circuits, Systems, and Signal Processing, 35, 2189–2211. DOI 10.1007/s00034-016-0262-2. [Google Scholar] [CrossRef]
25. Kobayashi, H., Kondo, K., Iannuzzi, D. (2018). A theoretical analysis on static characteristics of voltage based control method and current based control method for the wayside energy storage system in DC-electrified railway. International Power Electronics Conference, pp. 2527–2533. Niigata, Japan. [Google Scholar]
26. Singh, A. K., Jeyasankar, E., Das, P., Panda, S. K. (2017). A matrix-based nonisolated three-phase AC–DC rectifier with large step-down voltage gain. IEEE Transactions on Power Electronics, 32(6), 4796–4811. DOI 10.1109/TPEL.63. [Google Scholar] [CrossRef]
27. López, J., Seleme Jr., S. I., Donoso, P. F., Morais, L. M. F., Cortizo, P. C. et al. (2016). Digital control strategy for a buck converter operating as a battery charger for stand-alone photovoltaic systems. Solar Energy, 140, 171–187. DOI 10.1016/j.solener.2016.11.005. [Google Scholar] [CrossRef]
28. Cui, Z., Wang, L., Li, Q., Wang, K. (2022). A comprehensive review on the state of charge estimation for lithium-ion battery based on neural network. International Journal of Energy Research, 46(5), 5423–5440. DOI 10.1002/er.7545. [Google Scholar] [CrossRef]
29. Hu, X., Li, S. E., Yang, Y. (2016). Advanced machine learning approach for lithium-ion battery state estimation in electric vehicles. IEEE Transactions on Transportation Electrification, 2(2), 140–149. DOI 10.1109/TTE.6687316. [Google Scholar] [CrossRef]
30. Altaf, F., Egardt, B., Johannesson Mårdh, L. (2017). Load management of modular battery using model predictive control: Thermal and state-of-charge balancing. IEEE Transactions on Control Systems Technology, 25(1), 47–62. DOI 10.1109/TCST.2016.2547980. [Google Scholar] [CrossRef]
31. Premchand, M., Gudey, S. K. (2020). Electric vehicle operation modes with reactive power support using SMC in distribution generation. Journal of Energy Systems, 4(3), 96–120. [Google Scholar]
32. Xavier, L. S., Cupertino, A. F., de Resende, J. T., Mendes, V. F., Pereira, H. A. (2017). Adaptive current control strategy for harmonic compensation in single-phase solar inverters. Electric Power Systems Research, 142, 84–95. DOI 10.1016/j.epsr.2016.08.040. [Google Scholar] [CrossRef]
33. Vigneysh, T., Kumarappan, N. (2016). Autonomous operation and control of photovoltaic/solid oxide fuel cell/battery energy storage based microgrid using fuzzy logic controller. International Journal of Hydrogen Energy, 41(3), 1877–1891. DOI 10.1016/j.ijhydene.2015.11.022. [Google Scholar] [CrossRef]
34. Iqbal, M. T., Tariq, M., Ahmad, M. K., Arif, M. S. B. (2016). Modeling, analysis and control of buck converter and Z-source converter for photo voltaic emulator. 1st International Conference on Power Electronics, Intelligent Control and Energy Systems, pp. 1–6. Delhi, India. [Google Scholar]
35. Merai, M., Naouar, M. W., Slama-Belkhodja, I. (2018). An improved DC-link voltage control strategy for grid connected converters. IEEE Transactions on Power Electronics, 33(4), 3575–3582. DOI 10.1109/TPEL.2017.2707398. [Google Scholar] [CrossRef]
Cite This Article
 Copyright © 2023 The Author(s). Published by Tech Science Press.
This work is licensed under a Creative Commons Attribution 4.0 International License , which permits unrestricted use, distribution, and reproduction in any medium, provided the original work is properly cited.
 Downloads
 Citation Tools