
 Submit a Paper
 Propose a Special lssue
 Open Access
ARTICLE

Lightweight Design of Commercial Vehicle Cab Based on Fatigue Durability
1 School of Mechanical and Electrical Engineering, Guilin University of Electronic Technology, Guilin, 541004, China
2 Dongfeng Liuzhou Motor Co., Ltd., Liuzhou, 545005, China
* Corresponding Author: Shuilong He. Email:
(This article belongs to the Special Issue: AI and Machine Learning Modeling in Civil and Building Engineering)
Computer Modeling in Engineering & Sciences 2023, 136(1), 421-445. https://doi.org/10.32604/cmes.2023.024133
Received 25 May 2022; Accepted 23 August 2022; Issue published 05 January 2023
 View Full Text
 Download PDF
Abstract
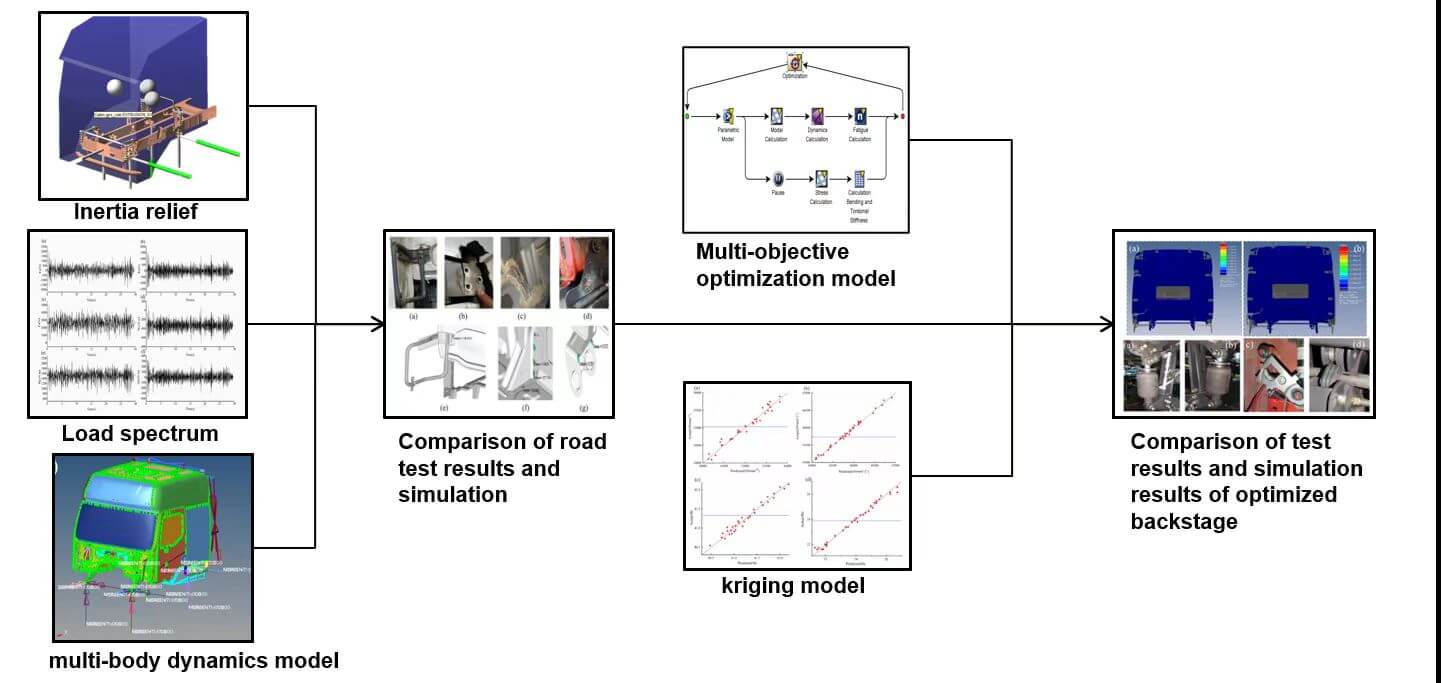
To better improve the lightweight and fatigue durability performance of the tractor cab, a multi-objective lightweight design of the cab was carried out in this study. First, the finite element model of the cab with counterweight loading was established and then confirmed by the physical testing, and use the inertial relief method to obtain stress distribution under unit load. The cab-frame rigid-flexible coupling multi-body dynamics model was built by Adams/car software. Taking the cab airbag mount displacement and acceleration signals acquired on the proving ground as the desired signals and obtaining the fatigue analysis load spectrum through Femfat-Lab virtual iteration. The fatigue simulation analysis is performed in nCode based on the Miner linear fatigue cumulative damage theory. Then, with the mass and fatigue damage values as the optimization objectives, the bending-torsional stiffness and first-order bending-torsional mode as constraints, the thickness variables are screed based on the sensitivity analysis. The experimental design was carried out using the Optimal Latin hypercube method, and the multi-objective optimal design of the cab was carried out using the Kriging approximation model fitting and particle swarm algorithm. The weight of the optimized cab is reduced by 7.8% on the basis of meeting the fatigue durability performance. Finally, a seven-axis road simulation test rig was designed to verify its fatigue durability. The results show the optimized cab can consider both lightweight and durability.Graphic Abstract
Keywords
Commercial vehicles are widely used in the transportation industry because of their transport distance, load capacity and fuel consumption [1]. However, because of the harsh working environment and complex working conditions, the fatigue failure problem is increasingly prominent. According to the research, fatigue damage accounts for 80% of vehicle structural failures. As one of the key assemblies of commercial vehicles, fatigue durability performance of the cab directly affects the health of drivers and passengers as well as transport safety [2]. At the same time, in the face of increasingly strict energy saving and environmental protection needs, the lightweight design of commercial vehicles is also imminent [3]. According to research by the World Aluminum Association, for every 10% decline in car mass, fuel consumption can reduce by 6% to 8% and exhaust emissions can reduce by 5% to 6% [4].
Durability and lightweight, as major topics in the field of automotive design, have been studied extensively by domestic and foreign scholars. Traditional fatigue durability studies usually rely on prototype vehicle road tests and bench tests [5]. However, the former is difficult to monitor the fatigue failure, and has limited guidance for design, while the latter needs customized tooling fixtures for different research objects, which has a long test preparation cycle and poor repeatability. In recent years, with the continuous maturity of CAE numerical simulation technology, especially the virtual simulation technology combining finite element analysis and multi-body dynamics has been widely used to develop automobile fatigue durability performance. Particularly in the development stage of new models, CAE simulation technology has the advantages of short cycle time and low cost compared with the vehicle test in calibrating structural strength and predicting fatigue life.
Fu et al. [6] set up the flexible body whole vehicle model, and created a potholed road through Adams/Car for virtual road simulation. The results show the simulation can accurately predict wheel travel, tire force and suspension load. This simulation method, also known as Virtual Proving Ground (VPG), can provide necessary data for vehicle structure development and part design, thus reducing the risk and cost in the later verification. To give full play to VPG technology advantages, Kang et al. [7] got the transfer function of the whole vehicle model under road excitation by calculating the axle head force, and the road excitation spectrum was obtained by iterating through designed algorithms. Then, the obtained spectrum is imported into VPG for whole-vehicle simulation analysis, to make up for the error of fatigue analysis result caused by the lack of tire modeling accuracy. Ryu [8] tried to reproduce the physical test process of the test field by Virtual Test Lab, and using the virtual iteration method to obtain the input load. In Pradeepak’s study [9], the acceleration signal collected on the test field was taken as the target signal, and RPC remote control system was adopted in the laboratory to get the axle head displacement by the virtual iteration, which was used to drive the physical bench for fatigue test, saving a lot of man-machine time and test cost. Achyut et al. [10] used Adams and FEMFAT-Lab to iterate the measured six-component force signal into the equivalent displacement of the wheel center, and then drove the multi-body dynamics model to extract the load spectrum of the suspension system. Generally speaking, the virtual simulation technology combining finite element and multi-body dynamics can describe almost all the complex loading processes of vehicles.
At present, the lightweight design of cabs usually takes the mass, strength or stiffness of the body-in-white as the optimization objective, and the multi-objective lightweight that comprehensively considers the performance indexes of the cab is fewer. The fatigue durability performance of a cab is a key indicator to assess its serviceability. It is clear that a single topology optimization or only using the approximate models for multi-objective optimization design cannot achieve a comprehensive improvement in structural performance. In the existing research, the multi-objective lightweight research considering fatigue life, especially the user’s road fatigue durability is relatively few. Based on the Topsis theory to screen variables, using a non-dominated ranking genetic algorithm to optimize the design parameters then improve the flexural stiffness, torsional stiffness and mass of the steel structure without reducing the low-order inherent frequency [11]. A method combining principal component analysis with modified particle swarm optimization algorithm (MPSO) was proposed for the multi-objective lightweight design of the b-column [12]. The results show that the b-column weight was reduced by 20.7% and the peak intrusion deformation improved by 23.5% and 41.7%, respectively, under the premise of peak impact velocity. Based on Kriging approximation model, experts have studied the anti-fatigue lightweight design of welded structures [13]. Although the proposed optimization method can achieve weight decline, other performance indexes are not completely guaranteed.
In this paper, the lightweight multi-objective optimization is carried out on the basis of ensuring the fatigue durability performance, considering the fatigue life constraint and integrating the mass and structural durability. Firstly, establishing the full interior cab finite element model and obtaining the results of their unit load stress field distribution by inertial release. Since the location of cab fatigue load excitation is located at the cab-frame connection, it cannot be collected directly through the installation equipment. In order to obtain an accurate load spectrum of cab fatigue life analysis, a fatigue analysis method combining measured road spectrum with virtual simulation was proposed. Based on the multi-body dynamics model, the fatigue load spectrum of the cab-frame connection point was extracted by virtual iteration with software co-simulation. Combined with the results of inertial stress distribution and material property parameters of the cab, fatigue simulation analysis was carried out in nCode. Then, the multi-objective lightweight design of the cab was carried out based on the Kriging approximate model. With the mass and fatigue damage values as the optimization objectives and the bending-torsional stiffness and first-order bending-torsional mode as the constraint conditions, established the mathematical model between the mass and fatigue damage values of the cab and the thickness of the key sheet metal parts. The optimal solution of design variables was determined by using the particle swarm optimization algorithm, and the performance indexes of cab structure before and after optimization were compared. Finally, use the cab bench test to verify the effectiveness of the lightweight scheme.
The remaining sections of this article are organized as follows: Section 2 introduces the data acquisition and processing of the test vehicle on the proving ground. In Section 3, the finite element model and the rigid-flexible coupling multi-body dynamic model of the cab are established. Section 4 mainly includes fatigue load spectrum extraction by virtual iteration and iterative accuracy checking. The fatigue simulation and experimental results are compared in Section 5. The multi-objective optimization of cab lightweight is carried out in Section 6 and finally, the effectiveness of the proposed optimization method is validated through a designed bench test. See Section 7 for the conclusion of this paper.
2 Signal Acquisition and Processing
The purpose of road spectrum acquisition is to get the response of the cabin and mount system under the strengthened road excitation on the test site. Then take it as the expected signal of virtual iteration, to get the fatigue load spectrum at the attachment points between cabin and frame.
A 6 × 4 drive domestic tractor was taken as the test vehicle. The front suspension was a leaf spring and the rear suspension was a combination of air bag shock absorption and leaf spring. The curb weight was 8.8 tons, and the full load weight was 45 tons. The road spectrum was collected at an automobile testing ground, and the collection procedure was formulated according to enterprise user-related test specification and the damage equivalence principle [14], as shown in Table 1.
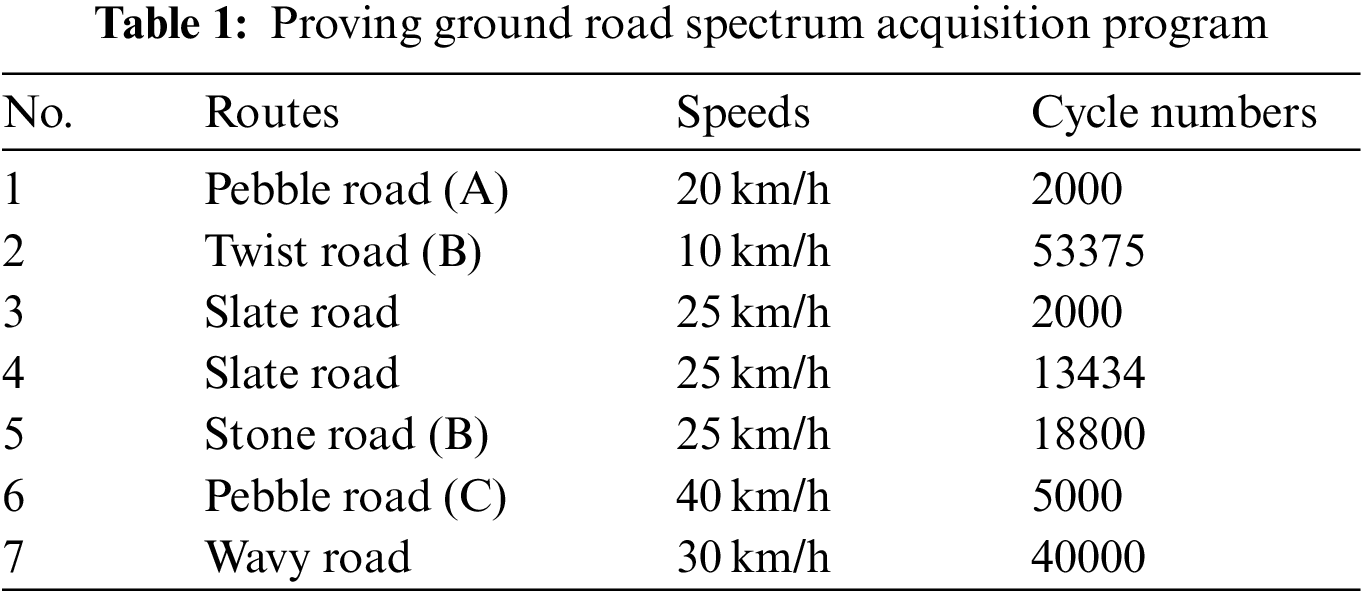
Adopting The HBM Somat EDAQ dynamic data collector to collect the road spectrum, according to the test specification, the sampling frequency was 512 Hz. The sensor layout diagram of the test prototype is shown in Fig. 1. Based on the Rossow sampling principle, each road condition was tested three times, and the most stable result of the three groups was selected as the expected signal of virtual iteration.
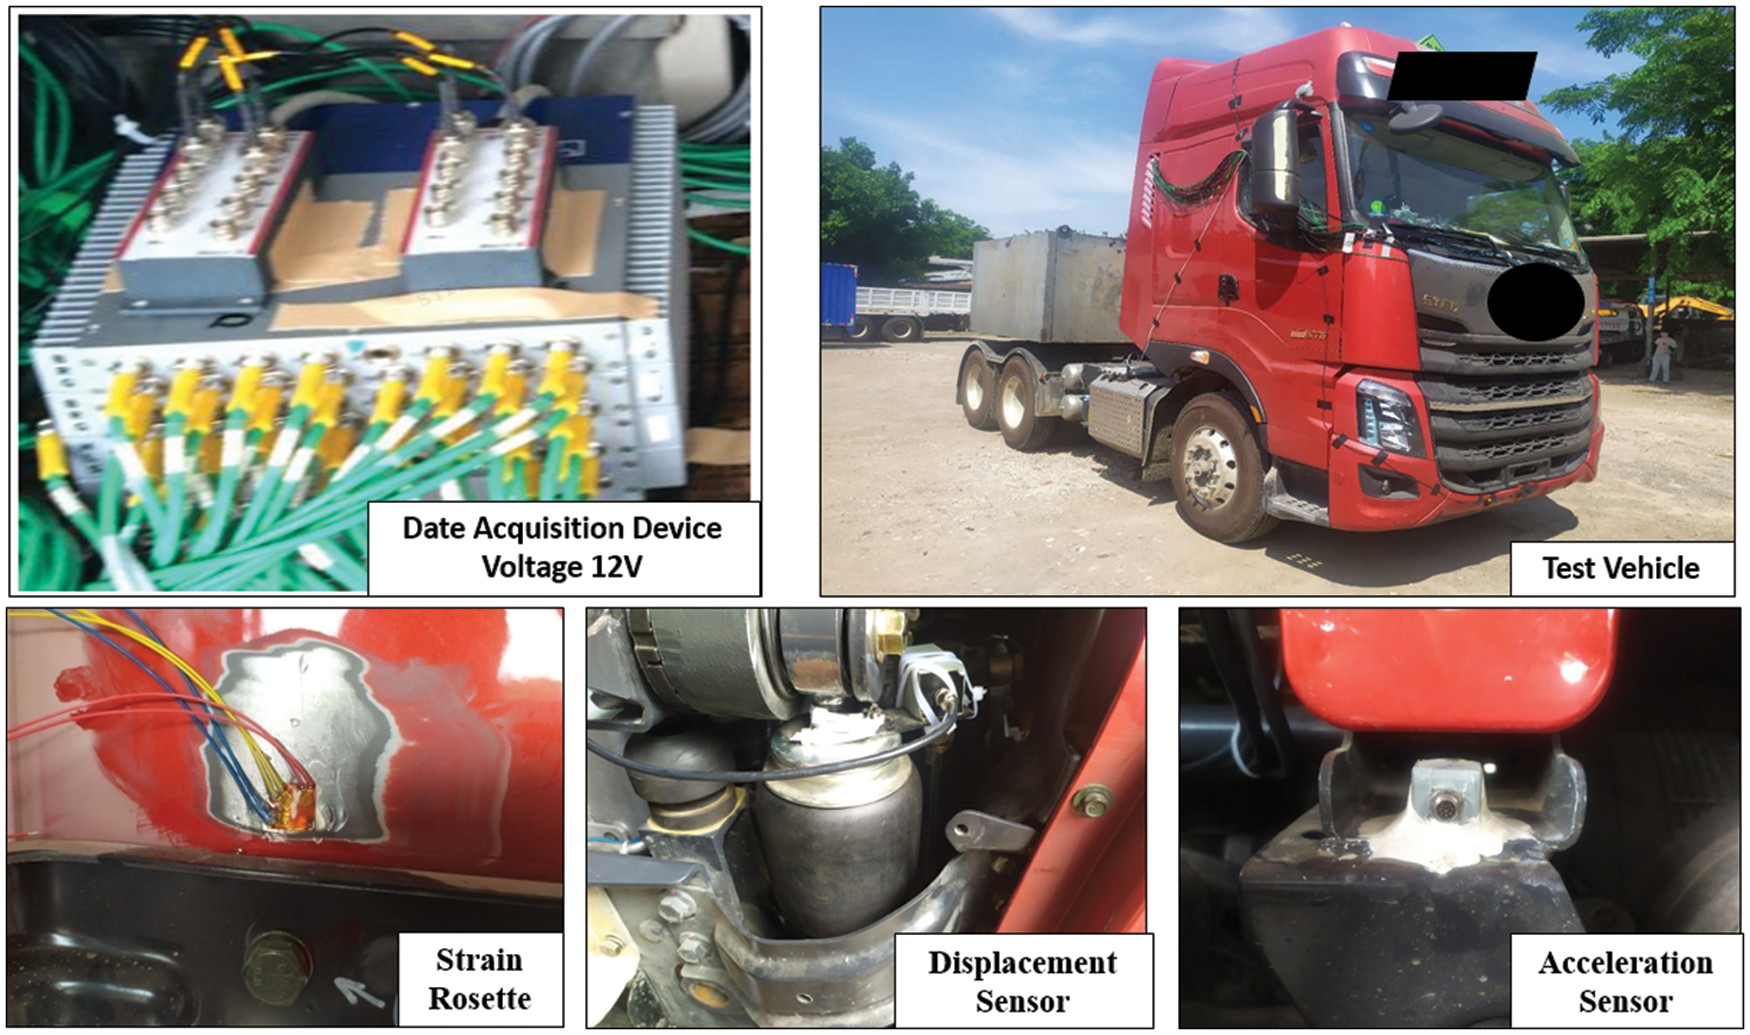
Figure 1: Sensor’s layout of the test vehicle
Because of the impact vibration of road roughness in the test site and the electromagnetic interference of vehicle related wiring harness, the signals collected at first cannot be directly used for virtual iteration, and corresponding signal processing is required [15]. The signal consistency check was carried out and maximum acceleration at the lower end of the airbag was around 10 g, which was in line with the expected extent, and the acceleration response distribution was consistent. The acceleration curve of the lower end of the cab airbag mount is shown in Fig. 2.
Figure 2: Airbag suspension acceleration comparison
Then, nCode software was used for data preprocessing. The frequency of road excitation in the test site affecting the fatigue of automobile parts was mainly concentrated in 0–50 Hz, and the other high frequency components were caused by noise during signal acquisition. Therefore, the measured signal was processed by low-pass filtering at 50 Hz to improve the signal to noise ratio. The PauTa Criterion was used to identify the measured signal singular values to avoid the influence of singular values on the accuracy of parts durability prediction.
Use the Trend Remove function in nCode software to remove data drift. The original data were resampled to reduce the number of data points and improve the efficiency of the fatigue test. Taking pebble road as an example, the test data after signal processing is shown in Fig. 3.
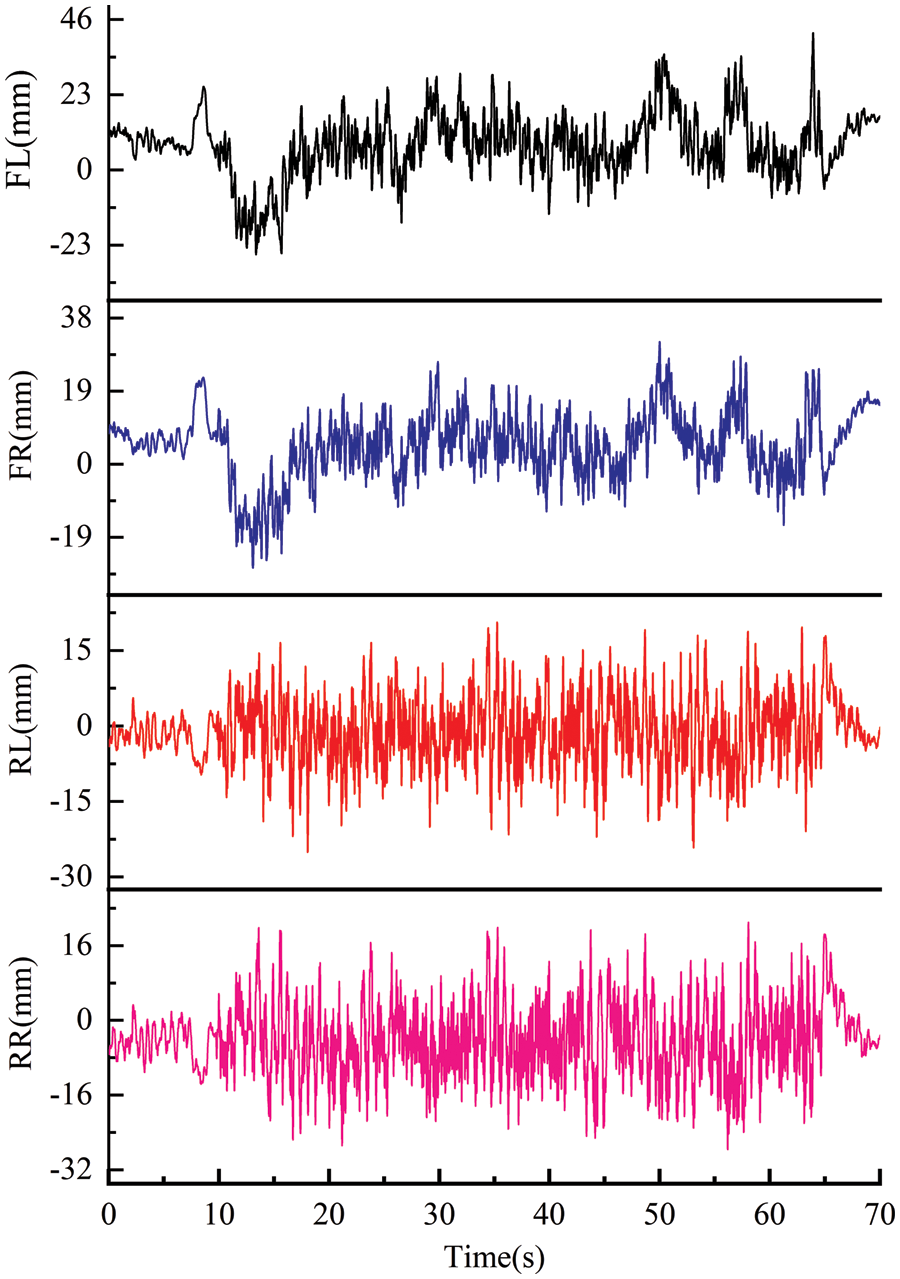
Figure 3: Airbag suspension displacement signal
3 Model Establishment and Verification
3.1 Finite Element Model (FEM)of Cab
The accuracy of the FEA model is the key to fatigue analysis. In order to simulate the fatigue endurance performance under full load conditions accurately, the weight of the passengers and luggage in the vehicle during the road test at the proving ground is fully considered. The model was loaded with 150 kg passenger weight and 40 kg luggage weight. The FEA model of the cab is established by the software called HyperMesh. The FEA model is mainly a quadrilateral shell element with 8 mm mesh size, the number of elements and nodes are 1927244 and 1441956, respectively. The ACM unit is used to simulate the welding spot of sheet metal parts, the diameter of the welding spot is 6 mm, and the number is 3221. Taking the rigid unit to simulate the bolt connection. Fig. 4 shows the full-interior FEA model of the cab.
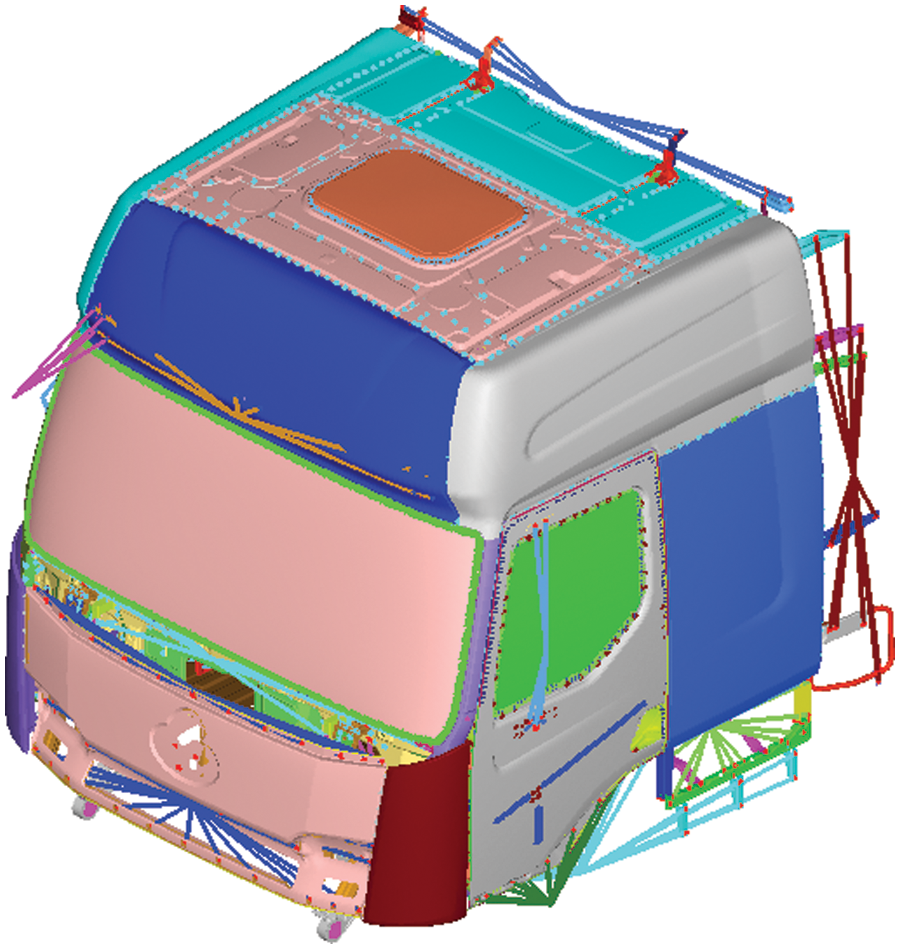
Figure 4: Finite element model of the cab
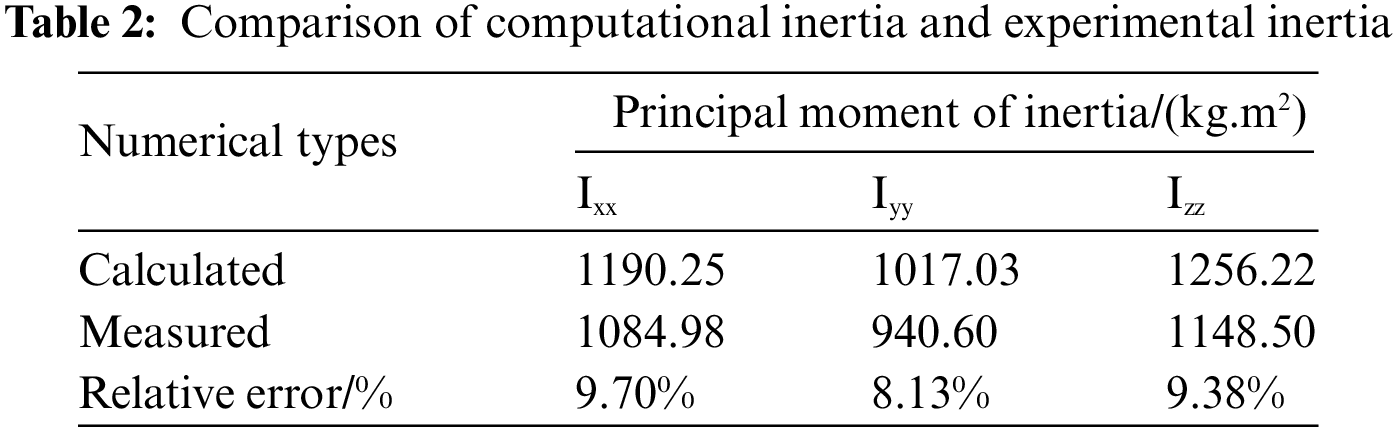
To verify the accuracy of the FEA model, the calculated values of centroid and moment of inertia are compared with those from the physical tests. The weight of the cab is 944 kg, and the centroid is located at (−325.43, 46.75, 1048.35 mm). The moment of inertia test bench is shown in Fig. 5. The relative error between the calculated value and the test value is within 10%, as shown in Table 2. The results show that the FEA model of cab meets the requirement of precision [16].
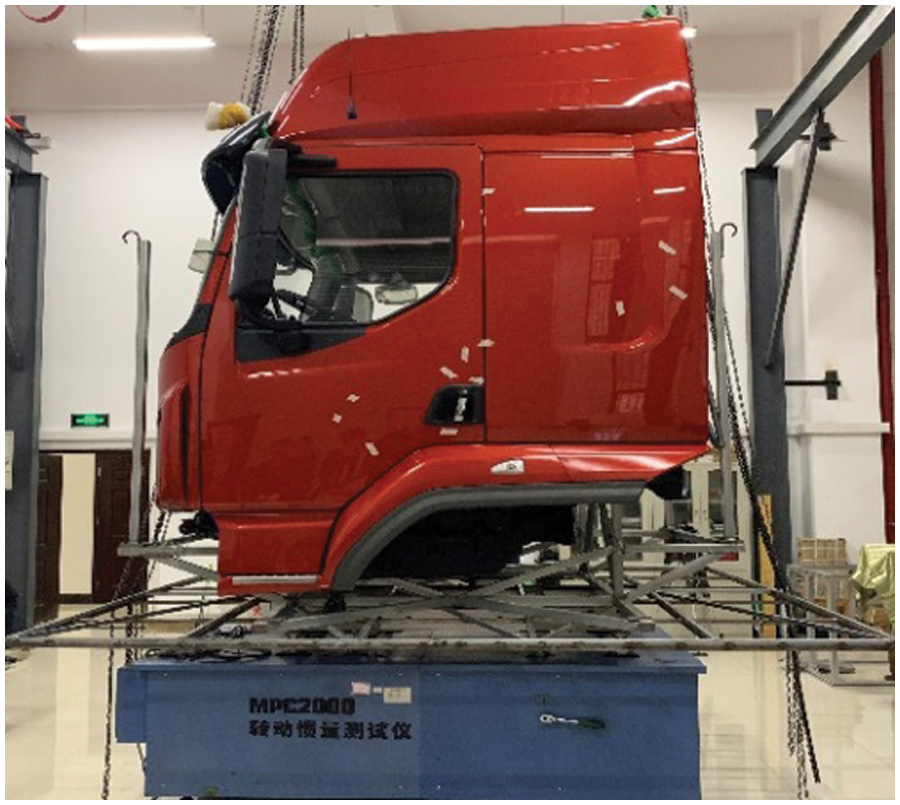
Figure 5: Momentum of inertia test bench test
During the transport of the tractor, the attachment points between the cab and mount system are under stress. To simplify the mechanical analysis of constraints and loading conditions, the inertia release method was proposed. The inertia release method [17] uses the inertia force to balance the external force, and imposes the virtual constraint consistent with the test vehicle state on the connection of the cab mounting point to ensure the balance. This method can eliminate the calculation error caused by the restraint point reaction force during in static analysis, and thus gain more correct calculation results. Under the action of external force, if the damping of structure is ignored, the balance equation of inertia release analysis is described as follows:
where F is the external load matrix of model nodes; M is a mass matrix of the model;
The X, Y and Z three-way unit forces and moments are applied at the connection between cab mount and frame, and the stress response is calculated by the Optistruct solver. The calculation formula of stress-time history is as follows [18]:
where
Specifically, X, Y, and Z unit force and unit moment are applied at the four mounting points of the cab. Each unit load is set as a working condition, a total of 24 load conditions. These unit load condition were established to correspond to the fatigue load spectrum channel of the virtual iteration. Inertial relief settings of the cab are shown in Fig. 6a, and solution results are presented in Fig. 6b.
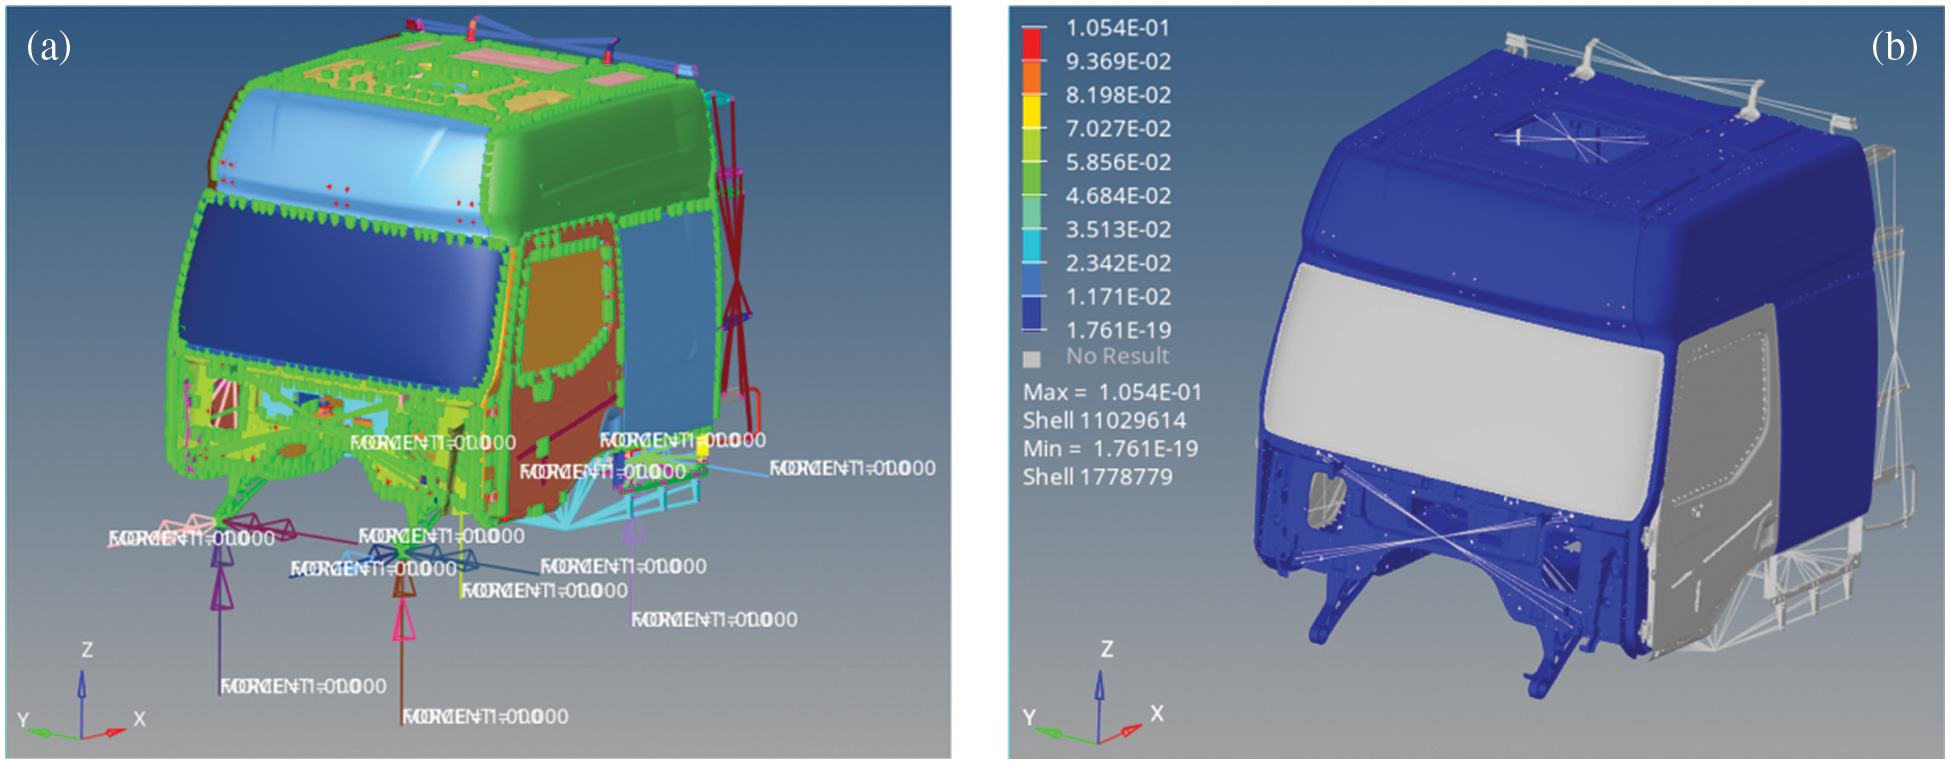
Figure 6: Inertia release of the cab: (a) Settings, and (b) Results
3.2 Rigid-Flexible Coupling Multi-Body Dynamics Model
According to the load transfer path, road excitation is transferred to the cab through the frame and rubber bushing. Under the road excitation of the proving ground, the front part of the frame connected with the airbag suspension has a great influence on the dynamic response of the cab.
Therefore, selecting the front half of the frame, and based on the Craig-Bampton modal synthesis method, a modal neutral file containing mass, node position and modal is obtained. It is then imported into Adams/Car software to make a flexible body frame model, which is then combined with the cab rigid body model in Adams/Car to generate a rigid-soft coupled multibody dynamics model for simulation analysis. In Adams, the dynamic differential equation of flexible body obtained based on the Lagrange equation can be expressed as [19]:
where M, K, D represent the flexible body mass matrix, modal stiffness matrix and modal damping matrix, respectively. ζ is the generalized coordinate vector; Q is the additional load vector; G is the gravity force; ψ is the constraint equation vector; λ is the Lagrange multiplier for the constraints.
For the purpose of the virtual iteration, four Z-directional displacement excitations were established at the frame leaf spring lugs and the coil lugs respectively, to simulate the vertical, pitch and roll force characteristics of the cab. An X-directional displacement excitation is established at the first cross member of the frame to simulate the longitudinal impact force characteristics of the cab, such as acceleration and braking. Two Y-directional displacement excitations are set on the same side of the frame to simulate the lateral and yaw force characteristics of the cab.
Seven spline curves are created and given displacement excitation by the AKISPI function. In addition, the output response signal should be established in the model consistent with the sensor installation position during the road test of the proving ground. The displacement signal established on the frame above is used as the excitation signal of iteration, and the airbag mounting displacement and its acceleration are used as the response signals. The cab-frame rigid-flexible coupled multi-body dynamics model is shown in Fig. 7.
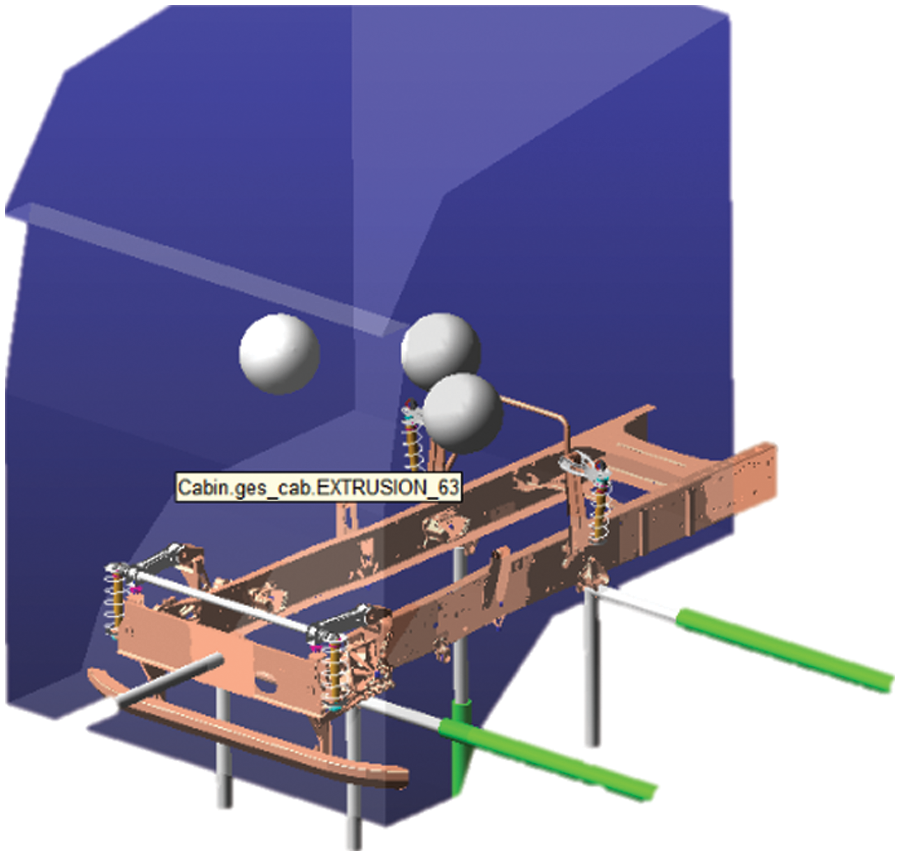
Figure 7: Rigid-flexible coupling multi-body dynamics model
The above channel settings are executed in Adams software, and the (*.adm) format file produced during the simulation process is invoked by Femfat-Lab software for co-simulation. The signals of cab mounting displacement and acceleration measured on the proving ground used as the iteration expectation signals, the random red, pink and white noise produced as the first excitation signal to start the virtual iteration.
Virtual iteration is to simulate a nonlinear system with linear transfer function by means of multi-body dynamics, and solve the external excitation through the known response of the structure [20]. The virtual iteration flow chart is shown in Fig. 8.
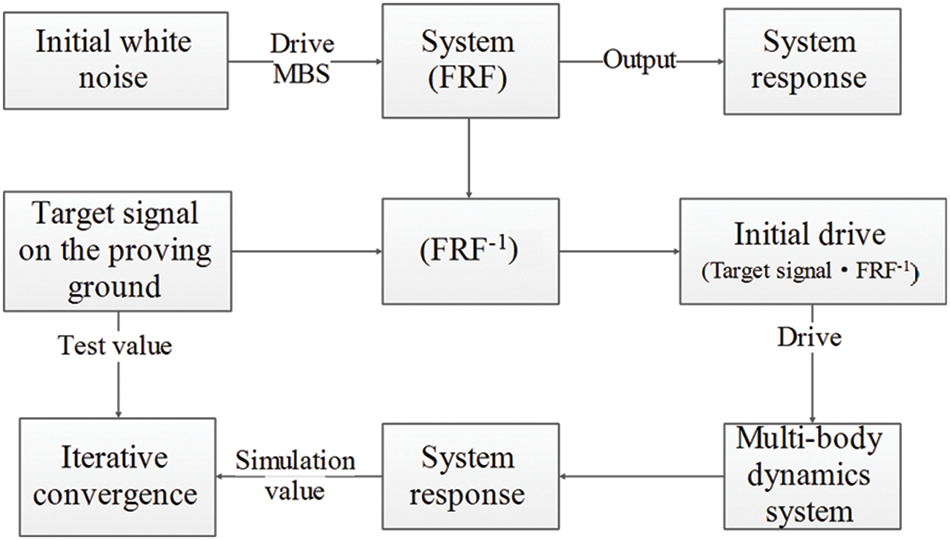
Figure 8: Virtual iteration schematic
Firstly, random white noise signal is generated to drive multi-body dynamics model, combined with the response signal of the corresponding channels, from which the frequency response transfer function of the system is derived.
where
According to the classical control theory, the external excitation can be calculated by the response signal on the proving ground and the frequency response transfer function of the system. However, the multi-body dynamic system is nonlinear and the transfer function is linear, there is an error between the external excitation calculated by inverse calculation and the actual load, so an iterative step is introduced to reduce the error.
In the formula: k is the correction. Driving the multi-body system with the initial excitation signal
where
The accuracy of the virtual iteration will directly affect the reliability of the fatigue load spectrum, and its accuracy can be judged from four aspects: relative damage value, time domain, frequency domain and amplitude domain [21]. The relative damage value refers to the approximate degree of fatigue damage caused by two different load spectra to the same structure.
By calculating the ratio of pseudo damage between the iterative signal and the measured signal, if the relative damage of each channel is close to 1, it shows that the iteration quality is high. It is believed that the relative damage value between 0.5∼2 basically meets the engineering requirements. The pebble road is taken as an example to illustrate the iteration results. The relative damage values of the simulated response and target response are shown in Fig. 9.
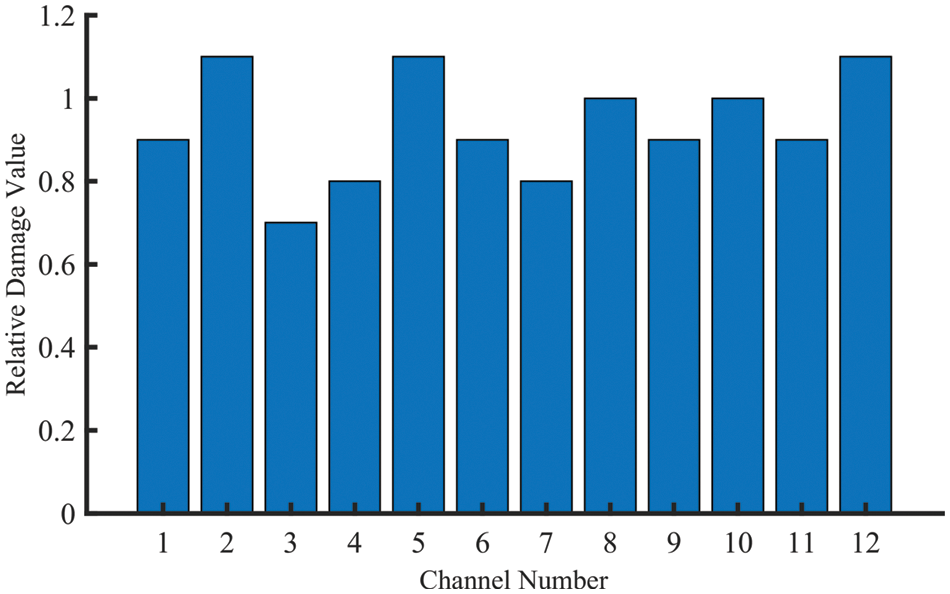
Figure 9: The relative damage value of each channel
In the time and frequency domain, the coincidence of curve trend and peak value between simulation value and test value is mainly studied. Time-domain simulation and test comparison of z-direction acceleration of left rear airbag suspension are shown in Fig. 10a, and the partial enlarged view is shown in Fig. 10b. From the amplitude and trend of the time-domain signal, it can be seen that simulation signal is in good agreement with the measured signal.
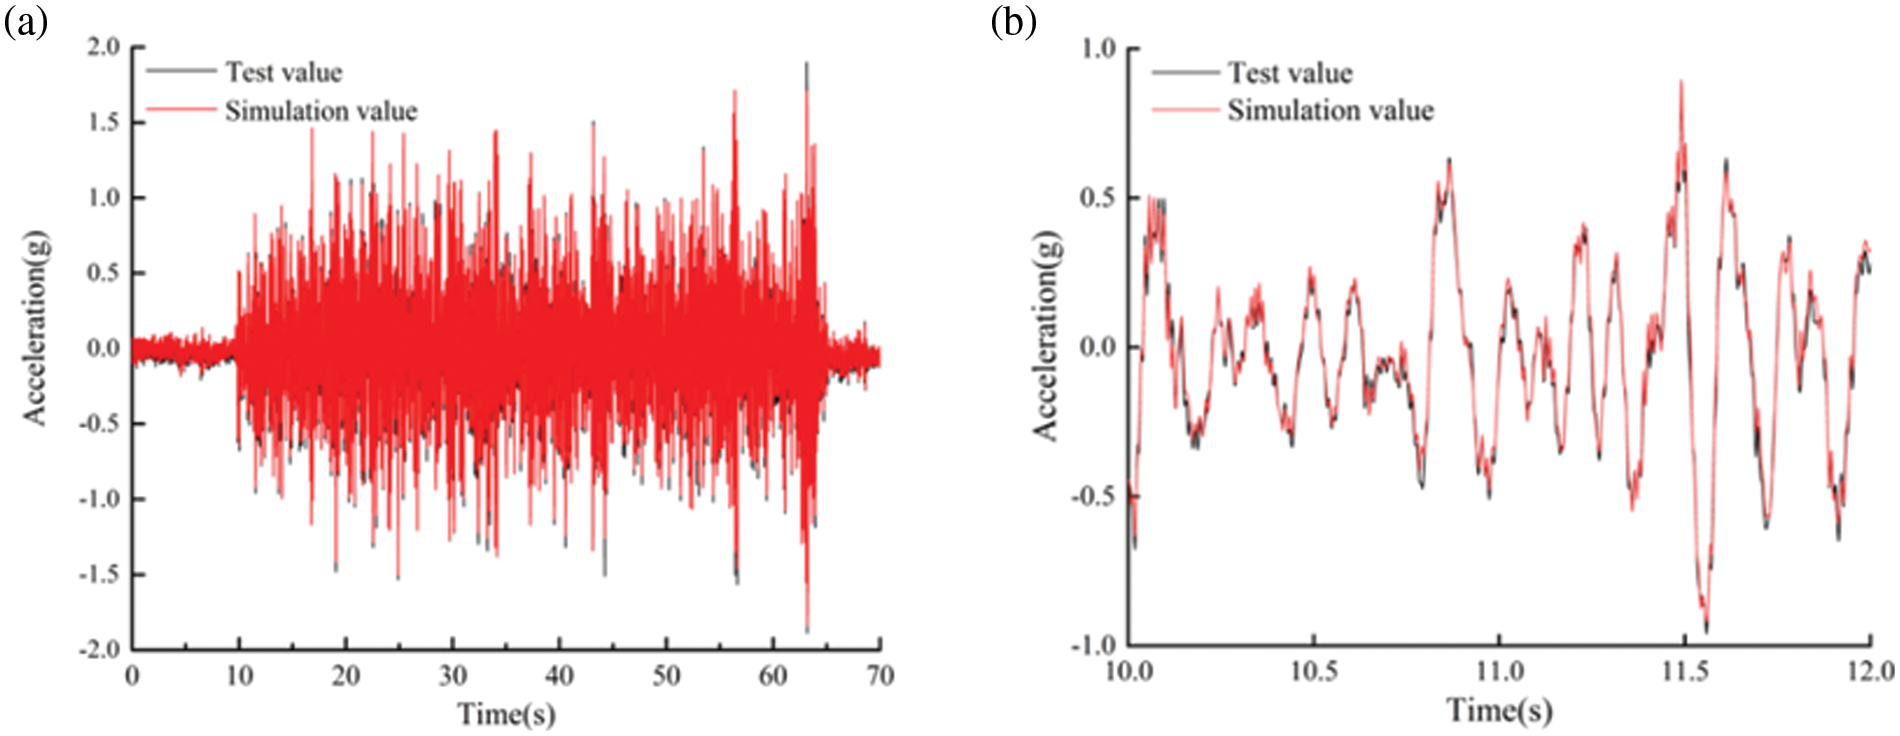
Figure 10: Comparison of time series curve. (a) Simulation and test comparison, (b) Enlarged view of the local area
The comparison of frequency domain curves is shown in Fig. 11. Under the impact of 0–40 Hz on the proving ground, the power spectral density energy distribution trend of the simulated signal and measured signal is consistent.
The evaluation of the amplitude domain is based on rain flow counting, and the shape of the rain flow matrix composed of amplitude and mean value is essentially the same. The comparison of rain flow distribution histogram, as shown in Fig. 12.
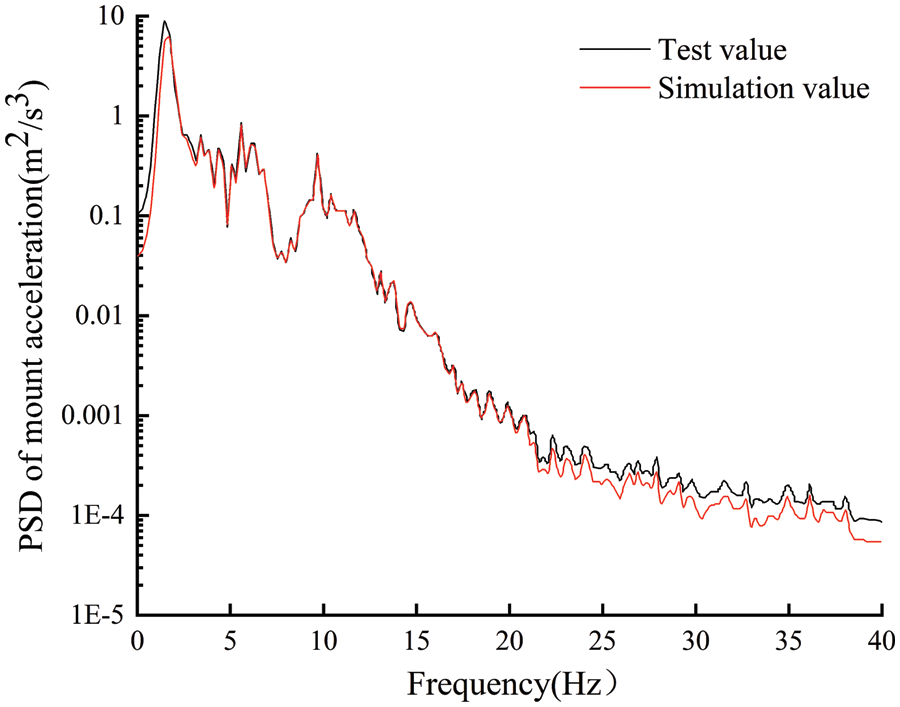
Figure 11: Comparison of frequency domain
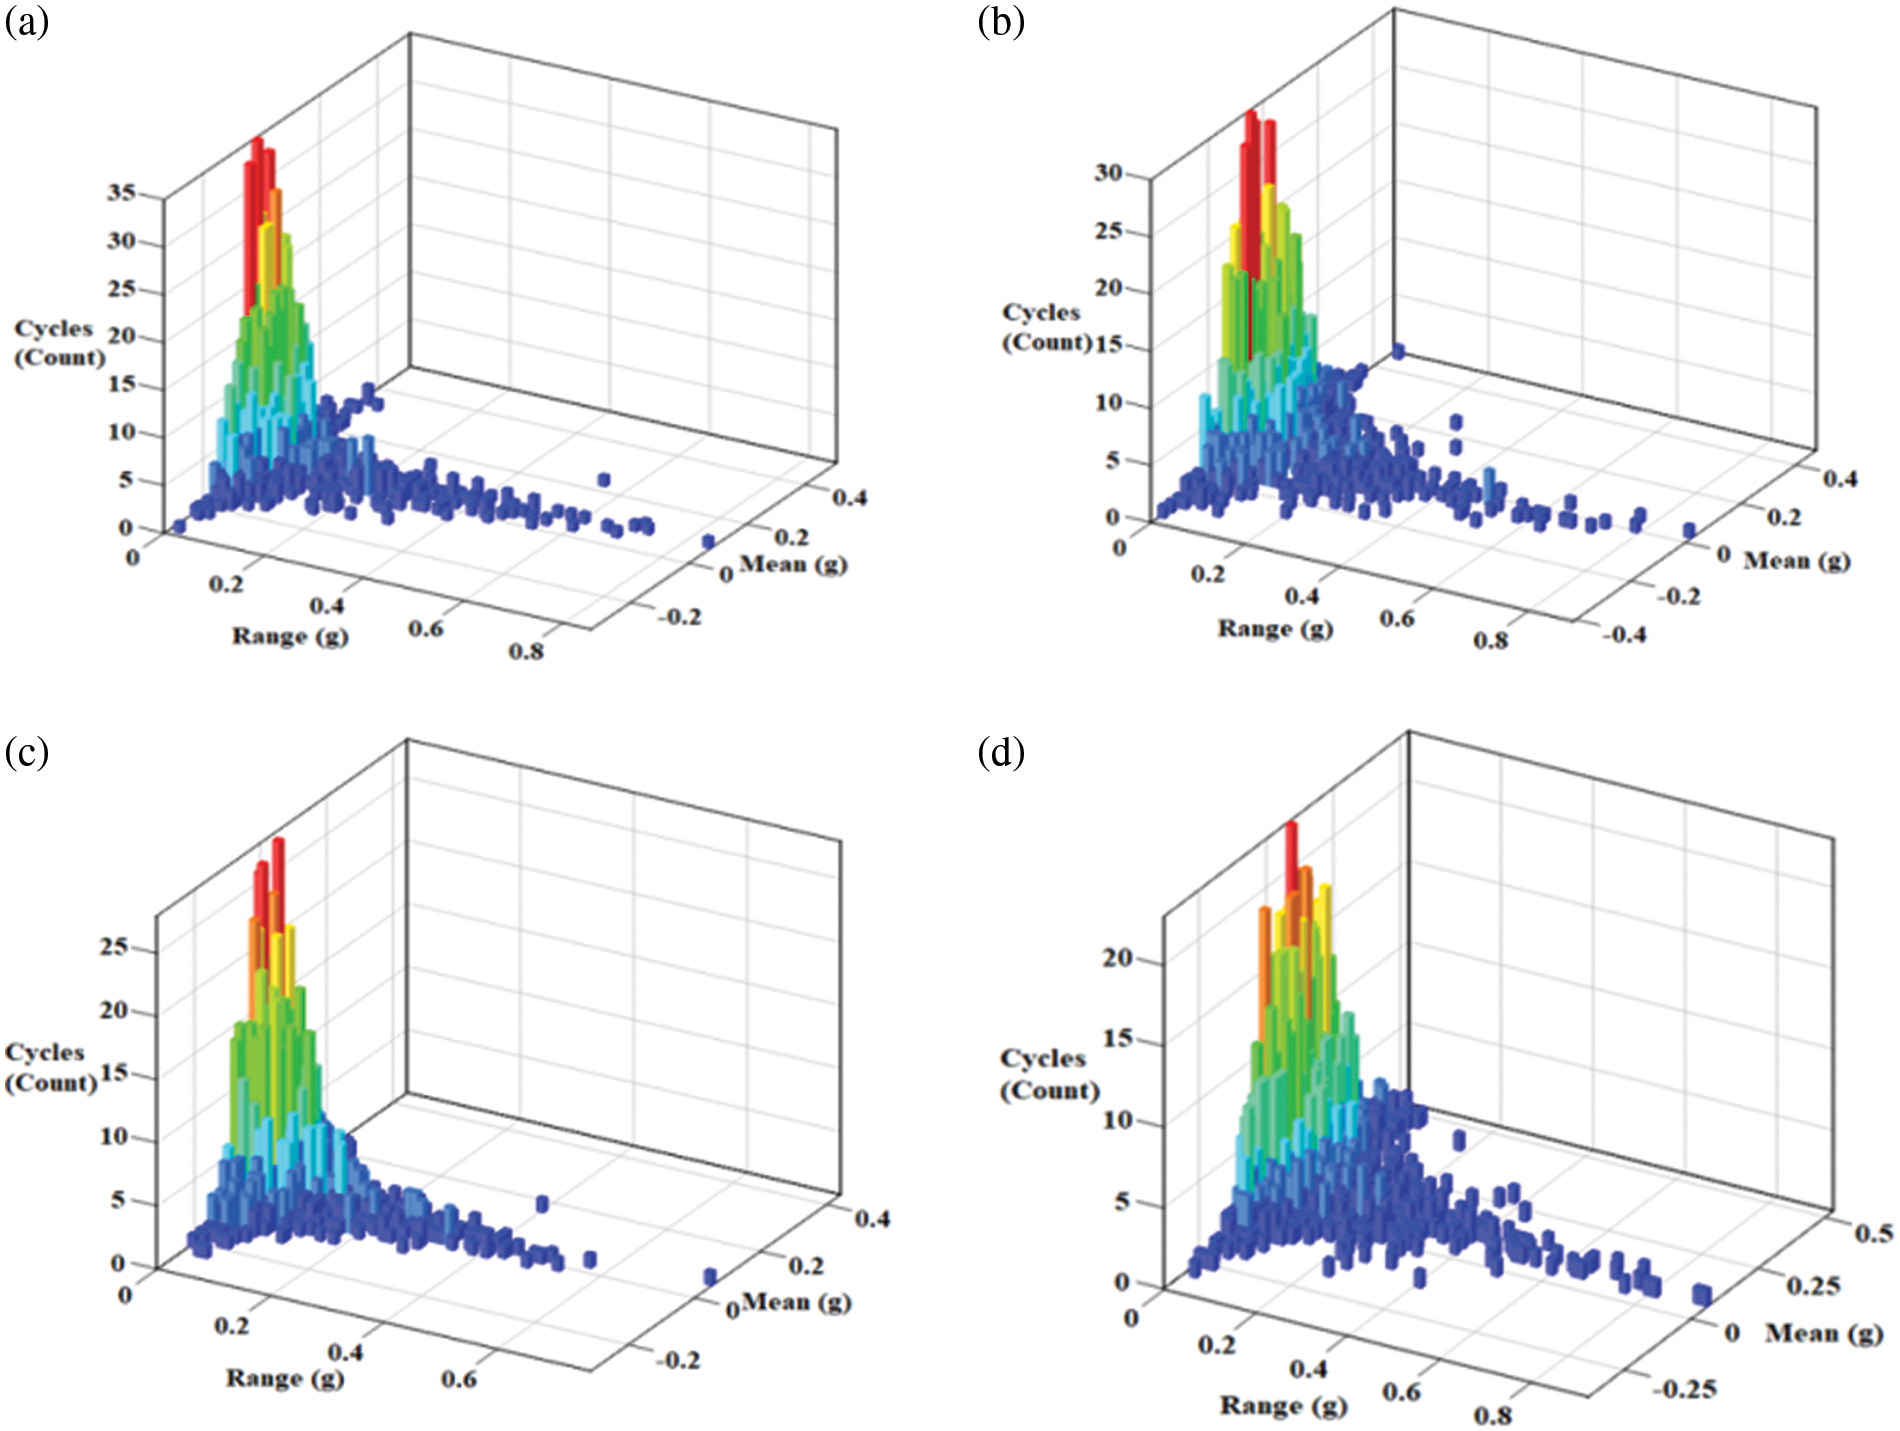
Figure 12: Rain flow distribution histogram: (a) Front airbag mounting test acceleration rain flow count, (b) Corresponding simulation acceleration rain flow count, (c) Rear airbag mounting acceleration rain flow counting, (d) Corresponding simulation acceleration rain flow count
In summary, the simulation signal is consistent with the test signal, which meets the requirements of iterative accuracy. That is, the equivalent displacement of iteration accurately simulates the impact of road surface and reproduces the real force status of the vehicle. For reasons of content, it is only displaying the fatigue load spectrum of part roads. Fig. 13 shows the load spectrum of the cabin left front mount on Pebble Road (C). The fatigue load spectrum in the .rsp format of each road is combined according to the cycle times of the road test program. Subsequently, the combined load spectrum in the .dcy format will be used for fatigue analysis.
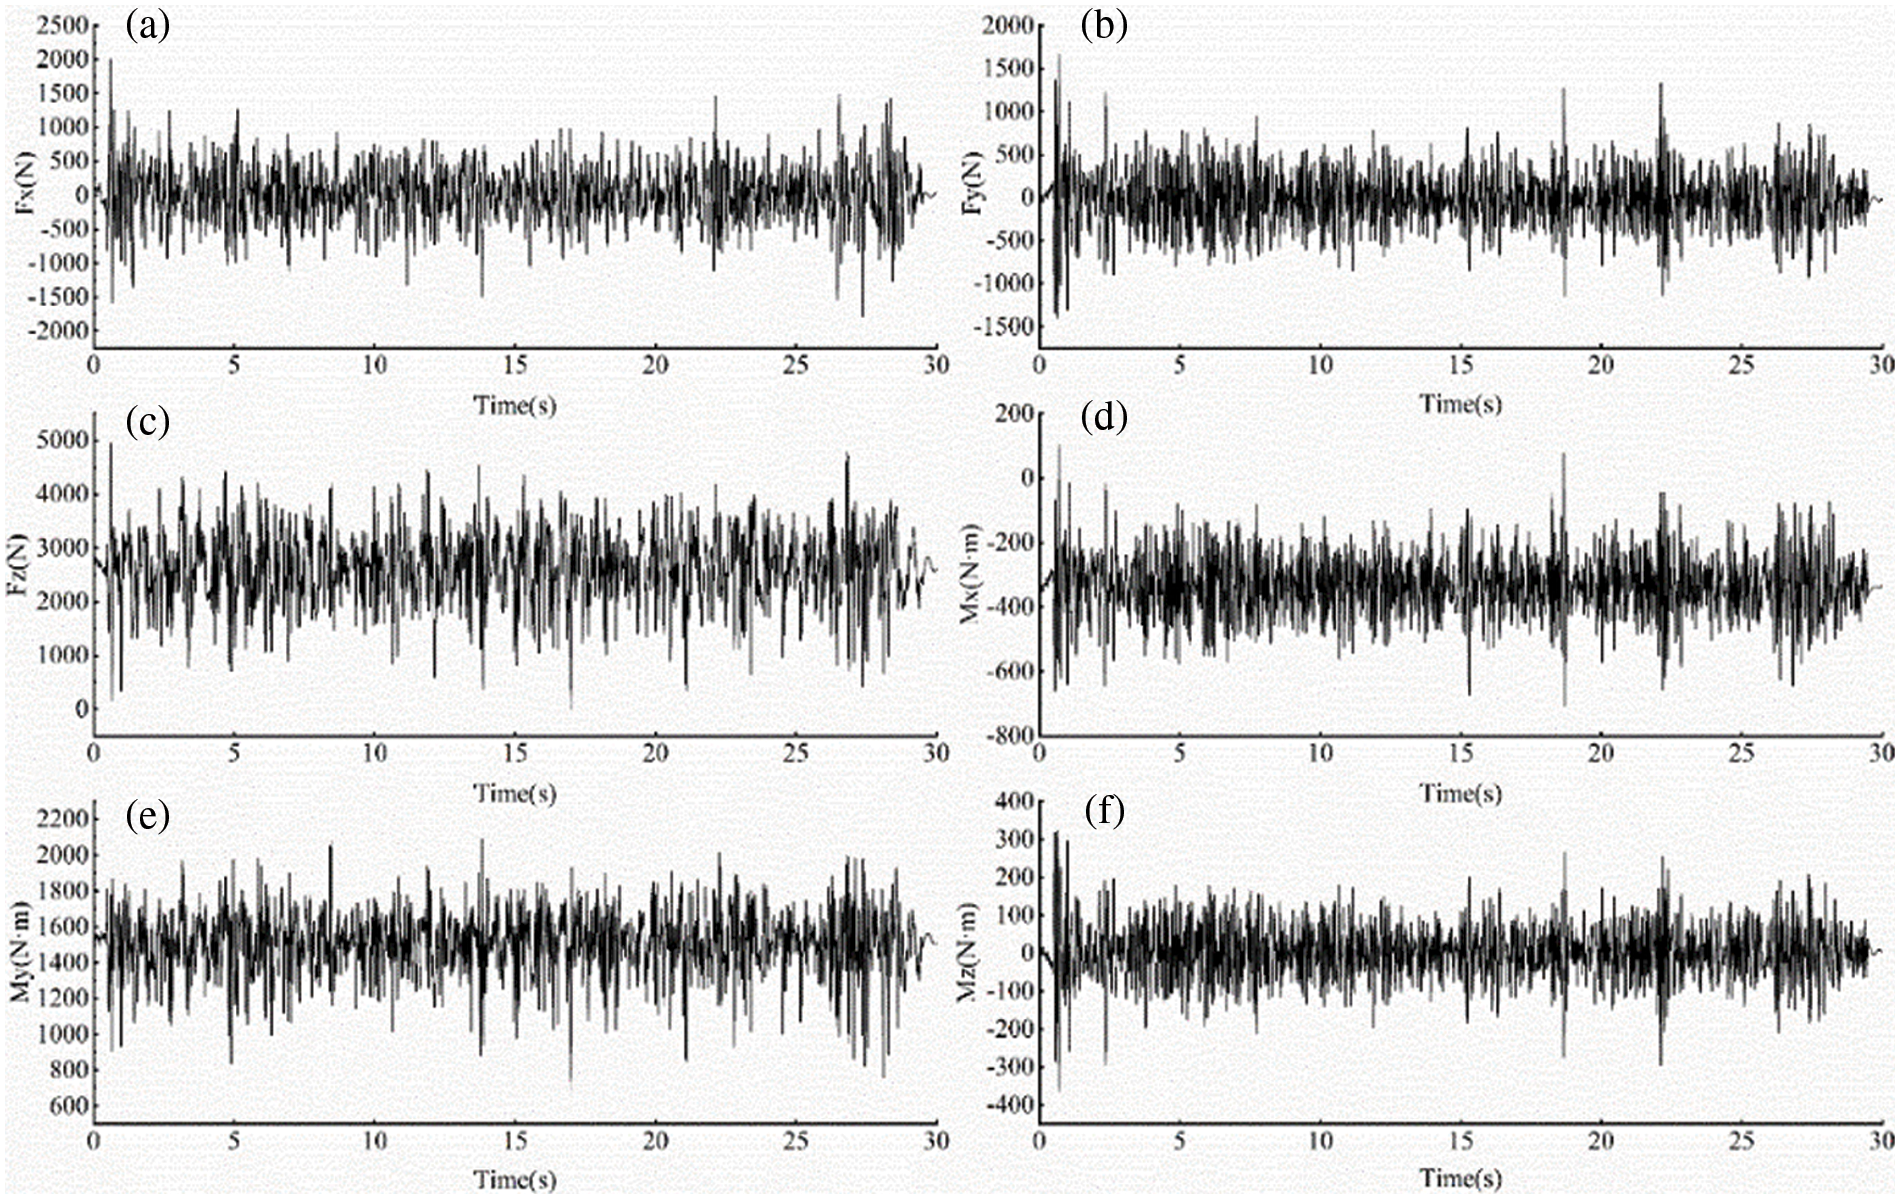
Figure 13: Load spectrum of left front suspension: (a) Longitudinal force, (b) Lateral force, (c) Vertical force (d) Rolling moment, (e) Pitching moment, (f) Yawing moment
The cab of a commercial vehicle is mainly composed of thin sheet metal components, which bear the alternating load of the road during transportation. When fatigue failure occurs, it includes not only elastic strain but also plastic strain, so adopting the stress-strain fatigue analysis method. The stress-strain method is based on the rain flow counting method, which was developed from Coffin-Manson theory for fatigue life prediction of systems under uniaxial loading [22,23]. The relationship between the total strain of materials and fatigue life is:
where
However, Coffin-Manson is only applicable to material strain under uniaxial load. In multi-axial load, the function needs to be equivalently processed according to the fourth strength theory. The total strain εqa after processing is expressed as [24]:
where
The equivalent total strain
By integrating the above equations, the relationship between the strain and fatigue life of a component can be modified as [25]:
When the stress amplitude of the structure is
According to the linear superposition criterion, it can be seen that the total damage under the action of the above stress amplitude can be expressed as [26]:
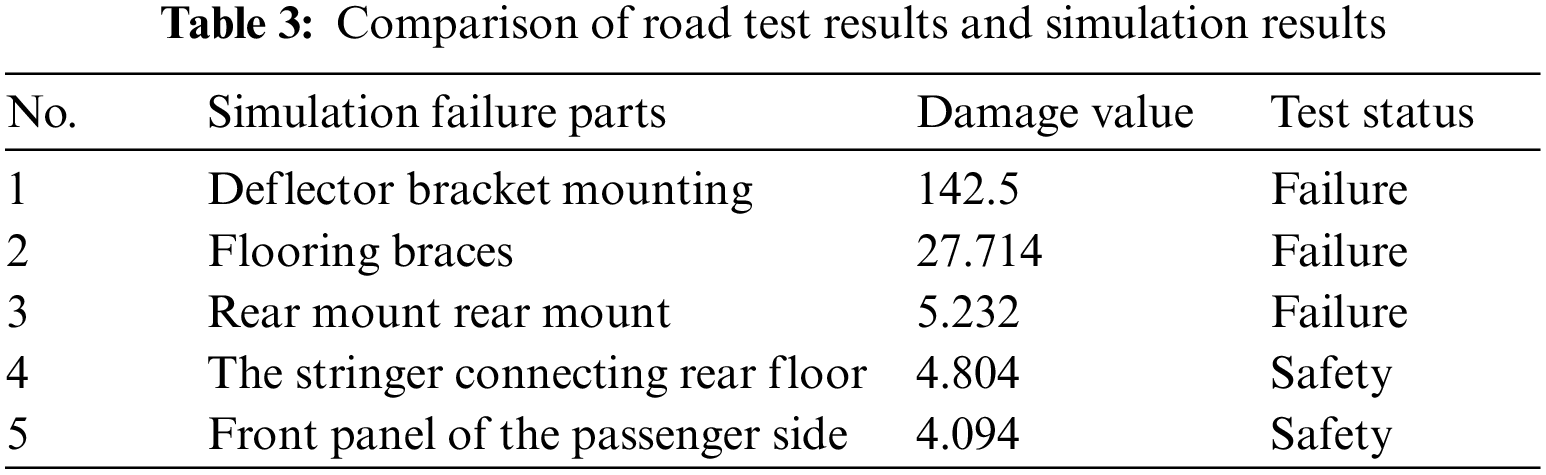
Once the total damage value D increases to 1, the structure will occur fatigue failure [27]. Combined with the fatigue load spectrum, stress analysis result under unit load and material ε-N curve, a simulation block was built in nCode for fatigue calculation, as shown in Fig. 14. Compared with the endurance road test results, to verify the authenticity of the simulation results, as shown in Table 3. The results show that the simulation failure part is basically consistent with the road test, indicating the proposed method is reliable.
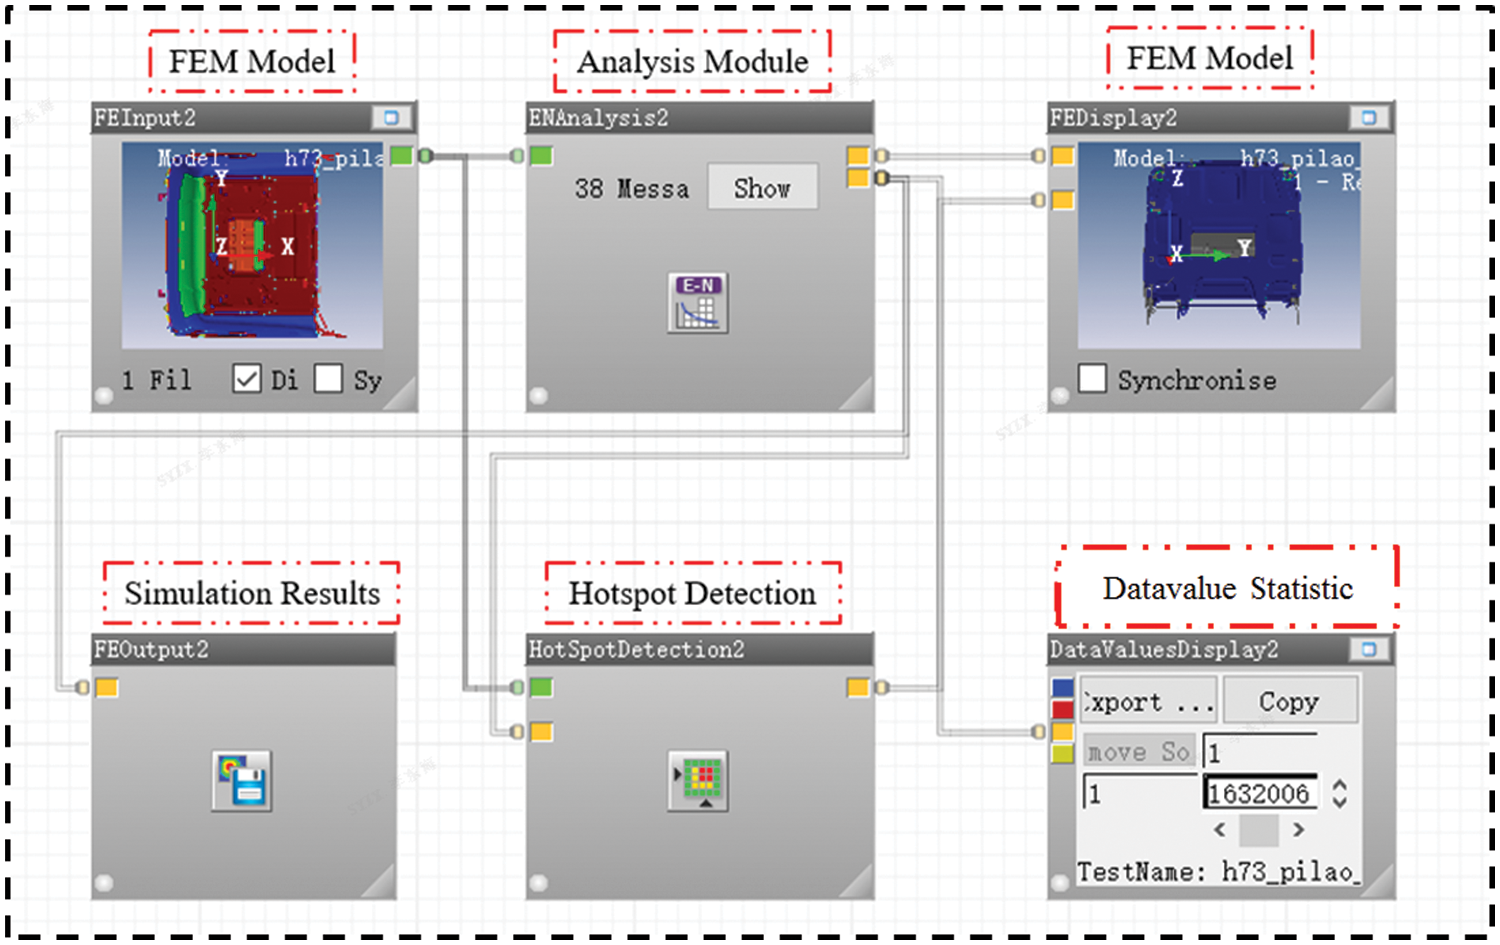
Figure 14: Cab fatigue simulation flow block diagram
Cracking diagrams of the proving ground and simulation cloud diagrams are shown in Fig. 15. The maximum damage value was 142.5, located at the deflector bracket mounting point. Figs. 15a and 15b show the tearing diagram of the deflector bracket installation point during the test. Fig. 15e shows the simulation cloud diagram. Fig. 15c shows the fatigue cracking diagram at lap joints of floor braces during the test and Fig. 15f shows the corresponding fatigue simulation cloud diagram. Fig. 15d is the upper bracket cracking diagram of the rear airbag suspension during the test, and Fig. 15g is the corresponding fatigue simulation cloud diagram.
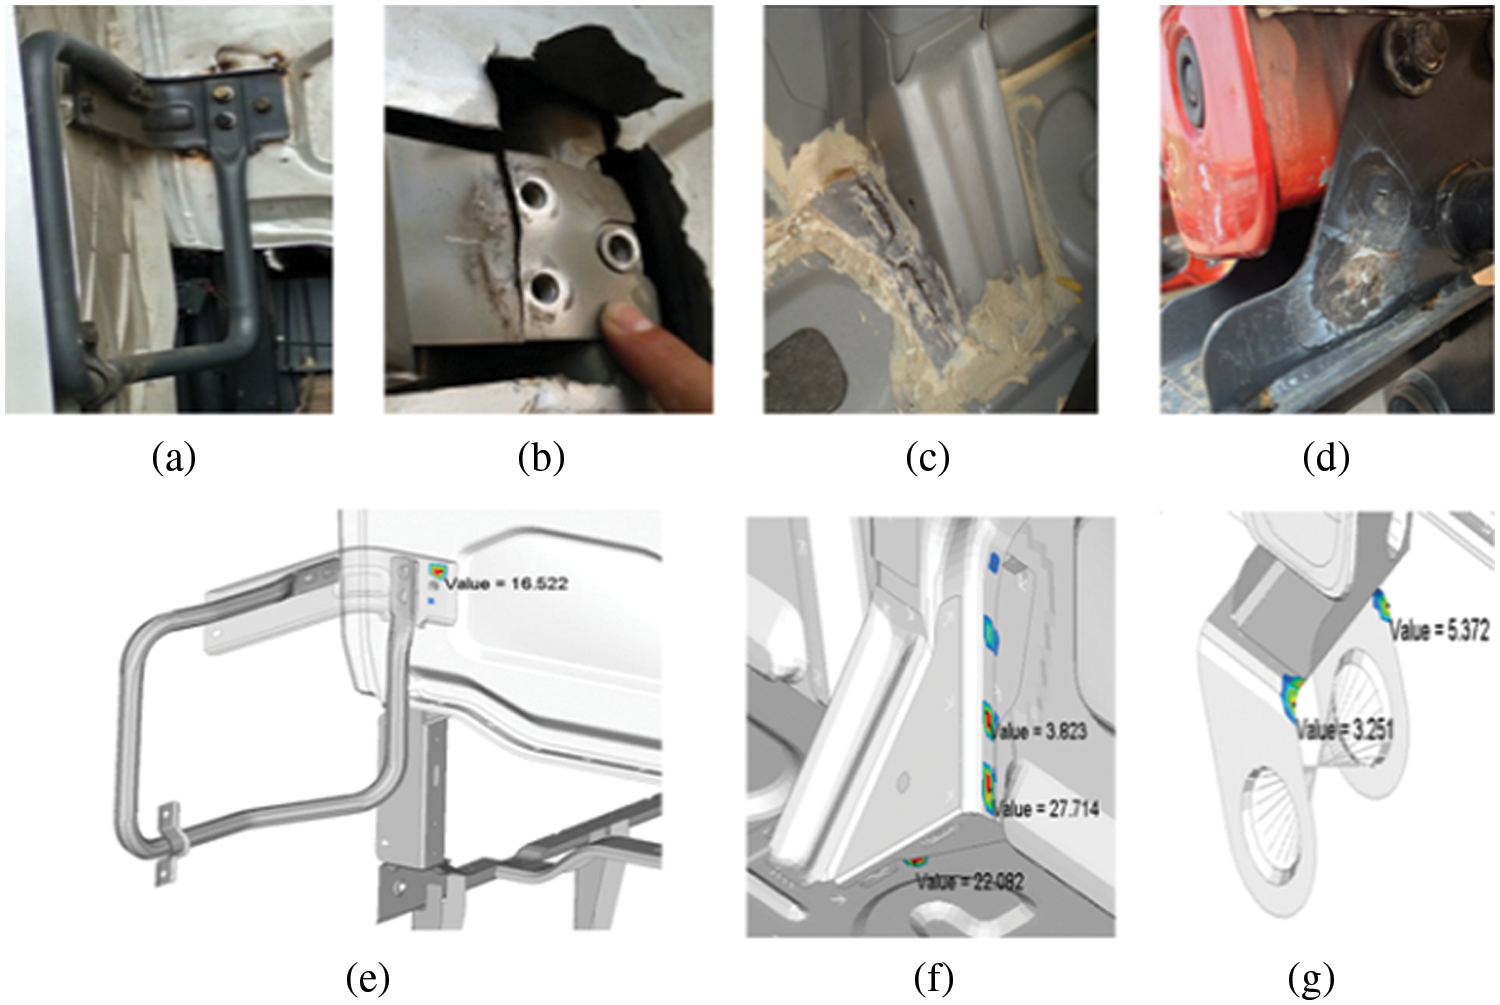
Figure 15: Comparison of road test results and simulation
According to the simulated cloud and road test results, the fatigue damage is mainly located at the outer support mounting point and load conduction point of the cab. And there is no fatigue failure of body components. Therefore, the fatigue life of the cab still has a certain potential to improve, and the body sheet metal parts have a certain space for lightweight.
6.1 Screening Variables Based on Sensitivity Analysis
From the perspective of cab structure, the cab structure is welded together by a large number of sheet metal parts with different thickness. If all of them are used as design variables, some variables that have little impact on the optimization objective will be introduced, resulting in increased optimization iteration times or even failing to find the best solution.
Sensitivity analysis presents the partial derivatives of performance parameters to each design variable, whose magnitude reflects the influence of design variables on performance parameters [28]. Therefore, the sensitivity analysis results were used to screen design parameters. To meet the lightweight based on fatigue durability, the material thickness of the body parts is taken as the design variable. The sensitivity of the body structure performance parameters to the thickness variables of the components can be expressed as:
where S is the sensitivity,
The thickness of body sheet metal parts was taken as a screening set of data variables. And the calculated results are the sensitivity of bending stiffness (BS), torsional stiffness (TS), first-order bending modal (BMS) and torsional modal (TMS) to thickness variables. The results of the sensitivity analysis were shown in Fig. 16.
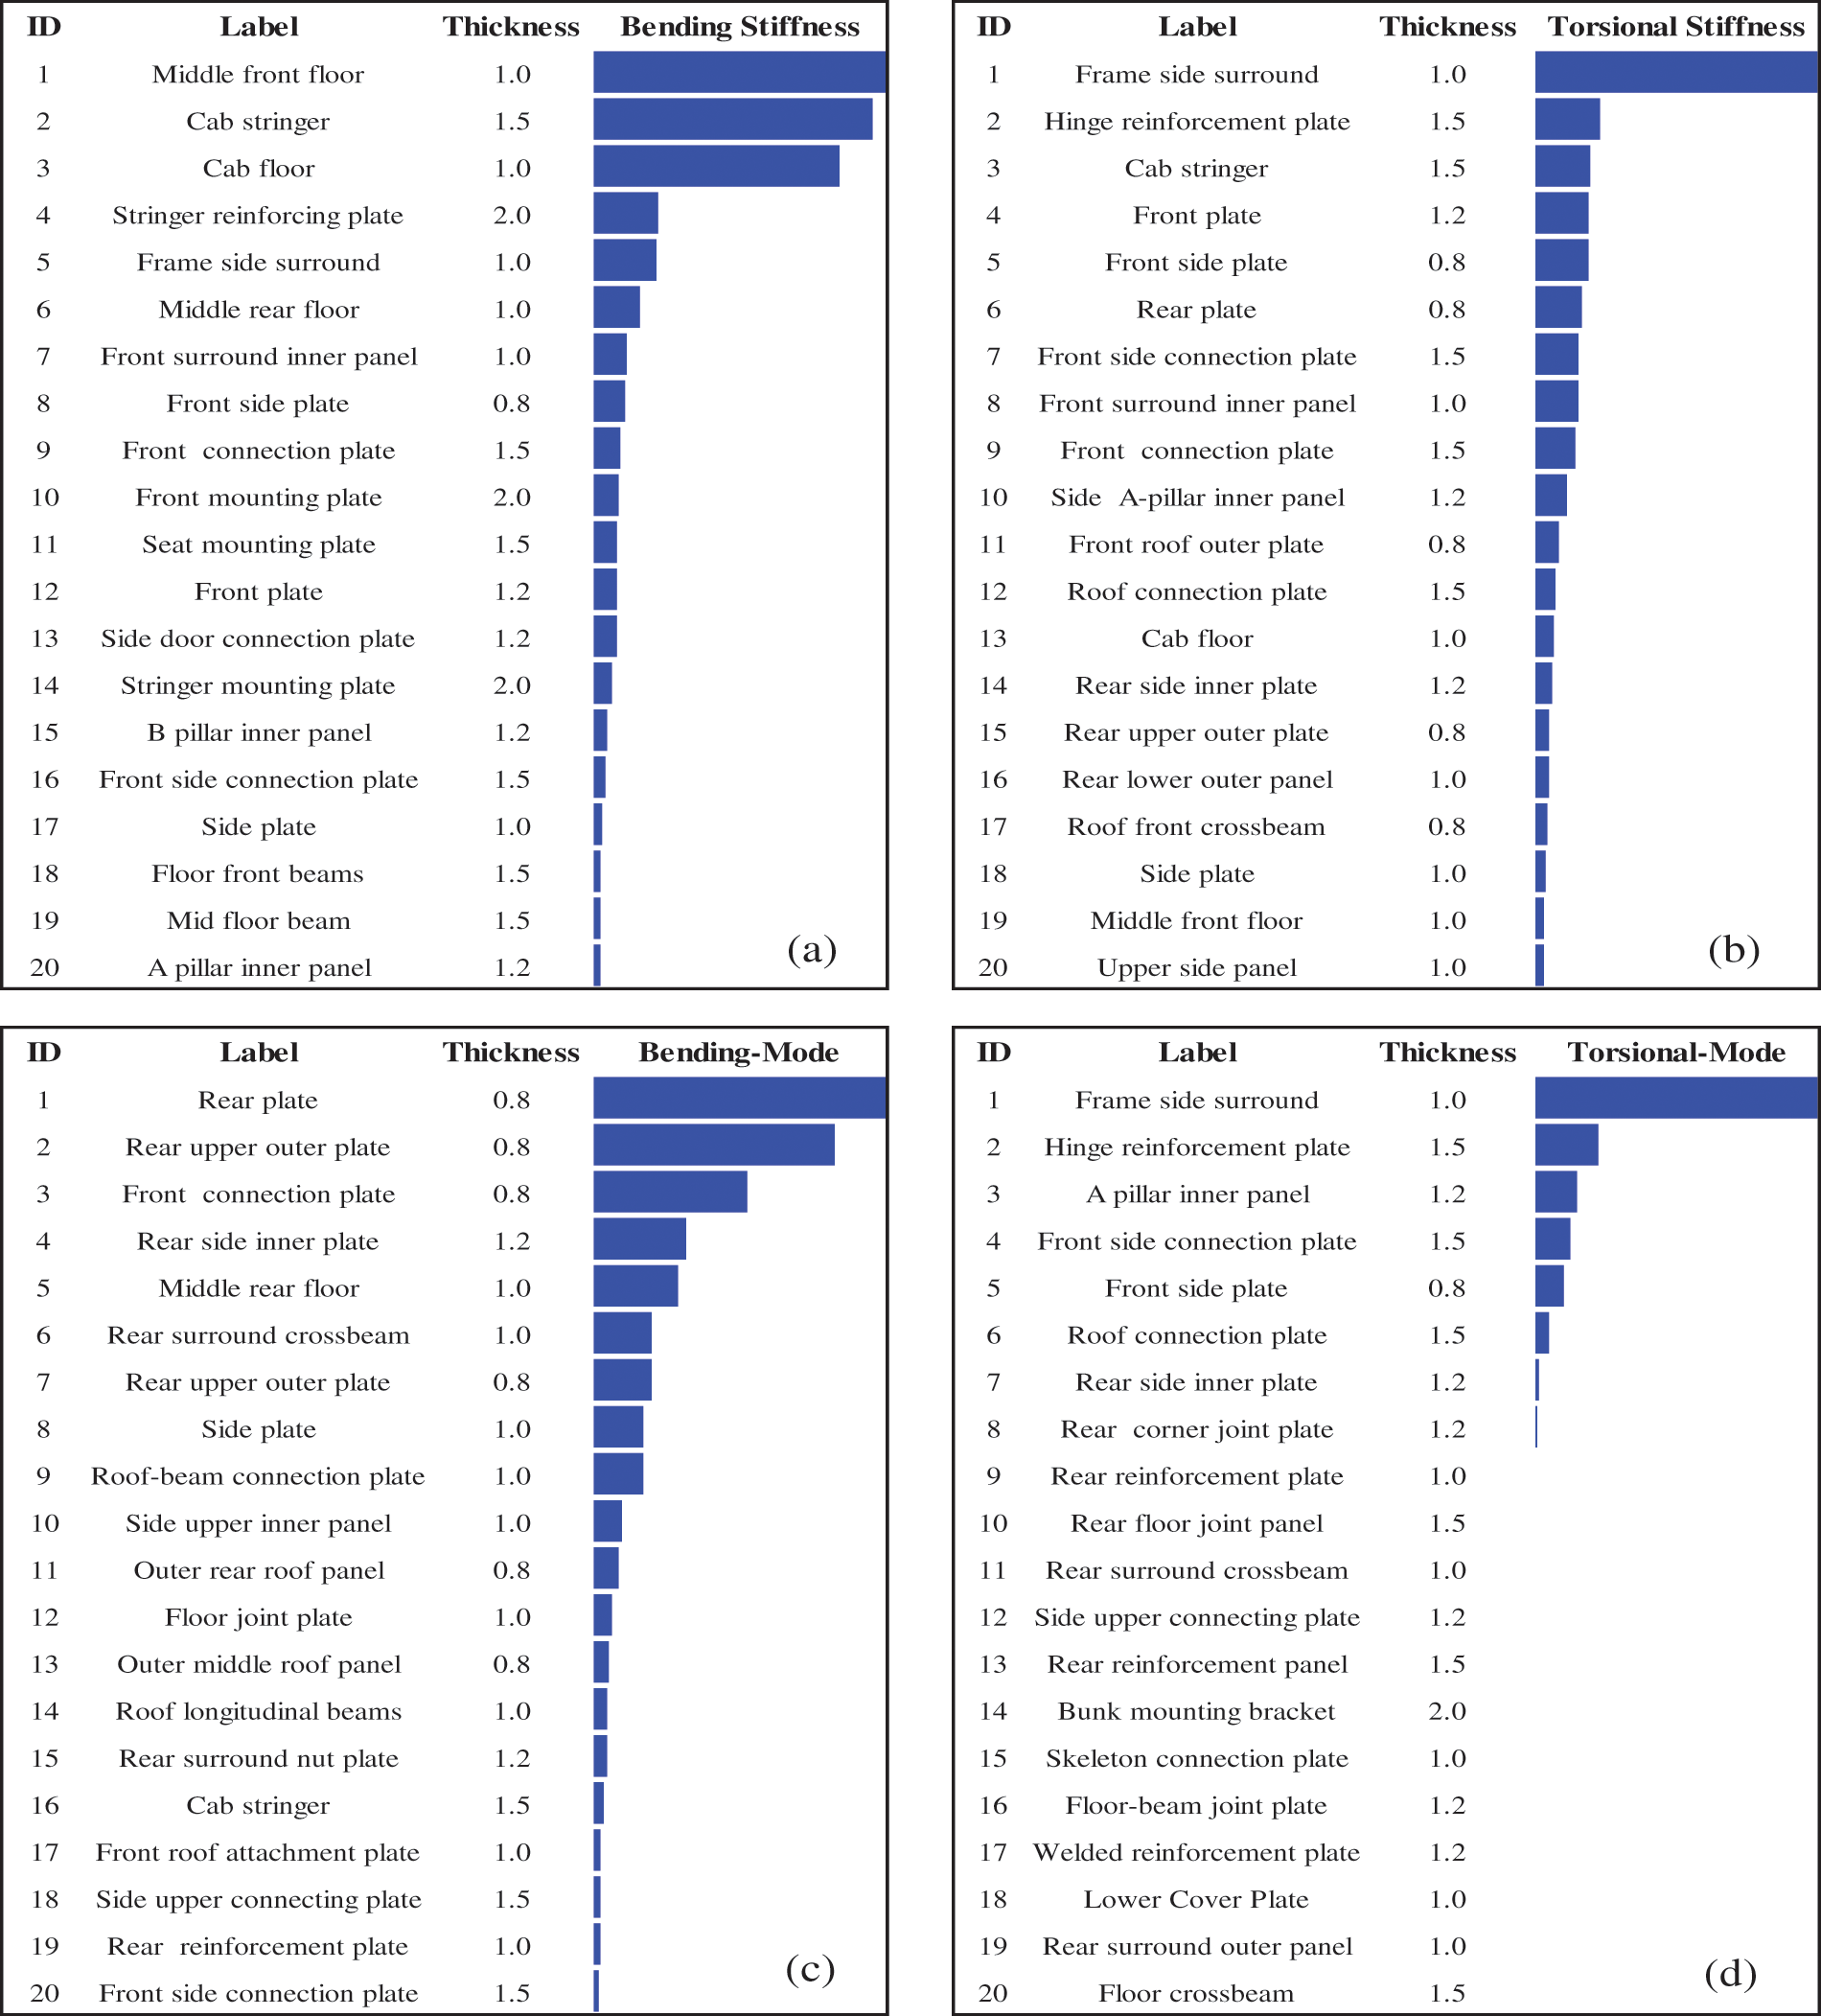
Figure 16: Sensitivity analysis results: (a) BS, (b) TS, (c) BMS, (d) TMS
Through sensitivity calculation, the thickness of 20 components is determined as the optimized design variable. These components have high sensitivity to the objective function and low sensitivity to fatigue performance. These satisfy the lightweight requirements without sacrificing too much performance, so they are chosen as design variables for the lightweight design.
To improve the optimization efficiency, using the Kriging approximation model instead of the original simulation model to express the relationship between the optimization variables and the response. According to the optimal Latin hypercube experimental design method, a total of 100 sample points were selected by uniform random sampling within the values range of each design variable, combined with the fitting accuracy needs.
The accuracy of each approximate model is tested by determination coefficient R2, which be expressed as [29]:
where n is the number of sampling points, ŷ,
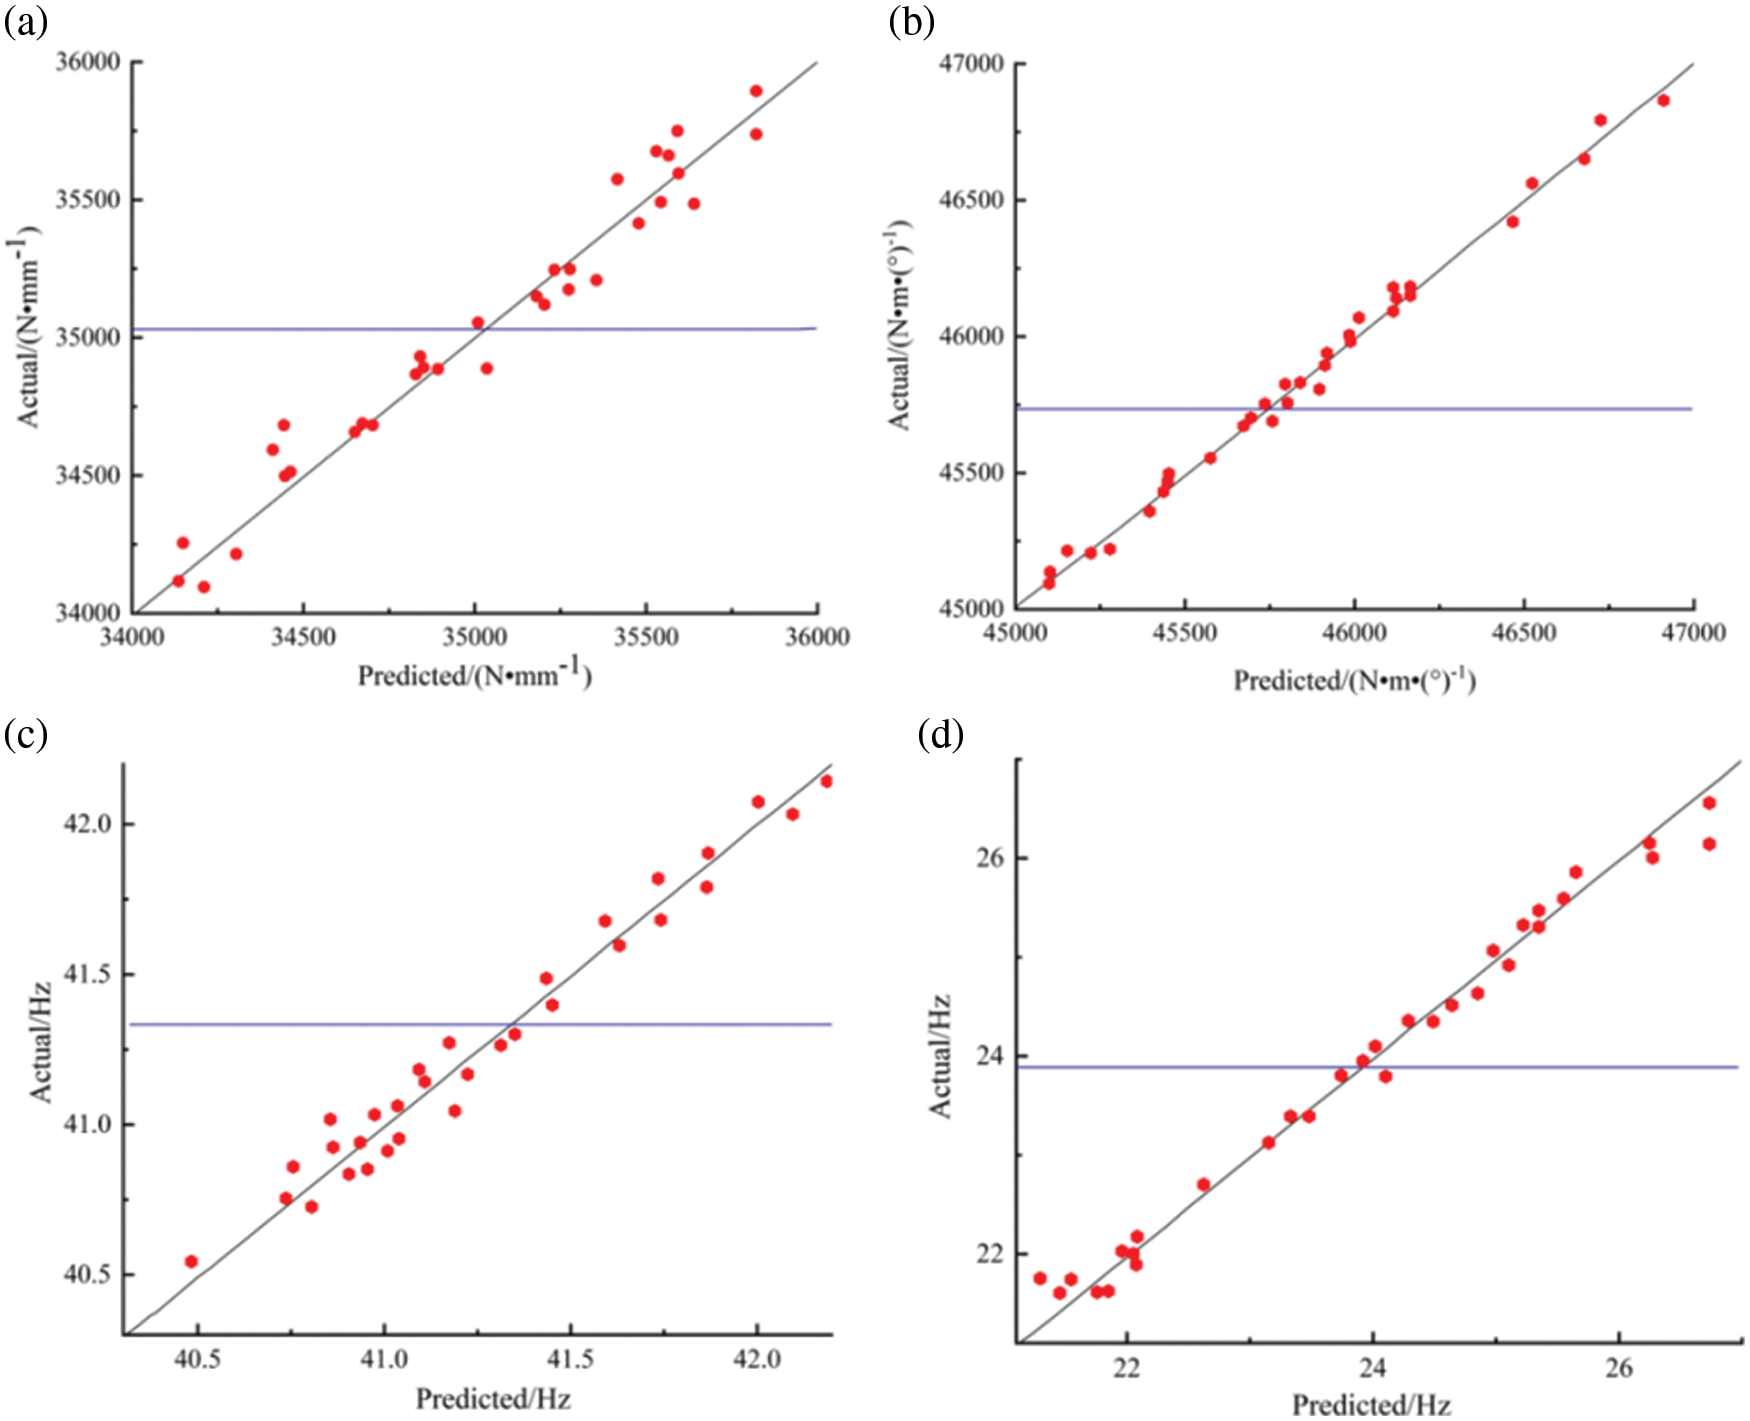
Figure 17: Accuracy test of kriging model: (a) Bending stiffness, (b) Torsional stiffness, (c) First-order bending mode, (d) First-order torsional mode
Taking the thickness of 20 sheet metal components screened by sensitivity analysis as the design variable, and comprehensively considering the mass, fatigue damage, stiffness and modal performance indexes, the particle swarm optimization algorithm was adopted to carry out a lightweight multi-objective optimization design of the cab. The mathematical optimization model can be described as follows:
where
Under the condition of satisfying fatigue endurance and reaching the lightweight goal, there is a conflict between these two objectives, and such problems are usually called multi-objective optimization problems [30]. As a swarm intelligence algorithm, the particle swarm optimization algorithm has the advantages of simple form, fast convergence and flexible parameter adjustment mechanism, which has great advantages in solving multi-objective optimization problems. Therefore, the performance index calculation ingredients are integrated into the multidisciplinary optimization analysis platform, and the particle swarm multi-objective optimization algorithm is selected. Based on Kriging approximation model, the multi-objective optimization model of cab lightweight is shown in Fig. 18.
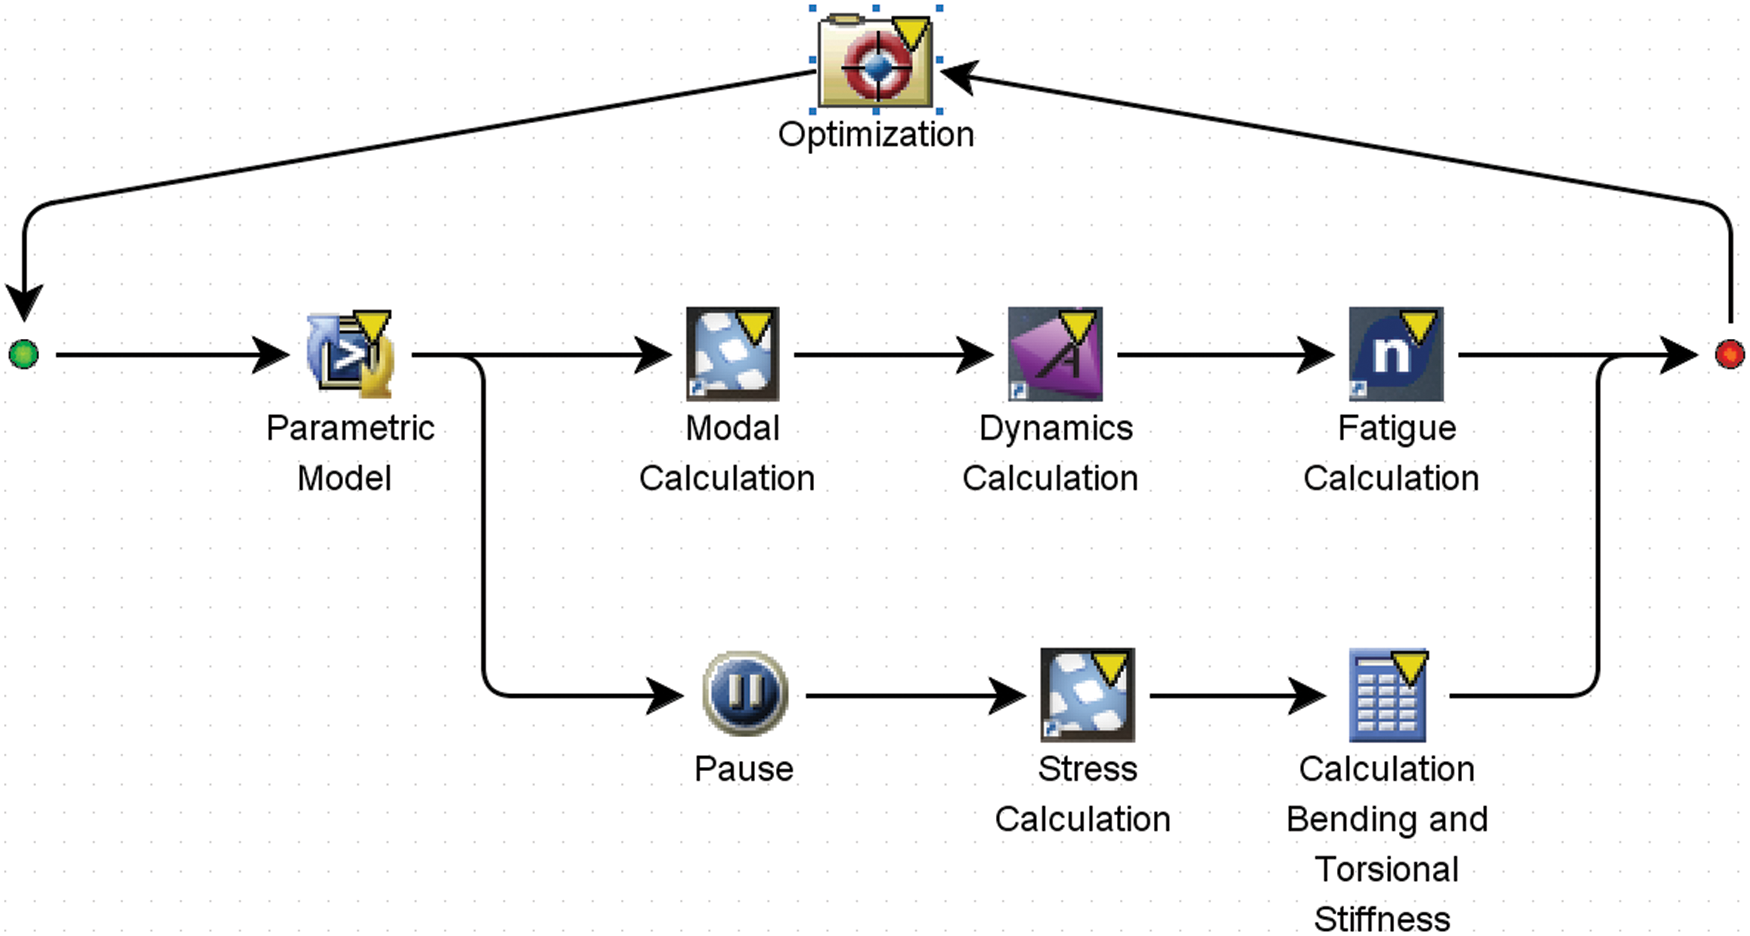
Figure 18: Multi-objective optimization model
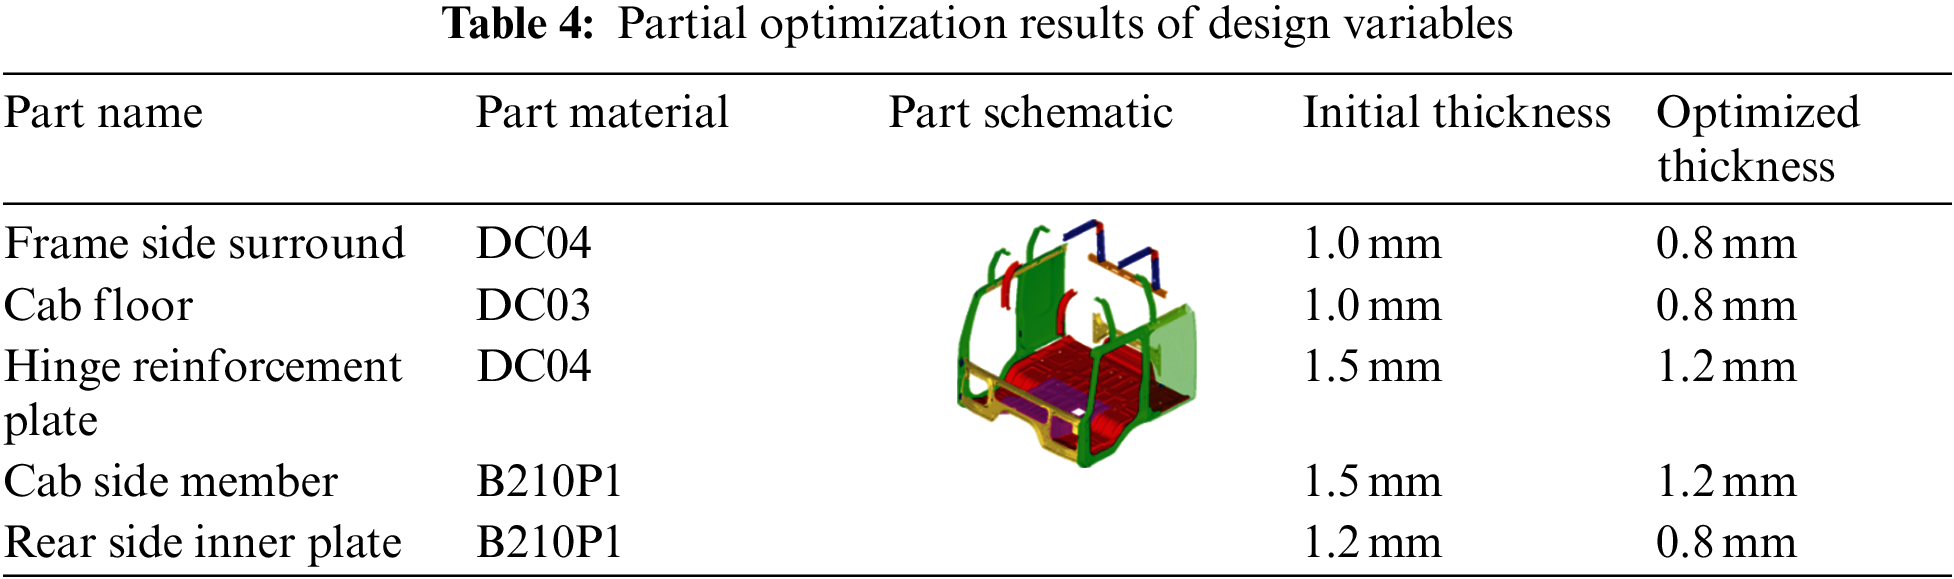
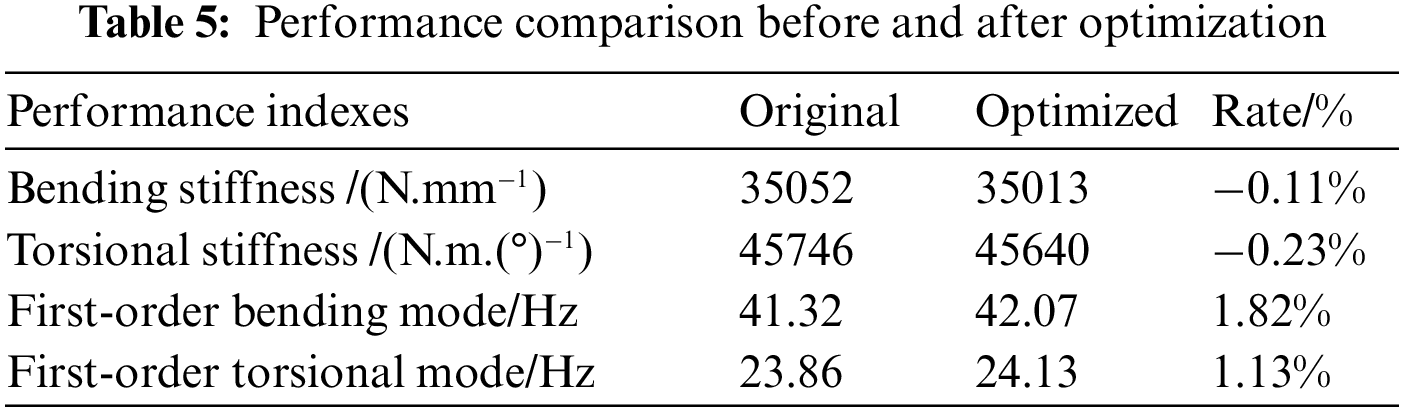
Partial optimization results of design variables are demonstrated in Table 4. The performance comparison of the cab before and after optimization is shown in Table 4. It can be seen from Table 5 that the first-order bending and torsion frequency improve by 1.82% and 1.13% respectively, while the cab bending and torsional stiffness decrease by 0.11% and 0.23%, respectively, and its mass is reduced by 53 kg. Through optimization iterations, the performance changes are within acceptable limits while reducing the mass, which shows that this method is effective in the optimized design of body lightweight.
The original body mass was 681.4 kg, and after optimization, it was 628.3 kg, achieving a lightweight effect of 7.8%, while the maximum fatigue damage value was reduced from 142.5 to 2.56. From the result of the simulation, the fatigue failure risk was reduced greatly. The comparison of fatigue simulation cloud diagrams before and after lightweight optimization was shown in Fig. 19.
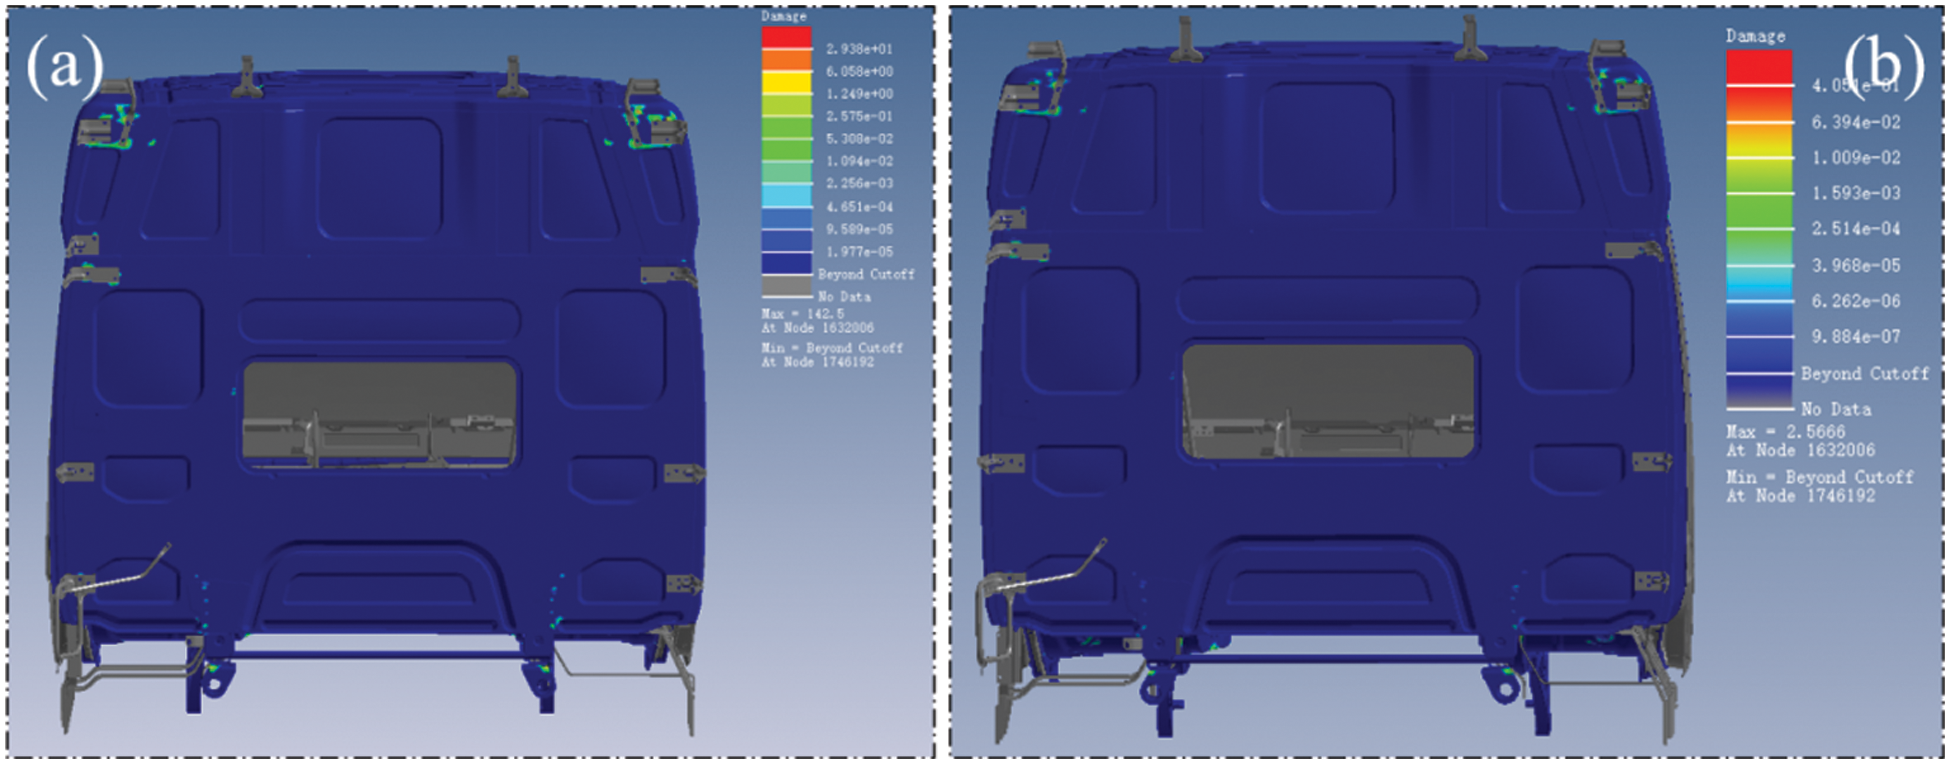
Figure 19: Comparison of fatigue simulation clouds: (a) Initial fatigue simulation cloud, (b) Fatigue simulation cloud after optimization
6.3 Seven-Axis Bench Durability Test
The fatigue test of the lightweight designed cab was carried out on the bench. And the MTS seven-axis road simulation test bench was used to reproduce the fatigue stress condition of the cab during the road test on the proving ground. The seven hydraulic servo actuators are consistent with the seven displacement channels of the virtual iteration, including four Z-direction displacement channels, two Y-direction displacement channels, and one X-direction displacement channel. Compared with the traditional six-axis test bench, it can not only simulate longitudinal, lateral and vertical translation and three-directional rotation of roll, pitch and yaw, but also simulate the torsional attitude of the cab, which can accurately reproduce the six degrees of freedom movement force of the vehicle [31].
The counterweight of the driver and occupants in the cab is the same as the aforementioned durability test on the proving ground. By simulating the response of the test vehicle under the road excitation, the force from the six degrees of freedom on the road is reproduced, and the cab fatigue endurance test bench is shown in Fig. 20. Combined with the feedback from the road test on the proving ground, marks were placed on the vulnerable parts for viewing the fatigue damage results after the bench test.
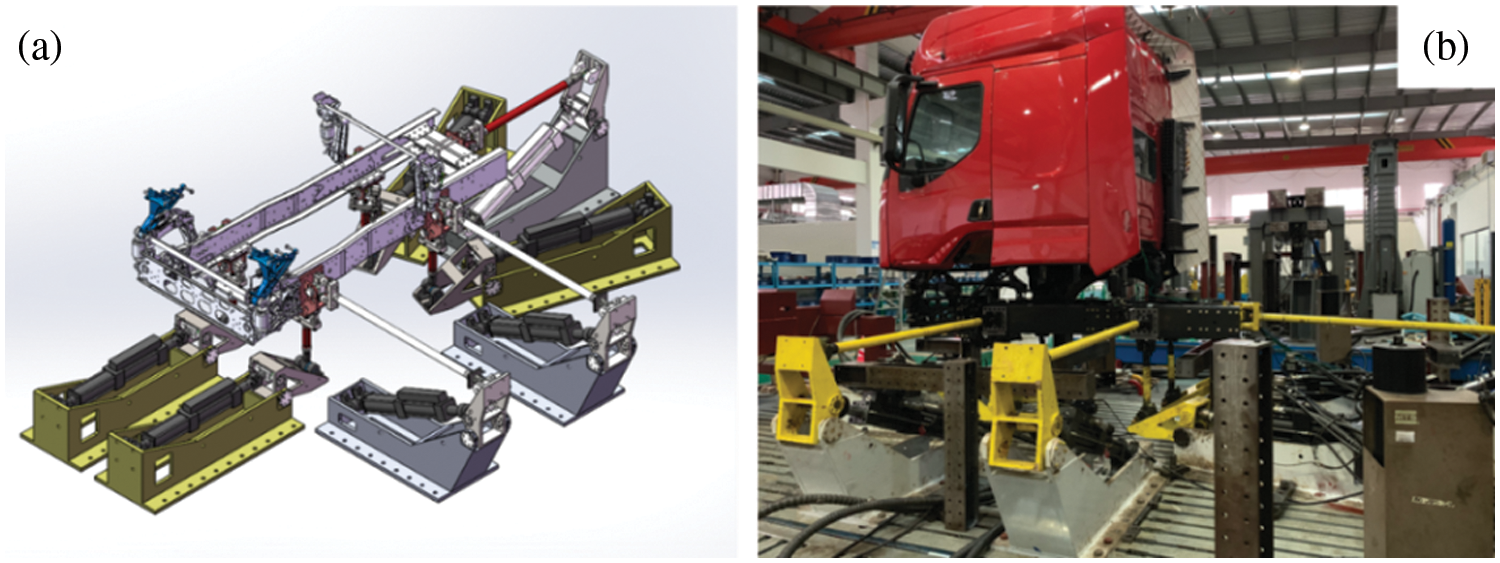
Figure 20: Fatigue verification of lightweight cab bench: (a) Diagram of the seven-axis actuator, (b) Cab bench test
The road test procedure is consistent with the aforementioned, which is 8000 km reinforced road of automobile testing ground. Cyclic loading is carried out according to the road spectrum test procedure, and the equivalent bench test time is 260 h. After the bench test, all components have no fatigue damage, and the results are consistent with the simulation results. The results show in Fig. 21.
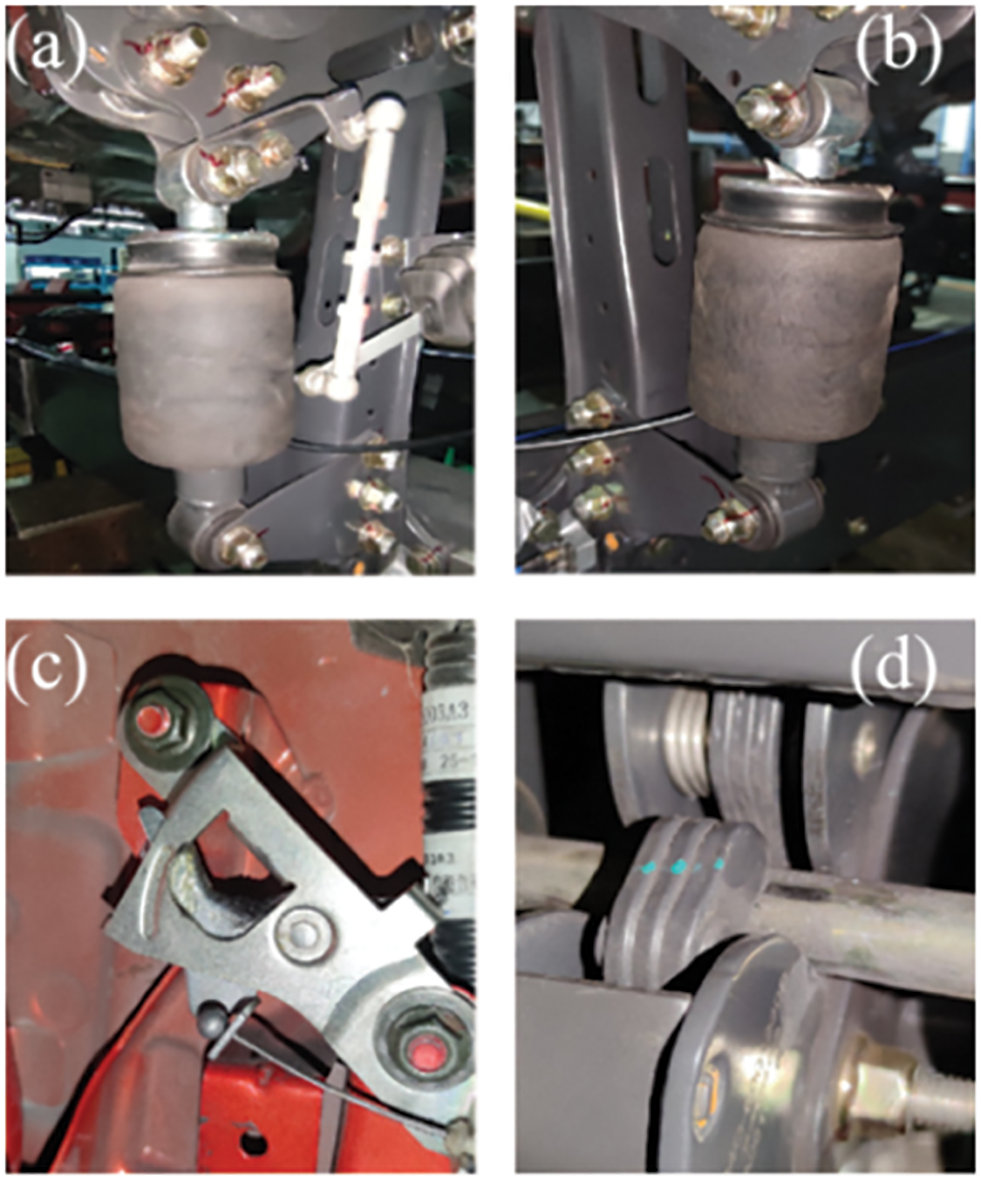
Figure 21: Marked component test results: (a) Left-front airbag suspension, (b) Right-front airbag suspension, (c) Hood locking mechanism, (d) Suspension locking mechanism
In this paper, three fatigue research methods, namely, prototype vehicle endurance road testing, finite element fatigue simulation and physical bench test, are integrated and applied to engineering practice, which provides an important reference for the future study of automotive system-level durability and lightweight.
Firstly, aiming at the current poor correlation between the fatigue analysis based on random road spectrum and the endurance road testing on the proving ground, a fatigue endurance analysis strategy combining the measured road spectrum and virtual simulation is proposed, which improves the speed of fatigue simulation solution while maximizing the restoration of the real user road conditions. The fatigue simulation results are basically consistent with the durability test results of reinforced road, which verifies that the method has good engineering practicality.
Then, the thickness is screened based on sensitivity analysis, with mass and fatigue damage value as the optimization objectives, bending torsional stiffness and first-order bending and torsional mode as the constraints. Combined with the Kriging approximation model and particle swarm algorithm, the multi-objective optimization design of the cab is carried out to obtain the Pareto optimal solution set, and the final lightweight scheme is determined.
Finally, durability performance is verified based on the seven-axis road simulation test bench. The results show that the cab’s lightweight design can consider both lightweight and durability.
Funding Statement: This work was supported in part by the Science and Technology Major Project of Guangxi under Grants AA18242033 and AA19182004, in part by the Key Research and Development Program of Guangxi AB21196029, in part by the Scientific Research and Technology Development in Liuzhou 2020GAAA0404, 2021AAA0104 and 2021AAA0112, in part by the Guangxi Higher Education Undergraduate Teaching Reform Project Grant 2021JGA180, in part by the GUET Education Undergraduate Teaching Reform Project Grant JGB202002, in part by the Innovation Project of GUET Graduate Education (2022YCXS017).
Conflicts of Interest: The authors declare that they have no conflicts of interest to report regarding the present study.
References
1. Chen, K., He, S., Xu, E., Tang, R., Wang, Y. (2020). Research on ride comfort analysis and hierarchical optimization of heavy vehicles with coupled nonlinear dynamics of suspension measurement. Condition Motion and Defect Prognosis of Mechanical System, 165, 108142. DOI 10.1016/j.measurement.2020.108142. [Google Scholar] [CrossRef]
2. Kwonhee, S., Yoon, H. (2018). Durability evaluation of the airlift provision for Korean light tactical vehicles based on fatigue test modes. Journal of Mechanical Science and Technology, 32, 1219–1225. DOI 10.1007/s12206-018-0225-6. [Google Scholar] [CrossRef]
3. Jia, J., Ulfvarson, A. (2004). A parametric study for the structural behaviour of a lightweight deck. Engineering Structures, 26(7), 963–977. DOI 10.1016/j.engstruct.2004.03.001. [Google Scholar] [CrossRef]
4. Pan, F., Zhu, P., Zhang, Y. (2010). Metamodel-based lightweight design of B-pillar with TWB structure via support vector regression. Computers & Structures, 88, 36–44. DOI 10.1016/j.compstruc.2009.07.008. [Google Scholar] [CrossRef]
5. Wang, T., Wang, L., Wang, Y. (2017). Assessment of the locations of fatigue failure in a commercial vehicle cab using the virtual iteration method. Proceedings of the Institution of Mechanical Engineers Part D-Journal of Automobile Engineering, 231, 84–98. DOI 10.1177/0954407016633550. [Google Scholar] [CrossRef]
6. Fu, W., Liu, L., Shu, J., Wang, D., Xu, L. (2016). Dynamic simulation analysis of pothole event based on vRLDA. SAE Technical Paper, 2016-01-0451. DOI 10.4271/2016-01-0451. [Google Scholar] [CrossRef]
7. Kang, D., Park, K., Heo, S., Ryu, Y., Jeong, J. (2010). Development and application of VPG simulation technique based on equivalent virtual road profile. International Journal of Precision Engineering &. Manufacturing, 11, 265–272. DOI 10.1007/s12541-010-0030-3. [Google Scholar] [CrossRef]
8. Ryu, S. (2010). A study on obtaining excitation load of virtual test lab using virtual iteration method. SAE Technical Paper, 2010-01-0011. DOI 10.4271/2010-01-0011. [Google Scholar] [CrossRef]
9. Pradeepak, R., Kumbhar, S., Barhate, N. (2016). Process automation to generate road drive files in laboratory testing using virtual iterations method. SAE Technical Paper, 2016-01-1359. DOI 10.4271/2016-01-1359. [Google Scholar] [CrossRef]
10. Achyut, V., Nitin, T., Bhaskar, A. (2018). Road loads for durability analysis using virtual iterations. SAE Technical Paper, 2018-01-0567. DOI 10.4271/2018-01-0567. [Google Scholar] [CrossRef]
11. Wang, D., Xie, C. (2020). Contribution analysis of the cab-in-white for lightweight optimization employing a hybrid multi-criteria decision-making method under static and dynamic performance. Engineering Optimization Engineering Optimization, 52, 1903–1922. DOI 10.1080/0305215x.2019.1693553. [Google Scholar] [CrossRef]
12. Wang, S., Wang, D. (2019). Research on crashworthiness and lightweight of B-pillar based on MPSO with TOPSIS method. Journal of the Brazilian Society of Mechanical Sciences and Engineering, 41, 498. DOI 10.1007/s40430-019-2019-x. [Google Scholar] [CrossRef]
13. Mi, C., Gu, Z., Zhang, Y., Liu, S., Zhang, S. (2016). Frame weight and anti-fatigue co-optimization of a mining dump truck based on kriging approximation model. Engineering Failure Analysis, 66, 99–109. DOI 10.1016/j.engfailanal.2016.03.021. [Google Scholar] [CrossRef]
14. Mattetti, M., Molari, G., Vertua, A. (2015). New methodology for accelerating the four-post testing of tractors using wheel hub displacements. Biosystems Engineering, 129, 307–314. DOI 10.1016/j.biosystemseng.2014.10.009. [Google Scholar] [CrossRef]
15. Cianettil, F., Alvino, A., Bolognini, A., Palmieril, M., Braccesi, C. (2018). The design of durability tests by fatigue damage spectrum approach. Fatigue & Fracture of Engineering Materials & Structures, 41, 787–796. DOI 10.1111/ffe.12686. [Google Scholar] [CrossRef]
16. Meng, K., Wang, Q., Hu, J., Gu, X. (2021). Fatigue analysis of heavy-duty commercial vehicle cab based on virtual iteration. Journal of Hefei University of Technology (Natural Science), 44(2), 158–163. DOI 10.3969/j.issn.1003-5060.2021.02.003. [Google Scholar] [CrossRef]
17. Xu, N., Wang, X. (2021). Structure optimization of vibrating feeder based on inertia release. Shock and Vibration, 30, 1–13. DOI 10.1155/2021/8830882. [Google Scholar] [CrossRef]
18. Sathish, K., Manikandan, M., Mahendra, N. (2013). Virtual durability analysis of heavy commercial truck cabin for proving ground inputs. SAE Technical Paper, 2013-01-2788. DOI 10.4271/2013-01-2788. [Google Scholar] [CrossRef]
19. Wang, D., Jiang, R. (2015). Fatigue life estimation of front subframe of a passenger car based on modal stress recovery method. SAE International Journal of Materials and Manufacturing, 8, 795–802. DOI 10.4271/2015-01-0547. [Google Scholar] [CrossRef]
20. Baskar, A., Balaramakrishna, N., Abhijit, L. (2020). Develop the methodology to predict the engine mount loads from road load data using MSC ADAMS and FEMFAT virtual iteration. SAE Technical Paper, 2020-01-1401. DOI 10.4271/2020-01-1401. [Google Scholar] [CrossRef]
21. Yu, J., Zheng, S., Feng, J., Zhao, L. (2017). New methodology for determination of load spectra for the vehicle accelerated durability testing associated with the time correlated fatigue damage analysis method. International Journal of Automotive Technology, 18, 547–560. DOI 10.1007/s12239-017-0054-0. [Google Scholar] [CrossRef]
22. Huffman, P. (2016). A strain energy based damage model for fatigue crack initiation and growth. International Journal of Fatigue, 88, 197–204. DOI 10.1016/j.ijfatigue.2017.06.009. [Google Scholar] [CrossRef]
23. Correia, J., Raposo, P., Muniz-Calventeb, M., Blasónb, S., Lesiuk, G. et al. (2017). A generalization of the fatigue kohout-vechet model for several fatigue damage parameters. Engineering Fracture Mechanics, 185, 284–300. DOI 10.1016/j.engfracmech.2017.06.009. [Google Scholar] [CrossRef]
24. Kong, Y., Abdullah, S., Schramm, D., Omar, M., Haris, S. (2019). Development of multiple linear regression-based models for fatigue life evaluation of automotive coil springs. Mechanical Systems and Signal Processing, 118, 675–695. DOI 10.1016/j.ymssp.2018.09.007. [Google Scholar] [CrossRef]
25. Marsh, G., Wignall, C., Thies, P., Barltrop, N., Incecik, A. (2016). Review and application of rainflow residue processing techniques for accurate fatigue damage estimation. International Journal of Fatigue, 82, 757–765. DOI 10.1016/j.ijfatigue.2015.10.007. [Google Scholar] [CrossRef]
26. Ragab, K., Bouaicha, A., Bouazara, M. (2018). Development of fatigue analytical model of automotive dynamic parts made of semi-solid aluminum alloys. Transactions of Nonferrous Metals Society of China, 28, 1226–1232. DOI 10.1016/S1003-6326(18)64760-0. [Google Scholar] [CrossRef]
27. Liu, J., Zhang, H., Wang, W. (2019). Fatigue analysis of commercial vehicle frames based on six-dimensional wheel loads. China Mechanical Engineering, 30(21), 2583–2589. DOI 10.3969/j.issn.1004-132X.2019.21.010. [Google Scholar] [CrossRef]
28. Paraforos, D., Griepentrog, H., Vougioukas, S. (2016). Method-ology for designing accelerated structural durability tests on agricultural machinery. Biosystems Engineering, 149, 24–37. DOI 10.1016/j.biosystemseng.2016.06.004. [Google Scholar] [CrossRef]
29. Wang, D., Zhang, S., Wang, Y. (2019). Analysis and multi-objective optimization design of wheel based on aerodynamic performance. Advances in Mechanical Engineering, 11(5), 1–19. DOI 10.1177/1687814019849733. [Google Scholar] [CrossRef]
30. Chen, S., Shi, T., Wang, D., Chen, J. (2015). Multi-objective optimization of the vehicle ride comfort based on kriging approximate model and NSGA-II. Journal of Mechanical Science and Technology, 29, 1007–1018. DOI 10.1007/s12206-015-0215-x. [Google Scholar] [CrossRef]
31. Gao, Y., Wang, G., Han, J. (2017). The study on fatigue test of cab assembly based on 4-channel road simulation bench. SAE Technical Paper, 2017-01-0328. DOI 10.4271/2017-01-0328. [Google Scholar] [CrossRef]
Cite This Article
 Copyright © 2023 The Author(s). Published by Tech Science Press.
This work is licensed under a Creative Commons Attribution 4.0 International License , which permits unrestricted use, distribution, and reproduction in any medium, provided the original work is properly cited.
 Downloads
 Citation Tools