
 Submit a Paper
 Propose a Special lssue
 Open Access
ARTICLE
Quantifying Solid Solution Strengthening in Nickel-Based Superalloys via High-Throughput Experiment and Machine Learning
1 State Key Laboratory of Powder Metallurgy, Central South University, Changsha, 410083, China
2 AECC Commercial Aircraft Engine Co., Ltd., Shanghai, 200241, China
3 State Key Laboratory for Strength and Vibration of Mechanical Structures, School of Aerospace Engineering, Xi’an, 710049, China
* Corresponding Authors: Liming Tan. Email: ; Xiaochao Jin. Email:
# These authors contributed equally to this work
Computer Modeling in Engineering & Sciences 2023, 135(2), 1521-1538. https://doi.org/10.32604/cmes.2022.021639
Received 25 January 2022; Accepted 15 June 2022; Issue published 27 October 2022
 View Full Text
 Download PDF
Abstract
Solid solution strengthening (SSS) is one of the main contributions to the desired tensile properties of nickel-based superalloys for turbine blades and disks. The value of SSS can be calculated by using Fleischer’s and Labusch’s theories, while the model parameters are incorporated without fitting to experimental data of complex alloys. In this work, four diffusion multiples consisting of multicomponent alloys and pure Ni are prepared and characterized. The composition and microhardness of single γ phase regions in samples are used to quantify the SSS. Then, Fleischer’s and Labusch’s theories are examined based on high-throughput experiments, respectively. The fitted solid solution coefficients are obtained based on Labusch’s theory and experimental data, indicating higher accuracy. Furthermore, six machine learning algorithms are established, providing a more accurate prediction compared with traditional physical models and fitted physical models. The results show that the coupling of high-throughput experiments and machine learning has great potential in the field of performance prediction and alloy design.Keywords
Superalloys, especially Ni-based superalloys, are crucial materials used in the high temperature components, including turbine blades and turbine disks of aircraft engines [1]. For example, engine turbine blades are mainly made of Ni-based single crystal superalloys due to their superior mechanical properties at elevated temperatures, such as creep resistance and high temperature strength [1–3], which can be attributed to the strengthening effects of solid solution matrix γ phases and coherent precipitations γ′ phases [4–13]. Regarding the tensile properties, the strengthening mechanisms of nickel-based superalloys mainly include solid solution strengthening (SSS), precipitation strengthening (PS), and grain boundary strengthening (GBS) in polycrystalline alloys [4–6,9]. The quantification of these strengthening effects is significant in alloy design [14–16]. SSS plays an important role in creep resistance and tensile properties [11,16,17], describing the hindrance of solute atoms to the movement of mobile dislocations attributed to elastic misfit and atomic size misfit [17].
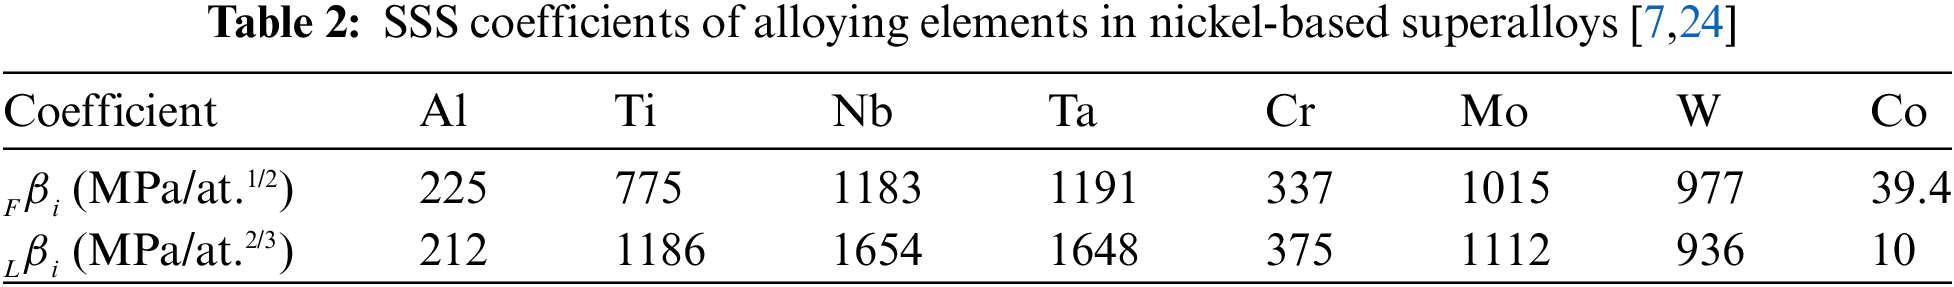
SSS was firstly proposed in binary or ternary alloy systems [18–21]. Gypen et al. [22,23] further developed a suitable model for multicomponent alloys by integrating the strength increments of various alloying elements i in the Ni-i binary systems. This model was extended by Roth et al. [24] and Galindo-Nava et al. [7] to estimate SSS in nickel-based superalloys based on Fleischer’s [19] and Labusch’s [20] theories, respectively. However, the SSS coefficients of traditional models are related to simple alloy systems without fitting the experimental data of multicomponent alloys [7,24].
In addition, diffusion multiple technologies as a high throughput way has been widely used in the fields of phase diagram research [25–29], diffusion kinetics [30,31], and alloy design [32,33] et al. Compared with traditional alloy diffusion couples, diffusion multiple techniques can effectively integrate composition, microstructure, and even property data in a simple sample. Ur-Rehman [34] used diffusion couples to research the SSS in binary nickel- and cobalt-based superalloys, but few works on SSS have been studied for multicomponent systems.
In this work, the SSS effects in multicomponent nickel-based superalloys based on high-throughput experiment techniques were studied, which yielded vast experimental data. However, how to analyze the data becomes a big challenge for material scientists. Recently, data-driven machine learning (ML) algorithms played a key role in the field of material sciences, including phase identifying and mechanical performance prediction [35–38]. Qin et al. [39] coupled the high-throughput experiment and ML to quickly identify the precipitation phase of superalloys with superior accuracy. Wang et al. [40] accelerated the compositional design of nickel-based superalloys with target mechanical properties by integrating high-throughput experiments and artificial neural networks (ANN). Liu et al. [41] designed a high-strength and tough NiCoCrAl eutectic high entropy alloy by combining machine learning and CALPHAD method. Wen et al. [42] formulated a materials design strategy that combines ML surrogate models with experimental design algorithms to search for the high-entropy alloys (HEAs) with excellent hardness, and the high hardness HEAs were obtained by only seven iterative experiments. Liu et al. [43] developed a divide-and-conquer self-adaptive (DSCA) learning method incorporating five material descriptors to accelerate the prediction of the creep rupture life of nickel-based superalloys, which shows superior predictive performance. Hence, coupling high-throughput experiments, calculations and ML exhibit great potential in performance prediction.
Here, four multicomponent diffusion multiples were prepared to rapidly obtain the composition-SSS hardness data of nickel-based superalloys. Thereafter, the existing SSS models were evaluated by experimental data, and related model parameters were fitted. Furthermore, several ML algorithms were used to predict the SSS values and their accuracy was compared with physical models.
2.1 Diffusion Multiple Experiment
The base alloys were prepared by vacuum induction melting (VIM) technology, and the experimental compositions are listed in Table 1. The multicomponent diffusion multiples were assembled from base alloy ingots and a pure Ni can, as shown in Fig. 1. Seven diffusion couples (DCs) were obtained in one diffusion multiple and denoted as DC1 to DC7, as highlighted by the black lines in Fig. 1. Four assembled diffusion multiples were hot isostatic pressed (HIPed) at 1180°C/150 MPa for 8 h to achieve good interfacial contact among the base alloys. Thereafter, the diffusion multiples were sealed in a vacuum quartz jar to avoid oxidation of the sample surface during heat treatment process. Subsequently, the samples underwent solution heat treatment at 1180°C for 1000 h to form a continuous composition gradient. Finally, four kinds of aging treatment 700°C/2000 h, 800°C/2000 h, 900°C/1000 h, and 1000°C/1000 h were used on four same diffusion multiples, respectively. Considering the different in aging heat treatment, the prefix of WX is used to distinguish the DCs with same combination but different aging heat treatment, where X is the aging temperature. For example, W800 DC1 refers to the DCs aged at 800°C, and composed of pure Ni and W1 alloy.
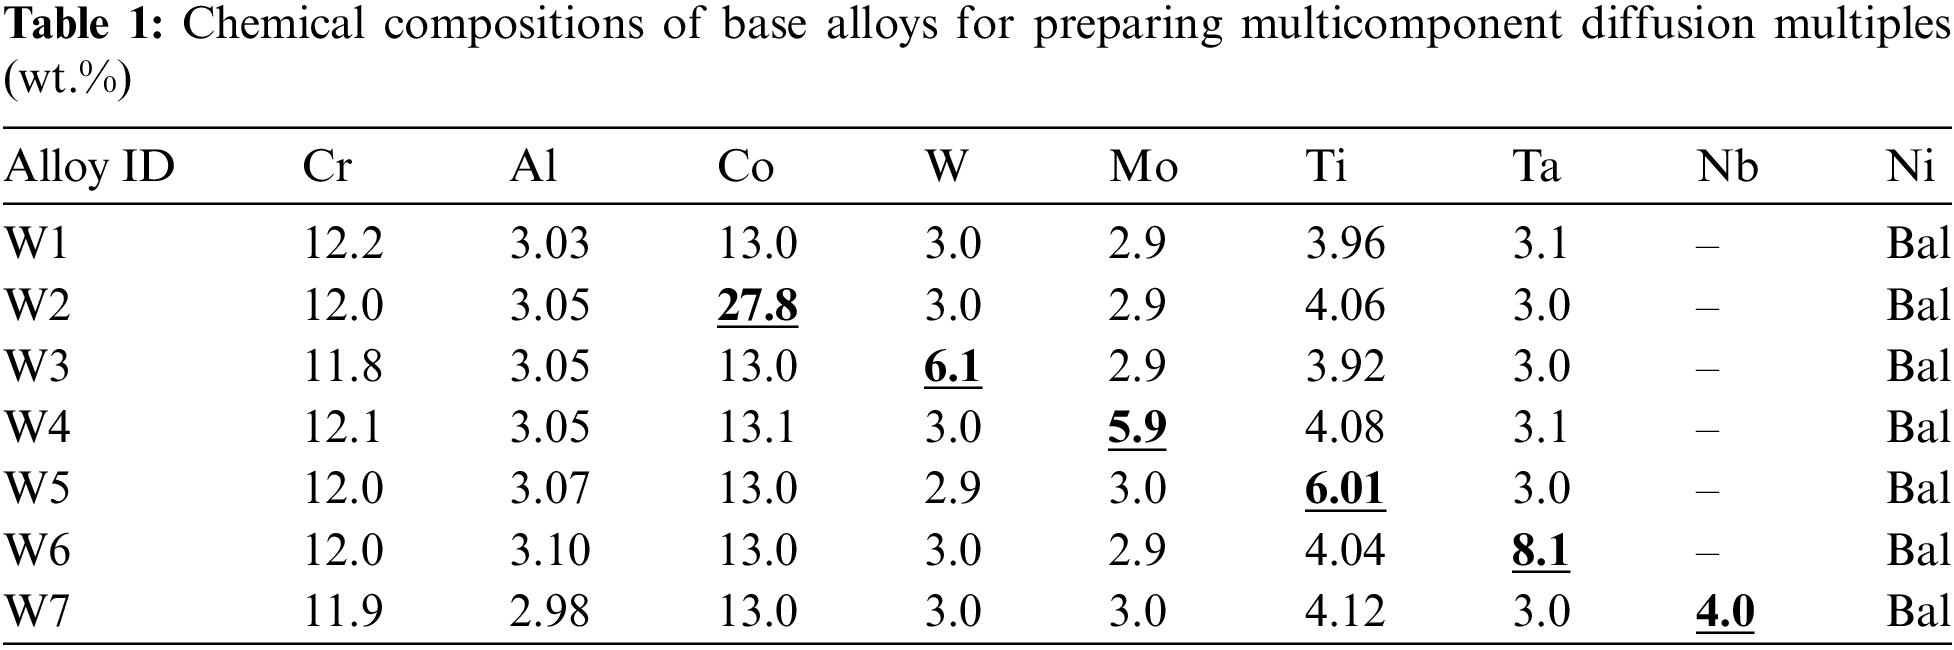
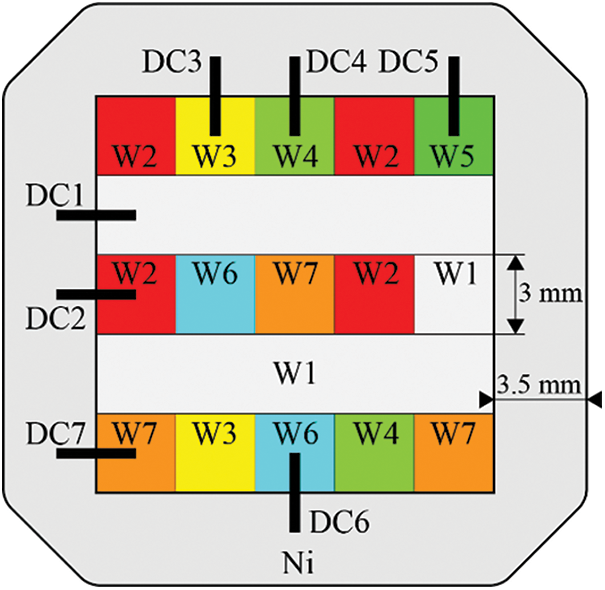
Figure 1: Schematic diagram of multicomponent diffusion multiple
The compositions of DCs were detected using Micro-XRF (X-ray fluorescence) device Bruker M4 Tornado due to high characterization efficiency compared with Energy Dispersive Spectrometer (EDS) and Electron Probe Micro Analyzer (EPMA). Then, the microstructure was characterized by a ZEISS SUPRA 55 scanning electron microscope (SEM) equipped with an automated photographic platform. The specimens for SEM observation were prepared by polishing and etching in the solution of 33 ml H2O + 33 ml CH3CH2OH + 33 ml HNO3 + 1 ml HF at room temperature for 10–20 s. Ultimately, the hardness of different zones was measured by the automatic microhardness tester Qness Q10a, and indentation pitch was set at 100 μm to avoid the influence of adjacent indentations.
The yield stress σy of alloy can be calculated by
where
where
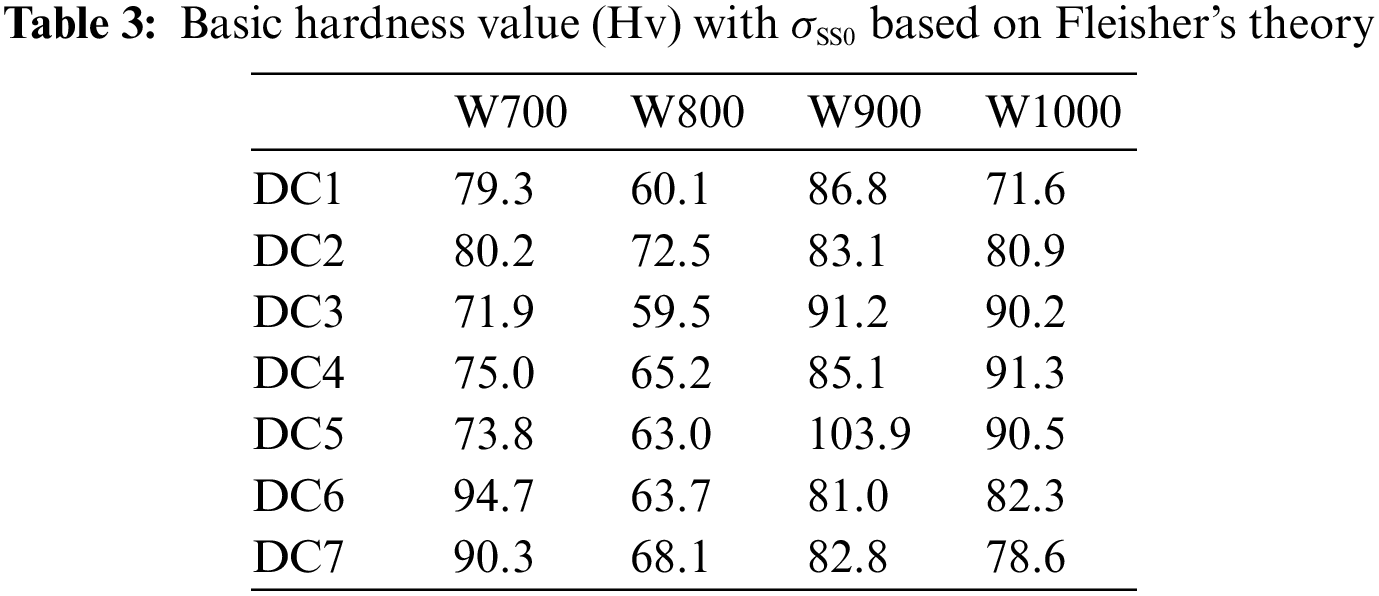
Since the hardness of the micro-zones at distance equaling to 0 μm has almost no the SSS effect, the basic hardness
where
To evaluate the effect of the SSS, Fleisher’s theory [17,19] employed the average value of interaction force between solute atoms and mobile dislocation. Hence, the increment of critical stress caused by SSS is given by
where C is a constant, F is the force of the solute atoms to hinder the movement of the dislocation, b is the Burgers vector, T is the dislocations line tension, c is the concentration of solute atoms. However, Labusch’s theory [17,20] considered the effect of average field distribution of obstacles on mobile dislocation, and the increment of critical stress is defined as
where w is also a constant. Eqs. (4) and (5) can be simplified to
where
SSS coefficients
or
The fitting of SSS coefficients in Section 3.2 is implemented with leastsq function in the scipy.optimize package within Python 3.7.7 environment.
There are many effective models in the machine learning community, and different models exhibit respective advantages and disadvantages. Therefore, several commonly used ML algorithms were employed to quantify the SSS of nickel-based superalloys, including Linear Regression (LR), Support Vector Regression (SVR), K-Nearest Neighbor (KNN), Random Forest (RF), Gradient Boosting Decision Tree (GBRT), and ANN.
LR is a simple linear model, which is widely used in the prediction of objective properties owing to it can obtain specific expressions to clearly illustrate the relationship between input features and target performance. Especially, LR model can effectively reduce the risk of overfitting by introducing a regularization term based on simple multiple linear regression.
SVR is an important nonlinear regression model in a machine learning community, which could predict the objective properties by minimizing the cost functions. Especially, different kernel functions can be used in the SVR model to map the feature variables from low dimensional space to high dimensional space, including radius basis function (RBF) kernel, linear kernel, polynomial kernel, and sigmoid kernel. Compared to LR, SVR can effectively solve nonlinear regression problems and has a stronger generalization ability. In this paper, the RBF kernel is adopted during the experiments.
K-Nearest Neighbor is a non-parametric supervised learning method first developed by Evelyn Fix and Joseph Hodges. It solves the regression problems by finding the k nearest neighbors of a sample and assigning the average value of an attribute of these neighborhoods to the sample.
RF is one of the ensemble regression models, which consists of many trees. Firstly, the bootstrap resampling technology is used to extract some samples from the original sample space to construct the decision trees. Then, each of decision trees is conducted to predict the objective properties. Finally, the predicted values were calculated by using the average value of all decision tree predictions. In addition, the RF can provide the interpretability of ML model by evaluating the importance of each input feature's contribution to the output feature variable on each decision tree.
GBRT is another ensemble model with a regression tree as the base learner. Different from the RF, each tree of GBRT learns from the residuals of all previous trees and the negative gradient value of the loss function was used to approximate the residual. Finally, the GBRT model accumulates the predictions of all regression trees as the final prediction result.
ANN is a traditional model in the machine learning community and has been widely used to quickly construct the relationship of composition, microstructure and properties in the field of material science. Generally, the ANN consists of three major components, including input layers, hidden layers, and output layers. Input layer is commonly the feature variable; the hidden layer is used to extract and process the input features into another dimension space by the neurons; the output layer is the objective performance.
In order to improve the interpretability and generalization ability of ML models, physical features based on empirical knowledge are usually introduced as input features. As is known to all, the SSS of nickel-based superalloys originates from the elastic interactions between the local stress fields of solute atoms and mobile dislocations, including the elastic misfit and atomic size misfit [7]. Hence, the atomic misfit and modulus misfit were added as the physical descriptors to the SSS dataset to enhance the performance of ML models. The atomic misfit and modulus misfit can be expressed as
where n is the number of constituent elements, xi, ri, and Gi are the atomic fraction, atomic radius (in nm), and shear modulus (in GPa) of the ith element, respectively.
In the following, to avoid the differences in orders of magnitude, each feature of the input data is scaled and normalized by the Min-Max normalization method, which is defined as
where x and
Furthermore, to evaluate the performance of these ML models, three different indicators, including root mean squared error (RMSE), mean absolute error (MAE) and R-square (R2) are proposed. Given
Here a lower RMSE or MAE and a higher R2 mean a better ML model.
In this work, 169 data points after selection (mentioned in Section 3.2) from W800, W900, and W1000 MCDMs were used as the train set, 49 data points from W700 multicomponent diffusion multiples were used as test set. Moreover, to prevent the overfitting of ML algorithms, the grid search and ten-fold cross validation (CV) were used to tune the optimum hyperparameters of ML models. Finally, the ML models were constructed and compared with the physical models. All the ML algorithms mentioned above are implemented in the Scikit-learn package within Python 3.7.7 environment.
3.1 Composition-Microstructure-Microhardness
The detected compositions of DCs in MCDM W700, W800, W900, and W1000 were shown in Fig. 2. To obtain smooth composition-distance profiles, the superimposed Boltzmann function was used
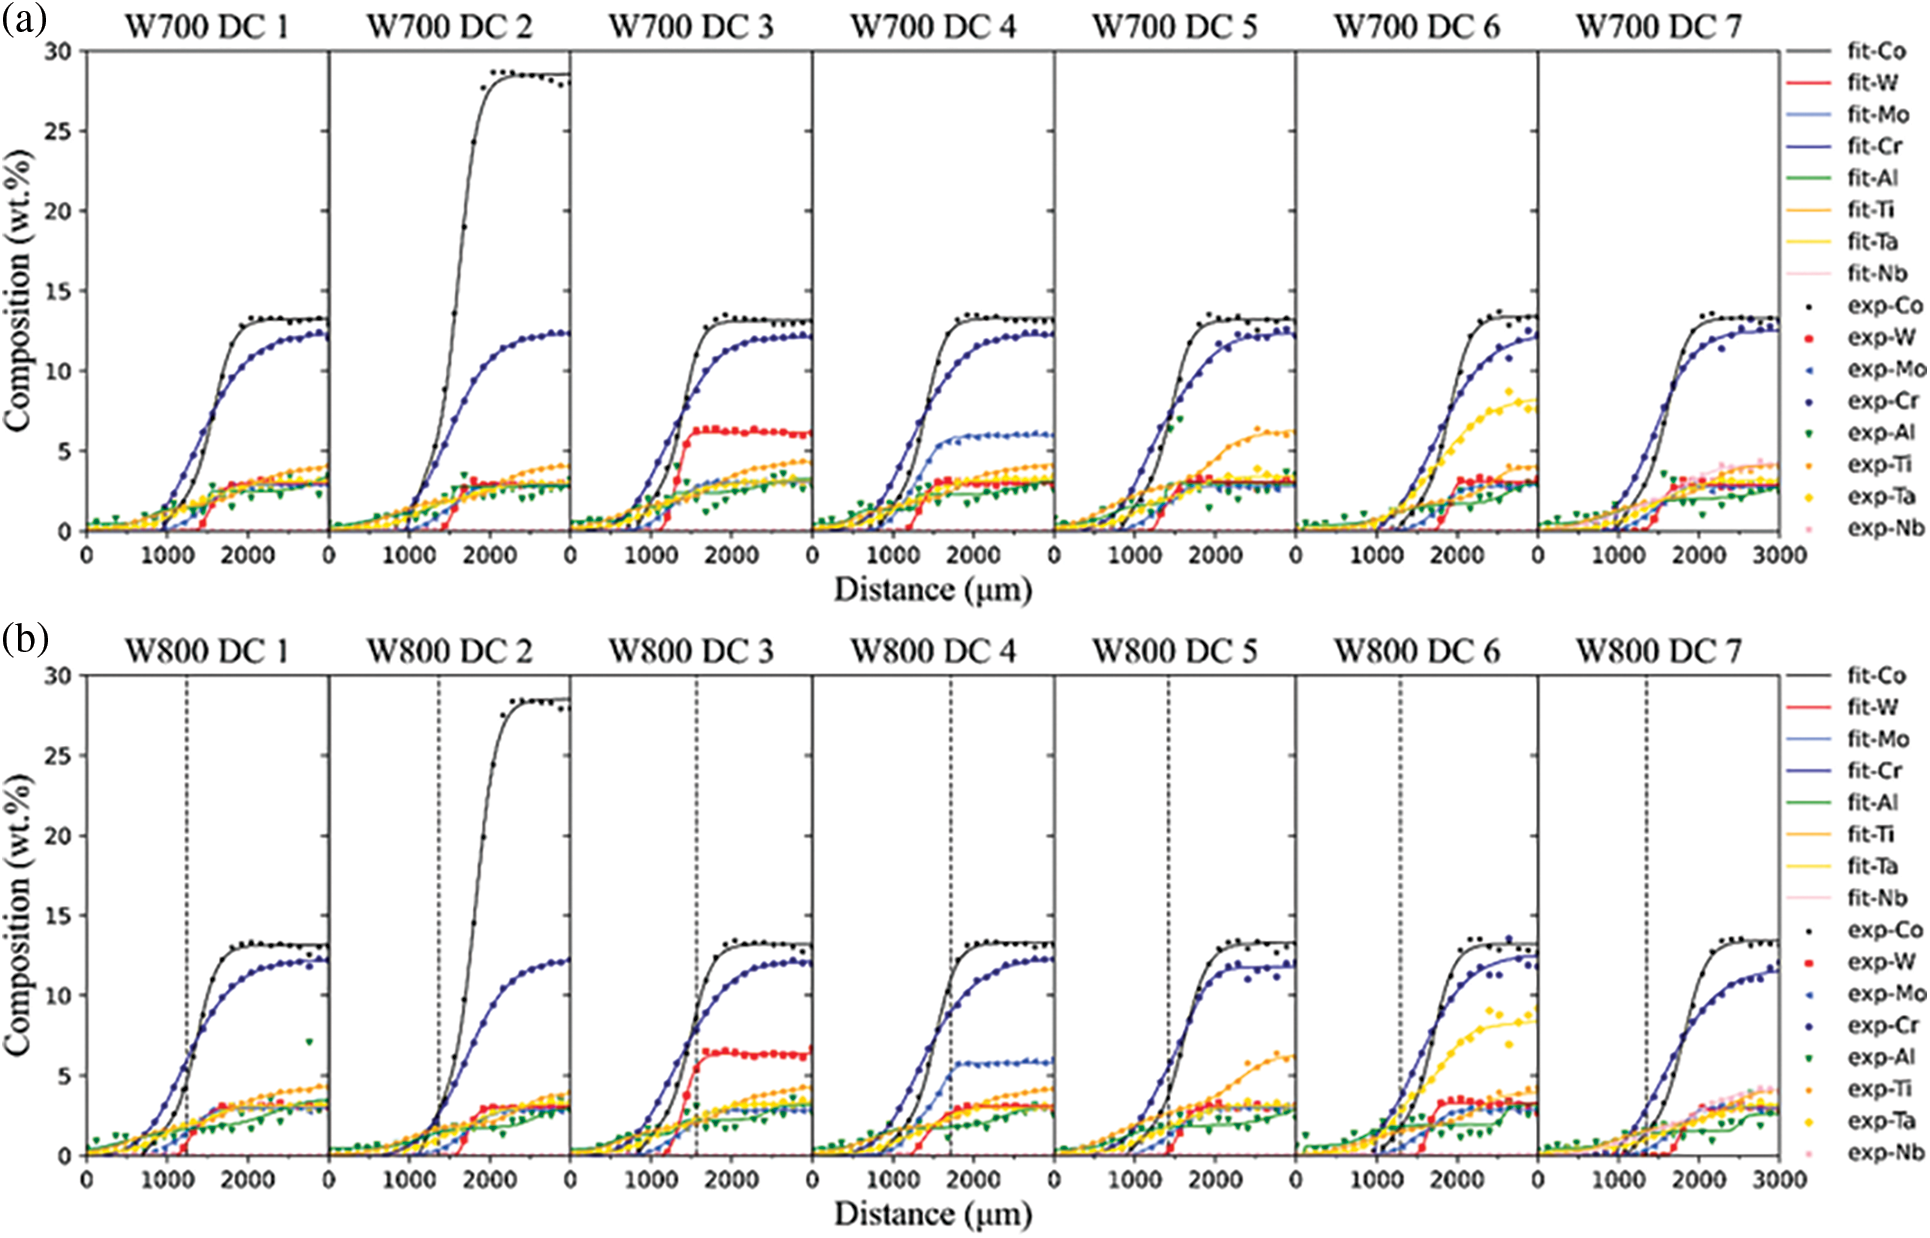
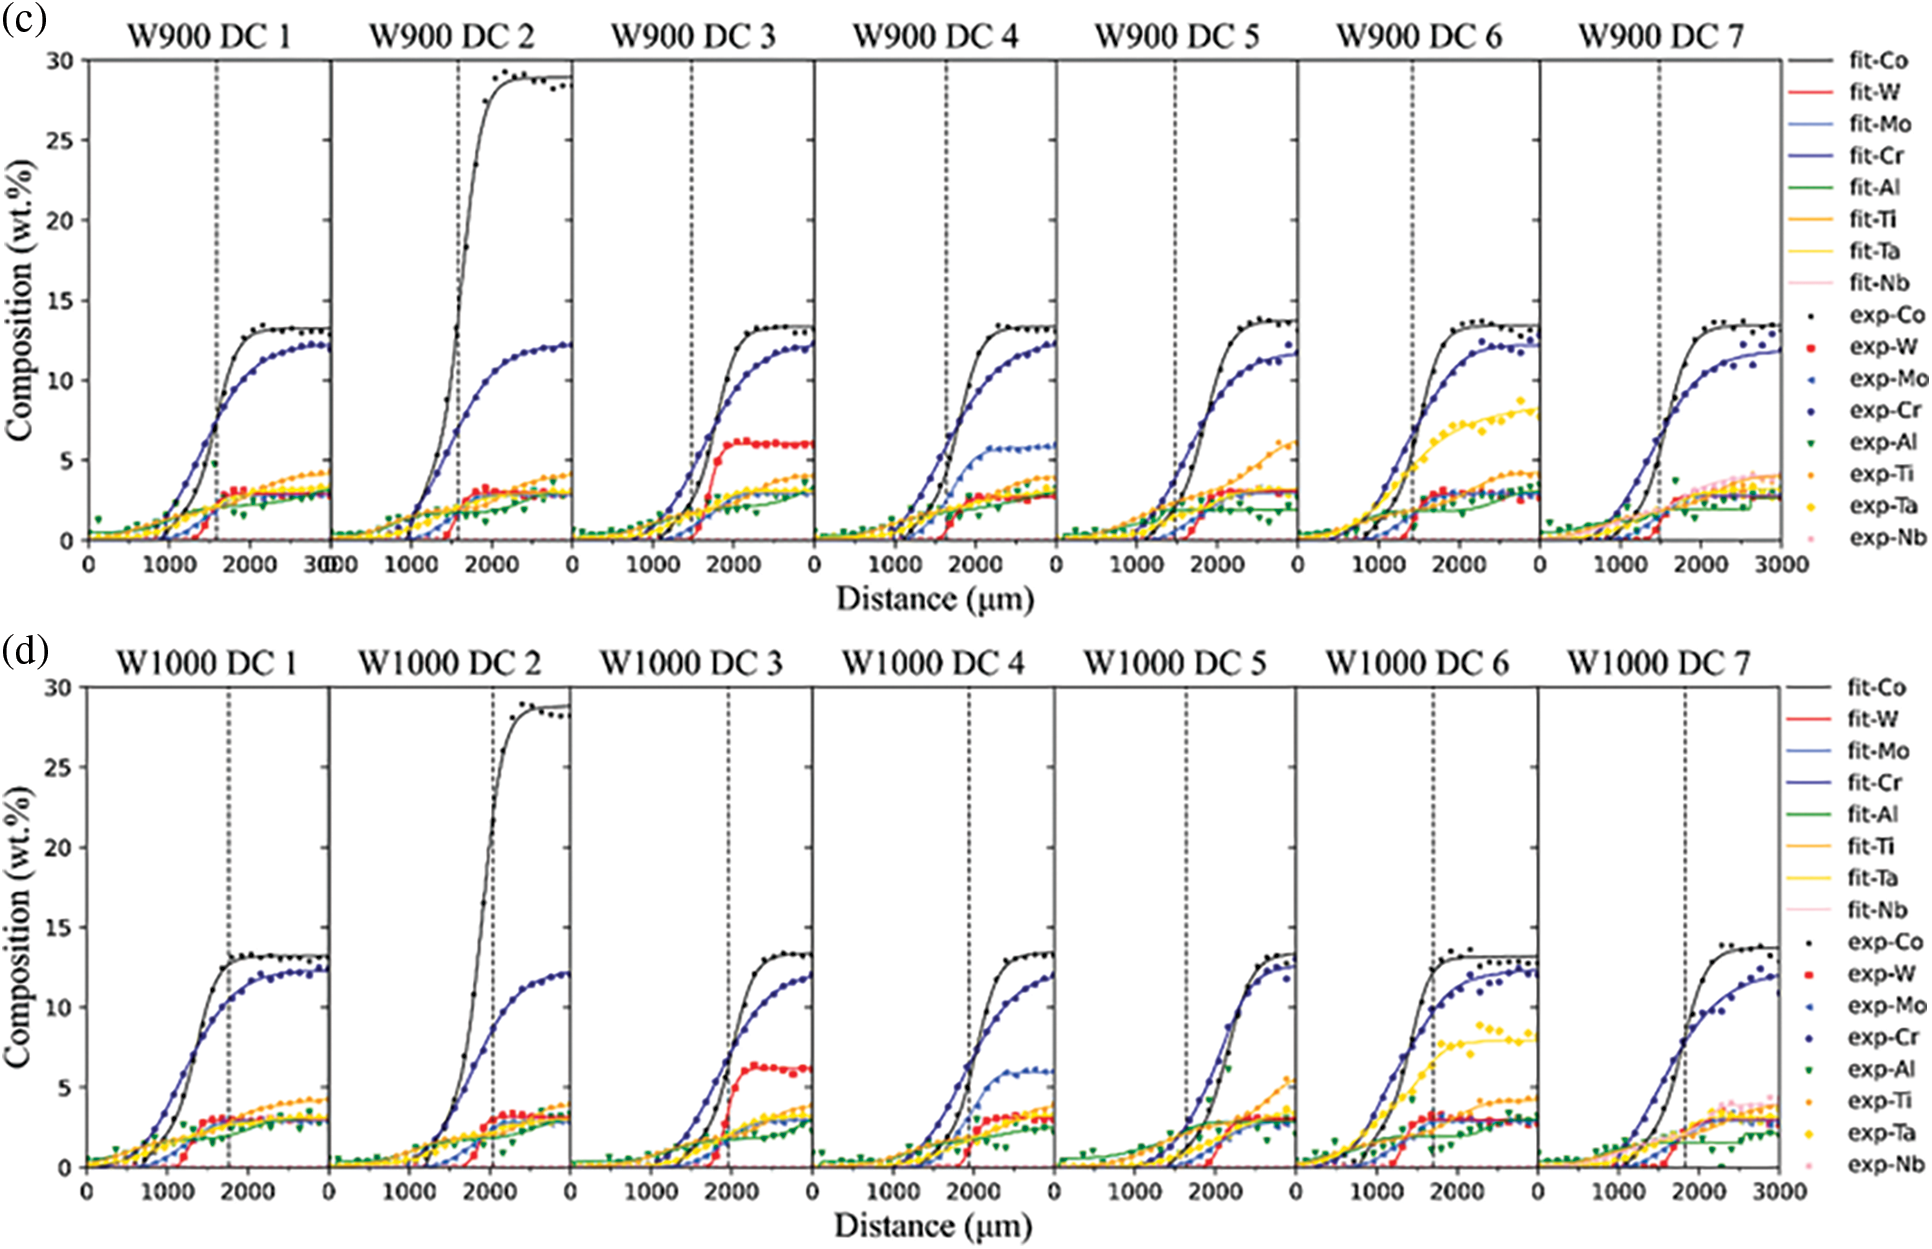
Figure 2: Comparison between the experimental (denoted in symbols) and fitted (denoted in lines) composition-distance profiles of DCs: (a) W700 DC1-DC7; (b) W800 DC1-DC7; (c) W900 DC1-DC7; (d) W1000 DC1-DC7
where n is the number of the Boltzmann functions used,
The existence of the γ′ phases, the geometric close-packed (GCP) phases, and the topological close-packed (TCP) phases will interfere with the quantification of SSS. Hence, the hardness of single γ phase regions was selected to avoid the influence of other phases. Fig. 3 shows the single γ phase region of W800 DC1 from 0 to 1360 μm, and the rest is a γ + γ′ dual phase region. Besides, the boundary between γ and γ + γ′ region of W700 DC1-7 is not defined due to the unexpected corrosion. Therefore, the regions of W700 DC1-DC7 from 0 to 1200 μm are assumed to be a single γ phase region.
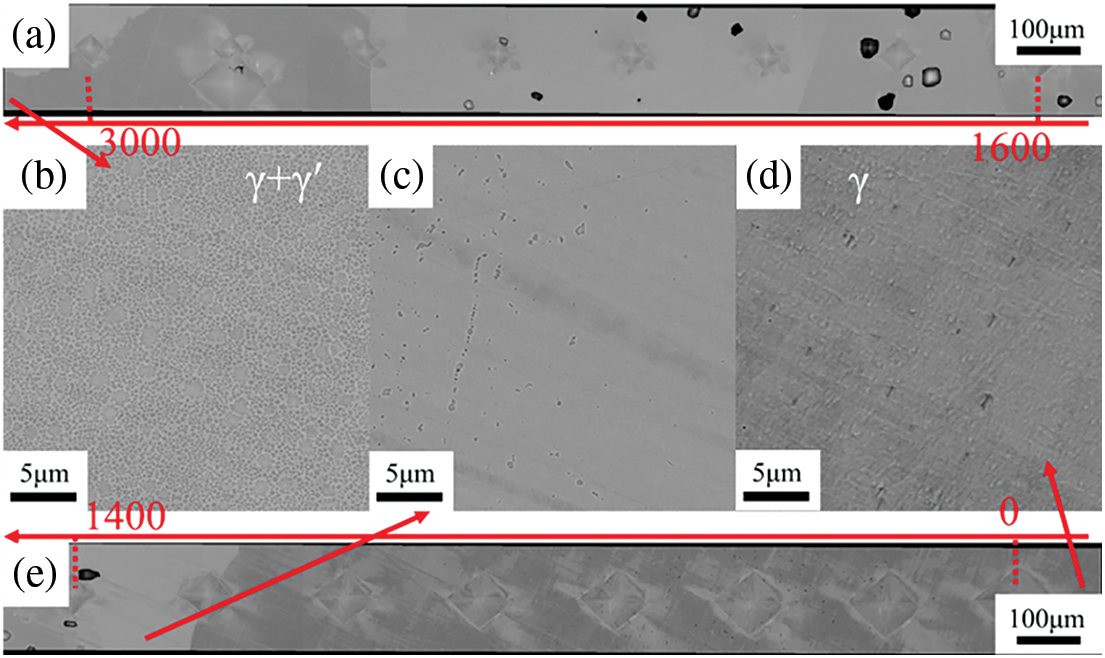
Figure 3: Secondary electron (SE) images of W800 DC1: (a) distance from 1600 to 3000 μm (b) γ + γ′ dual phase region (c) distance equal to 1360 μm (d) single γ phase (e) distance from 0 to 1400 μm
The single γ phase regions of each diffusion couple were detected via the SEM images, as shown in Fig. 4. Thereby, the microhardness values of single γ phase regions were obtained. The difference in microhardness can be attributed to the SSS caused by the difference in composition. Hence, the composition and microhardness can be used to quantify the SSS in the following sections.
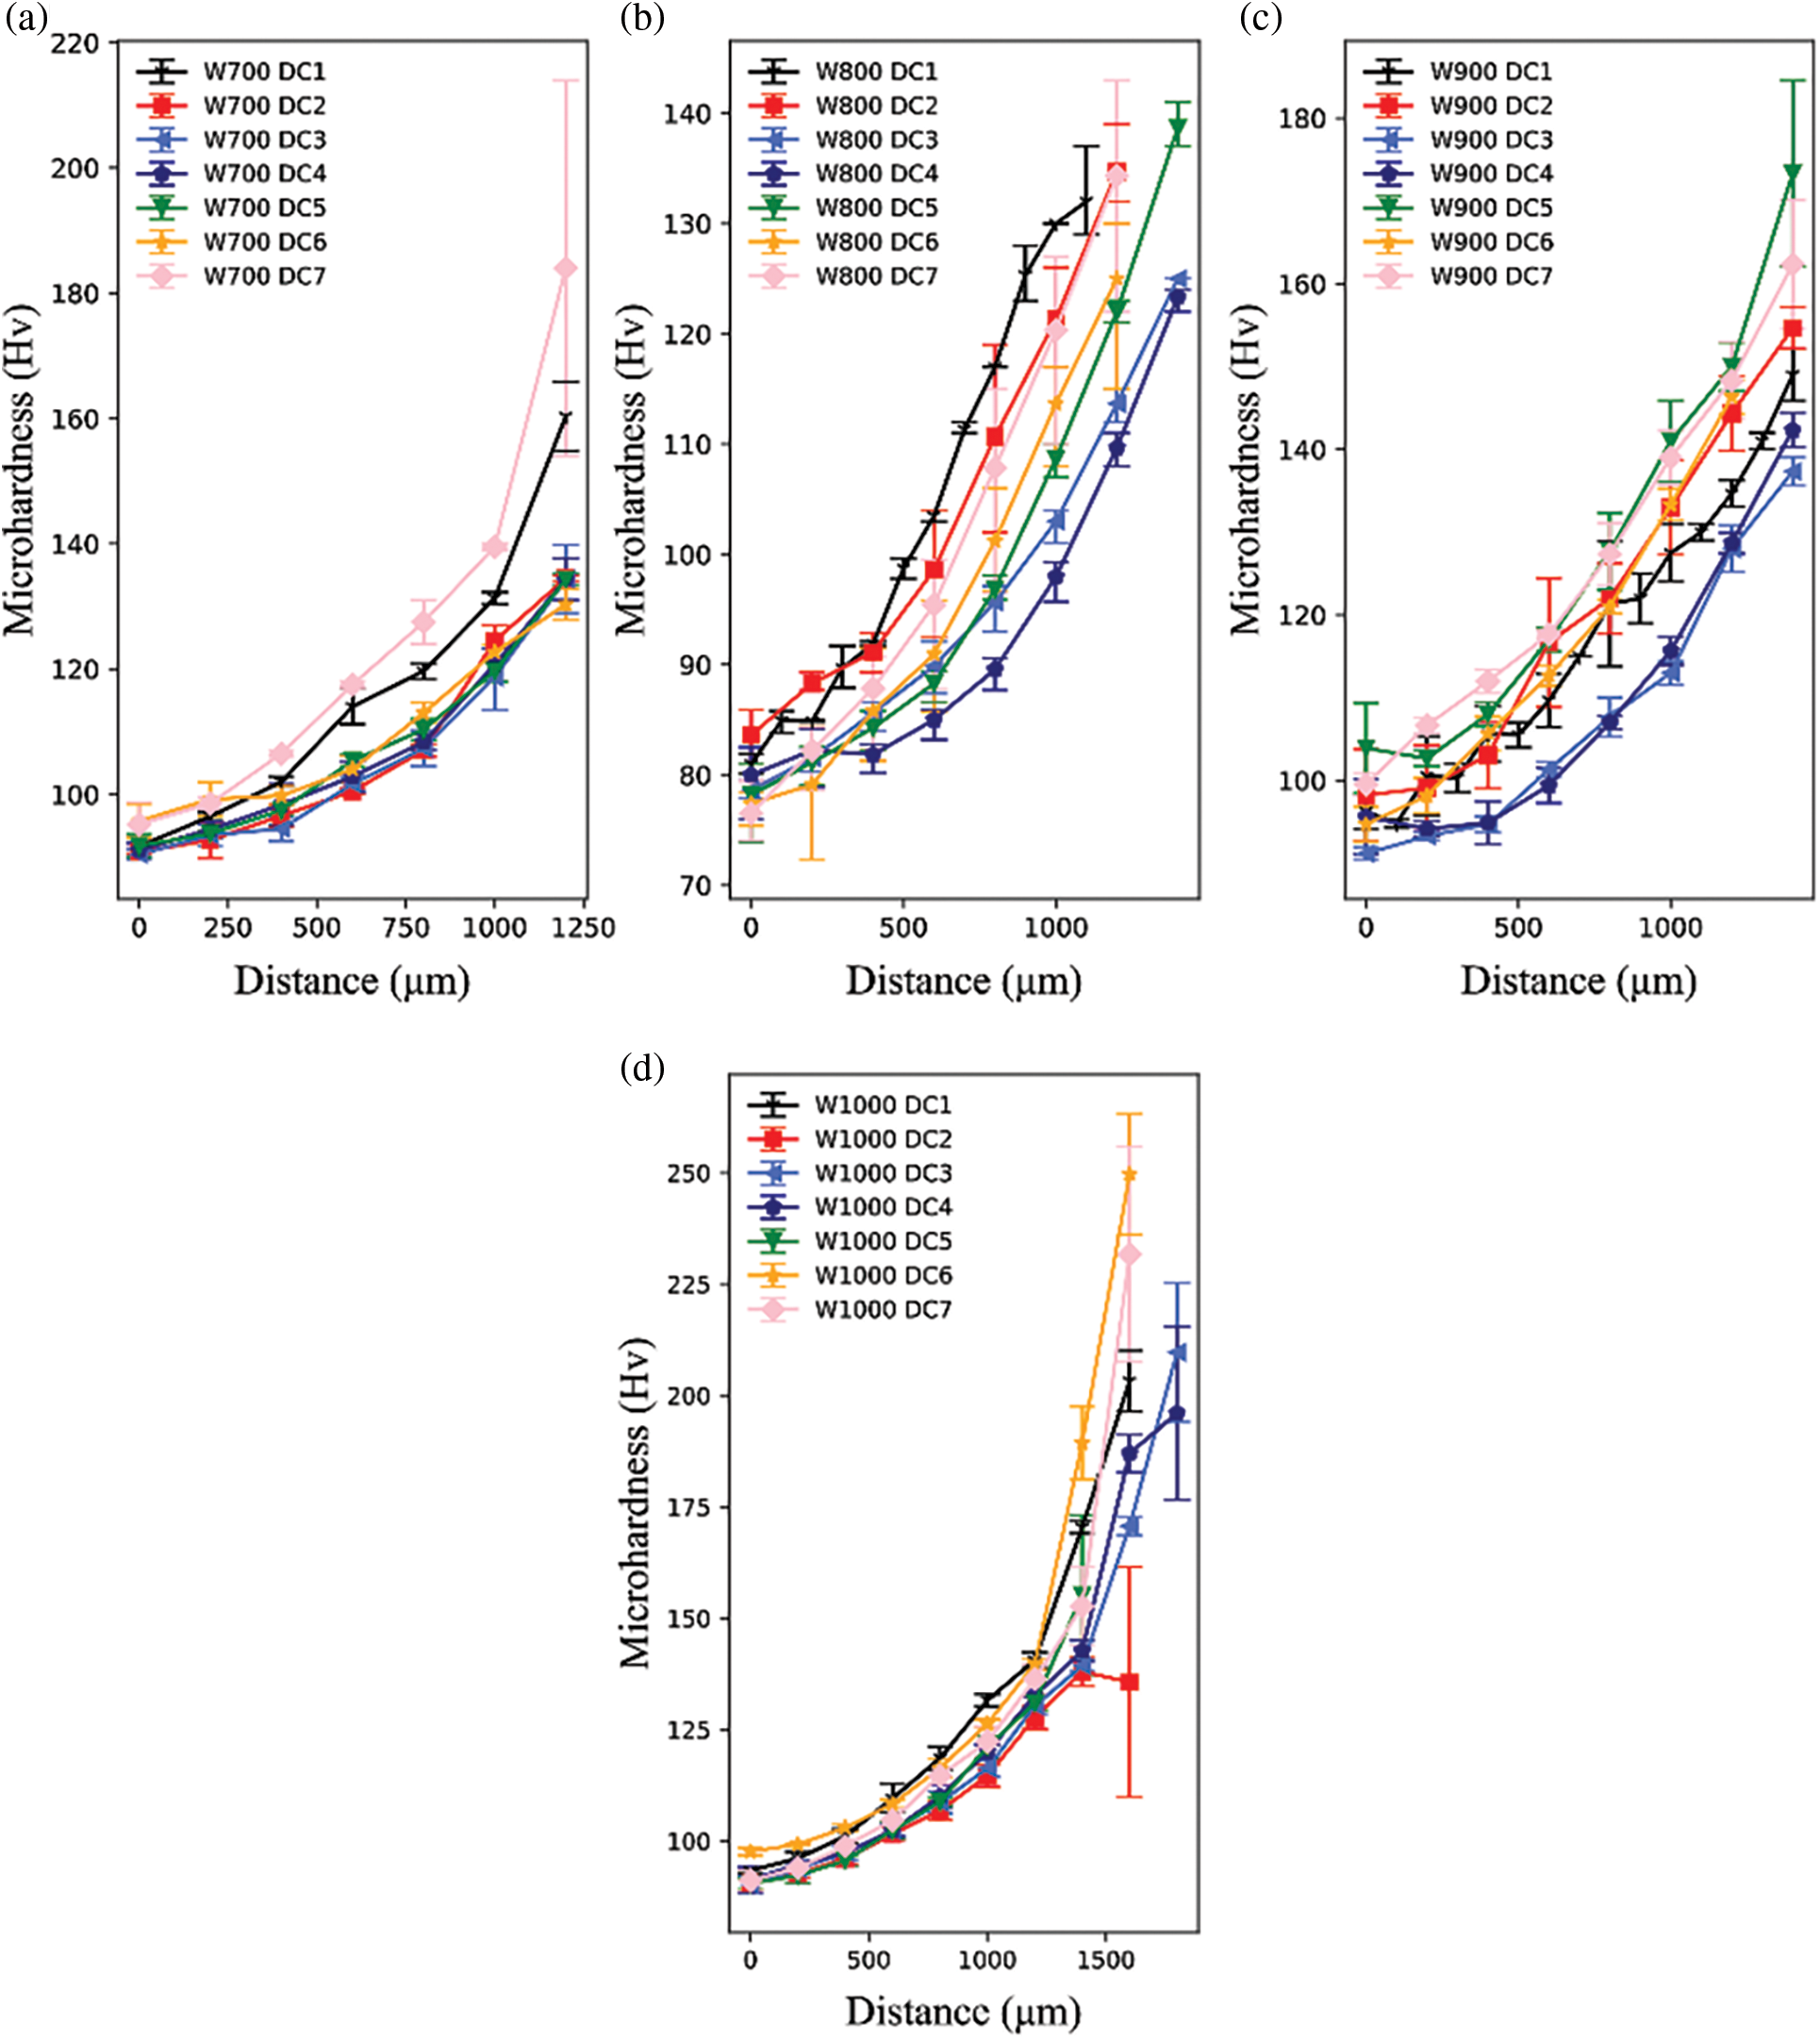
Figure 4: Distribution of microhardness in single γ phase regions of DCs: (a) W700 DC1-DC7 (b) W800 DC1-DC7 (c) W900 DC1-DC7 (d) W1000 DC1-DC7
3.2 Quantification Based on SSS Models
As mentioned in Section 2.2, the basic strength is treated as a whole contributed by the strength of pure matrix and the effect of grain boundary strengthening. The contribution of grain boundary strengthening to the total yield stress can be given by the Hall–Petch relationship
The microhardness of MCDM W800, W900, and W1000 single γ phase regions DCs was used to estimate the traditional SSS models. In addition, 14 sets of data with a relative standard deviation (RSD) of hardness larger than 0.06 were filtered out, as shown in Figs. 5a–5c show the comparisons between experimental and fitted SSS values based on Fleisher’s theory and Labusch’s theory, respectively. It can be observed that the predicted SSS values agree well with experimental values. The R2 was used to compare the accuracy of prediction. As shown in Figs. 5b and 5c, Labusch’s theory can better describe the SSS of nickel-based superalloys with higher accuracy.
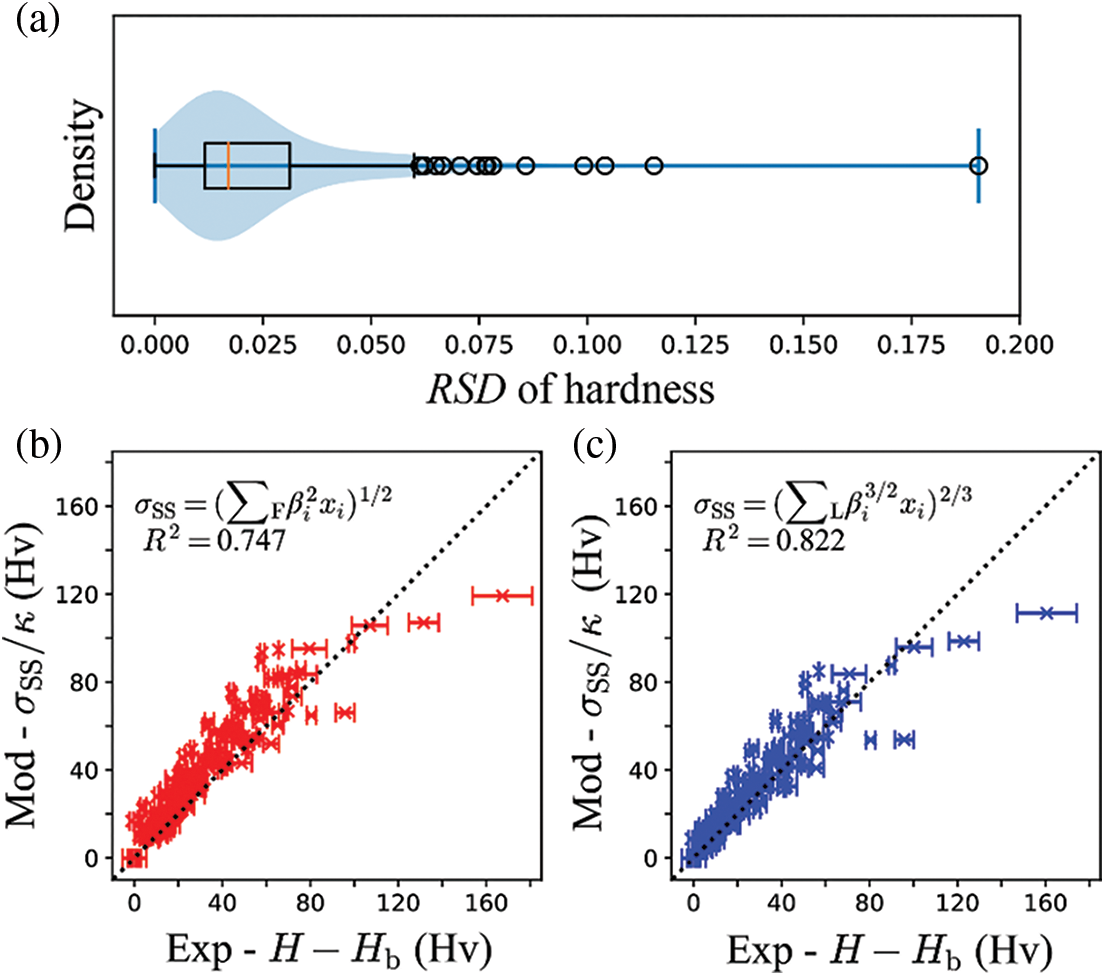
Figure 5: (a) The relative standard deviation (RSD) of the hardness dataset. Comparisons between experimental data and hardness increment based on (b) Fleisher’s theory and (c) Labusch’s theory
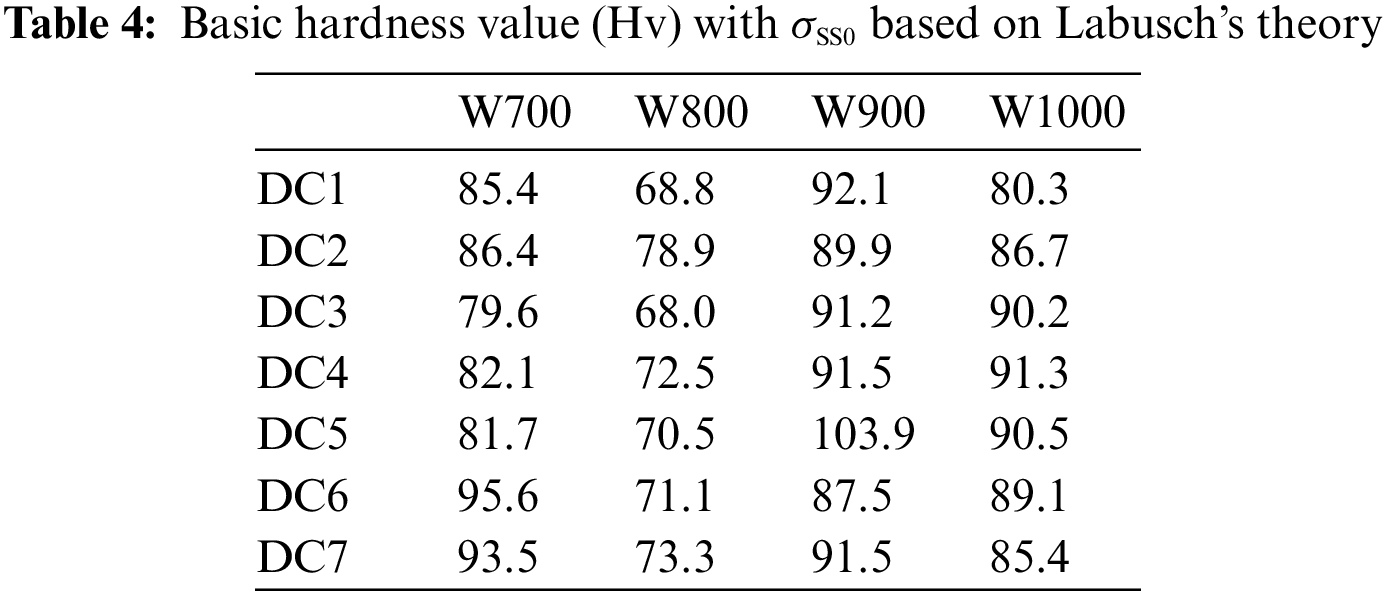
To further improve the performance of the model, the data from DCs in MCDM W800/W900/ W1000 is used to refit the SSS coefficients based on Labusch’s theory. It should be pointed out that the SSS coefficients of Co, Mo, and Cr were set to be the same as Table 4 due to excessive deviation, and the remaining fitting coefficients were listed in Table 5. It can be seen that W shows a stronger SSS effect, while Al, Ti, Ta, and Nb show a weaker SSS effect than the SSS coefficients in Table 4. Fig. 6a shows the comparison between experimental SSS values and predicted values using the fitted SSS coefficients. Moreover, the model with fitted coefficients achieved a higher accuracy with R2 of 0.847.
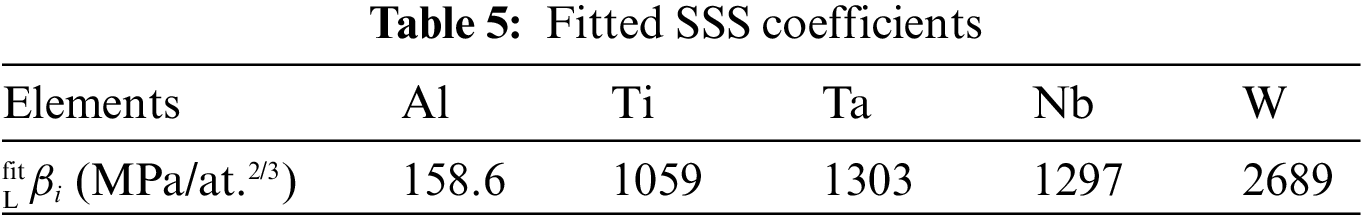
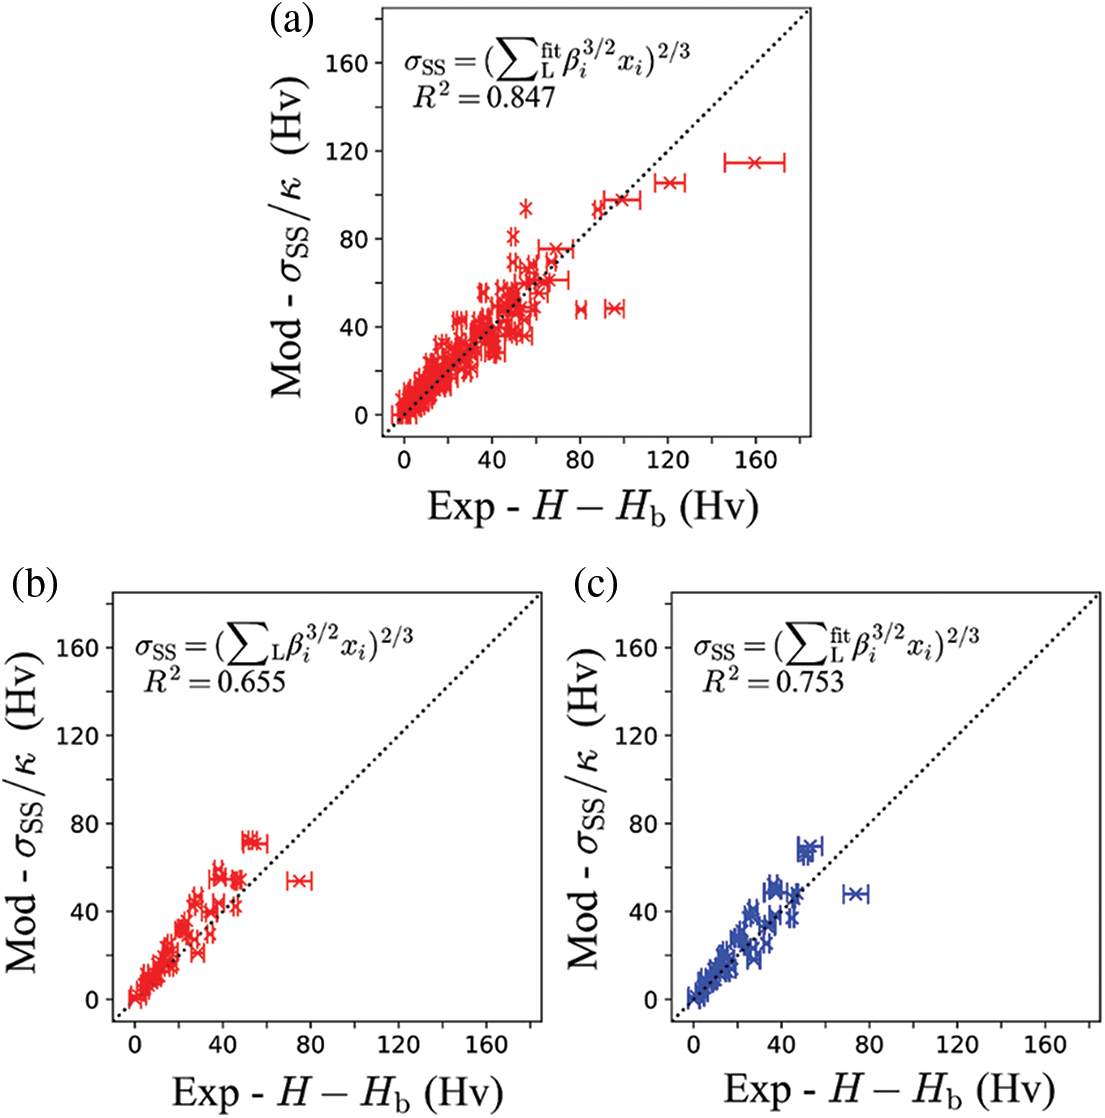
Figure 6: Comparison between experimental and predicted SSS values: (a) fitted SSS coefficients with experimental data from MCDM W800, W900, and W1000; (b) original SSS in Table 4; (c) fitted SSS coefficients with experimental data from MCDM W700
The data from DCs in MCDM W700 were used to evaluate the generalization ability of the fitted SSS coefficients. The comparisons between experimental and predicted values based on Labusch’s theory using original coefficients and the fitted coefficients were performed, as shown in Figs. 6b and 6c. As can be seen, the model with the fitted coefficients exhibits higher accuracy compared with original coefficients.
3.3 QUantification Based on ML Models
All the 10 features are considered to be associated with SSS. To identify the importance of the feature variables, RF is conducted on the SSS train set with the two calculated physical descriptors. The feature importance for each feature is shown in Fig. 7. It is found that the descriptors,
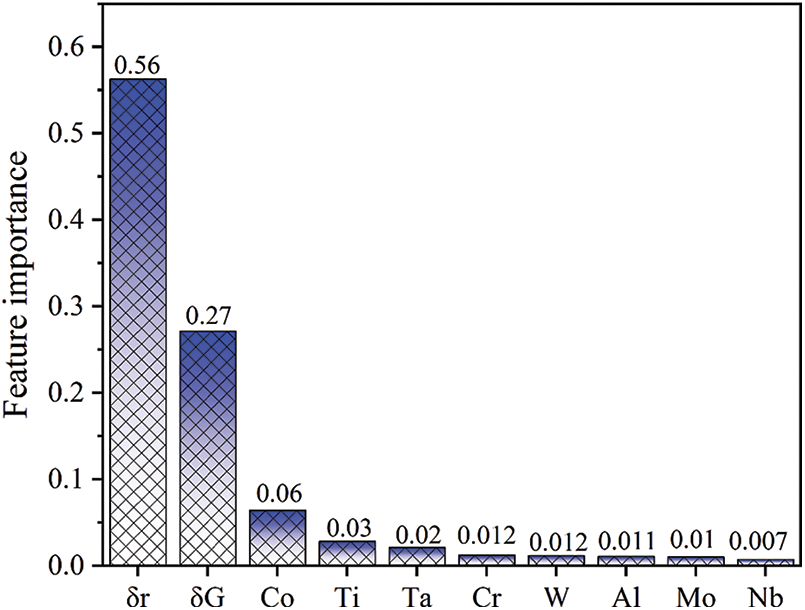
Figure 7: The ranking of feature importance of composition features by RF
To further confirm the effect of descriptors on SSS, six ML models (LR, SVR, KNN, RF, GBRT and ANN) were used to predict the SSS train set with and without descriptors, respectively. The average RMSE and MAE of 10 iterations of six ML models on the train set with and without descriptors are shown in Table 6. It can be seen that the prediction accuracy of the six ML models on the train set with two descriptors is only slightly better than that without descriptors.
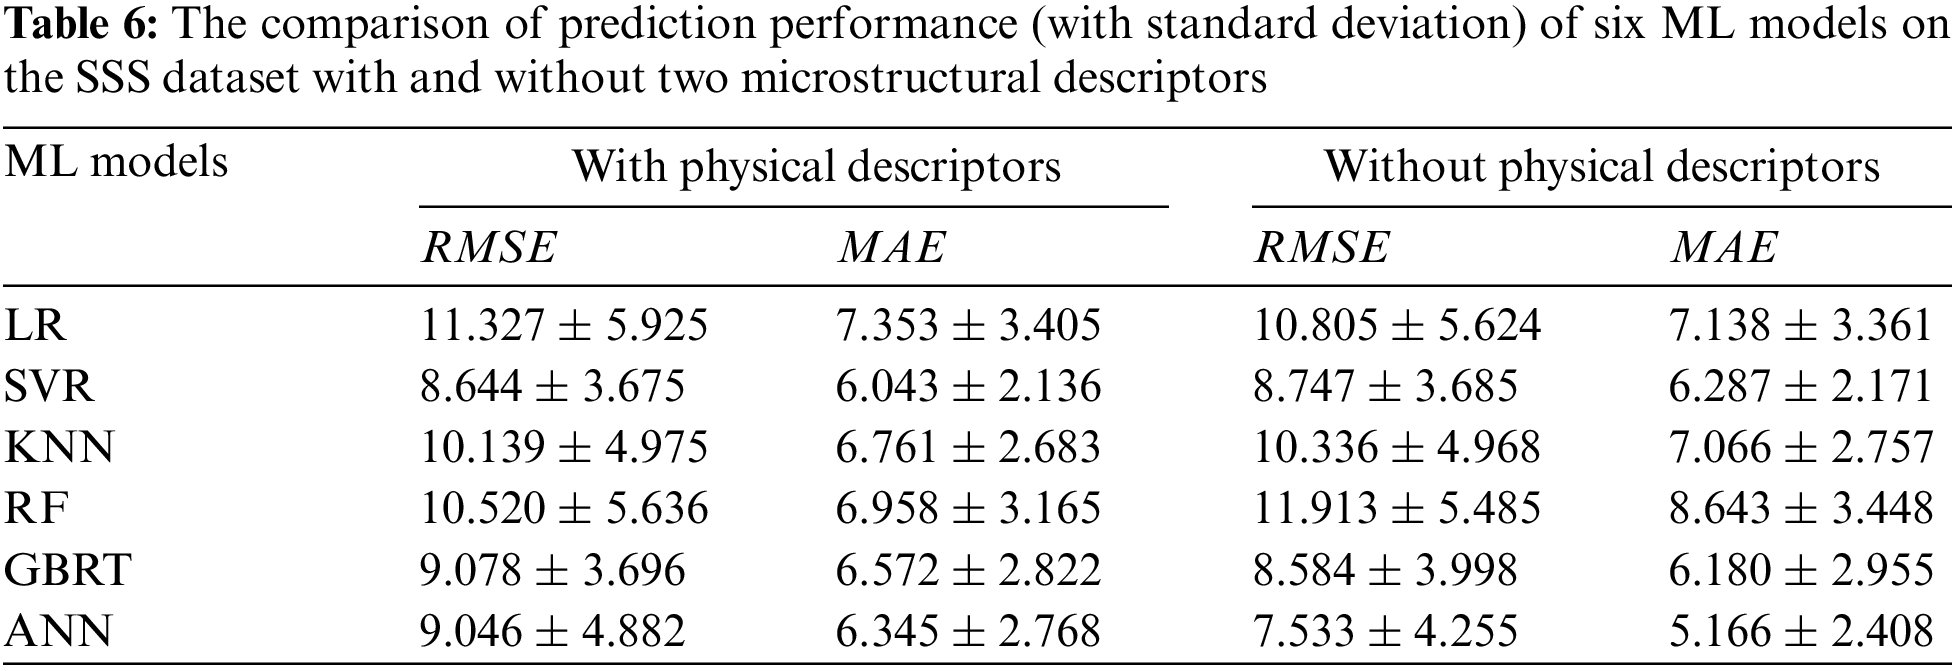
Fig. 8 shows the comparison between the experimental SSS values and predicted values by six ML models. It can be seen that the predicted SSS value is in good agreement with the experimental values, indicating the ML models are adequate for predicting the SSS values of nickel-based superalloys. Compared to the fitted physical model with R2 of 0.753, the ML models exhibit equivalent or higher accuracy.
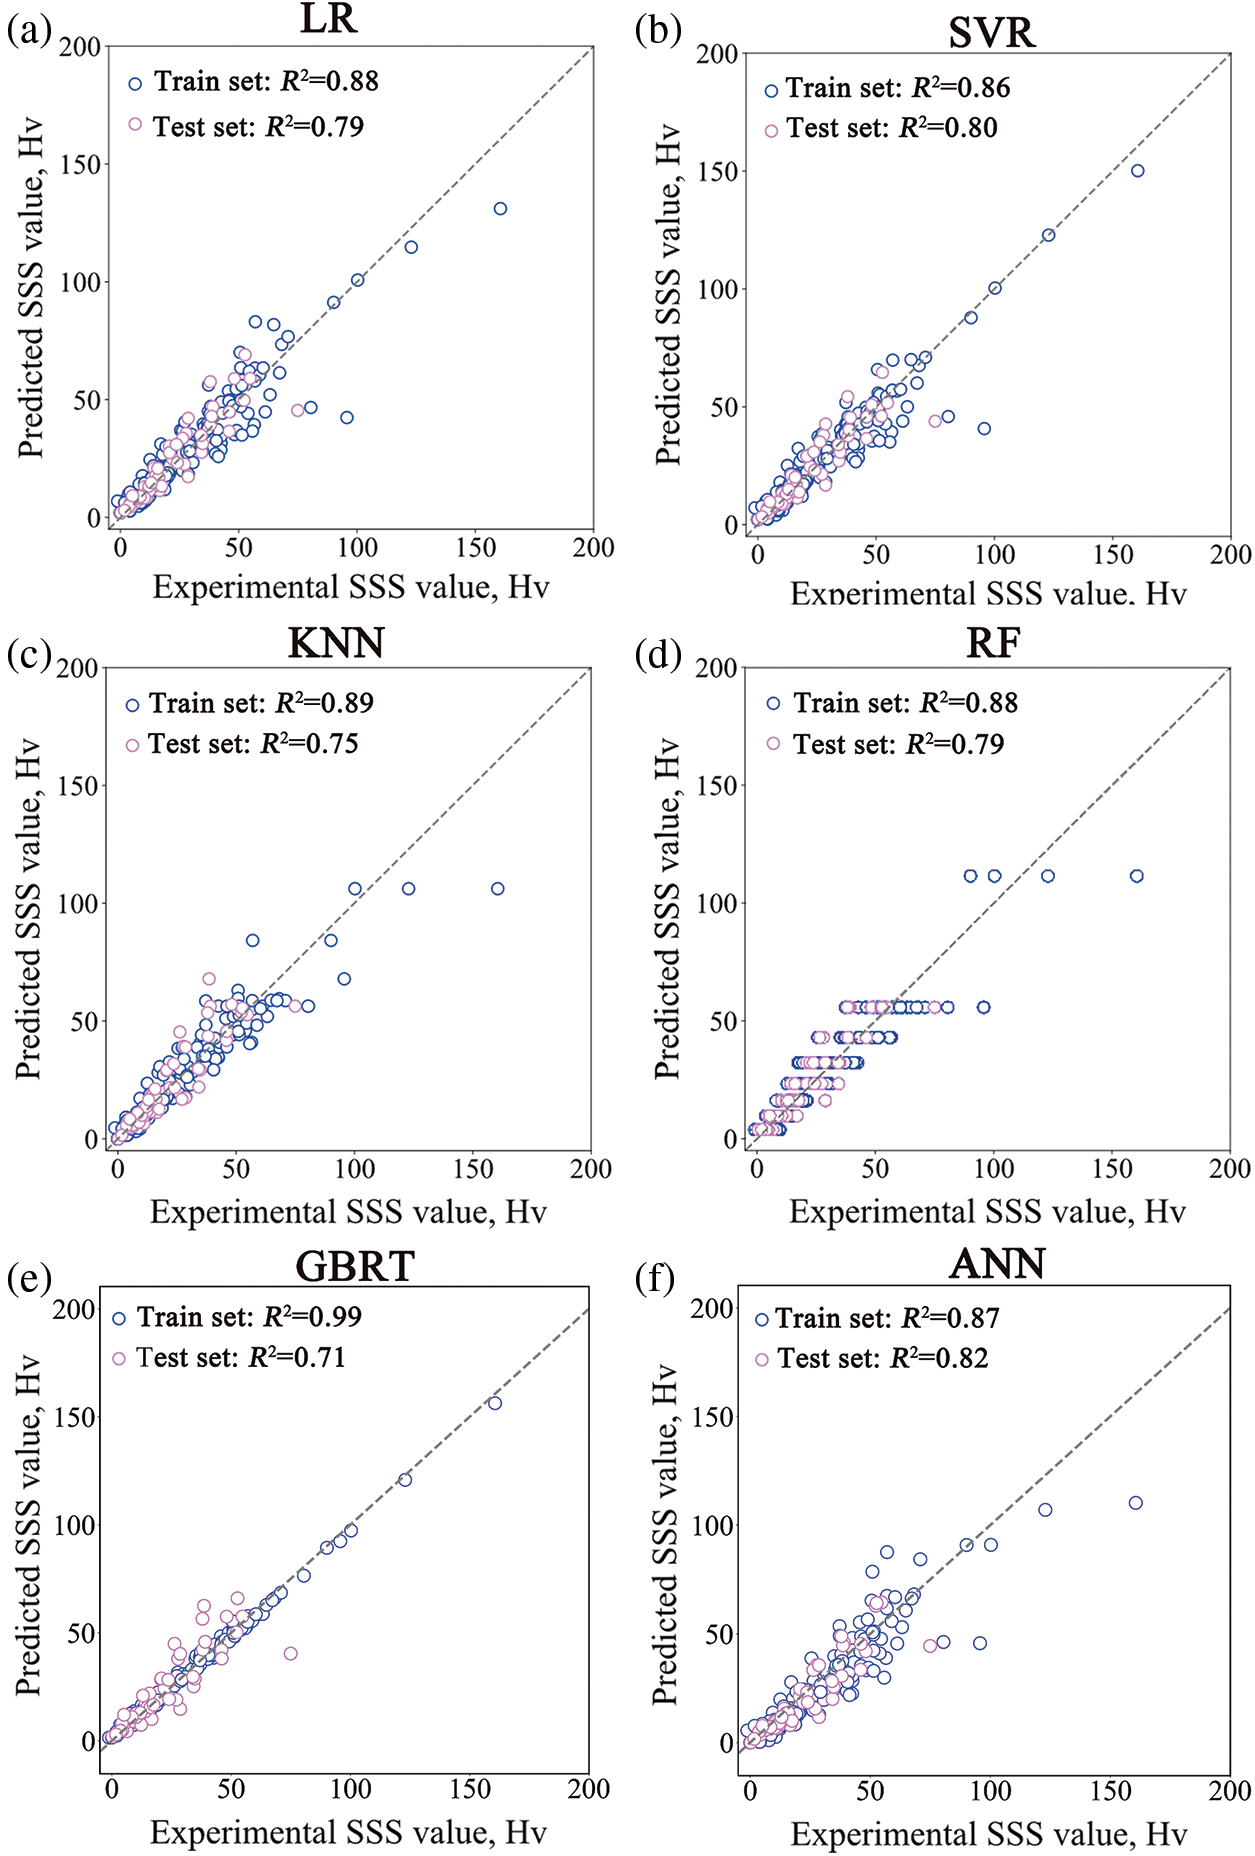
Figure 8: Predictive performance of the six ML models on the SSS dataset: (a) RF (b) SVR (c) KNN (d) LR (e) GBRT (f) ANN without descriptors
To understand the influence of alloying elements on SSS, the feature importance of alloying elements, and Pearson correlation coefficients between alloying elements and SSS were calculated to quantify the influence of alloying elements on SSS, as shown in Fig. 9. As can be seen from the Pearson correlation coefficients, the elements Al, Ti, Cr, Ta and Co have a strong relationship with SSS values. However, the Pearson correlation coefficients only reflect the linear relationship between alloying elements and SSS values. Therefore, the feature importance was adopted to further detect the nonlinear relationship between alloying elements and SSS values. A high feature importance value denotes that the feature plays a key role in the model, and the feature is significant in promoting the performance of the model. It can be found that the Ti, Cr, and Ta are important factors to the SSS values.
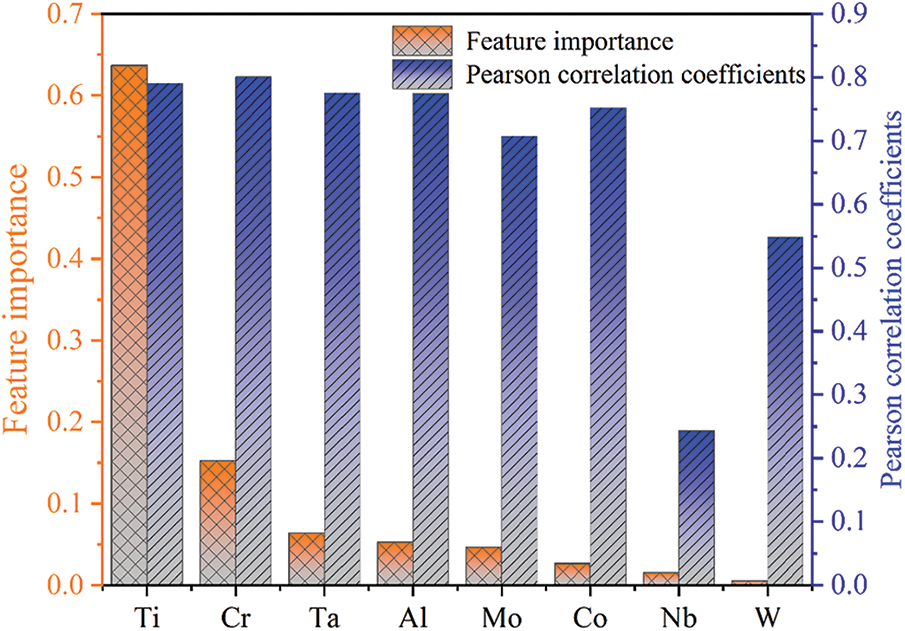
Figure 9: The Pearson correlation coefficients and feature importance of RF model without descriptors
Therefore, the quick mapping between compositions and SSS values can be completed by the ML models. This demonstrates the role of ML methods in strengthening model, and the potential in the research of other mechanisms such as particle shearing (mainly in yield strength model), gliding-climbing (mainly in creep model) and so on. Moreover, the combination of various mechanism models can be the test-free method to obtain mechanical properties, which can reduce the cost in sample preparation and characterization. Hence, applying ML models in strengthening model is significant in accelerating the design of alloy for development of turbine blades and disks in aircraft engines.
3.4 Effect of Alloying Elements Co and W on the SSS of Nickel-Based Superalloys Based on ANN Model
Understanding the influence of alloying elements on SSS is significance for alloy design novel alloys with high SSS effect. Due to the Co and W are strong solid solution strengthening elements in multicomponent nickel-based superalloys. Therefore, we focus on the influence of Co and W elements on the SSS values. Based on the composition of W1 base alloys, the contents of alloying elements Co and W were adjusted to investigate the influence of alloying elements on the SSS effect. Fig. 10 shows the variation of SSS values with different Co and W contents. It can be clearly observed that the SSS value increase with the Co content, and W element can also enhance the SSS effect when the Co content increase to a certain value. Hence, we could improve the content of Co to design novel solid solution strengthening superalloys with superior strength.
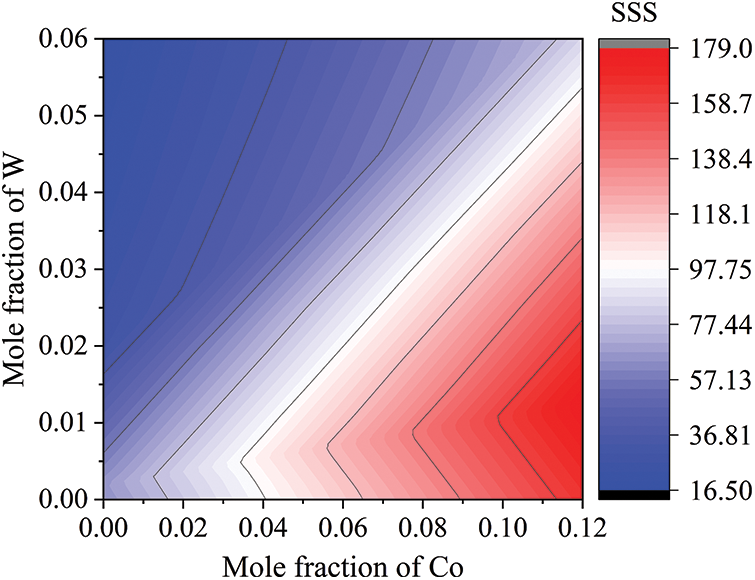
Figure 10: Interaction effects of the elements Co and W on the SSS of nickel-based superalloys
In conclusion, compared with the physical model, the ML models show great potential for material property prediction. Moreover, the ML methods can be easily extended to other situations, such as the prediction of hardness, yield strength, creep life, etc. Furthermore, the ML models can be continuously enhanced by adding the new calculated or experimental data.
The composition-microhardness data of single γ phase regions in 28 DCs were high-throughput obtained, and the traditional SSS models of nickel-based superalloys were compared. The fitted SSS coefficients were fitted to quantify the SSS. Meanwhile, several ML algorithms were used to further quantify the SSS. Based on the experimental and modeling results, the following conclusions can be drawn:
1. The Labusch’s theory can better describe SSS of nickel-based superalloys compared with the Fleisher’s theory.
2. The fitted SSS coefficients were obtained by fitting experimental data in the framework of Labusch’s theory, which indicates that the accuracy is higher than original coefficients.
3. ML models exhibit a higher accuracy compared with the physical models, and Ti element plays a crucial role in predicting SSS of nickel-based superalloys.
Funding Statement: This work is supported by National Science and Technology Major Project (J2019-IV-0003-0070), the Natural Science Foundation of China (91860105, 52074366), China Postdoctoral Science Foundation (2019M662799), Natural Science Foundation of Hunan Province of China (2021JJ40757), the Science and Technology Innovation Program of Hunan Province (2021RC3131), Changsha Municipal Natural Science Foundation (kq2014126), and Project Supported by State Key Laboratory of Powder Metallurgy, Central South University, Changsha, China.
Conflicts of Interest: The authors declare that they have no conflicts of interest to report regarding the present study.
References
1. Reed, R. C. (2006). The superalloys: Fundamentals and applications. Cambridge: Cambridge University Press. [Google Scholar]
2. Geddes, B., Leon, H., Huang, X. (2010). Superalloys: Alloying and performance. USA: ASM International. [Google Scholar]
3. Wollgramm, P., Buck, H., Neuking, K., Parsa, A. B., Schuwalow, S. et al. (2015). On the role of Re in the stress and temperature dependence of creep of Ni-base single crystal superalloys. Materials Science and Engineering: A, 628, 382–395. [Google Scholar]
4. Kozar, R. W., Suzuki, A., Milligan, W. W., Schirra, J. J., Savage, M. F. et al. (2009). Strengthening mechanisms in polycrystalline multimodal nickel-base superalloys. Metallurgical and Materials Transactions A, 40(7), 1588–1603. DOI 10.1007/s11661-009-9858-5. [Google Scholar] [CrossRef]
5. Osada, T., Nagashima, N., Gu, Y., Yuan, Y., Yokokawa, T. et al. (2011). Factors contributing to the strength of a polycrystalline nickel-cobalt base superalloy. Scripta Materialia, 64(9), 892–895. DOI 10.1016/j.scriptamat.2011.01.027. [Google Scholar] [CrossRef]
6. Osada, T., Gu, Y., Nagashima, N., Yuan, Y., Yokokawa, T. et al. (2013). Optimum microstructure combination for maximizing tensile strength in a polycrystalline superalloy with a two-phase structure. Acta Materialia, 61(5), 1820–1829. DOI 10.1016/j.actamat.2012.12.004. [Google Scholar] [CrossRef]
7. Galindo-Nava, E. I., Connor, L. D., Rae, C. M. F. (2015). On the prediction of the yield stress of unimodal and multimodal γ′ Nickel-base superalloys. Acta Materialia, 98, 377–390. DOI 10.1016/j.actamat.2015.07.048. [Google Scholar] [CrossRef]
8. Goodfellow, A. J., Galindo-Nava, E. I., Schwalbe, C., Stone, H. J. (2019). The role of composition on the extent of individual strengthening mechanisms in polycrystalline Ni-based superalloys. Materials & Design, 173, 107760. DOI 10.1016/j.matdes.2019.107760. [Google Scholar] [CrossRef]
9. Fang, Q., Li, L., Li, J., Wu, H., Huang, Z. et al. (2019). A statistical theory of probability-dependent precipitation strengthening in metals and alloys. Journal of the Mechanics and Physics of Solids, 122, 177–189. DOI 10.1016/j.jmps.2018.09.010. [Google Scholar] [CrossRef]
10. Tan, L., Li, Y., Deng, W., Liu, Y., Liu, F. et al. (2019). Tensile properties of three newly developed Ni-base powder metallurgy superalloys. Journal of Alloys and Compounds, 804, 322–330. DOI 10.1016/j.jallcom.2019.07.002. [Google Scholar] [CrossRef]
11. Ajaja, O., Howson, T. E., Purushothaman, S., Tien, J. K. (1980). The role of the alloy matrix in the creep behavior of particle-strengthened alloys. Materials Science and Engineering, 44(2), 165–172. DOI 10.1016/0025-5416(80)90117-2. [Google Scholar] [CrossRef]
12. Zhu, Z., Basoalto, H., Warnken, N., Reed, R. C. (2012). A model for the creep deformation behaviour of nickel-based single crystal superalloys. Acta Materialia, 60(12), 4888–4900. DOI 10.1016/j.actamat.2012.05.023. [Google Scholar] [CrossRef]
13. Kim, Y. K., Kim, D., Kim, H. K., Oh, C. S., Lee, B. J. (2016). An intermediate temperature creep model for Ni-based superalloys. International Journal of Plasticity, 79, 153–175. DOI 10.1016/j.ijplas.2015.12.008. [Google Scholar] [CrossRef]
14. Reed, R. C., Tao, T., Warnken, N. (2009). Alloys-by-design: Application to nickel-based single crystal superalloys. Acta Materialia, 57(19), 5898–5913. DOI 10.1016/j.actamat.2009.08.018. [Google Scholar] [CrossRef]
15. Reed, R. C., Mottura, A., Crudden, D. J. (2016). Alloys-by-design: Towards optimization of compositions of nickel-based superalloys. Superalloys 2016: Proceedings of the 13th Intenational Symposium of Superalloys, pp. 13–23. Wiley Online Library, Seven Springs, Pennsylvania, USA. [Google Scholar]
16. Kim, Y. K., Kim, D., Kim, H. K., Yoon, E. Y., Lee, Y. et al. (2018). A numerical model to predict mechanical properties of Ni-base disk superalloys. International Journal of Plasticity, 110, 123–144. DOI 10.1016/j.ijplas.2018.06.011. [Google Scholar] [CrossRef]
17. Goodfellow, A. J. (2018). Strengthening mechanisms in polycrystalline nickel-based superalloys. Materials Science and Technology, 34(15), 1793–1808. DOI 10.1080/02670836.2018.1461594. [Google Scholar] [CrossRef]
18. Fleisgher, R. L. (1961). Solution hardening. Acta Metallurgica, 9(11), 996–1000. DOI 10.1016/0001-6160(61)90242-5. [Google Scholar] [CrossRef]
19. Fleischer, R. L. (1963). Substitutional solution hardening. Acta Metallurgica, 11(3), 203–209. DOI 10.1016/0001-6160(63)90213-X. [Google Scholar] [CrossRef]
20. Labusch, R. (1970). A statistical theory of solid solution hardening. Physica Status Solidi (b), 41(2), 659–669. DOI 10.1002/(ISSN)1521-3951. [Google Scholar] [CrossRef]
21. Friedrichs, J., Haasen, P. (1975). Ternary solution-hardening of copper single crystals. The Philosophical Magazine: A Journal of Theoretical Experimental and Applied Physics, 31(4), 863–869. DOI 10.1080/14786437508229636. [Google Scholar] [CrossRef]
22. Gypen, L. A., Deruyttere, A. (1977). Multi-component solid solution hardening. Journal of Materials Science, 12(5), 1028–1033. DOI 10.1007/BF00540987. [Google Scholar] [CrossRef]
23. Gypen, L. A., Deruyttere, A. (1977). Multi-component solid solution hardening. Journal of Materials Science, 12(5), 1034–1038. DOI 10.1007/BF00540988. [Google Scholar] [CrossRef]
24. Roth, H. A., Davis, C. L., Thomson, R. C. (1997). Modeling solid solution strengthening in nickel alloys. Metallurgical and Materials Transactions A, 28(6), 1329–1335. DOI 10.1007/s11661-997-0268-2. [Google Scholar] [CrossRef]
25. Zhao, J. C. (2001). A combinatorial approach for structural materials. Advanced Engineering Materials, 3(3), 143–147. DOI 10.1002/(ISSN)1527-2648. [Google Scholar] [CrossRef]
26. Zhao, J. C. (2001). A combinatorial approach for efficient mapping of phase diagrams and properties. Journal of Materials Research, 16(6), 1565–1578. DOI 10.1557/JMR.2001.0218. [Google Scholar] [CrossRef]
27. Zhao, J. C., Jackson, M. R., Peluso, L. A. (2004). Mapping of the Nb-Ti–Si phase diagram using diffusion multiples. Materials Science and Engineering: A, 372(1), 21–27. DOI 10.1016/j.msea.2003.08.008. [Google Scholar] [CrossRef]
28. Zhao, J. C. (2004). Reliability of the diffusion-multiple approach for phase diagram mapping. Journal of Materials Science, 39(12), 3913–3925. DOI 10.1023/B:JMSC.0000031472.25241.c5. [Google Scholar] [CrossRef]
29. Zhu, L., Wei, C., Qi, H., Jiang, L., Jin, Z. et al. (2017). Experimental investigation of phase equilibria in the Co-rich part of the Co-Al-X (X = W, Mo, Nb, Ni, Ta) ternary systems using diffusion multiples. Journal of Alloys and Compounds, 691, 110–118. DOI 10.1016/j.jallcom.2016.08.210. [Google Scholar] [CrossRef]
30. Liu, F., Wang, Z., Wang, Z., Zhong, J., Wu, X. et al. (2020). High-throughput determination of interdiffusivity matrices in Ni-Al-Ti-Cr-Co-Mo-Ta-W multicomponent superalloys and their application in optimization of creep resistance. Materials Today Communications, 24, 101018. DOI 10.1016/j.mtcomm.2020.101018. [Google Scholar] [CrossRef]
31. Zhu, L., Zhang, Q., Chen, Z., Wei, C., Cai, G. M., et al. (2017). Measurement of interdiffusion and impurity diffusion coefficients in the bcc phase of the Ti-X (X = Cr, Hf, Mo, Nb, V, Zr) binary systems using diffusion multiples. Journal of Materials Science, 52(6), 3255–3268. DOI 10.1007/s10853-016-0614-0. [Google Scholar] [CrossRef]
32. Wang, Z., Zhang, L., Li, W., Qin, Z., Wang, Z. et al. (2021). A high-throughput approach to explore the multi-component alloy space: A case study of nickel-based superalloys. Journal of Alloys and Compounds, 858, 158100. DOI 10.1016/j.jallcom.2020.158100. [Google Scholar] [CrossRef]
33. Zhu, C., Li, C., Wu, D., Ye, W., Shi, S. et al. (2021). A titanium alloys design method based on high-throughput experiments and machine learning. Journal of Materials Research and Technology, 11, 2336–2353. DOI 10.1016/j.jmrt.2021.02.055. [Google Scholar] [CrossRef]
34. Ur-Rehman, H. (2016). Solid solution strengthening and diffusion in nickel- and cobalt-based superalloys (Ph.D. Thesis). Friedrich-Alexander-Universität Erlangen-Nürnberg, Germany. [Google Scholar]
35. Zhang, Y., Wen, C., Wang, C., Antonov, S., Xue, D. et al. (2020). Phase prediction in high entropy alloys with a rational selection of materials descriptors and machine learning models. Acta Materialia, 185, 528–539. DOI 10.1016/j.actamat.2019.11.067. [Google Scholar] [CrossRef]
36. Dong, J., Wu, L., Liu, X., Fan, C., Leng, M. et al. (2020). Simulation of daily diffuse solar radiation based on three machine learning models. Computer Modeling in Engineering & Sciences, 123(1), 49–73. DOI 10.32604/cmes.2020.09014. [Google Scholar] [CrossRef]
37. Liu, P., Huang, H., Antonov, S., Wen, C., Xue, D. et al. (2020). Machine learning assisted design of γ′-strengthened Co-base superalloys with multi-performance optimization. npj Computational Materials, 6(1), 62. DOI 10.1038/s41524-020-0334-5. [Google Scholar] [CrossRef]
38. Jones, R. E., Templeton, J. A., Sanders, C. M., Ostien, J. T. (2018). Machine learning models of plastic flow based on representation theory. Computer Modeling in Engineering & Sciences, 117(3), 309–342. DOI 10.31614/cmes.2018.04285. [Google Scholar] [CrossRef]
39. Qin, Z., Wang, Z., Wang, Y., Zhang, L., Li, W. et al. (2021). Phase prediction of Ni-base superalloys via high-throughput experiments and machine learning. Materials Research Letters, 9(1), 32–40. DOI 10.1080/21663831.2020.1815093. [Google Scholar] [CrossRef]
40. Wang, Z., Xie, B., Fang, Q., Liu, F., Li, J. et al. (2021). Coupling high-throughput experiment and machine learning to optimize elemental composition in nickel-based superalloys. MRS Communications, 11(4), 411–417. DOI 10.1557/s43579-021-00045-9. [Google Scholar] [CrossRef]
41. Liu, F., Xiao, X., Huang, L., Tan, L., Liu, Y. (2022). Design of NiCoCrAl eutectic high entropy alloys by combining machine learning with CALPHAD method. Materials Today Communications, 30, 103172. DOI 10.1016/j.mtcomm.2022.103172. [Google Scholar] [CrossRef]
42. Wen, C., Zhang, Y., Wang, C., Xue, D., Bai, Y. et al. (2019). Machine learning assisted design of high entropy alloys with desired property. Acta Materialia, 170, 109–117. DOI 10.1016/j.actamat.2019.03.010. [Google Scholar] [CrossRef]
43. Liu, Y., Wu, J., Wang, Z., Lu, X. G., Avdeev, M. et al. (2020). Predicting creep rupture life of Ni-based single crystal superalloys using divide-and-conquer approach based machine learning. Acta Materialia, 195, 454–467. DOI 10.1016/j.actamat.2020.05.001. [Google Scholar] [CrossRef]
Cite This Article
 Copyright © 2023 The Author(s). Published by Tech Science Press.
This work is licensed under a Creative Commons Attribution 4.0 International License , which permits unrestricted use, distribution, and reproduction in any medium, provided the original work is properly cited.
 Downloads
 Citation Tools