
 Submit a Paper
 Propose a Special lssue
 Open Access
ARTICLE
Mechanical Dispatch Reliability Prediction for Civil Aircraft Considering Operational Parameters
1 School of Aeronautics, Northwestern Polytechnical University, Xi’an, 710072, China
2 Department of Aeronautics and Astronautics, Fudan University, Shanghai, 200433, China
* Corresponding Author: Zhicen Song. Email:
(This article belongs to the Special Issue: Computer-Aided Structural Integrity and Safety Assessment)
Computer Modeling in Engineering & Sciences 2023, 134(3), 1925-1942. https://doi.org/10.32604/cmes.2022.022680
Received 21 March 2022; Accepted 10 May 2022; Issue published 20 September 2022
 View Full Text
 Download PDF
Abstract
To effectively predict the mechanical dispatch reliability (MDR), the artificial neural networks method combined with aircraft operation health status parameters is proposed, which introduces the real civil aircraft operation data for verification, to improve the modeling precision and computing efficiency. Grey relational analysis can identify the degree of correlation between aircraft system health status (such as the unscheduled maintenance event, unit report event, and services number) and dispatch release and screen out the most closely related systems to determine the set of input parameters required for the prediction model. The artificial neural network using radial basis function (RBF) as a kernel function, has the best applicability in the prediction of multidimensional, small sample problems. Health status parameters of related systems are used as the input to predict the changing trend of MDR, under the artificial neural network modeling framework. The case study collects real operation data for a certain civil aircraft over the past five years to validate the performance of the model which meets the requirements of the application. The results show that the prediction quadratic error Ep of the model reaches 6.9 × 10⁻⁸. That is to say, in the existing operating environment, the prediction of the number of delay & cancel events per month can be less than once. The accuracy of RBF ANN, BP ANN and GA-BP ANN are compared further, and the results show that RBF ANN has better adaptability to such multidimensional small sample problems. The efforts of this paper provide a highly efficient method for the MDR prediction through aircraft system health state parameters, which is a promising model to enhance the prediction and controllability of the dispatch release, providing support for the construction of the civil aircraft operation system.Keywords
Whether a civil aircraft can have certain market competitiveness mainly depends on two aspects. One is performance, and the second is economic efficiency. Dispatch reliability (DR), as an operating reliability parameter to measure the service efficiency of an aircraft or fleet, exactly takes both aspects into account and has become one of the top-level indicators, concerned mostly by airlines and consumers. Initially, the dispatch reliability was the statistical result of the cancel and delay events. As for the control of the aircraft performance, relevant research has always focused on the monitoring and calculating of reliability, using the method of multi-layer self-attention [1], kriging combined with decomposed-coordinated [2,3] or extremum response [4], neural network model [5–7], discrete-time Bayesian network [8,9], stochastic process theory [10], finite element simulation response with optimization algorithm [11–13] or FORM/SORM [14] and so on. It can predict the trends in the performance of a device or structure over time. However, numerous studies have shown that reliability often focuses only on a certain structure, device, or system, and cannot take a balancing role in judging the service efficiency of the aircraft or fleet and the economic benefits it can bring. With the increasing attention to the index-DR, as a kind of operation reliability parameter, people gradually realize the importance of establishing a dispatch reliability prediction model. The prediction model can realize the trend prediction of the flight dispatch and the continuous monitoring of dispatch reliability. So, DR can also be controlled as the same as reliability, with a certain trend of development controlled within a controllable range, to prevent the deterioration of service efficiency and the loss of economic efficiency. Factors influencing dispatch reliability are very complex. Even if only the mechanical is considered, the aircraft system is still divided into many areas. As for the sample size, in the whole life cycle of an aircraft, only a few hundred pieces of data can be provided for analysis. Therefore, the dispatch reliability prediction must be a multidimensional and small sample model. Such models often need to be solved by algorithms with strong adaptability. The multi-dimension of input variables leads to the complex mapping relationship within the model, and the small number of samples also requires the model to respond quickly. The artificial neural network (ANN) using radial basis function (RBF) has strong nonlinear adaptability, the effectiveness of processing nonlinear time series [15], two-dimensional nonlinear boundary value problems [16], non-stationary time series prediction [17], and interpolation problem of scattered data [18] had been confirmed. RBF ANN can identify and model almost all systems by using the traditional technology of interpolation in multidimensional space. The advantage is that the excitation function is local. For each input value, only a few nodes have non-zero excitation values, and naturally can respond quickly; The input layer is directly connected to the hidden unit, and the hidden layer is connected to the output layer by weight. When calculating, it can not only adjust the weight but also adjust the number of hidden nodes. The dynamic network structure shows better learning ability in multi-mapping. A prediction model of dispatch reliability based on the Radial basis function neural network for civil aircraft can reflect the service efficiency of aircraft or fleet in the next period. On the other hand, the regression relationship between civil aircraft system health status parameters and flight dispatch can be established, and the reliability of the whole aircraft can be measured from a more balanced perspective.
Most of the research on the reliability of dispatch is still confined to the statistical reports of airline reliability or the regular statistics of operational data. That is to say, the dispatch reliability of aircraft can only be determined by the statistical method after the occurrence of adverse events such as delay and cancellation. As there is no prediction model based on the regression relationship between the correlation of operation health status parameters and dispatch reliability, necessary measures are taken to avoid the occurrence of adverse events. As for the technology of prediction and control on dispatch reliability, part of the research describes it as an inherent attribute as well as reliability, established with design variables. It is considered that the reliability of dispatching should be one of the top-level indicators in the design stage. Reliability, it is necessary to allocate constraints to other design parameters through the dispatch reliability index to ensure the operation capacity of the aircraft [19]; In the early design stage of the aircraft system, the paper [20,21] calculated and controled the dispatch reliability of general aircraft combined with the prediction of reliability and maintainability. However, such a model cannot reflect the advantage of dispatching reliability as a running parameter, and it is difficult to consider the influence of non-technical conditions such as the running environment. Another part of the study is that DR is affected by the structural design of the aircraft itself, and more importantly, the technical or non-technical factors of many practical operational environments of aircraft. Collecting the operational data for four years (2014–2018) of a civil aircraft A340, the study [22] showed that the maintenance cost, flight hours, flight cycle and dispatch reliability have certain data distribution rules and correlation; The paper [23] quickly identified the fault patterns and allocate processing strategies to speed up the efficiency of fault handling, thereby minimizing the possibility of delay and cancellation, utilizing text mining and neural networks; In order to explore the relationship between reliability enhancement and dispatch, a time limited scheduling method of electronic engine control system based on Monte Carlo simulation is proposed in this paper [24], which took account of both reliability and average safety level; The strategy of reducing service interruption through maintenance program modification is discussed for military aircraft and civil aircraft respectively, main factors considered in the model [25] were system structure, time limited scheduling and reliability; Similar to the above, in order to achieve the control of dispatching and security level, the paper [26] proposed a multi failure time limited scheduling strategy based on Markov process, and indirectly improves the control box of dispatching; To reduce the adverse impact of the time consumed by information access on scheduling events, an automated decision-making framework [27] for dispatching decision support models was established, which greatly improves the dispatching efficiency; In the paper [28], the generalized stochastic Petri net method was used to model the aircraft dispatching process, describe the various statuses of the dispatching process and analyze the relationship among the factors. Simulation conditions include maintenance time, air traffic management information, airport environment, weather conditions, and so on. While there are some deficiencies in these prediction models: First, most of the prediction models obscure the concept of DR. According to the causes, the DR can be further divided into two categories: mechanical and non-mechanical. If the inputs are design or operation parameters reflecting the health state, those can only be associated with the mechanical dispatch reliability (MDR). The same is true that the input completely reflecting the dispatch conditions and personnel factors of the airport cannot show the changing trend on MDR; Secondly, even if only MDR is considered, it is still an operating parameter. Using health status parameters of aircraft systems to be collected by airlines in operation is closer to the status change of dispatch than using the design parameters. After all, the decision-making condition of dispatch release is the health of the system; Finally, the prediction model has not formed a unified consensus, resulting in the incompleteness or confusion of the factors considered.
In this paper, a mechanical dispatch reliability prediction model is investigated to establish the regression and prediction relationship between the operation parameters reflecting the health state of aircraft systems and MDR, to provide support for reflecting the changing trend of dispatch release through the health status of the aircraft. In terms of method, grey relational analysis is used to screen the aircraft system with the highest correlation with MDR. Combining the set of parameter sets, the regression function is learned by combining RBF ANN, to realize the prediction function. Establishing a prediction model between aircraft system and mechanical dispatch reliability is an important means to quantify the running status of civil aircraft. The strong adaptability shown by RBF ANN in dealing with multidimensional small sample problems has also been verified.
The remainder of this paper is organized as follows. Section 2 introduces the methods and theories of the mechanical dispatch reliability prediction model, including the gray relation analysis which can filter the degree of correlation between the parameters, and the radial basis functions artificial neural network to build a regression and prediction relationship between the MDR and the health state of aircraft systems. In Section 3, the effectiveness of the model is illustrated by the operation data of a certain civil aircraft in the past five years. Among them, the application background of the model is mainly explained, and necessary data preparation is made. At the same time, grey correlation analysis is used to analyze the correlation between aircraft systems and mechanical dispatch reliability. Thus, the set of input parameters needed for regression and prediction models is generated. The accuracy requirements and the performance of the prediction model are described in Section 4, and some main conclusions are summarized in Section 5.
Most of the research on dispatch reliability (DR) is still confined to the statistical value in the reliability statistics reports (the monthly report is more common) or the regular statistics of operational data. The physical meaning can also be drawn from Eq. (1), which is the ratio of the normal service to the total number of services.
Here, NUMservice is the total number of services, NUMdelay is the number of delays, NUMcancel is the number of cancels.
The opposite of flight dispatch is delay or cancel, which can be caused by two categories of reasons, one is the mechanical reason, that is, the failure and false alarm of the aircraft, system, and subsystem, triggering some maintenance tasks; the other is collectively referred to as non-mechanical reasons, covering weather, traffic control, human factors and so on. The non-mechanicals have certain contingencies and, of course, have seasonal characteristics. Improving these factors to enhance the DR is unquantifiable and uninterrupted. While the effect of improving mechanical performance on DR can be reflected by mathematical models. The dispatch level induced only by mechanical reasons is called mechanical dispatch reliability (MDR). For all stakeholders, a prediction model between the aircraft system and MDR is established to achieve continuous monitoring of reliability. It is an important means to quantify both economic efficiency and performance. The ATA specification divides the aircraft system into dozens of chapters, and the health status and failure frequency of the system are very important to the reliability and safety of civil aircraft. According to the data included in the European Co-ordination Centre for Accident and Incident Reporting Systems (ECCAIRS), the airframe systems are the biggest contributor to the reported events, and failures of these systems caused more than 23% of all [29,30]. Not each system will be related to canceling or delaying events. Locating the number of delays and cancellations in Eq. (1) to a single system, the relationship between the single system and the flight dispatch can be verified. According to common sense, such as navigation or air-condition, some kinds of systems are easy to be perceived by the crew or passengers and will cause burdens on the unit or cause passengers discomfort, if faults happen frequently. On this account, it will easily become a system that has adverse effects on MDR. In other words, it is also a system with a high correlation with MDR.
Briefly, relation analysis is the sorting of aircraft systems with effects on MDR. Grey relational analysis is a way to carry out the qualitative analysis and get the degree of relation between data by the changing situation of related variables or curves [31]. Using color to express the mastery degree of information, white is completely clear, black is vague and uncertain, and grey tends to be between them. The existing information is used to deduce the unknown part reasonably, the application problems listed in this paper apply to the grey relational analysis. The basic idea of grey relational analysis is that the two-time series changing with time and environment, have a consistent trend and a high degree of synchronous change. It is said that the two have a high degree of correlation. The sequence reflecting output is called reference sequence X0(t), and the sequence affecting output behavior is called comparative sequence Xi(t). Due to the different physical meanings between sequences, the grey relational analysis should process the data dimensionless. However, it is obvious that the sequence to be compared has the same physical meaning, and the dimensionless processing will cause unnecessary interference to the data. The degree of difference between curves is used as a measure of correlation degree, that is, the difference between curves. When the time is ‘t’, the correlation coefficient (Eq. (2)) between the reference sequence and comparison series is as follows:
Here, ρ is the resolution coefficient, taken as 0.5 generally.
The resolution coefficient ri (Eq. (3)) of each moment is gathered to get the average value, which is used as a numerical representation of the correlation degree between the comparison sequence and the reference sequence.
The closer ri is to 1, the higher the correlation is. The correlation of factors is represented by the order of incidence degree, which reflects the ‘superiority and inferiority’ relationship of the comparison sequences for reference sequences. Considering the scale of the model establishment, the top 8 aircraft systems are represented. The relevant operational parameters of the 8 systems will be further used as the input variables of the model.
2.2 Operating Parameters & Dispatch Reliability
The aircraft consists of systems and components. When the system fails or warns, the crew and maintenance personnel need to take corresponding measures to further assess the ability of the aircraft to perform the mission and cause special events in a particular scenario. According to this process, there are three kinds of special events involved in the process of early-warning to dispatch decision-making, namely unscheduled maintenance event, unit report event, and cancel & delay event.
• The unscheduled maintenance event contains all accidents except scheduled maintenance. They can occur before and after navigation, and can also be caused by failures in flight. The frequency of unscheduled maintenance events can directly reflect the reliability level of aircraft and their products;
• The unit report event is a kind of fault that can be perceived by the crew and bring a certain burden to the crew’s operation. Therefore, it is a general term for the events recorded and reported by the crew. Such events can occur before the flight as a judgment condition for whether the aircraft can be released or during flight. The crew’s written records can be used as an important basis for post-flight inspection and maintenance;
• As described above, the cancel & delay event includes two categories: mechanical and non-mechanical.
When the cancel & delay event is mechanical, it will often lead to unscheduled maintenance and unit reports. The relevant statistical results of a certain aircraft are shown in Fig. 1. In the mechanical cancel & delay event (A1), 68.42% of which may lead to unscheduled maintenance events (A2), 23.68% of which may cause unit report events (A3), and 18.42% may cause two events at the same time. Given this, there is a strong regression relationship between the operation parameters of the three kinds of events (unscheduled maintenance rate, unit report rate, cancel & delay rate) and MDR.
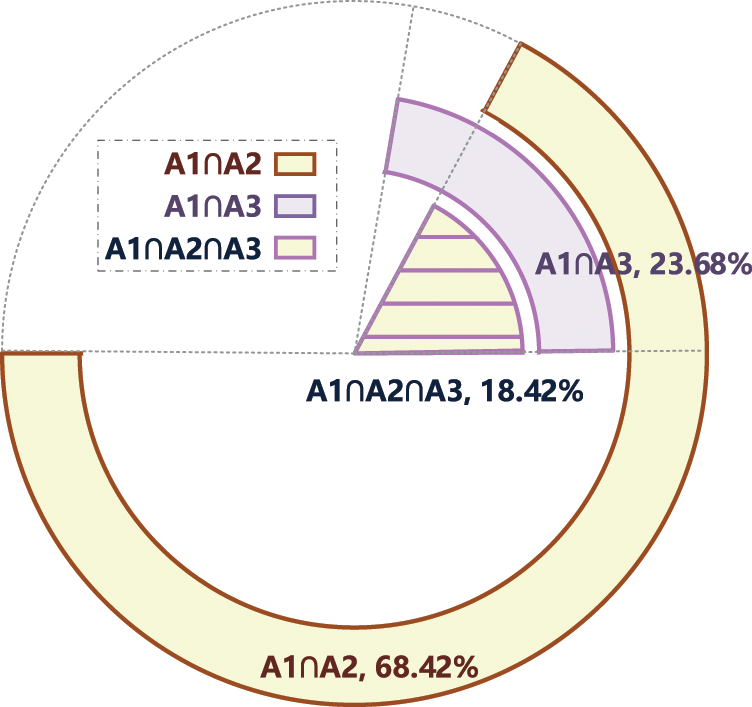
Figure 1: The proportion of unscheduled maintenance and unit reports in the cancel & delay event
Necessary data preparation and processing shall be carried out for all kinds of data to enter the prediction model and converted into dimensional and unified operation parameters. Operators or manufacturers regularly publish reliability reports for their management models, monthly reports are the most common. The monthly report shows the operation status of the aircraft in that month and the number of events. Bring it into Eq. (4) for parametric processing, unify the unit and reduce unnecessary data interference. The data to be processed include the number of unscheduled maintenance and unit reports on aircraft and systems.
A two-dimensional dispatch reliability prediction model can be constructed. For the first dimension, it is the aircraft system with the highest relative degree associated with MDR; the second dimension is the operation parameters corresponding to the system. The unscheduled maintenance rate and unit report rate corresponding to the system will certainly be included. In addition, some parameters related to the aircraft itself should be included, such as the number of services, the average unscheduled maintenance, and the unit report rate of the whole aircraft. In summary, the input variables of the model include unscheduled maintenance and unit report rate in aircraft and corresponding system, and the number of services, with a total of 19 parameters, and the output variables are the MDR of the aircraft. The technical framework for the prediction model of MDR is shown in Fig. 2.
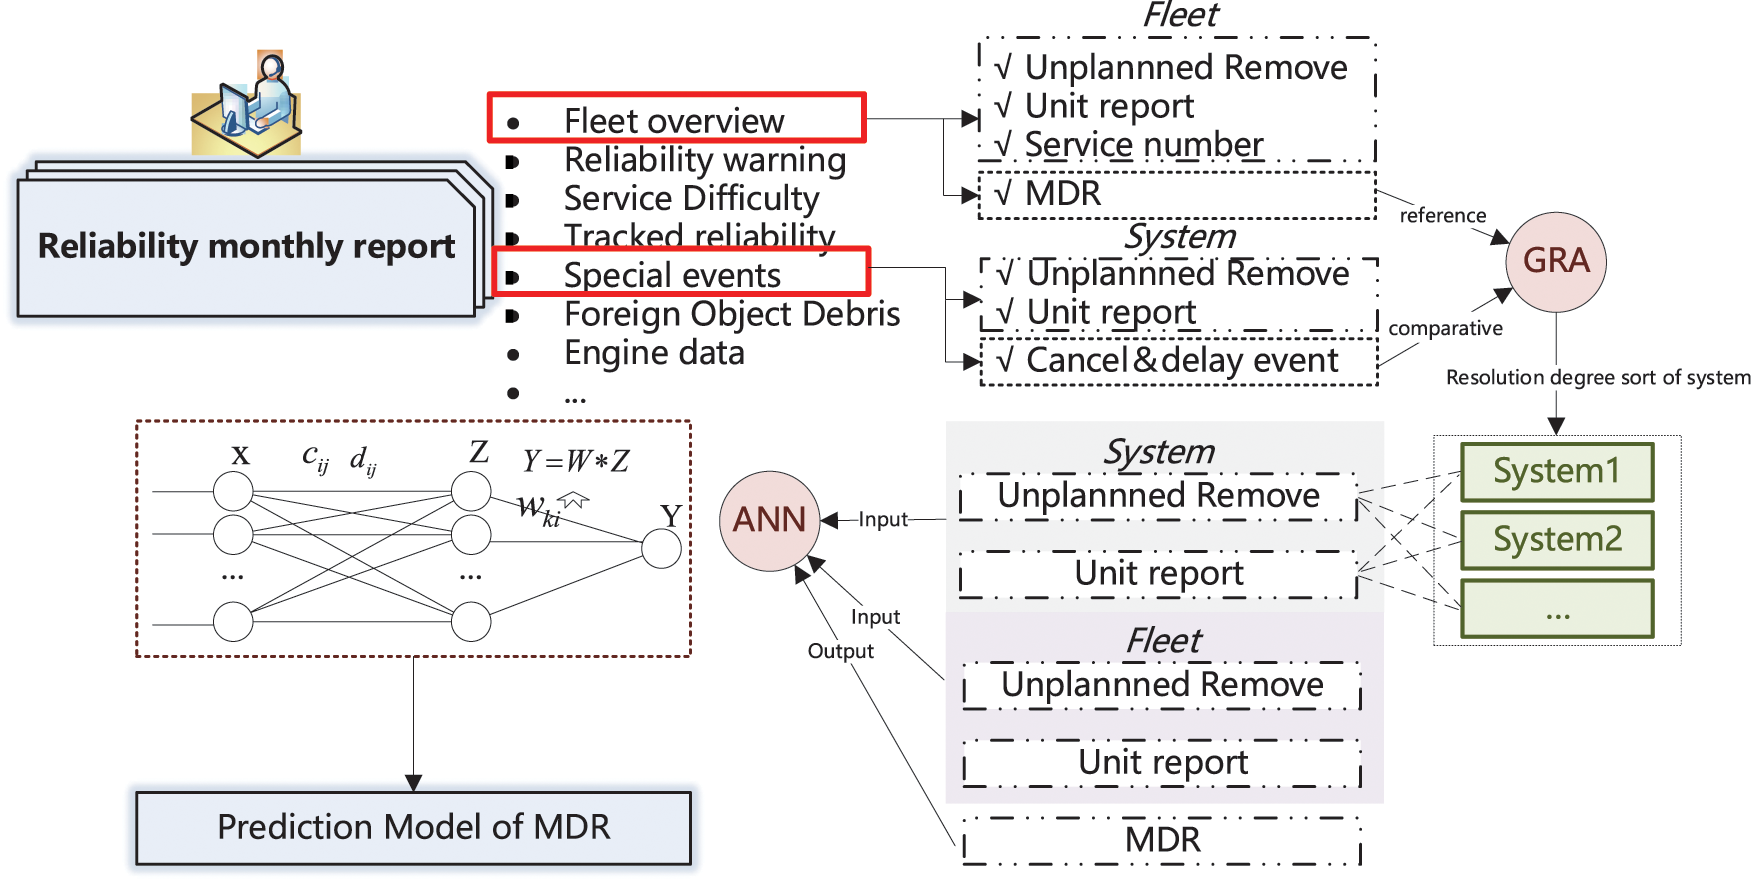
Figure 2: The technical framework for the prediction model of MDR
2.3 Prediction Model of Dispatch Reliability
Dispatch reliability is a top-level parameter representing the reliability of civil aircraft and is one of the most important parameters for the international civil aviation industry to measure the efficiency of a fleet of aircraft [32]. It is of great significance for ensuring the safe operation of aircraft, economic operation, and Continuous Airworthiness. To realize the prediction of MDR, if the input and output of this month are used as a group of data, they are both known and cannot achieve the purpose of prediction. Only the regression relationship between them can be described. To achieve the purpose of prediction, a set of corresponding relations should be taken with interlaced input and output in a time sequence. The health status of civil aircraft over a period is continuous and interrelated. Using a set of input parameters in the ‘i’ months is used to predict the MDR of the ‘i + 1’ month. The prediction model of the MDR is shown in Eq. (5).
Choose a regression class or learning algorithm to deal with the inherent rules that are difficult to describe with linear problems in application problems. A radial basis function (RBF) artificial neural network is used in this paper. The input of the dispatch reliability prediction model is the operation data of civil aircraft. In normal operation, the service life of a civil aircraft is generally about 20 years, which requires more than 3 years, that is, more than 36 pieces of data to reflect a certain prediction law on MDR. That is to say, the prediction of dispatch reliability should be a small sample prediction problem. Convolution and deep learning classes obviously cannot adapt to small sample problems. Compared with other neural networks, RBF artificial neural network, as an efficient feedforward network, has the best approximation performance and global optimization characteristics. Theoretically, RBF is different from other networks by using the radial basis function (as shown in Eq. (6)) as an activation function. The advantage of sensing the local response through the distance and variance between the new point and the center is that, unlike BP, it is easy to fall into local optimization, and RBF has better global optimization ability [33].
The solving steps of the RBF artificial neural network can be described as follows:
Step 1: Construct the structure of the RBF artificial neural network. The structure of the RBF artificial neural network is composed of three layers, namely, the input layer, hidden layer, and output layer, and the structure form is shown in Fig. 3. The update parameters that determine the learning law between input and output include center vector cij, width vector dij, and weight wki. The process of learning through the artificial neural network is the process of updating parameters.
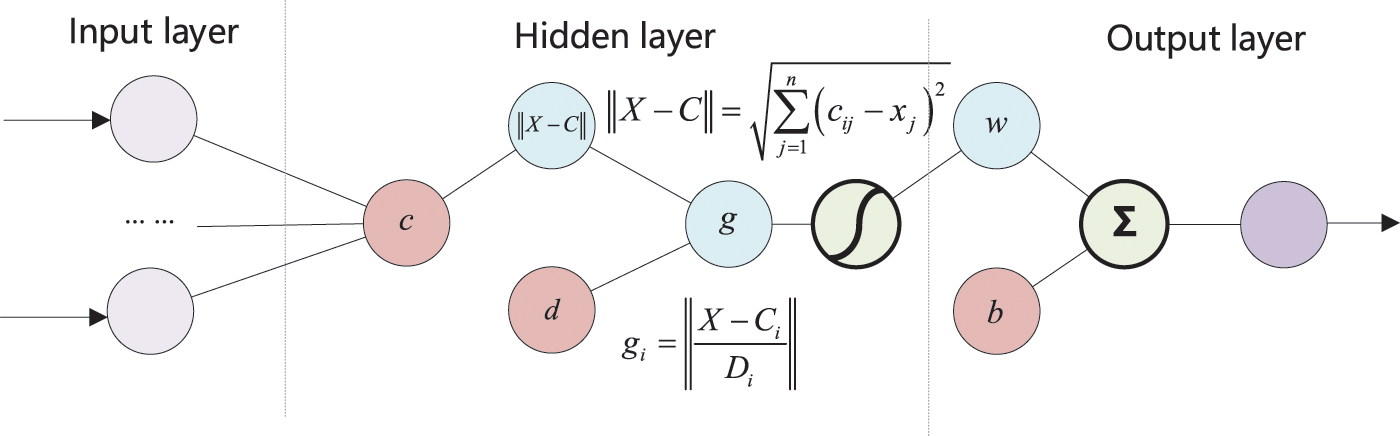
Figure 3: The structure of RBF artificial neural network
Step 2: Initialize update parameters. The initial value is set for the update parameter, the weight wki is initialized randomly, and the initialization method of center vector cij and width vector dij follows Eq. (7).
Step 3: Calculate the quadratic error Ep of the sample. Verify whether the error of the training set and the test set meet the end condition, that is, the error is within the accuracy range. The expression of Ep is:
Here, S is a matrix of true value.
Step 4: correct and update the parameters successively according to the error gradient descent method. The principle of gradient descent is to use the quadratic error function to derive the update parameters (Eq. (9)) so that it can change and adjust along the direction where the error drops fastest.
Here, η is the learning rate, which determines the change of update parameters in each cycle of training; α, as a momentum factor, helps to keep the algorithm stable while preventing the result from falling to the local minimum. The iteration of update parameters can be expressed as:
Step 5: Repeat Steps 3 and 4 until the quadratic error Ep meets the accuracy requirement. Output the learning law and bring in the data to realize the prediction function.
To validate the proposed MDR prediction model with the artificial neural network using radial basis function (RBF), the case study collects real operation data for a certain civil aircraft over the past five years, to validate the performance of the model that meets the requirements of the application. All computations are completed on a 64-bit desk computer with Intel Core i5–10400 of 2.9 GHz CPU and 32 GB RAM
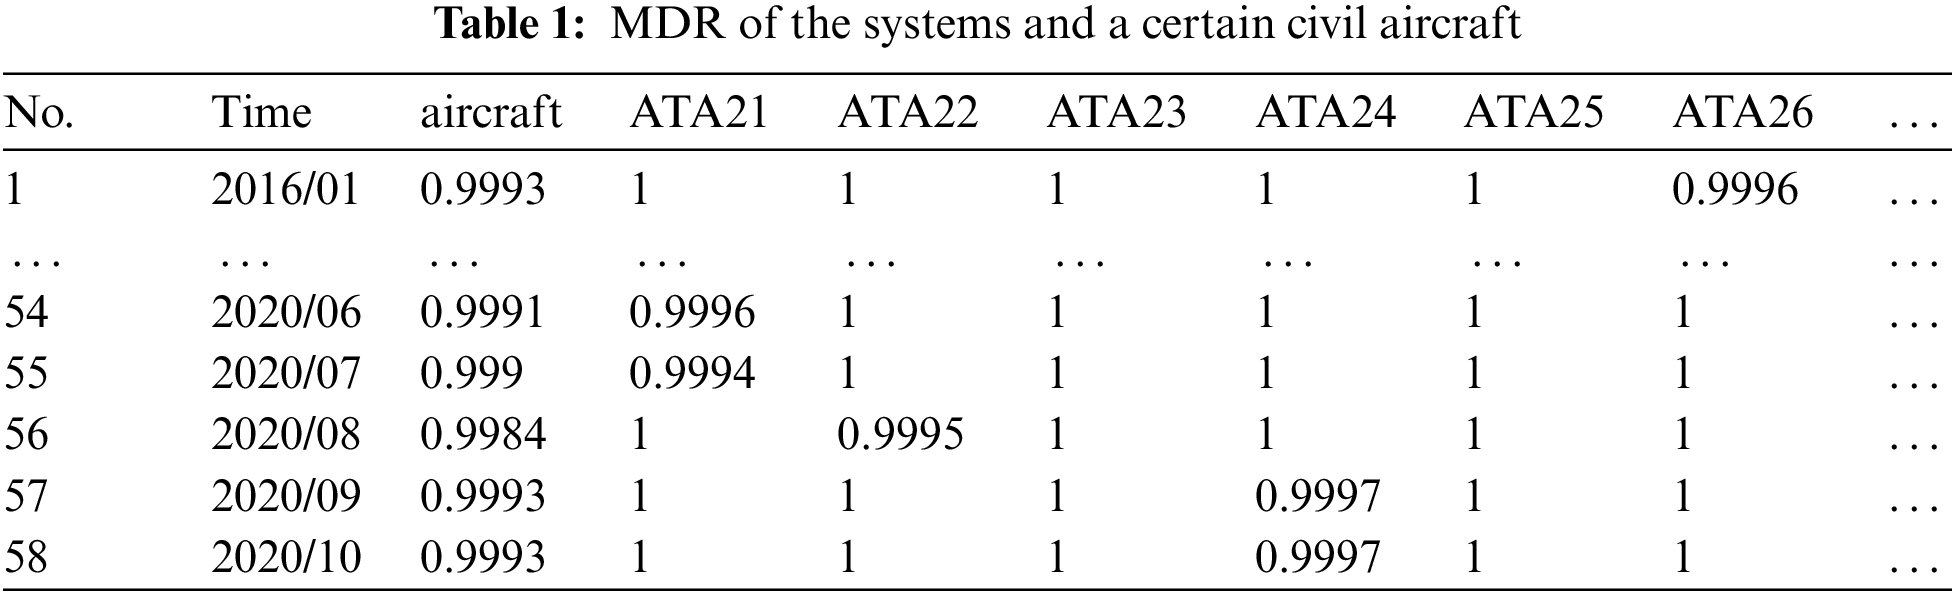
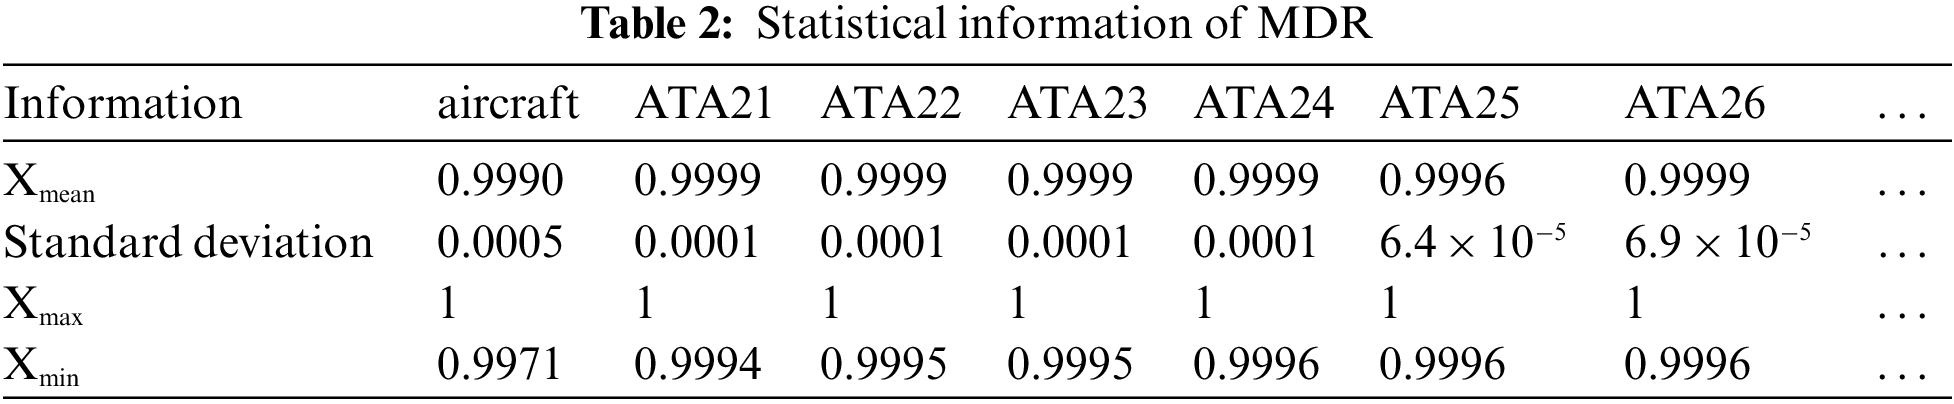
The monthly reliability report of a certain civil aircraft from January 2016 to October 2020 are collected. The overall operation status and special events of the aircraft are recorded in detail in the monthly report. According to the method described in this paper, the cancellation delay events with a total of 58 months should be screened and classified according to the ATA chapter. The statistical results are shown in Fig. 4. A total of 29 systems are related to the flight dispatch of aircraft. Through Eq. (1), the MDR of the aircraft and the system is calculated, which is shown in Table 1. There are 58 pieces of data. Table 2 shows some statistical information about MDR to better describe the data.
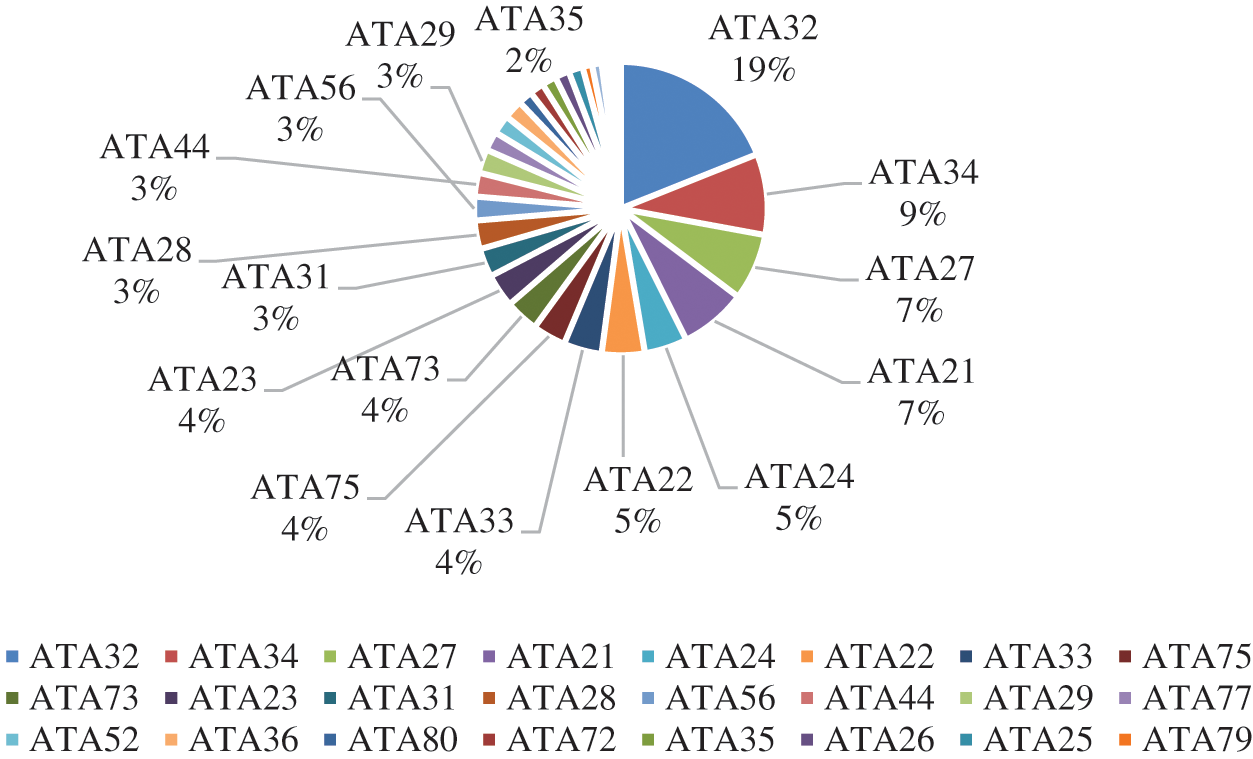
Figure 4: Statistics on cancel & delay events of the systems in a certain civil aircraft
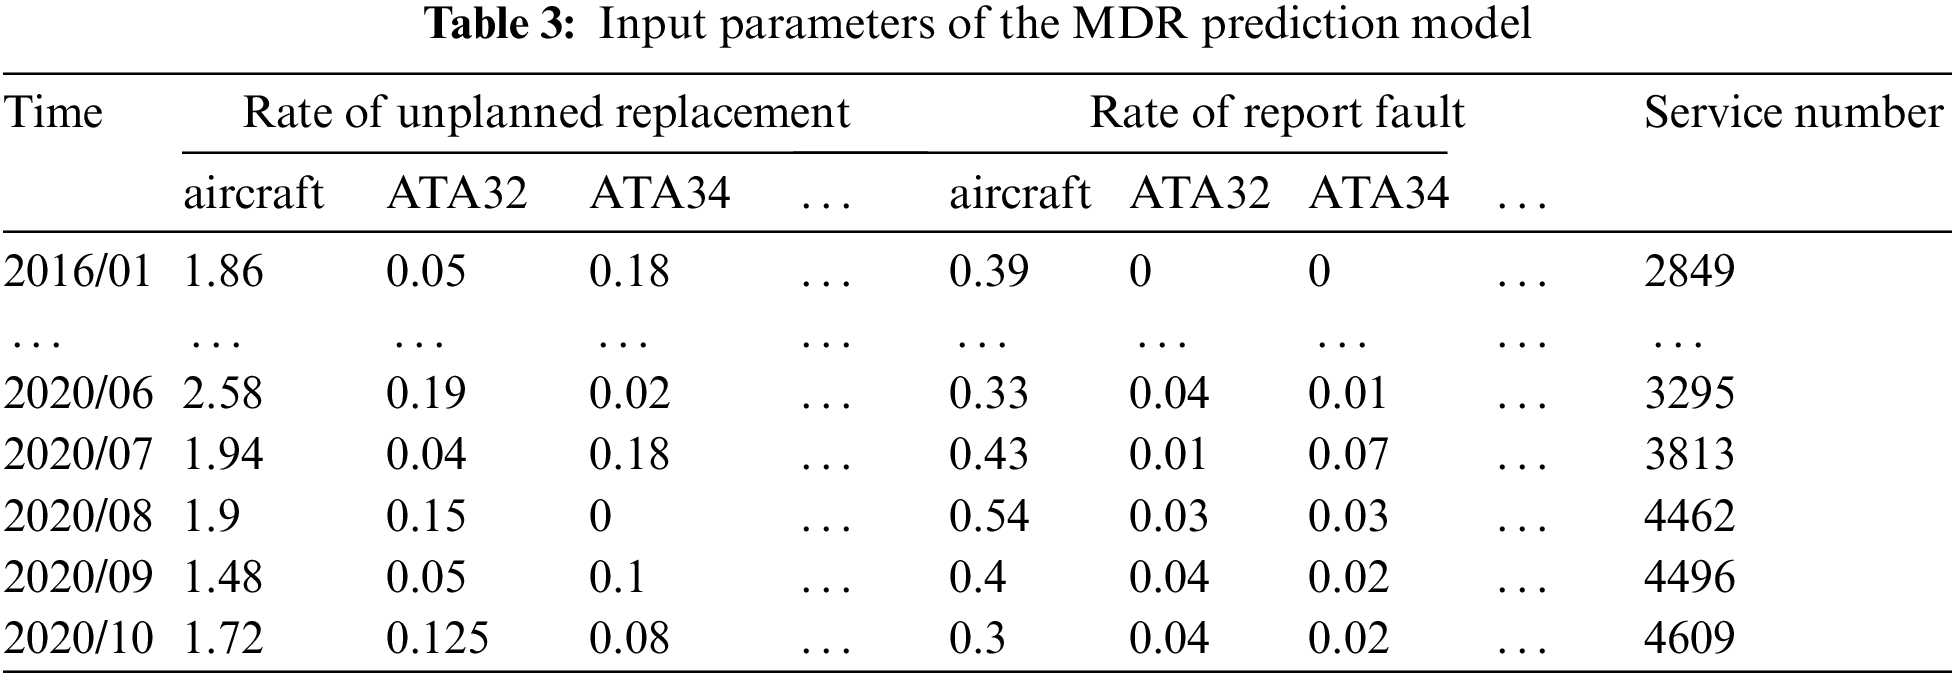
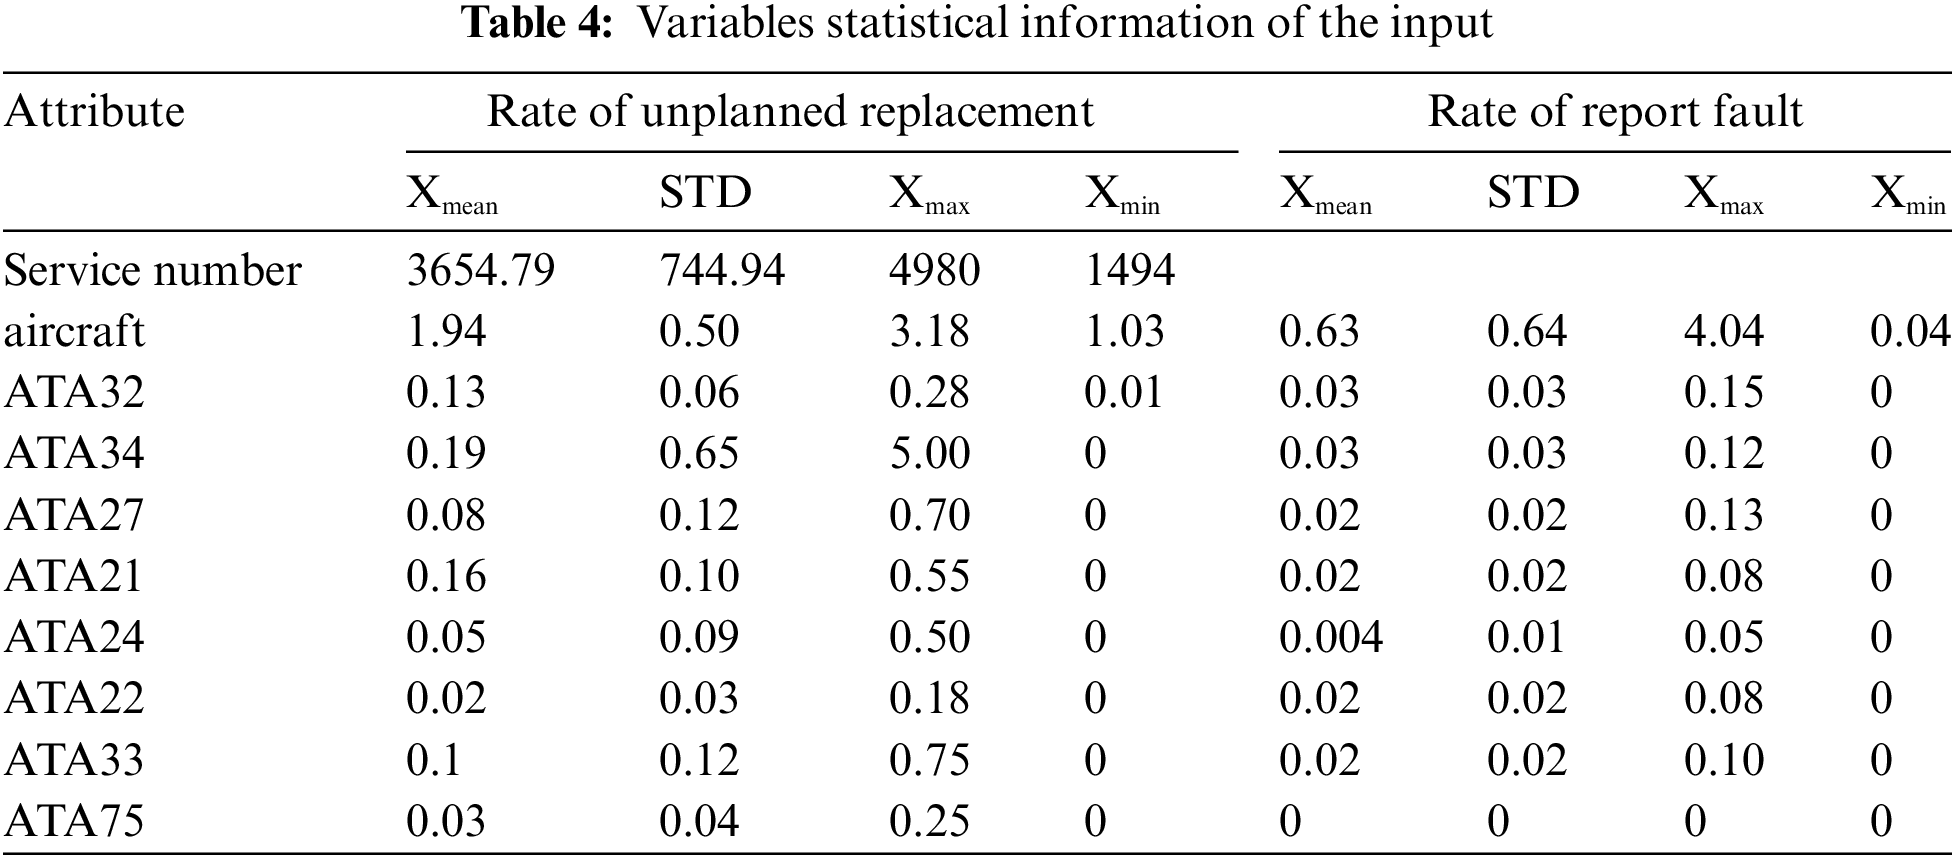
In Section 3.2 below, eight systems with the highest relation to MDR are obtained: Landing Gear (ATA32), Navigation (ATA34), Flight Control (ATA27), Air Conditioning (ATA21), Electrical Power (ATA24), Communication (ATA23), Auto flight (ATA22), Air (ATA75). The analysis process is described in detail in Section 3.2 below. To facilitate data interpretation, this section describes data preparation for the MDR prediction model. The unscheduled maintenance and unit report events about the corresponding systems which ranked in the top eight are selected. The input parameters of the aircraft and the system are calculated through Eq. (4) and shown in Table 3. Table 4 shows some statistical information on input parameters to better describe the data. Statistical information contains Maximum (Xmax), minimum (Xmin), mean (Xmean), and standard deviation (STD).
The purpose of this section is to calculate the resolution coefficient and resolution degree of the 29 systems and to determine the most likely impact on the dispatch of aircraft systems by ranking the associate degree. It is also easy to conclude from Eq. (3) that the so-called resolution degree is always the average value of the resolution coefficient. The resolution coefficient matrix can reflect the changing trend of the data association at different times. Fig. 5 shows the resolution coefficient with time-series characteristics in the form of a color diagram, to facilitate readers to observe whether the correlation degree at a certain time is consistent with the overall conclusion. Axis X is arranged in the order of ATA chapter number from small to large among the 29 systems (ATA 21/ATA 22/ATA 23/ATA 24/ATA 25/ATA 26/ATA 27/ATA 28/ATA29/ATA30/ATA31/ATA32/ATA33/ATA34/ATA35/ATA36/ATA44/ATA49/ATA52/ATA53ATA56/ATA70/ATA72/ATA73/ATA75/ATA77/ATA78/ATA79/ATA80). The Y axis is 58 months sequential, from near to far. The closer to yellow, the greater the correlation coefficient between the system and aircraft dispatch reliability currently. The fluctuation area is concentrated in the middle area.
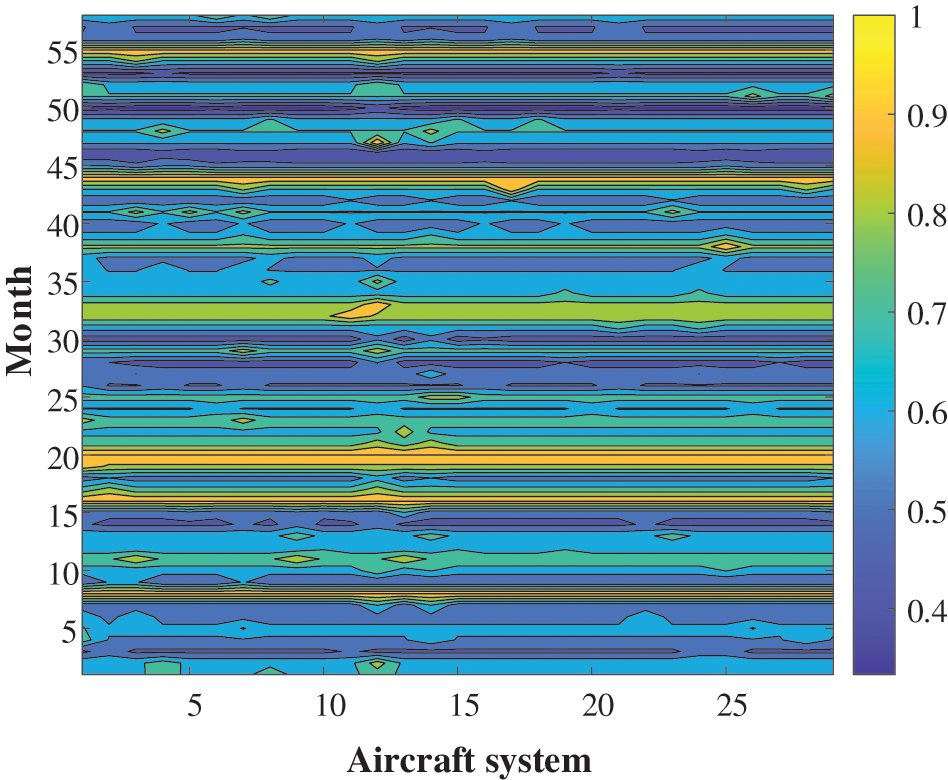
Figure 5: Resolution coefficient color diagram
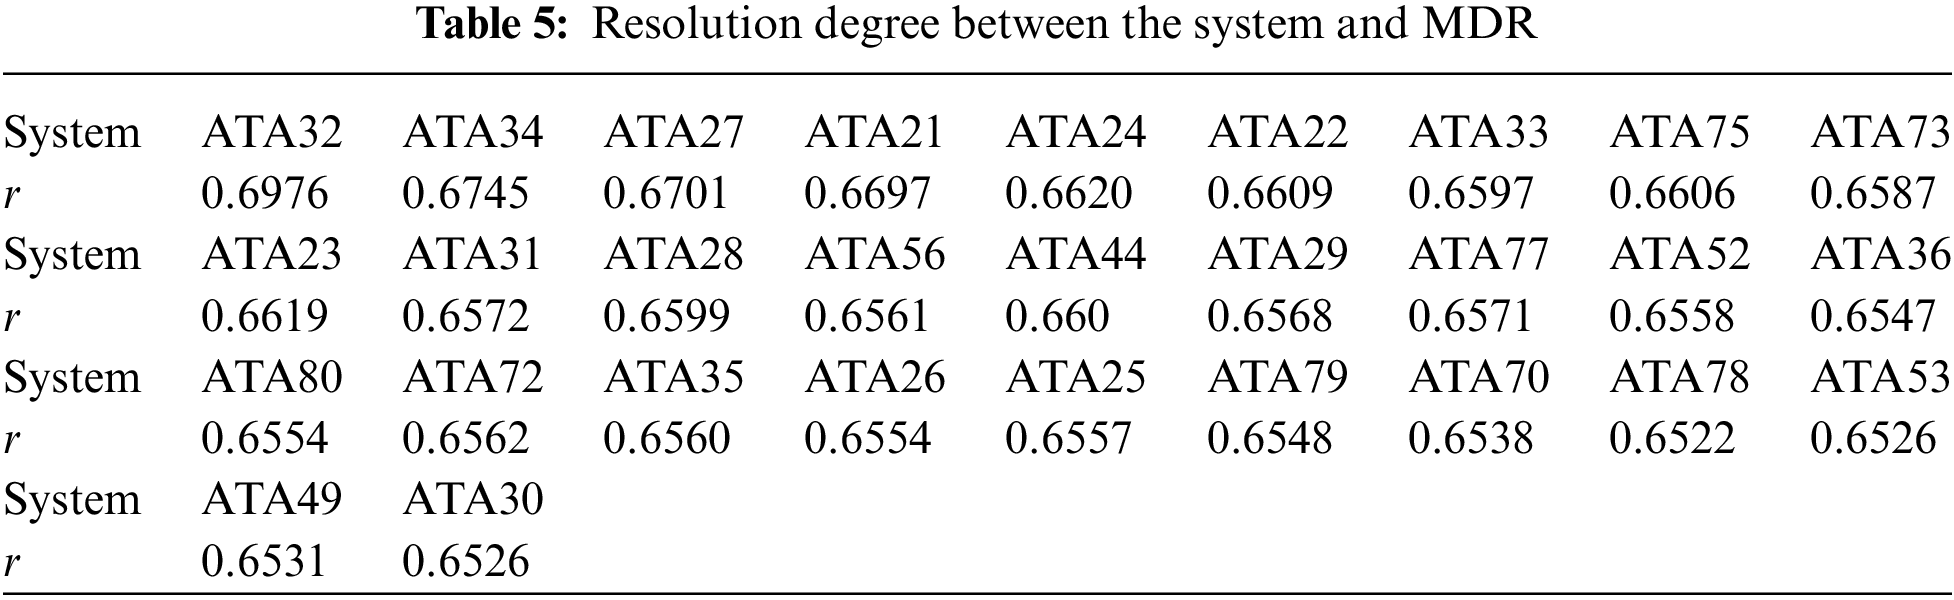
Through Eq. (3), we get the resolution degree between the system and the MDR of aircraft, shown in Table 5. The top eight systems with the highest relation on MDR are Landing Gear (ATA32), Navigation (ATA34), Flight Control (ATA27), Air Conditioning (ATA21), Electrical Power (ATA24), Communication (ATA23), Auto flight (ATA22), Air (ATA75).
4.1 Prediction and Verification
In Section 3.2 above, the highest-ranking systems are selected by ranking the relation between the system and MDR through grey relational analysis. The top eight systems with the highest relation on MDR are Landing Gear (ATA32), Navigation (ATA34), Flight Control (ATA27), Air Conditioning (ATA21), Electrical Power (ATA24), Communication (ATA23), Auto flight (ATA22), Air (ATA75). After confirming the system with the highest resolution, the input and output parameters of the model are also determined, so that learning and prediction work can be carried out. A total of 58 sets of data were collected and divided into two groups. The first 50 sets of data consist of training sets (input with serial number ‘1–50’ corresponds to the output with serial number ‘2–51’). The test set is composed of the last 7 groups of data (the input with the serial number ‘51–57’ corresponds to the output with the serial number ‘52–58’).
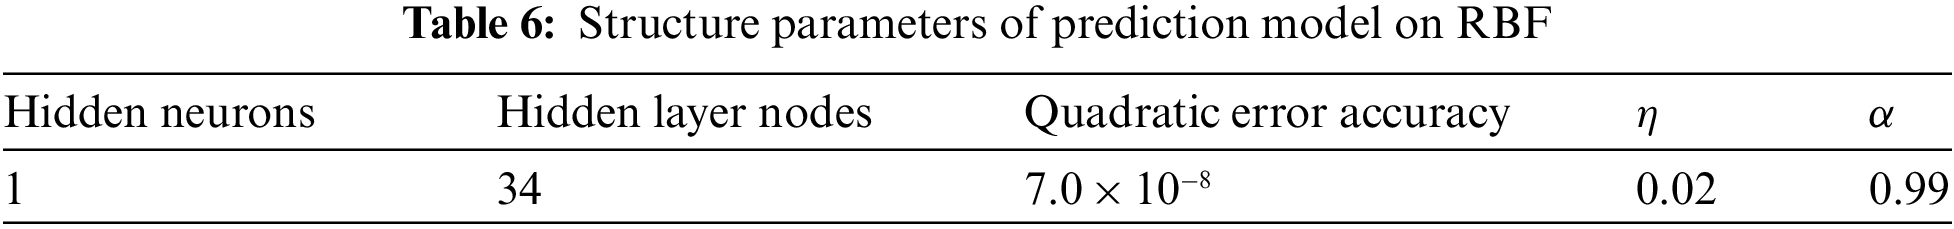
To carry out learning and forecasting, there is still some information to confirm. The structure of the RBF artificial neural network is set according to the application problem. After trying different network structures and their corresponding learning performance, the network structure parameters with the best prediction accuracy are shown in Table 6. The parameters to be set include the number of hidden layers, the number of neurons contained in the hidden layer, the learning rate, and the momentum factor.
Quadratic error accuracy requirement is a condition to judge whether the regular learning can be completed. When the accuracy of the error meets the requirements, the updated parameters with the smallest error are required. On average, a certain civil aircraft operates 3654 times a month, and a cancel & delay event accounts for 2.7 × 10⁻⁴ of the total, (2.7 × 10⁻⁴)2 = 7.5 × 10⁻⁸. That is to say, if the accuracy of the quadratic error is 7.0 × 10⁻⁸, the prediction of the number of cancel & delay events can be controlled within one.
Once the network structure is confirmed, the regression law can be given by learning, to generate the prediction model of MDR. The quadratic error Ep decreases gradually with the iteration, and finally reaches 6.9 × 10⁻⁸. The effect and error accuracy of the training and the test set are shown in Fig. 6, respectively. After learning, the average error of the training set is 1.0 × 10⁻⁴, and the average error of the test set is 5.0 × 10⁻⁴. The quadratic error Ep decreases gradually with the iteration, and finally reaches 6.9 × 10⁻⁸. This indicates that the prediction model is reasonable and effective.
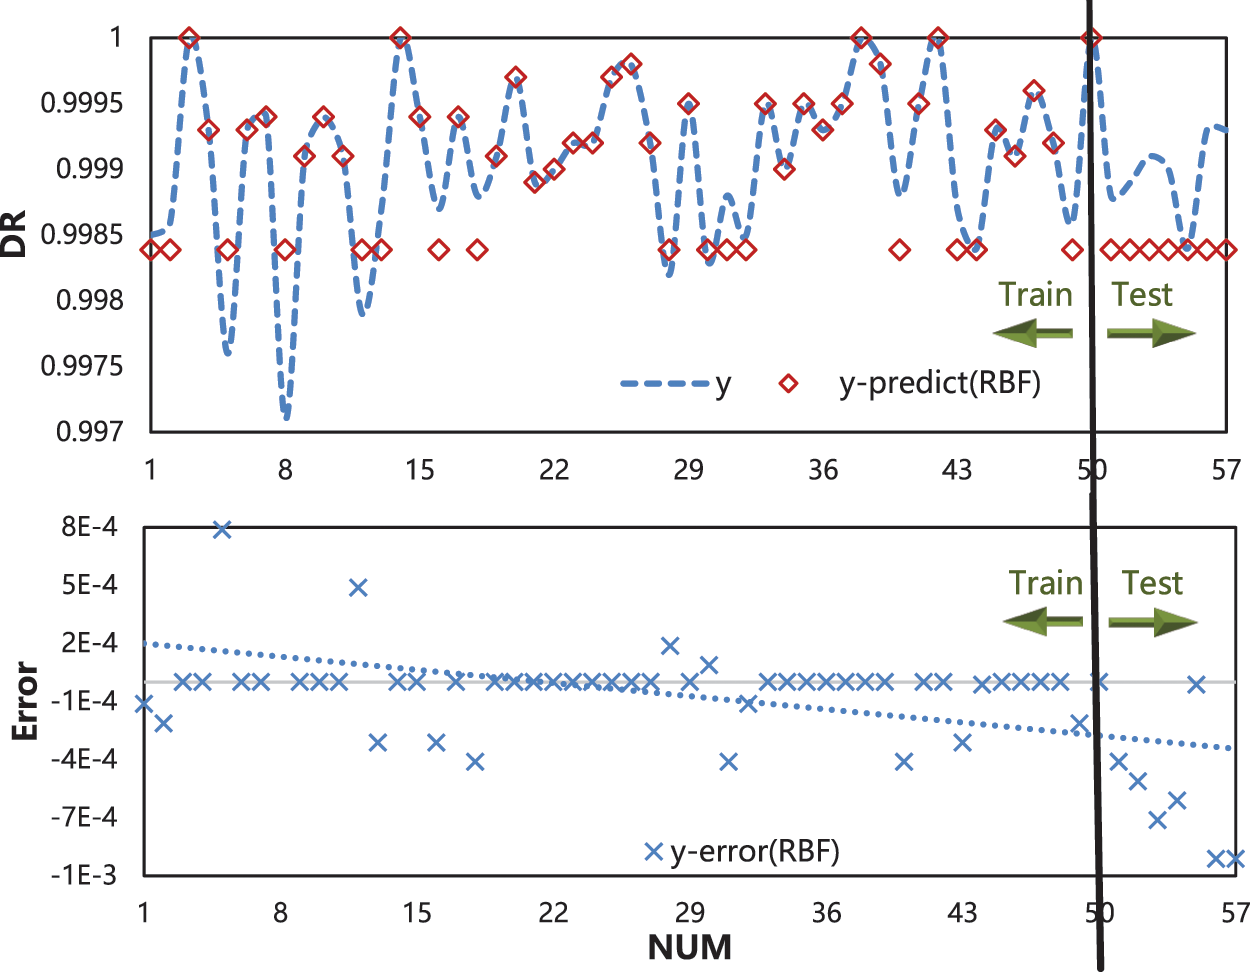
Figure 6: The effect (up) and error accuracy (down) of the set
To verify the accuracy and consistency of the model, this section further verifies the applicability of the method from the perspective of theoretical analysis. This verification can be divided into two aspects: one is the sensitivity of RBF ANN itself to the number of hidden layer neurons; the other is to compare RBF ANN with BP ANN and GA-BP ANN to verify the accuracy and efficiency of the model. Commonly use comparative statistics include the mean absolute error (MAE), root-mean-square error (RMSE), modified agreement index (d), and modified Nash-Sutcliffe efficiency (NSE) and maximum relative errors (Max (RE)). This error matrix is implemented to illustrate the agreement and accuracy level of the proposed models. The comparative statistics were evaluated using the following relations [34–36]:
Here, N denotes the number of data, Si and Yi is the i-th data points for the true value and predicted sets, respectively, and
RMSE was used as an index to analyze the sensitivity of RBF ANN, with hidden nodes as 10, 20, 25, 30, 35. By changing the number of hidden layer nodes, it tests whether increasing or reducing mapping points can change the extraction of effective features of training data describing the external environment. When the internal structure has redundant attributes, it will affect the advantages and disadvantages of the algorithm. The best network results can be judged by sensitivity analysis. Under different hidden layer nodes, the RMSE index of the model is shown in Fig. 7. The increase in the number of hidden nodes makes RMSE show a smaller trend. After the number is greater than 34, the model has been able to meet the accuracy requirement of modeling. Therefore, in Section 4.1, the number of hidden nodes is set to 34. This is consistent with the above conclusion. At the same time, the network structure of the model is reasonable, which has also been verified.
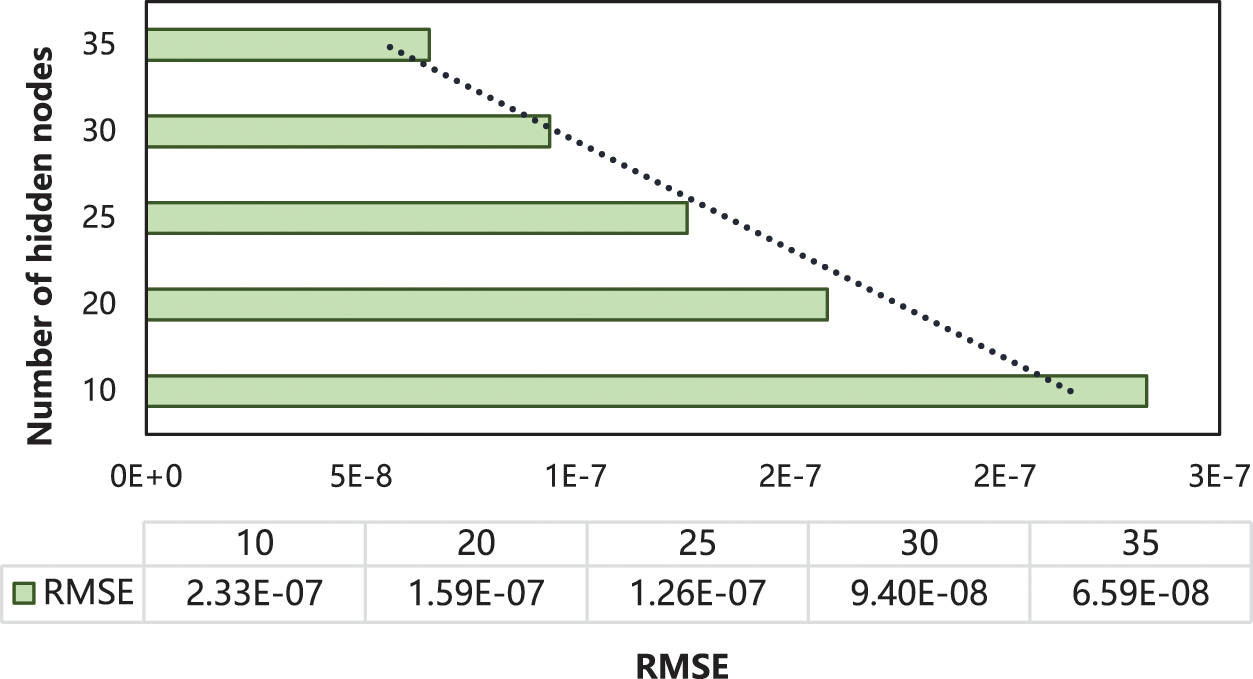
Figure 7: Sensitivity of hidden nodes based on RMSE
To verify the calculation accuracy and efficiency of the model and prove the applicability of RBF ANN in small sample problems, especially MDR prediction problems, this section next compares the advantages of RBF ANN, BP ANN, and GA-BP (Improving BP neural network by genetic algorithm (GA)) ANN through comparative factors under the same network structure. All three methods will be modeled as specified in Table 6. Comparative factors are shown in Table 7. Fig. 8 clearly shows the comparison results of the three methods. All factors in the table show that RBF has obvious advantages over other methods. The prediction effect of RBF is much better than BP. In the small sample problem of multidimensional variables, BP has a weak ability to accurately deal with the mapping relationship between multidimensional variables. BP needs more group inputs to support the training process, and RBF can show its advantages in this regard; The training effect of GA-BP is also much better than BP because it finds the best initial position of weight and threshold through iteration, but its ability is still weaker than RBF. Especially in the comparison of fitting degrees, it is obvious that RBF has a better fitting degree and can learn more minor changes. Instead of using changes around the average to weaken the size of the error.
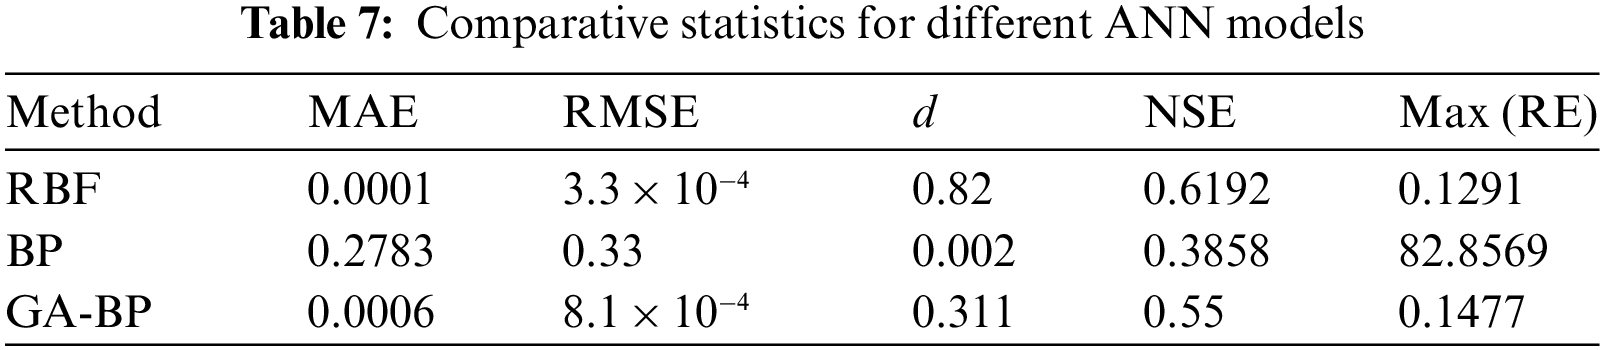
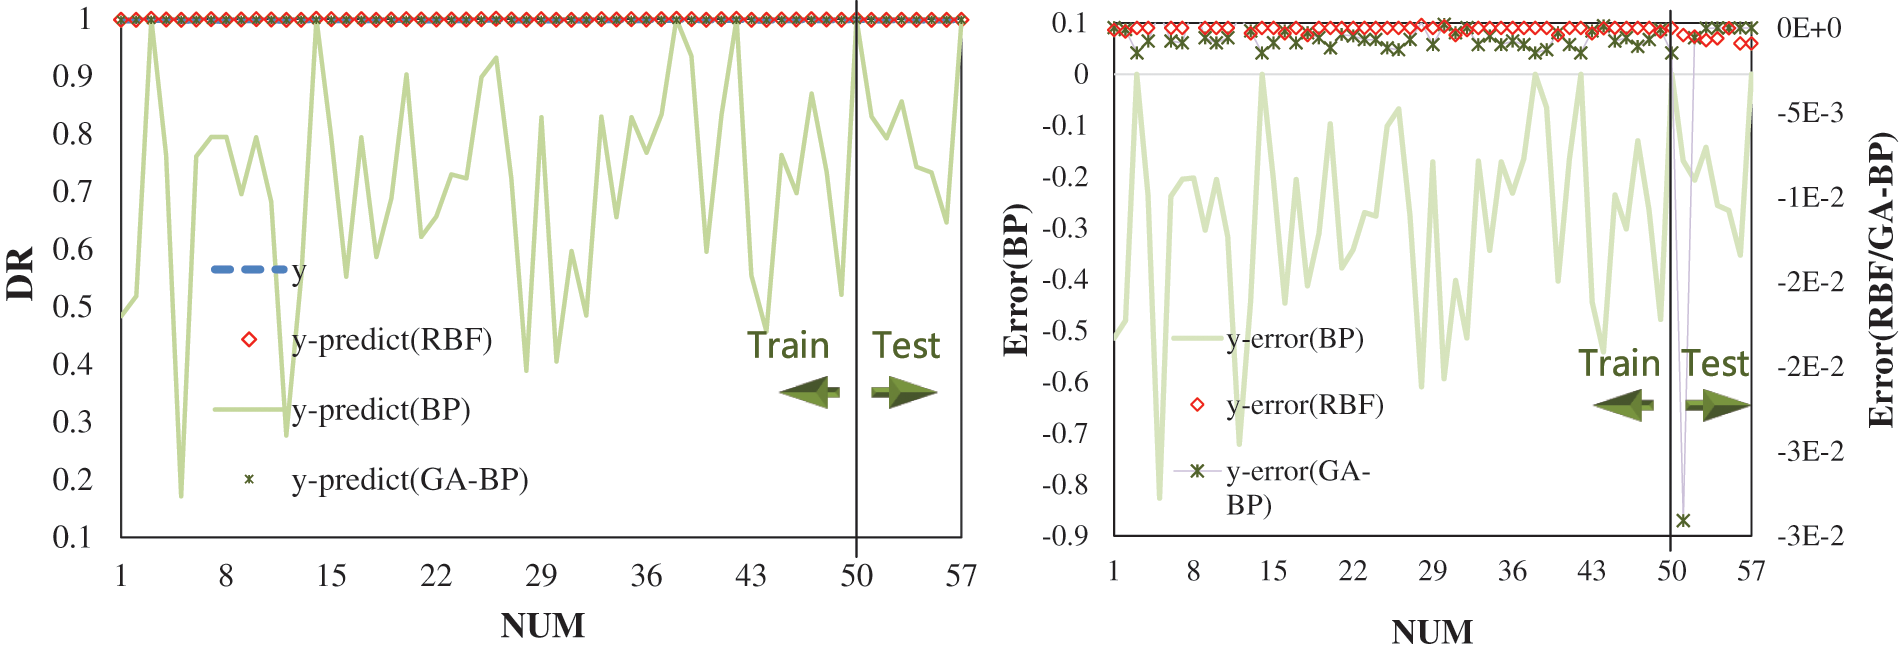
Figure 8: Comparison of three methods
In this paper, a mechanical dispatch reliability prediction model for civil aircraft is established. Using grey relational analysis to carry out correlation analysis to determine the input parameters and combining RBF artificial neural network training and rule fitting, a prediction model is established to achieve the predictive function of MDR. Some main conclusions are summarized below:
(1) A predictive model for dispatching reliability is established, and its input parameters should consider parameters that can reflect the real-time operating status. In this paper, the system health status parameters scattered in time sequence, such as unscheduled maintenance events, unit report events, and service numbers, are used to predict the machinery dispatch reliability, which can quantitatively reflect the impact of aircraft health status on the flight dispatch. The direct correlation between aircraft system health status and MDR is helpful for all stakeholders to carry out maintenance and support work.
(2) Taking the corresponding operational data of the system and the whole aircraft as input, the RBF artificial neural network is used to establish the prediction model. The performance of quadratic error can reach 6.9 × 10⁻⁸, which means that the prediction of the number of cancel & delay events by the MDR prediction model can be controlled within one time. This indicates that the prediction model is reasonable and effective in a practical sense. The results also show that RBF ANN has better adaptability to this kind of multidimensional and small sample problems, compared with BP ANN and GA-BP ANN.
(3) The significance of this model is to predict the mechanical dispatch reliability of civil aircraft and to predict the impact of the health status or performance of the aircraft system on the flight dispatch and the economic benefits. If the non-mechanical cancel & delay events can be further collected completely, and draw out the distribution law of non-mechanical inducements, by increasing the non-mechanical input parameter, we can further realize the prediction of the whole dispatch reliability of civil aircraft.
Funding Statement: This paper is supported by research fund for Civil Aircraft of Ministry of Industry and Information Technology (MJ-2020-Y-14) and project funded by China Postdoctoral Science Foundation (Grant No. 2021M700854).
Conflicts of Interest: The authors declare that they have no conflicts of interest to report regarding the present study.
References
1. Xia, J., Feng, Y. W., Lu, C., Fei, C. W., Xue, X. F. (2021). LSTM-based multi-layer self-attention method for remaining useful life estimation of mechanical systems. Engineering Failure Analysis, 125(7), 105385. DOI 10.1016/j.engfailanal.2021.105385. [Google Scholar] [CrossRef]
2. Teng, D., Feng, Y. W., Lu, C., Fei, C. W., Liu, J. Q. et al. (2021). Novel Kriging-based decomposed-coordinated approach for estimating the clearance reliability of assembled structures. Computer Modeling in Engineering & Sciences, 129(2), 1029–1049. DOI 10.32604/cmes.2021.016945. [Google Scholar] [CrossRef]
3. Lu, C., Feng, Y. W., Fei, C. W., Bu, S. Q. (2020). Improved decomposed-coordinated Kriging modeling strategy for dynamic probabilistic analysis of multicomponent structures. IEEE Transactions on Reliability, 69(2), 440–457. DOI 10.1109/TR.2019.2954379. [Google Scholar] [CrossRef]
4. Lu, C., Feng, Y. W., Rhea, P., Fei, C. W. (2018). Improved Kriging with extremum response surface method for structural dynamic reliability and sensitivity analyses. Aerospace Science and Technology, 76(5), 164–175. DOI 10.1016/j.ast.2018.02.012. [Google Scholar] [CrossRef]
5. Liu, J. Q., Feng, Y. W., Lu, C., Pan, W. H., Teng, D. (2021). Vibration reliability analysis of aeroengine rotor based on intelligent neural network modeling framework. Shock and Vibration, 2021(4), 9910601. DOI 10.1155/2021/9910601. [Google Scholar] [CrossRef]
6. Yang, W. Y., Guo, J. Y., Liu, Y., Zhai, G. (2019). Multi-objective optimization of contactor’s characteristics based on RBF neural networks and hybrid method. IEEE Transactions on Magnetics, 55(6), 1–4. DOI 10.1109/TMAG.2019.2896339. [Google Scholar] [CrossRef]
7. Katsiropoulos, C. V., Drainas, E. D., Pantelakis, S. G. (2014). Assessing the quality of adhesive bonded joints using an innovative neural network approach. International Journal of Structural Integrity, 5(3), 187–201. DOI 10.1108/IJSI-01-2014-0003. [Google Scholar] [CrossRef]
8. Guo, Y., Zhong, M., Gao, C., Huang, H., Liang, X. et al. (2021). A discrete-time Bayesian network approach for reliability analysis of dynamic systems with common cause failures. Reliability Engineering & System Safety, 216(12), 108028. DOI 10.1016/j.ress.2021.108028. [Google Scholar] [CrossRef]
9. Lee, D., Choi, D. (2019). Analysis of the reliability of a starter-generator using a dynamic Bayesian network. Reliability Engineering & System Safety, 195(3), 106628. DOI 10.1016/j.ress.2019.106628. [Google Scholar] [CrossRef]
10. Zhi, P., Xu, Y., Chen, B. (2020). Time-dependent reliability analysis of the motor hanger for emu based on stochastic process. International Journal of Structural Integrity, 11(3), 453–469. DOI 10.1108/IJSI-07-2019-0075. [Google Scholar] [CrossRef]
11. Long, K. C., Duff, W. S., Labadie, J. W., Stansloski, M. J., Sampath, W. S. et al. (2015). Multi-objective fatigue life optimization using tabu genetic algorithms. International Journal of Structural Integrity, 6(6), 677–688. DOI 10.1108/IJSI-12-2014-0066. [Google Scholar] [CrossRef]
12. Serafinska, A., Ozenc, K., Kaliske, M. (2017). A coupled approach of optimization, uncertainty analysis and configurational mechanics for a fail-safe design of structures. International Journal for Numerical Methods in Engineering, 109(1), 125–152. DOI 10.1002/nme.5282. [Google Scholar] [CrossRef]
13. Zhu, S. P., Keshtegar, B., Bagheri, M., Hao, P., Trung, T. N. (2020). Novel hybrid robust method for uncertain reliability analysis using finite conjugate map. Computer Methods in Applied Mechanics and Engineering, 371, 113309. DOI 10.1016/j.cma.2020.113309. [Google Scholar] [CrossRef]
14. Chung, E., Hanks, J. S. (2016). Fault tree analyses as a tool for flight control system architecture design. 2016 Annual Reliability and Maintainability Symposium (RAMS), pp. 1–6. USA. DOI 10.1109/RAMS.2016.7447963. [Google Scholar] [CrossRef]
15. Chen, G. Y., Chen, L., Cheng, C., Zhang, X. (2021). A novel expectation–maximization-based separable algorithm for parameter identification of RBF-AR model. Nonlinear Dynamics, 104(7), 4023–4034. DOI 10.1007/s11071-021-06580-3. [Google Scholar] [CrossRef]
16. Jankowska, M. A., Karageorghis, A., Chen, C. S. (2018). Improved kansa RBF method for the solution of nonlinear boundary value problems. Engineering Analysis with Boundary Elements, 87(2), 173–183. DOI 10.1016/j.enganabound.2017.11.012. [Google Scholar] [CrossRef]
17. Liu, T., Chen, S., Liang, S., Harris, C. J. (2020). Fast adaptive gradient RBF networks for online learning of nonstationary time series. IEEE Transactions on Signal Processing, 3(99), 2981197. DOI 10.1109/TSP.2020.2981197. [Google Scholar] [CrossRef]
18. Peng, X., Wu, Q., Cai, Y., Lou, L., Yu, Y. et al. (2019). The application of radial basis function interpolation in reactor core power distribution on-line monitoring. Annals of Nuclear Energy, 132(10), 752–762. DOI 10.1016/j.anucene.2019.06.059. [Google Scholar] [CrossRef]
19. Nahal, M., Khelif, R. (2021). A finite element model for estimating time-dependent reliability of a corroded pipeline elbow. International Journal of Structural Integrity, 12(2), 306–321. DOI 10.1108/IJSI-02-2020-0021. [Google Scholar] [CrossRef]
20. Bineid, M., Fielding, J. P. (2003). Development of a civil aircraft dispatch reliability prediction methodology. Aircraft Engineering and Aerospace Technology, 75(6), 588–594. DOI 10.1108/00022660310503066. [Google Scholar] [CrossRef]
21. Bineid, M., Fielding, J. P. (2016). Development of an aircraft systems dispatch reliability design methodology. Aeronautical Journal, 110(1108), 345–352. DOI 10.1017/s0001924000001251. [Google Scholar] [CrossRef]
22. Mofokeng, T., Mativenga, P. T., Marnewick, A. (2020). Analysis of aircraft maintenance processes and cost. Procedia CIRP, 90(8), 467–472. DOI 10.1016/j.procir.2020.01.115. [Google Scholar] [CrossRef]
23. Rodrigues, R. S., Balestrassi, P. P., Paiva, A. P., Garcia, D. A., Pontes, F. J. (2012). Aircraft interior failure pattern recognition utilizing text mining and neural networks. Journal of Intelligent Information Systems, 38(3), 741–766. DOI 10.1007/s10844-011-0176-1. [Google Scholar] [CrossRef]
24. Lu, Z., Zhou, J., Li, X. (2018). Monte carlo simulation-based time limited dispatch analysis with the constraint of dispatch reliability for electronic engine control systems. Aerospace Science and Technology, 72(1), 397–408. DOI 10.1016/j.ast.2017.11.023. [Google Scholar] [CrossRef]
25. Darren, P., John, A. (2016). Modelling the use of maintenance to minimise aircraft service disruption. IFAC Proceedings Volumes, 43(3), 44–49. DOI 10.3182/20100701-2-PT-4012.00009. [Google Scholar] [CrossRef]
26. Lu, Z., Liang, X., Zuo, M. J., Zhou, J. (2017). Markov process-based time limited dispatch analysis with constraints of both dispatch reliability and average safety levels. Reliability Engineering & System Safety, 167(3), 84–94. DOI 10.1016/j.ress.2017.05.031. [Google Scholar] [CrossRef]
27. Koornneef, H., Verhagen, W., Curran, R. (2020). A decision support framework and prototype for aircraft dispatch assessment. Decision Support Systems, 135(8), 113338. DOI 10.1016/j.dss.2020.113338. [Google Scholar] [CrossRef]
28. Wen, Z., Jian, J. (2016). Redefinition of dispatch reliability along with dispatch modeling and simulation. 2016 Annual Reliability and Maintainability Symposium (RAMS), pp. 1–6. USA. DOI 10.1109/RAMS.2016.7448087. [Google Scholar] [CrossRef]
29. Balicki, W., Gowacki, P., Loroch, L. (2020). Large aircraft reliability study as important aspect of the aircraft systems’ design changes and improvements. Proceedings of the Institution of Mechanical Engineers, Part G: Journal of Aerospace Engineering, 235(1), 2092562. DOI 10.1177/0954410020925626. [Google Scholar] [CrossRef]
30. Miriam, A., Anna, G., Daniela, M., Koak, P. (2021). Civil aviation occurrences in Slovakia and their evaluation using statistical methods. Sustainability, 13(10), 5396. DOI 10.3390/su13105396. [Google Scholar] [CrossRef]
31. Hong, H. C., Zhang, Z. Y., Guo, A. D., Shen, L. G., Sun, H. J. et al. (2020). Radial basis function artificial neural network (RBF ANN) as well as the hybrid method of RBF ANN and grey relational analysis able to well predict trihalomethanes levels in tap water. Journal of Hydrology, 591(12), 125574. DOI 10.1016/j.jhydrol.2020.125574. [Google Scholar] [CrossRef]
32. Henderson, Z. (2001). In-service commercial aircraft discrepancies effect on dispatch reliability and warranty claims. Dominguez Hills: California State University. [Google Scholar]
33. Deng, Y., Zhou, X., Shen, J., Xiao, G., Liao, B. Q. (2021). New methods based on back propagation (BP) and radial basis function (RBF) artificial neural networks (ANNs) for predicting the occurrence of haloketones in tap water. Science of the Total Environment, 772(6), 145534. DOI 10.1016/j.scitotenv.2021.145534. [Google Scholar] [CrossRef]
34. Keshtegar, B., Bagheri, M., Fei, C. W., Lu, C., Thai, D. K. (2021). Multi-extremum-modified response basis model for nonlinear response prediction of dynamic turbine blisk. Engineering with Computers, 38, 1243–1254. DOI 10.1007/s00366-020-01273-8. [Google Scholar] [CrossRef]
35. Keshtegar, B., Allawi, M. F., Afan, H. A., Shafie, A. E. (2016). Optimized river stream-flow forecasting model utilizing high-order response surface method. Water Resources Management, 30(11), 1–16. DOI 10.1007/s11269-016-1397-4. [Google Scholar] [CrossRef]
36. Hasanipanah, M., Keshtegar, B., Thai, D. K., Troung, N. T. (2020). An ANN-adaptive dynamical harmony search algorithm to approximate the flyrock resulting from blasting. Engineering with Computers, 7(11), 1257–1269. DOI 10.1007/s00366-020-01105-9. [Google Scholar] [CrossRef]
Cite This Article
 Copyright © 2023 The Author(s). Published by Tech Science Press.
This work is licensed under a Creative Commons Attribution 4.0 International License , which permits unrestricted use, distribution, and reproduction in any medium, provided the original work is properly cited.
 Downloads
 Citation Tools