 Open Access
ARTICLE
System Reliability Analysis for Truss Structures Based on Automatic Updated Model
State Key Laboratory of Mechanical Behavior and System Safety of Traffic Engineering Structures, Shijiazhuang Tiedao University, Shijiazhuang, 050043, China
* Corresponding Author: Cunbao Zhao. Email:
(This article belongs to the Special Issue: Computer Modeling in Ocean Engineering Structure and Mechanical Equipment)
Computer Modeling in Engineering & Sciences 2023, 134(3), 2057-2071. https://doi.org/10.32604/cmes.2022.022394
Received 08 March 2022; Accepted 06 May 2022; Issue published 20 September 2022
Abstract
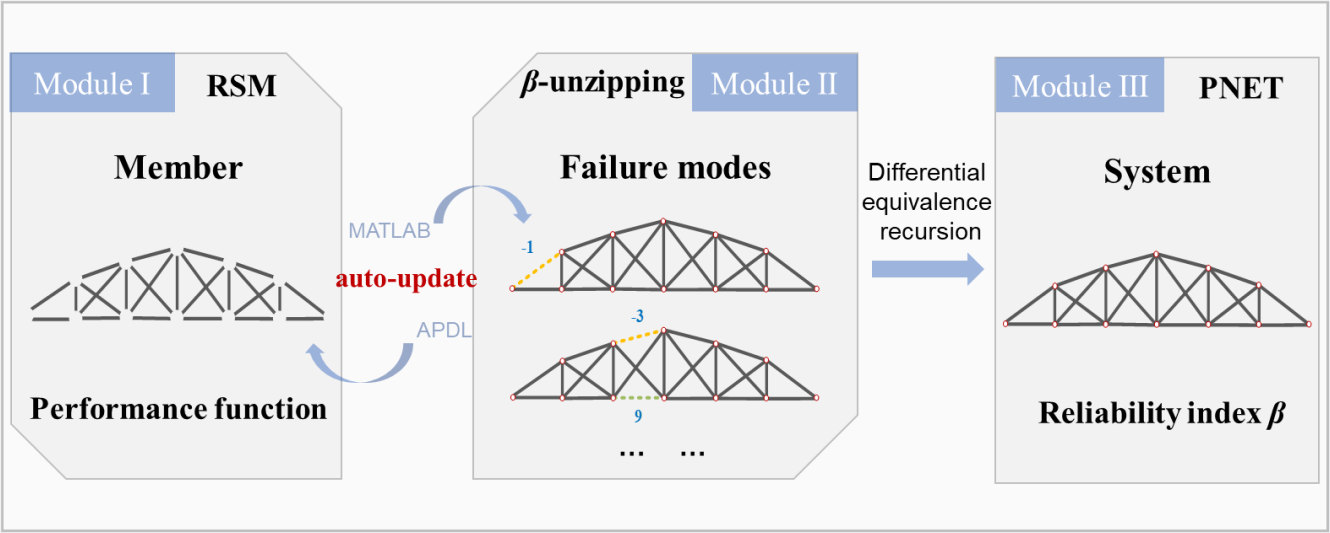
Multiple failure modes tend to be identified in the reliability analysis of a redundant truss structure. This identification process involves updating the model for identifying the next potential failure members. Herein we intend to update the finite element model automatically in the identification process of failure modes and further perform the system reliability analysis efficiently. This study presents a framework that is implemented through the joint simulation of MATLAB and APDL and consists of three parts: reliability index of a single member, identification of dominant failure modes, and system-level reliability analysis for system reliability analysis of truss structures. Firstly, RSM (response surface method) combines with a constrained optimization model to calculate the reliability indices of members. Then the β-unzipping method is adopted to identify the dominant failure modes, and the system function in MATLAB, as well as the EKILL command in APDL, is used to facilitate the automatic update of the finite element model and realize load-redistribution. Besides, the differential equivalence recursion algorithm is performed to approximate the reliability indices of failure modes efficiently and accurately. Eventually, the PNET (probabilistic network evaluation technique) is used to calculate the joint failure probability as well as the system reliability index. Two illustrative examples demonstrate the accuracy and efficiency of the proposed system reliability analysis framework through comparison with corresponding references.Graphic Abstract
Keywords
For a complex structure, multiple failure modes can result in its failure. It is essential to analyze the system-level reliability of a structure to achieve an accurate reliability estimation. Consequently, many research efforts to estimate the failure probability at the system level had been put forward for the past few decades. The identification of dominant failure modes and the joint failure probability of dominant failure modes are the major challenges of the system reliability analysis for a structure.
Innumerable failure modes can lead to the failure of a redundant structural system, and estimating the system reliability by means of dominant failure modes is sufficiently accurate, which was demonstrated in the past research. Many methods have been proposed to identify dominant failure modes such as the incremental loading method [1,2], branch and bound method [3,4], and β-unzipping method [5,6]. For instance, a new branch and bound method named the B3 method was illustrated, which overcame the challenge that the traditional branch and bound method only can obtain the lower bound of failure probability of the system and decreased the time-consuming computation [4]. Moreover, Lu et al. [6] used the β-unzipping method to search for its dominant failure modes efficiently and accurately to analyze the system-level reliability of a complicated cable-stayed bridge. Meanwhile, the simulation methods based on selecting sample points according to the statistical parameters of random variables, which include the genetic algorithm (GA) [7–9], and representative samples [10], etc., are also efficient and accurate to search for dominant failure modes. For example, Jiang et al. [10] reported a method based on representative samples which are limit-state sample points to identify the dominant failure modes efficiently.
Through the dominant failure modes obtained, the joint failure probability or system-level reliability index can be computed, which is another challenge. A number of methods have been proposed to overcome this difficulty, such as the wide bound method [11], the narrow-bound method [12], and PNET [13–15]. MCS (Monte Carlo Simulation) [16,17] is an extremely accurate method to calculate the failure probability, which usually adopts important sampling and LHS (Latin Hypercube Sampling). Nonetheless, a large number of simulations are required for MCS, and to overcome this defect, Cornell and Ditlevsen came up with a wide bound method [11] and a narrow-bound method [12] separately to rapidly estimate the interval in which the failure probability lies. The PNET (probabilistic network evaluation technique) introduced by Ma can obtain the system failure probability efficiently, which had become a feasible method for reliability analysis of ductile structures [13].
Besides, the performance function of the structure is usually implicit in practical engineering, which facilitated the rapid development of surrogate models such as RSM (response surface method), Kriging model, and neural network etc. [18–21] in recent years. For example, the iterative improved response surface method (reported by Goswami et al. [19]) combined the moving least-squares method and simplified DOE to analyze the reliability of structures, which reduced the number of iterations and improved the accuracy of reliability.
Herein, we propose a reliability evaluation framework that can calculate the system reliability index and system failure probability to analyze the system reliability for a truss structure with the implicit performance function. This framework is realized through the joint simulation of MATLAB and APDL. Its program is written in MATLAB, which can drive APDL to build a model, output responses, etc. for further calculating the system reliability index of the truss automatically. The performance function of each member is firstly constructed by RSM to avoid the implicit performance function problem, and the reliability index of each member is computed by a constrained optimization model that is built according to the geometric meaning of the reliability index. Then the dominant failure modes are identified by the β-unzipping method, and further PNET is conducted to calculate the system reliability index. Eventually, the accuracy and efficiency of the proposed framework are demonstrated through two examples in Section 3.
2 A Framework for System Reliability Analysis of Truss Structures
A practical truss structure consisting of numerous members is usually redundant, and it is usually a complex system incorporating multiple failure modes. Therefore, the reliability analysis of truss structures should be considered at the system level to perform an accurate reliability evaluation.
2.1 Reliability Analysis for the Member of Truss Structures
In structural reliability analysis, one challenge is building the performance function due to the nonlinearity of the structure that may result in the implicit performance function. It is assumed that the performance function is
where
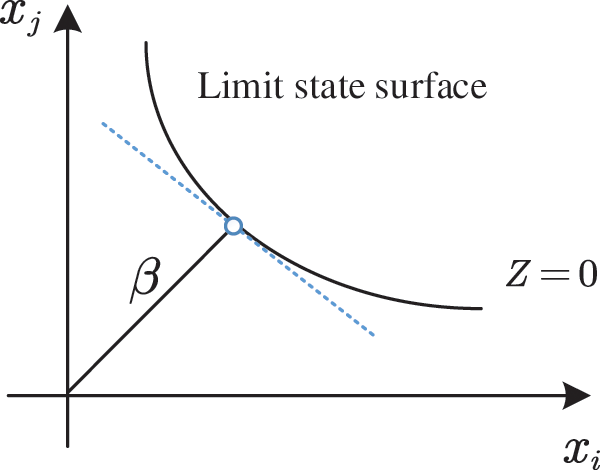
Figure 1: Illustration of the reliability index in the standard normal space
The RSM [18,19] is adopted to overcome the difficulty of the implicit performance function and realize the automated process. The quadratic polynomial without cross term employed to fit response surface function is written as:
where the coefficients a ,
(1) Determine the initial iteration point
(2) Calculate the performance function values of
(3) Solve the equation set of response surface functions. The equation set is given as:
where the subscripts i and k of
where the vector
The X is supposed as:
The unknown coefficient matrix
thus the
(4) Perform the calculation of the reliability index β and get the checkpoint
(5) If accuracy meets the requirement, output the reliability index β, otherwise obtain a new point
During this process of RSM, the reliability index plays an important role in performing response surface fitting on account of its relation to the final convergence. According to the geometric meaning of the reliability index, a constrained optimization model [23–25] is built shown in Eq. (9), where Z represents the performance function in order to compute the reliability index accurately and efficiently. Note that
Accordingly, the reliability index can be obtained by solving the constrained optimization model. It is essential to search for the optimal solution in the variable space to find the accurate reliability index efficiently. Many algorithms were proposed to solve this problem such as differential evolution algorithm, genetic algorithm, particle swarm optimization, etc. The proposed framework is based on MATLAB programming, hence, considering the convenience of programming and computational efficiency, the fmincon function of MATLAB is applied to perform a search for the reliability index. The fmincon function is a nonlinear programming solver that can find the minimum of a constrained nonlinear multivariable function. When we use this function, an initial point is required so that the search for the optimal solution starts at the initial point. Moreover, the MCS and RSM combined with the fmincon function are adopted respectively to calculate the reliability indices of case 1 and case 2 to verify the accuracy of RSM combined with the fmincon function. For the two cases, the Latin Hypercube Sampling (LHS) method is used for generating 106 samples uniformly according to the distribution of variables to obtain accurate reliability indices. The results of RSM combined with the fmincon function for case 1 and case 2 converged after 5 and 4 iterations respectively shown in Fig. 2a. Besides, the errors of the MCS method and RSM combined with the fmincon function are only 0.526% and 0.691% respectively for case 1 and case 2 shown in Fig. 2b, which illustrates the high accuracy of RSM combined with the fmincon function to calculate the reliability index.
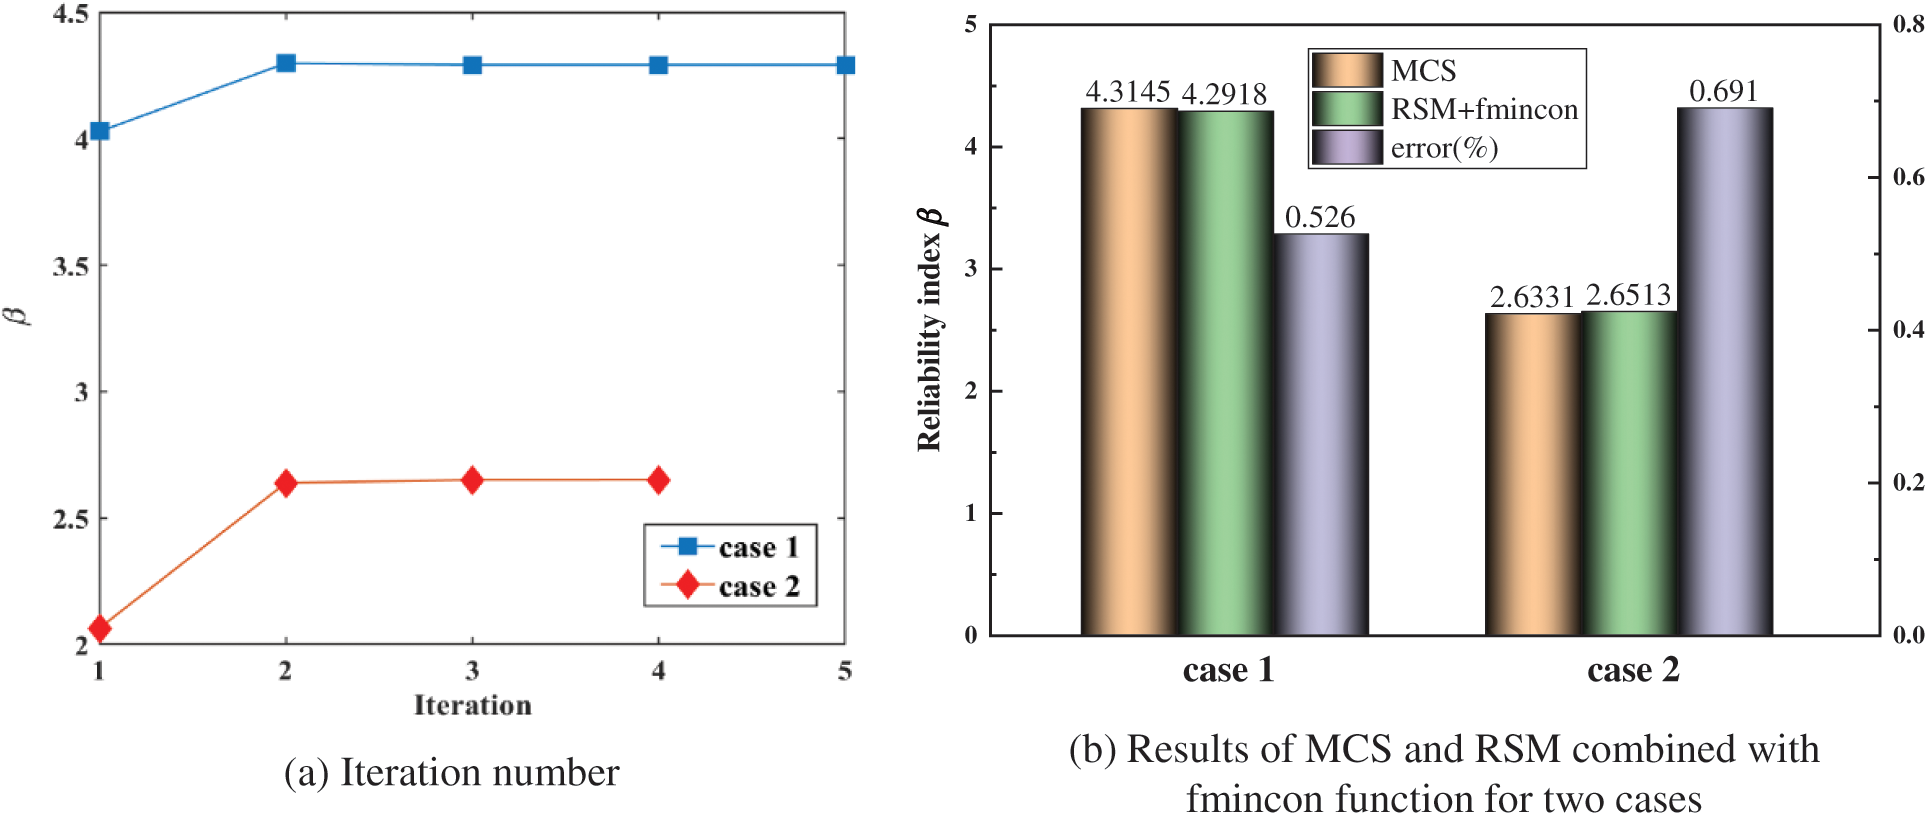
Figure 2: Calculation details of case 1 and case 2
Case 1.
Case 2.
2.2 Identification of Dominant Failure Modes and Updating Model Automatically
For a redundant truss structure, the failure of one component does not destroy it immediately, instead, the failure of a series of components results in structural failure. The β-unzipping method was selected to search for the dominant failure modes [6]. It is assumed that a system consists of n components and (k-1) components are failure components that are denoted as
As Section 2.1 described, the finite element model provides the response value of each member to build its performance function. Moreover, the search process of the β-unzipping method ends until the truss shows a system-level failure or the load-redistributions cause no more local failures [8]. These mentioned operations are involved in updating the finite element model. The MATLAB and ANSYS are utilized together to implement the model updated according to the failure components of each level in real-time and automatically without operating in the interface of ANSYS, which can greatly improve convenience and efficiency. In general, MATLAB uses the system function to enable APDL to enter Batch mode and drive APDL to run [26,27], then the finite element model will be updated through the command flow of APDL which includes the EKILL command that can delete the corresponding failure members delivered by MATLAB as well as other commands to apply corresponding forces at the nodes of deleted members. The details of system function in MATLAB and EKILL command in APDL are presented in Appendix A.
Through the mentioned operation above, the updates of the finite element model and load distribution can be realized automatically. Fig. 3 shows the identification process of one failure mode (6 → 2) of a six-bar truss to illustrate the automatic operation process for members with elastic-plastic behavior. The programming will delete the No. 6 member firstly and apply the corresponding forces at the two nodes of this deleted member, then search for the next failure member No. 2 and judge the failure of the structure thereby achieving the automatic identification of failure modes.

Figure 3: Identification process of one failure mode (6 → 2)
2.3 System Reliability Analysis for Truss Structures
There may be a great number of dominant failure modes identified by the β-unzipping method, and the PNET is applied to compute the system reliability index based on the dominant failure modes. Meanwhile, the differential equivalence recursion algorithm [28,29] is adopted to acquire the reliability indices of the failure modes. However, adapting the quadratic polynomial to fit the response surface makes the performance function of each member nonlinear. And it needs to be transformed into a linear function by Taylor expansion at the design point of the member to obtain the performance function of a single failure mode. Herein, the reliability index computation process of the dominant failure mode is introduced briefly.
The response surface function of each member:
When the stress of the member of the truss is positive, the minus ‘’-” should be used, rather use the plus “+” if the stress is negative.
Perform Taylor expansion:
In the n-dimension standard normal space, the Eq. (11) can be expressed as:
The linear performance function of the next failure member is defined as:
The vector
The equivalent performance function can be denoted as:
where
According to the differential equivalence recursion algorithm introduced above, the performance function and the reliability index of each failure mode can be obtained. Then utilize the PNET to divide all dominant failure modes into several groups in accordance with their coefficients and choose the failure mode with the greatest failure probability to be the representative failure mode to compute the system reliability index of a truss structure. The steps of PNET are as follows:
(1) Calculate the failure probability of each failure mode and put the failure probability in order from the largest to the smallest.
(2) Determine the relative coefficient
(3) Calculate the relative coefficients
(4) Calculate the system failure probability or system reliability probability according to m representative failure modes and their failure probability
Thus, the system reliability probability is expressed as:
and system failure probability can be given as:
Based on these theories about the system reliability introduced above, a system reliability analysis framework that aims to assess the system-level reliability of a truss structure is proposed as shown in Fig. 4. This framework is comprised of three modules: reliability index of a single member, identification of dominant failure modes, and system-level reliability analysis. The first module intends to obtain the reliability index of each member and it overcomes the difficulty of implicit performance function by applying RSM. In addition, the reliability index can be obtained efficiently and accurately through a constrained optimization model and the fmincon function of MATLAB. Identification of dominant failure modes is another significant part of the system reliability analysis. The β-unzipping method and joint simulation of MATLAB and ANSYS are performed efficiently and automatically search for failure members to identify dominant failure modes. At last, perform the computation of the failure probability of each dominant failure mode through the differential equivalence recursion algorithm and compute the reliability index and the failure probability of the system by PNET that considers the correlation of failure modes.
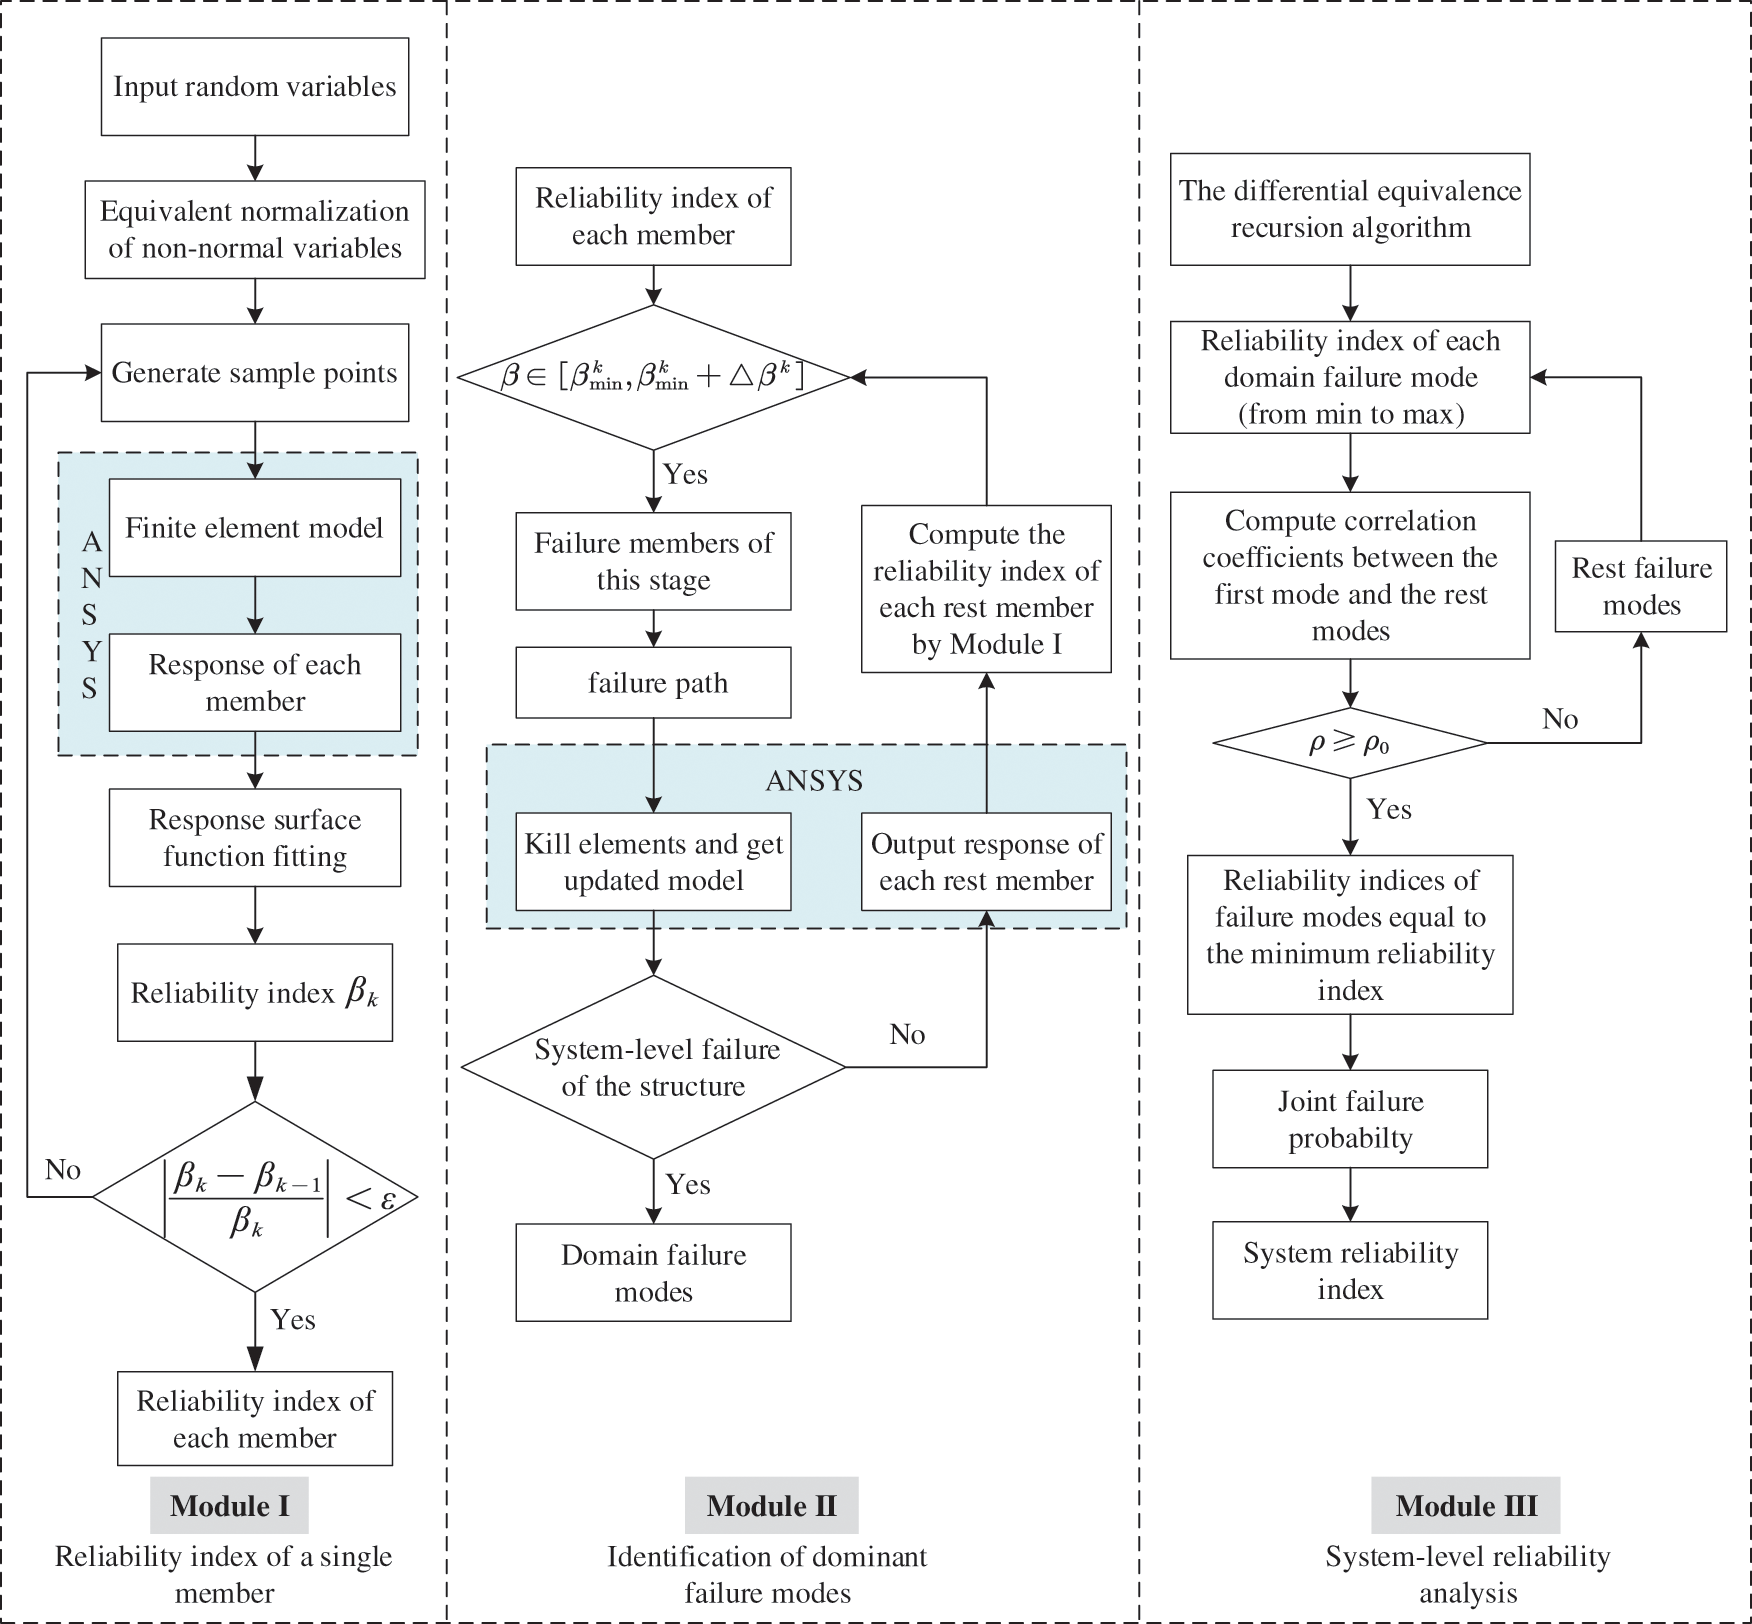
Figure 4: The proposed framework of system reliability analysis
The 2-dimensional truss bridge example is considered in Fig. 5 to investigate the accuracy of the proposed method. This truss bridge consists of 25 members, and the cross-sectional area of each member is listed in Table 1. The concentrated loads P1 and P2 are applied at nodes 9 and 10, respectively. The loads and the yield strength of each member

Figure 5: A truss bridge structure with 25 members


The loads P1 and P2 are considered as the random variables to fit the response surface of each member, and 5 groups of sample points are required to obtain the response surface function of each member. Thus the performance function of each member can be built as
By the proposed framework, forty-one failure modes were identified, and the failure of this truss structure can be considered as a series system of forty-one failure modes which are shown in Fig. 6 simply. The search process is briefly illustrated by the No. 3 member, as shown in Fig. 7. Kim et al. [8] listed 10 failure modes that also are identified by the proposed framework. In addition, the results of the failure mode analysis are listed in Table 3 to verify the accuracy and validity of the proposed framework. Though some failure modes have big errors compared with reference [8], the error of the system reliability index is only 1.42% which proves the proposed method has high accuracy for system reliability analysis of truss structure.

Figure 6: The series system of the failure modes for the 25-bar truss
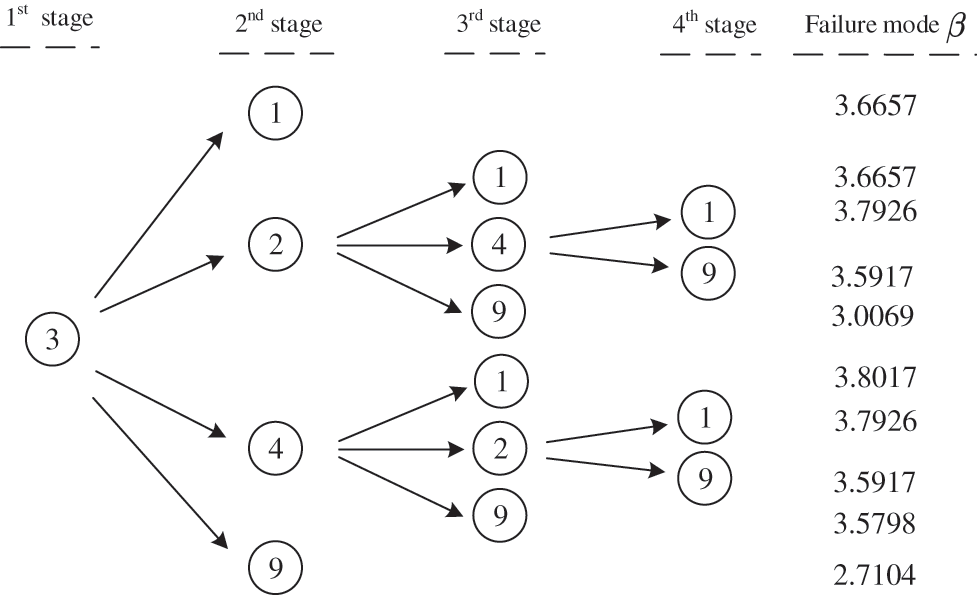
Figure 7: Search process of the failure No. 3 member

A space truss with 25 bars [10,30] is considered to verify the broader applicability of the proposed framework, as shown in Fig. 8. The stress-strain relationship is assumed as ideal elastic-plastic and its elastic modulus is 2.06 × 10¹² Pa. Table 4 lists the section areas of 25 members. The horizontal load F1 and vertical load F2 as well as the yield stress of each member are random variables, and the distribution types and statistical parameters of the random variables are listed in Table 5.
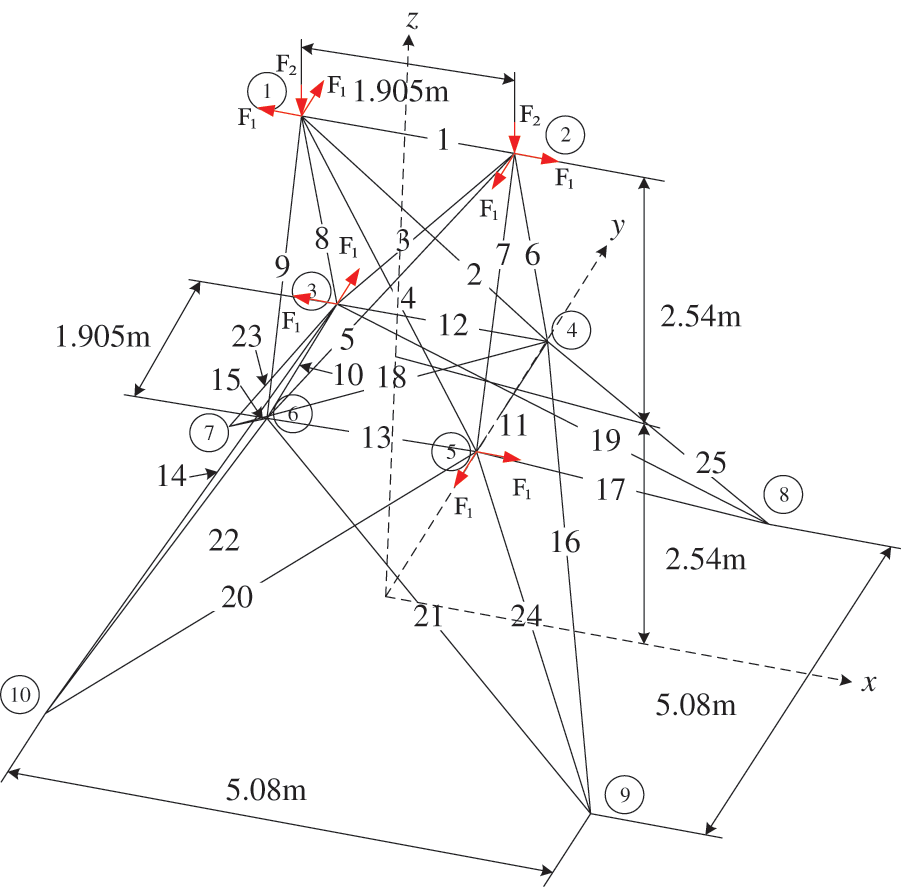
Figure 8: A space truss with 25 members


As described in Section 2, the performance functions of members are constructed by RSM, then through the fmincon function of MATLAB to solve the constrained optimization model for the reliability indices of members. Next, the β-unzipping method is used to identify the dominant failure modes. For this example, due to the elastic-plastic behavior of each member, when a failure member is determined, the corresponding forces also should be applied to its two nodes after deleting the member, and this process will be realized by the proposed framework. Eventually, the identification process ends until finding all failure modes which consist of 3 failure members at most, and 10 dominant failure modes are identified automatically. The same as described in Section 3.1, the failure of the space truss can be illustrated by a series system of dominant failure modes, shown in Fig. 9. Meanwhile, the search process for No. 3 and No. 4 members is shown in Fig. 10.

Figure 9: The series system of the failure modes for the space truss
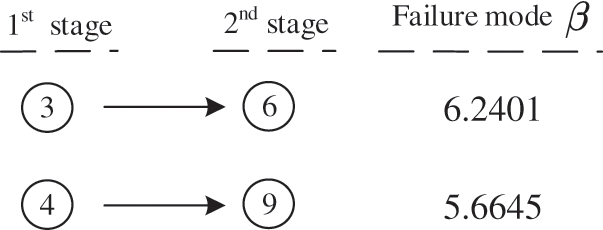
Figure 10: Search process of the failure No. 3 member and no.4 member
The failure probabilities of identified dominant failure modes are calculated by the differential equivalence recursion algorithm, and the system reliability index of the space truss is obtained by PNET. The failure probability of the example is 1.43 × 10⁻⁶ which can be transformed into the reliability index, and after calculating, the system reliability index of this structure in reference [10] is 4.6806. Table 6 lists the reliability indices of the structural system. The relative error of the proposed framework and reference [10] is only 3.48% and these results demonstrate the accuracy of the proposed framework. Besides, through the approach which is included in the framework to update the finite element model, the operation and computation can be more efficient.

A computational framework that can update the finite element model automatically for identifying the dominant failure modes and performing system reliability analysis of the truss structure is proposed in this study. The proposed framework can be divided into three parts: (1) reliability index of a single member, which includes constructing the performance function of each member by RSM to solve the problem that the performance function is implicit and utilizing the fmincon function of MATLAB to solve the constrained optimization model for the reliability index; (2) identification of dominant failure modes, which consists of the β-unzipping method; (3) system-level reliability analysis, which applies the differential equivalence recursion algorithm for considering the correlation of each component to obtain the failure probability of each failure mode, and takes advantage of PNET for computing the system reliability index efficiently and accurately.
The advantages of the proposed framework are drawn as follows: (1) The RSM can get the explicit performance function and make the framework possible to analyze the large and complex truss structures whose performance functions are usually implicit. (2) The failure of members in the finite element model can be updated automatically with the utilization of system function in MATLAB and EKILL command in APDL. This helps improve computing efficiency. (3) The application of the differential equivalence recursion algorithm that considers the correlation of each failure member can obtain the performance function of each failure mode efficiently and accurately. And the PNET considering the correlation of each failure mode gives high accuracy of system reliability analysis.
Eventually, a 25-bar plane truss and a space truss with 25 members are presented to demonstrate the effectiveness of the proposed framework. The relative errors between two numerical examples and corresponding references are 1.42% and 3.48%, respectively, which verify the accuracy in the system reliability analysis of the truss. As a result, these examples indicate that the proposed framework gives high precision and efficiency in the system reliability analysis of truss structures.
Funding Statement: The authors wish to express gratitude for support from the National Key R&D Program of China (Grant Nos. 2021YFB2600605, 2021YFB2600600), and the Overseas Scholar Program in the Hebei Province (C20190514), from the State Key Laboratory of Mechanical Behavior and System Safety of Traffic Engineering Structures Project (ZZ2020-20), from the Youth Foundation of Hebei Science and Technology Research Project (QN2018108).
Conflicts of Interest: The authors declare that they have no conflicts of interest to report regarding the present study.
References
1. Moses, F. (1982). System reliability developments in structural engineering. Structural Safety, 1(1), 3–13. DOI 10.1016/0167-4730(82)90011-X. [Google Scholar] [CrossRef]
2. Feng, Y. (1988). Enumerating significant failure modes of a structural system by using criterion methods. Computers & Structures, 30(5), 1152–1157. DOI 10.1016/0045-7949(88)90158-7. [Google Scholar] [CrossRef]
3. Murotsu, Y., Okada, H., Taguchi, K., Grimmelt, M., Yonezawa, M. (1984). Automatic generation of stochastically dominant failure modes of frame structures. Structural Safety, 2(1), 17–25. DOI 10.1016/0167-4730(84)90004-3. [Google Scholar] [CrossRef]
4. Lee, Y. J., Song, J. (2011). Risk analysis of fatigue-induced sequential failures by branch-and-bound method employing system reliability bounds. Journal of Engineering Mechanics, 137(12), 807–821. DOI 10.1061/(ASCE)EM.1943-7889.0000286. [Google Scholar] [CrossRef]
5. Thoft-Christensen, P. (1990). Consequence modified β-unzipping of plastic structures. Structural Safety, 7(2–4), 191–198. DOI 10.1016/0167-4730(90)90068-Z. [Google Scholar] [CrossRef]
6. Lu, N., Liu, Y., Beer, M. (2018). System reliability evaluation of in-service cable-stayed bridges subjected to cable degradation. Structure and Infrastructure Engineering, 14(11), 1486–1498. DOI 10.1080/15732479.2018.1459743. [Google Scholar] [CrossRef]
7. Shao, S., Murotsu, Y. (1999). Approach to failure mode analysis of large structures. Probabilistic Engineering Mechanics, 14(1–2), 169–177. DOI 10.1016/S0266-8920(98)00028-9. [Google Scholar] [CrossRef]
8. Kim, D. S., Ok, S. Y., Song, J., Koh, H. M. (2013). System reliability analysis using dominant failure modes identified by selective searching technique. Reliability Engineering & System Safety, 119, 316–331. DOI 10.1016/j.ress.2013.02.007. [Google Scholar] [CrossRef]
9. Coccon, M. N., Song, J., Ok, S. Y., Galvanetto, U. (2016). A new approach to system reliability analysis of offshore structures using dominant failure modes identified by selective searching technique. KSCE Journal of Civil Engineering, 21(6), 2360–2372. DOI 10.1007/s12205-016-1192-z. [Google Scholar] [CrossRef]
10. Jiang, Y., Zhao, L., Beer, M., Wang, L., Zhang, J. (2020). Dominant failure mode analysis using representative samples obtained by multiple response surfaces method. Probabilistic Engineering Mechanics, 59, 103005. DOI 10.1016/j.probengmech.2019.103005. [Google Scholar] [CrossRef]
11. Cornell, C. A. (1967). Bounds on the reliability of structural systems. Journal of the Structural Division, 93(1), 171–200. DOI 10.1061/JSDEAG.0001577. [Google Scholar] [CrossRef]
12. Ditlevsen, O. (1979). Narrow reliability bounds for structural systems. Journal of Structural Mechanics, 7(4), 453–472. DOI 10.1080/03601217908905329. [Google Scholar] [CrossRef]
13. Ma, H. F., Ang, H. S. (1981). Reliability analysis of redundant ductile structural systems. Urbana-Champaign: University of Illinois. [Google Scholar]
14. Huang, S., Wang, L. (2018). Improvement of the method of representative failure pattern recognition in PNET method. Journal of Hefei University of Technology, 41(9), 1231–1237 (in Chinese). [Google Scholar]
15. Kang, J., Sun, L., Sun, H., Wu, C. (2017). Risk assessment of floating offshore wind turbine based on correlation-FMEA. Ocean Engineering, 129, 382–388. DOI 10.1016/j.oceaneng.2016.11.048. [Google Scholar] [CrossRef]
16. Bucher, C. G. (1988). Adaptive sampling-An iterative fast monte carlo procedure. Structural Safety, 5(2), 119–126. DOI 10.1016/0167-4730(88)90020-3. [Google Scholar] [CrossRef]
17. Naess, A., Leira, B. J., Batsevych, O. (2009). System reliability analysis by enhanced monte carlo simulation. Structural Safety, 31(5), 349–355. DOI 10.1016/j.strusafe.2009.02.004. [Google Scholar] [CrossRef]
18. Bucher, C. G., Bourgund, U. (1990). A fast and efficient response surface approach for structural reliability problems. Structural Safety, 7(1), 57–66. DOI 10.1016/0167-4730(90)90012-E. [Google Scholar] [CrossRef]
19. Goswami, S., Ghosh, S., Chakraborty, S. (2016). Reliability analysis of structures by iterative improved response surface method. Structural Safety, 60, 56–66. DOI 10.1016/j.strusafe.2016.02.002. [Google Scholar] [CrossRef]
20. Sun, Z., Wang, J., Li, R., Tong, C. (2017). LIF: A new kriging based learning function and its application to structural reliability analysis. Reliability Engineering & System Safety, 157, 152–165. DOI 10.1016/j.ress.2016.09.003. [Google Scholar] [CrossRef]
21. Zhang, X., Wang, L., Sørensen, J. D. (2019). REIF: A novel active-learning function towards adaptive kriging surrogate models for structural reliability analysis. Reliability Engineering & System Safety, 185(5), 440–454. DOI 10.1016/j.ress.2019.01.014. [Google Scholar] [CrossRef]
22. Chai, W., Leira, B. J. (2018). Environmental contours based on inverse SORM. Marine Structures, 60, 34–51. DOI 10.1016/j.marstruc.2018.03.007. [Google Scholar] [CrossRef]
23. Fan, J., Li, S., Chen, X. (2012). Optimal searching algorithm for non-probabilistic reliability. Chinese Journal of Computational Mechanics, 29(6), 831–834. [Google Scholar]
24. Bian, X., Chen, X., Yang, H., You, C. (2019). Improved nonprobabilistic global optimal solution method and Its application in bridge reliability assessment. Advances in Civil Engineering, 2019, 8290317. DOI 10.1155/2019/8290317. [Google Scholar] [CrossRef]
25. Gui, J., Kang, H. (2004). Response surface method for structural reliability analysis and its realization in matlab. Chinese Journal of Computational Mechanics, 2004(6), 683–687. [Google Scholar]
26. Li, Y. (2021). Structural topology optimization design platform based on ANSYS and MATLAB data interface. Electronic Design Engineering, 29(3), 36–41+46 (in Chinese). [Google Scholar]
27. Qiu, S., Zhou, J. (2018). Collaborative optimization design and application based on MATLAB and ANSYS. Journal of Machine Design, 35(9), 68–72 (in Chinese). [Google Scholar]
28. Chen, X., Dong, C., Yan, Y. (2011). Analytical format of differential equivalent recursive algorithm. Chinese Journal of Computational Mechanics, 28(5), 688–692+710. [Google Scholar]
29. Zhang, X., Kang, H., Wang, F. (2004). Improved differential equivalent recursive algorithm. China Civil Engineering Journal, 37(1), 8. [Google Scholar]
30. Dong, C. (2001). System reliability theories and their applications to modern structures. Beijing: Science Press (in Chinese). [Google Scholar]
Appendix A. General description for the joint simulation of MATLAB and APDL
The joint simulation of MATLAB and APDL is extremely important in the proposed framework that involves updating the finite element model automatically. Herein, the system function in MATLAB and EKILL command in APDL which are the key to achieving this automation process are introduced briefly.
A snippet of code, shown below, is provided to use the system function in MATLAB for reference.
system (‘SET KMP_STACKSIZE = 2048k & “D:\ANSYS Inc\v192\ansys\bin\winx64\ANSYS192.exe”-b-ane3fl-i “C:\Users\Desktop\file.txt”-o “C:\Users\Desktop\file.out"’).
In the command above, “D:\ANSYS Inc\v192\ansys\bin\winx64\ANSYS192.exe” represents the installation path of ANSYS software, “b” indicates specifying to run ANSYS in batch mode, “I” is specifying the input file (APDL command flow file) and “o” specifies the output file.
Meanwhile, another important command EKILL in APDL can be written as:
*do,i1,1,len_node(1) $ time,i1 $ nlgeom,on $ nropt,full $ ekill,kill_node(i1, 1)
estif,0 $ esel,s,live $ eplot $ *enddo
which is realized by a loop structure to remove all failure members. In this command, “len_node(1)” defined by yourself represents the number of failure members, and “kill_node(i1, 1)” which also can be defined by yourself represents the member to be killed. Similarly, the forces calculated by MATLAB are applied to the corresponding nodes of failure members also through a loop structure in APDL.
Cite This Article
 Copyright © 2023 The Author(s). Published by Tech Science Press.
This work is licensed under a Creative Commons Attribution 4.0 International License , which permits unrestricted use, distribution, and reproduction in any medium, provided the original work is properly cited.


 Submit a Paper
 Propose a Special lssue
 View Full Text
 Download PDF
 Downloads
 Citation Tools