 Open Access
ARTICLE
Thermal Analysis of Turbine Blades with Thermal Barrier Coatings Using Virtual Wall Thickness Method
1 Joint Research Center for Extreme Environment and Protection Technology, School of Aerospace Engineering, Xi’an Jiaotong University, Xi’an, 710049, China
2 AEEC Sichuan Gas Turbine Establishment, Chengdu, 610500, China
* Corresponding Authors: Xiaochao Jin. Email: ; Xueling Fan. Email:
Computer Modeling in Engineering & Sciences 2023, 134(2), 1219-1236. https://doi.org/10.32604/cmes.2022.022221
Received 28 February 2022; Accepted 20 April 2022; Issue published 31 August 2022
Abstract
A virtual wall thickness method is developed to simulate the temperature field of turbine blades with thermal barrier coatings (TBCs), to simplify the modeling process and improve the calculation efficiency. The results show that the virtual wall thickness method can improve the mesh quality by 20%, reduce the number of meshes by 76.7% and save the calculation time by 35.5%, compared with the traditional real wall thickness method. The average calculation error of the two methods is between 0.21% and 0.93%. Furthermore, the temperature at the blade leading edge is the highest and the average temperature of the blade pressure surface is higher than that of the suction surface under a certain service condition. The blade surface temperature presents a high temperature at both ends and a low temperature in the middle height when the temperature of incoming gas is uniform and constant. The thermal insulation effect of TBCs is the worst near the air film hole, and the best at the blade leading edge. According to the calculated temperature field of the substrate-coating system, the highest thermal insulation temperature of the TC layer is 172.01 K, and the thermal insulation proportions of TC, TGO and BC are 93.55%, 1.54% and 4.91%, respectively.Keywords
The gas temperature before it reaches the turbine is an important symbol of aero-engine generations. At present, the turbine inlet temperature of the advanced fighter jet engine has exceeded 2000 K, far exceeding the limit temperature that the substrate can withstand. A variety of technologies are used to increase the service temperature, such as single crystal substrates, film cooling technology and thermal barrier coatings (TBCs). TBCs can increase the service temperature of turbine blades by increasing the thermal resistance of the substrate surface and reducing the heat flux, providing high-temperature protection and oxidation protection for the blade [1–5]. A typical TBCs is composed of a load carrying substrate (SUB), a ceramic top-coat (TC), a metallic bond-coat (BC), and the thermally grown oxide (TGO) that forms between TC and BC.
However, many operating practices and analyses have shown that the failures of hot end parts such as turbine blades are related to uneven temperature fields and local high thermal stress during service [6–10]. Therefore, the temperature distributions of turbine blades and TBCs are the most important factors in determining blade life parameters and play a significant in optimizing the design of turbine blades. In recent years, more and more studies have been conducted on the temperature field of coated turbine blades based on the finite element method (FEM). Moreover, the calculation method of conjugate heat transfer (CHT) was used to calculate the temperature field of the blades, which combines the heat transfer of internal cooling gas, external gas and metal [11–18]. Reyhani et al. [19] simulated the working process of turbine blades via CHT method, and analyzed the effects of TBCs thickness, number of cooling pores and other loads on the blade temperature field. The thermal insulation efficiency of TBCs for turbine blades was analyzed [20,21], and the results showed that TBCs improved the adiabatic cooling efficiency of blades by about 10% and reduced the heat transfer coefficient by 35%. Furthermore, the air film cooling efficiency at the leading edge of blade with TBCs was investigated through experimental research [22]. The results proved that TBCs could reduce the substrate temperature, but the temperature of the TBCs surface will be higher than that of the blade without TBCs. It is well known that when the blade with a complex structure is modeled, the thickness of the coating is much smaller than the size of the substrate, which greatly increases the difficulty of coating modeling, especially for cross-scale coating layers such as TGO. Although the cross-scale model of coating has been analyzed in previous articles to explore the damage mechanism of coating [23–25], the simplified models have been adopted in most studies. The real blade structure is complex, and the cross-scale meshes are difficult to generate. Li et al. [26] used the mesh offset technique provided by ABAQUS to generate solid mesh layers by offsetting a mesh surface along its normal direction, so as to realize the establishment of the mesh model of TC, BC and TGO. However, these methods have strict requirements on the mesh and blade structure. For blades with complex structures, these methods are extremely time-consuming and prone to errors.
ANSYS provides the virtual wall thickness method to set the surface thermal resistance instead of the real wall thickness [27], and this method is used for the first time to calculate the temperature field of coated turbine blade in this work. There is no need to establish the geometric structure and mesh model of the TBCs in the calculation, and the thermal insulation effect of TBCs is simulated by adding surface thermal resistance to the surface of the substrate. This method simplifies the blade modeling process and mesh complexity, especially for cross-scale thin-walled structures. It can save modeling time and cost, has no requirements on mesh type and substrate curvature, and is highly adaptable.
In this study, the virtual wall thickness method was developed to simulate the temperature field of turbine blades with TBCs. Firstly, the accuracy of virtual wall thickness method was verified by experimental data. Secondly, the finite element analysis of the turbine blade was carried out via the virtual and real wall thickness methods, respectively, so as to verify the advantages of virtual wall thickness method. Thirdly, the temperature field of the turbine blade with coating was analyzed using virtual wall thickness method.
2 Virtual Wall Thickness Method
Models of fluid and solid domain are shown in Fig. 1a. The multilayer structure in the solid domain, such as TBCs and substrate, can be divided into solid domain 1 and solid domain 2. The interface of each region is set as a coupling surface for the transfer of physical quantities. In the calculation process, boundary conditions and material parameters are set. However, when a layer of solid domain is too thin to be modeled and meshed, the virtual wall thickness method can be employed, as shown in Fig. 1b. When the solid domain 1 has uniform material, uniform thickness and isotropy, its internal temperature gradient can be assumed to be linearly distributed. Solid domain 1 is assumed to be the thermal resistance term brought into the heat conduction equation. By setting the wall thickness and material parameters of the solid domain 1, the temperature field of the upper and lower surfaces of solid domain 1 can be obtained without affecting the temperature field calculation of the fluid domain and solid domain 2.
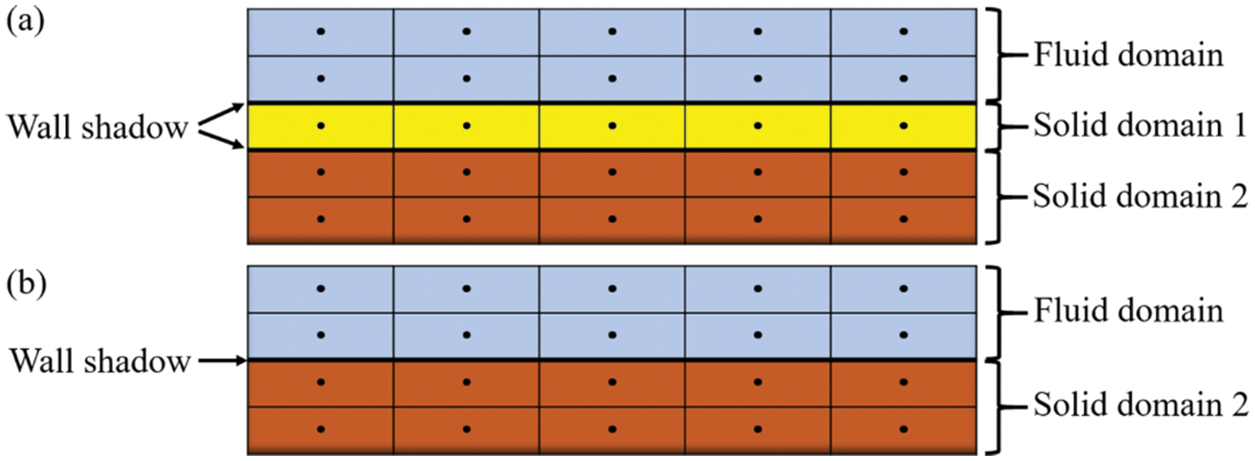
Figure 1: Schematic diagram of the simplified model. (a) With solid domain 1, (b) Without solid domain 1
ANSYS provides two methods for setting the virtual wall thickness: setting the wall thickness and enabling the shell conduction model. Setting the wall thickness method requires providing the thin wall thickness and material thermal conductivity for the external coupling surface. At this time, the method will solve the one-dimensional steady-state thermal conductivity differential equation with constant physical properties and no internal heat source, as shown in Eq. (1):
The wall thermal resistance
For extremely thin walls such as TBCs, the heat flow in the horizontal direction is much smaller than the heat flow in the normal direction, so setting the virtual wall thickness can meet the requirements.
3 Validation of Virtual Wall Thickness Method
The geometry of the standard specimen is shown in Fig. 2. In order to avoid the stress concentration on the edge tip of the specimen, a rounded corner with a radius of 1.5 mm is set. The thickness of TC and BC layers is 0.3 and 0.15 mm, respectively. They are uniformly coated on the substrate with a diameter of 28.5 mm. The mesh model with TC layer is shown in Fig. 3a. The mesh without TC layer is shown in Fig. 3b, in which the TC layer is set as a virtual layer. Because of the simple model structure and heat transfer process, the tetrahedral mesh can meet the calculation requirements.

Figure 2: Geometry of the standard specimen of TBCs

Figure 3: Mesh model of the standard specimen. (a) With TC layer, (b) Without TC layer
3.2 Materials and Boundary Conditions
Traeger et al. [28] conducted a thermal shock experiment on the standard specimen of TBCs. During the experiment, a thermocouple was used to collect the temperature data on the TC surface and inside the substrate, aiming to calculate the temperature of the TC-BC interface. The temperature data are given in Fig. 4.
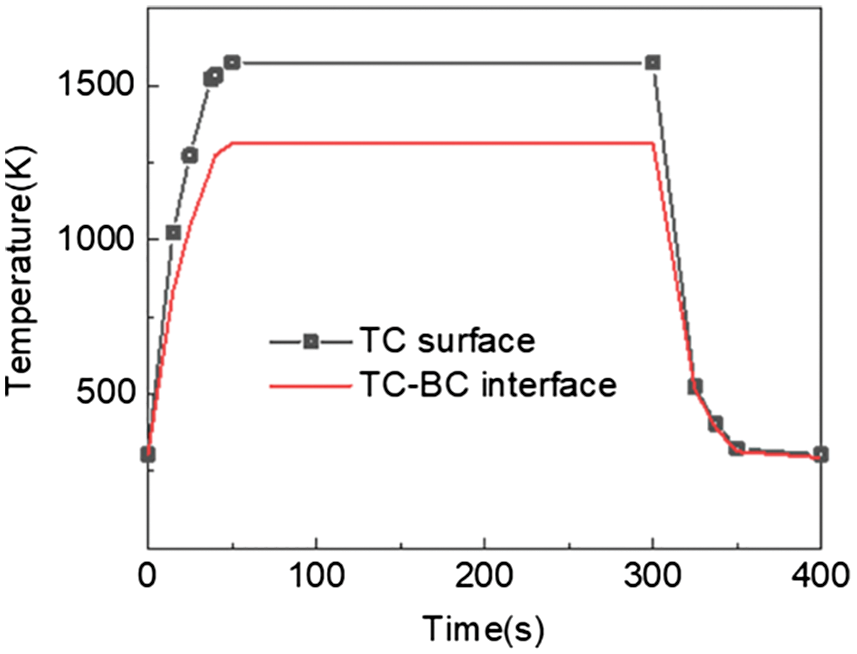
Figure 4: Temperature curves of TC surface and TC-BC interface [28]
Eleven characteristic points were selected from the measured data to describe the experimental temperature history of the TC surface, as illustrated in Fig. 4 and Table 1. Assuming that the temperature varies linearly between points, the temperature piecewise function is compiled into a subroutine as the boundary condition of the finite element analysis. The temperature boundary is imposed on the upper surface of the TC layer in the real wall thickness method and on the virtual surface of TC layer in the virtual wall thickness method. The cold source is set on the lower surface of substrate, and a convective heat transfer boundary is imposed on it. The convective temperature is 300 K, and the convective heat transfer coefficient can be calculated as 1500 W/(m2·K), using the differential heat conduction equation in Eq. (3):
where q is the heat flux,


3.3 Results of Temperature Field
The transient calculation is carried out to simulate the temperature fields. The time step is set to 1 s, and each step is iterated 100 times to calculate the temperature field change of the standard specimen from 0 s to 400 s. Six moments are selected to compare the temperature field calculated using the real and virtual wall thickness method. The temperature fields of the two methods are almost the same, as shown in Fig. 5. The real wall thickness method can display the temperature field inside the TC layer, while the virtual wall thickness method cannot because the TC layer entity is not established.
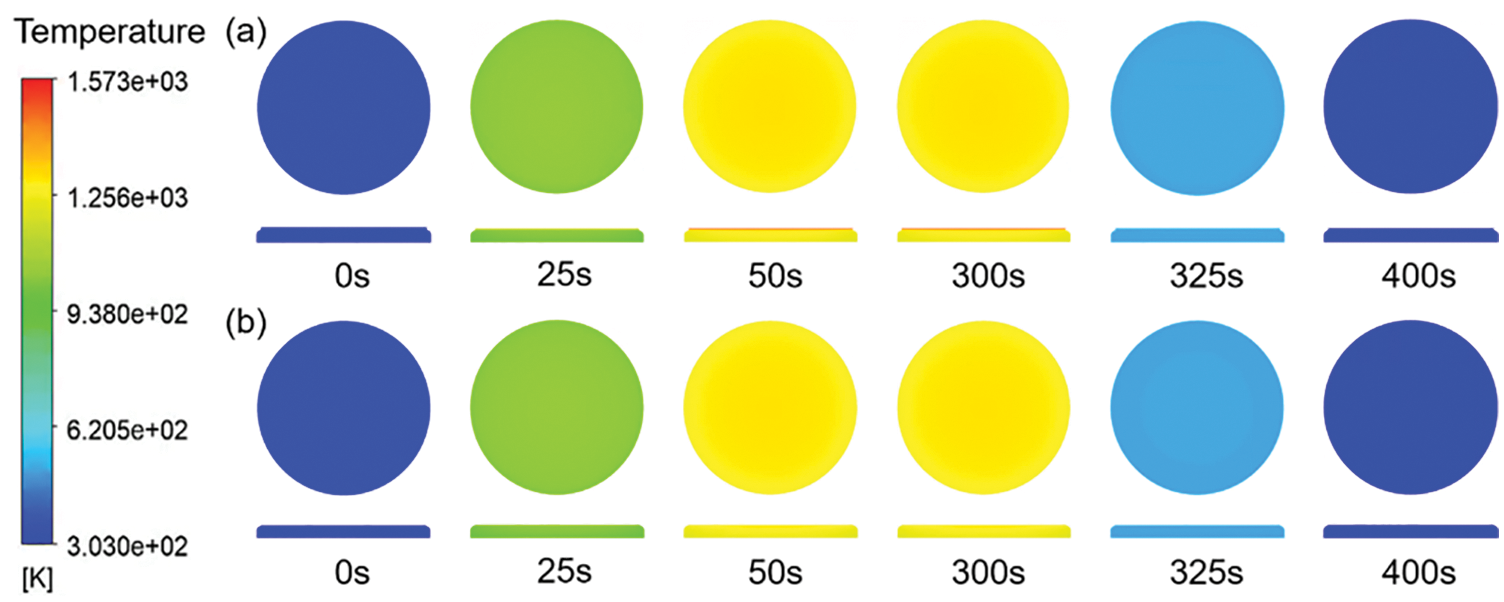
Figure 5: The temperature field of the TC-BC interface and the specimen’s longitudinal section. (a) Real wall thickness method, (b) Virtual wall thickness method
Figs. 6a and 6b respectively show the temperature values of each layer at different times by the real and virtual wall thickness method. The temperature trends and values of the two methods are very similar. The experimental data are compared with the TC-BC interface temperature calculated by the two methods, as shown in Fig. 7. The maximum error of the three sets of temperature data is less than 0.2%, which further verifies the accuracy and feasibility of the virtual thickness method.
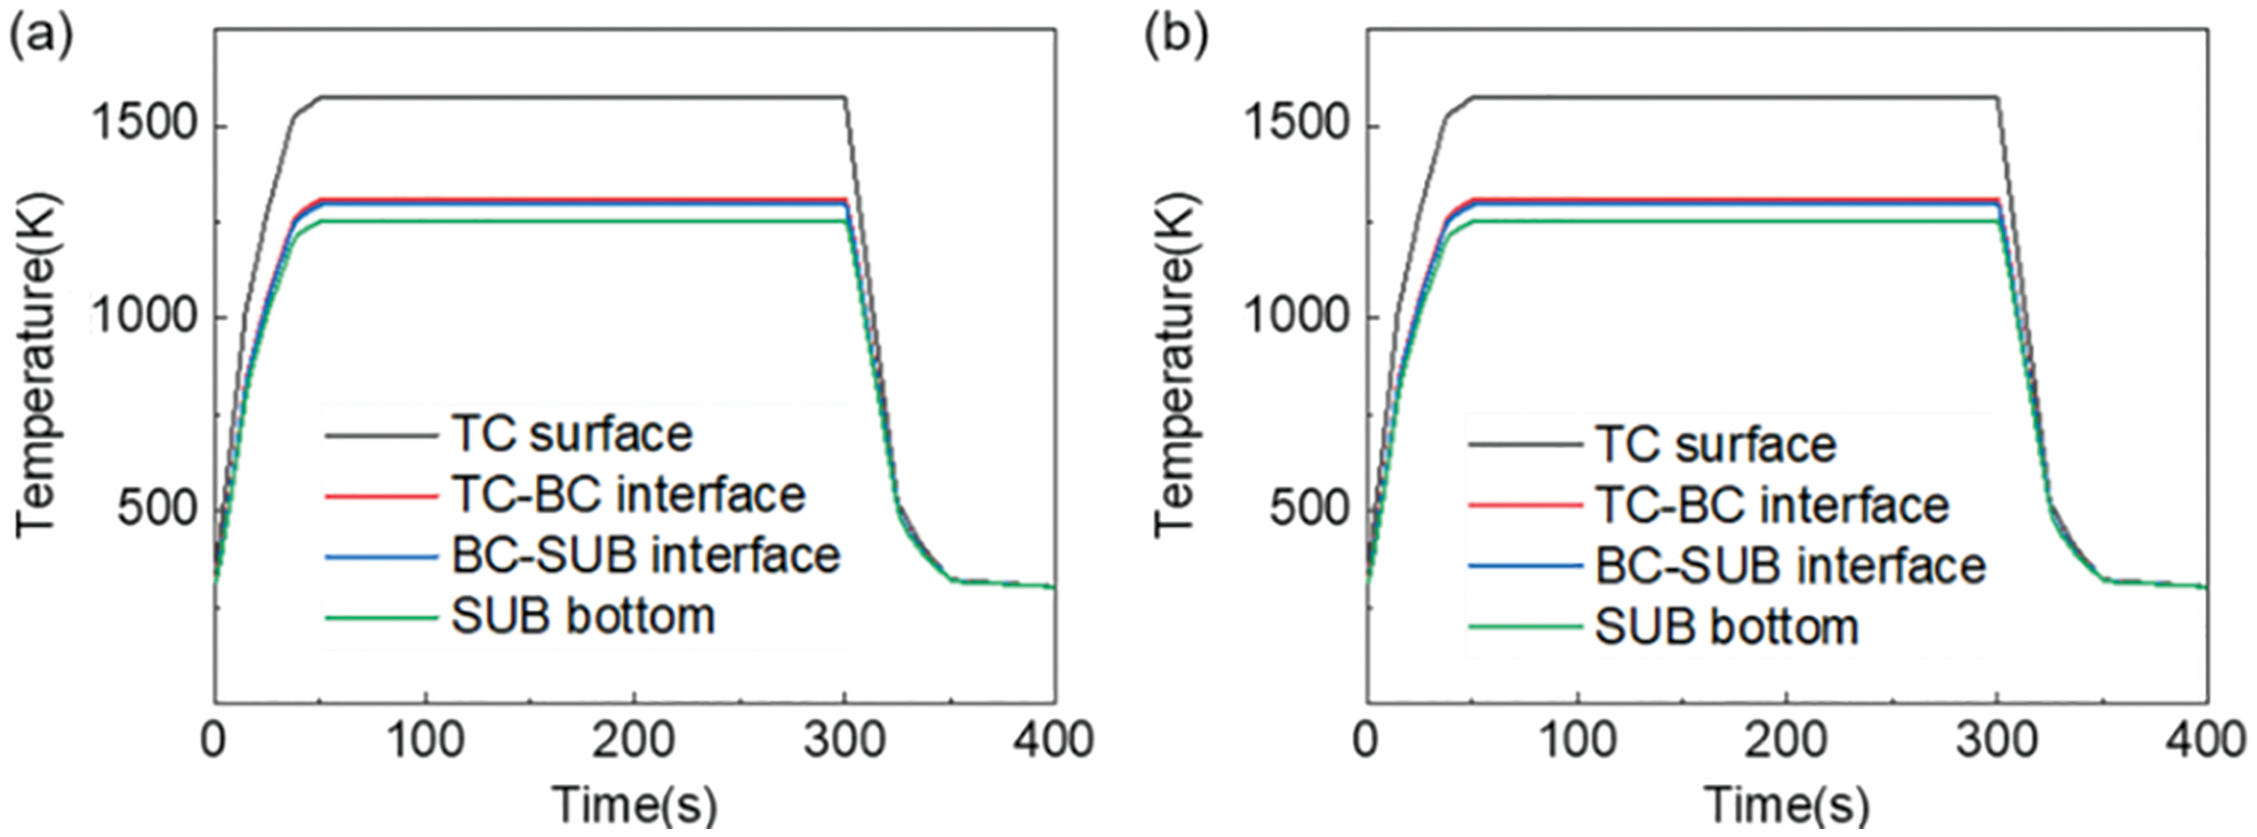
Figure 6: The calculated temperature field of each layer of the standard specimen. (a) Real wall thickness method, (b) Virtual wall thickness method
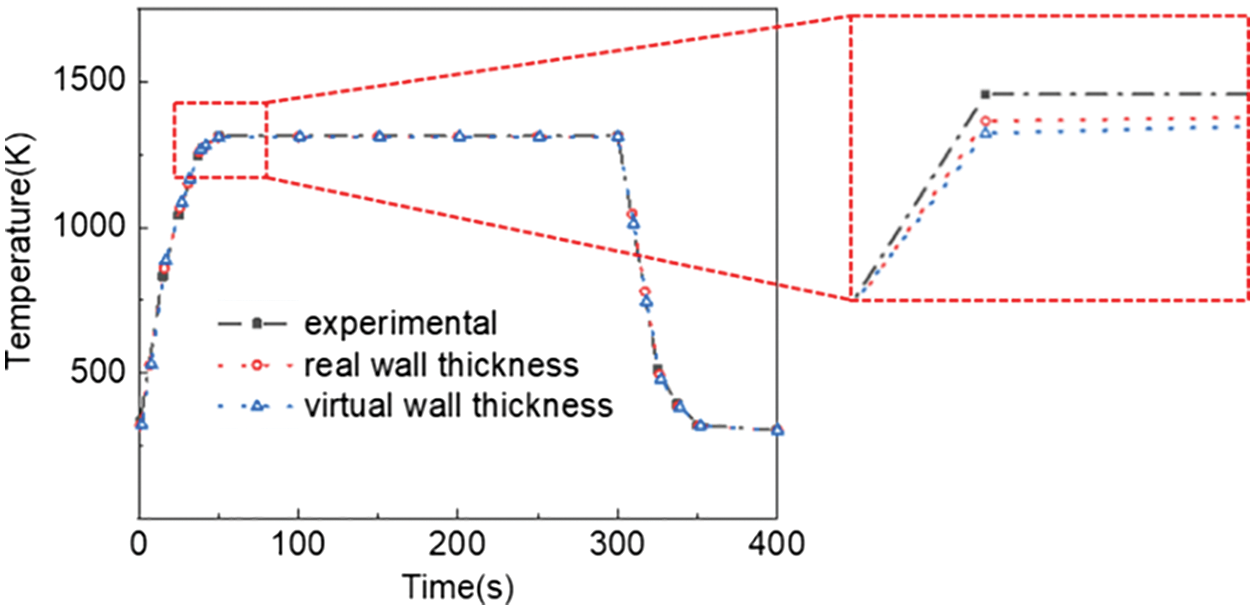
Figure 7: The comparison of TC-BC interface temperature between gas shock experiment, real wall thickness method and virtual wall thickness method
4 Thermal Analysis of Simplified Coated Blade
The virtual wall thickness method is employed to analyze the temperature field of blade with a simplified coating in this section. The blade model in Fig. 8a refers to the first-stage guide vane of the aero-engine, which is used to establish a single-cycle geometry. In order to improve the cooling efficiency of the blade, cooling structures are set on the surface and interior of the blade. There are 423 air film holes on the substrate, which are divided into 16 columns and arranged in a staggered manner. Five rows of spoiler ribs on the inner wall of the blade and three rows of spoiler columns on the trailing edge are established to strengthen convective cooling and improve blade strength. Furthermore, a split slit is formed at the trailing edge. The geometry includes the fluid domain and the solid domain. The single-period fluid domain model is established along the fluid flow direction, as shown in Fig. 8b. In order to compare the difference between the real and virtual wall thickness method, the coating is simplified into one layer and calculated by two methods, as shown in Figs. 8c and 8d.
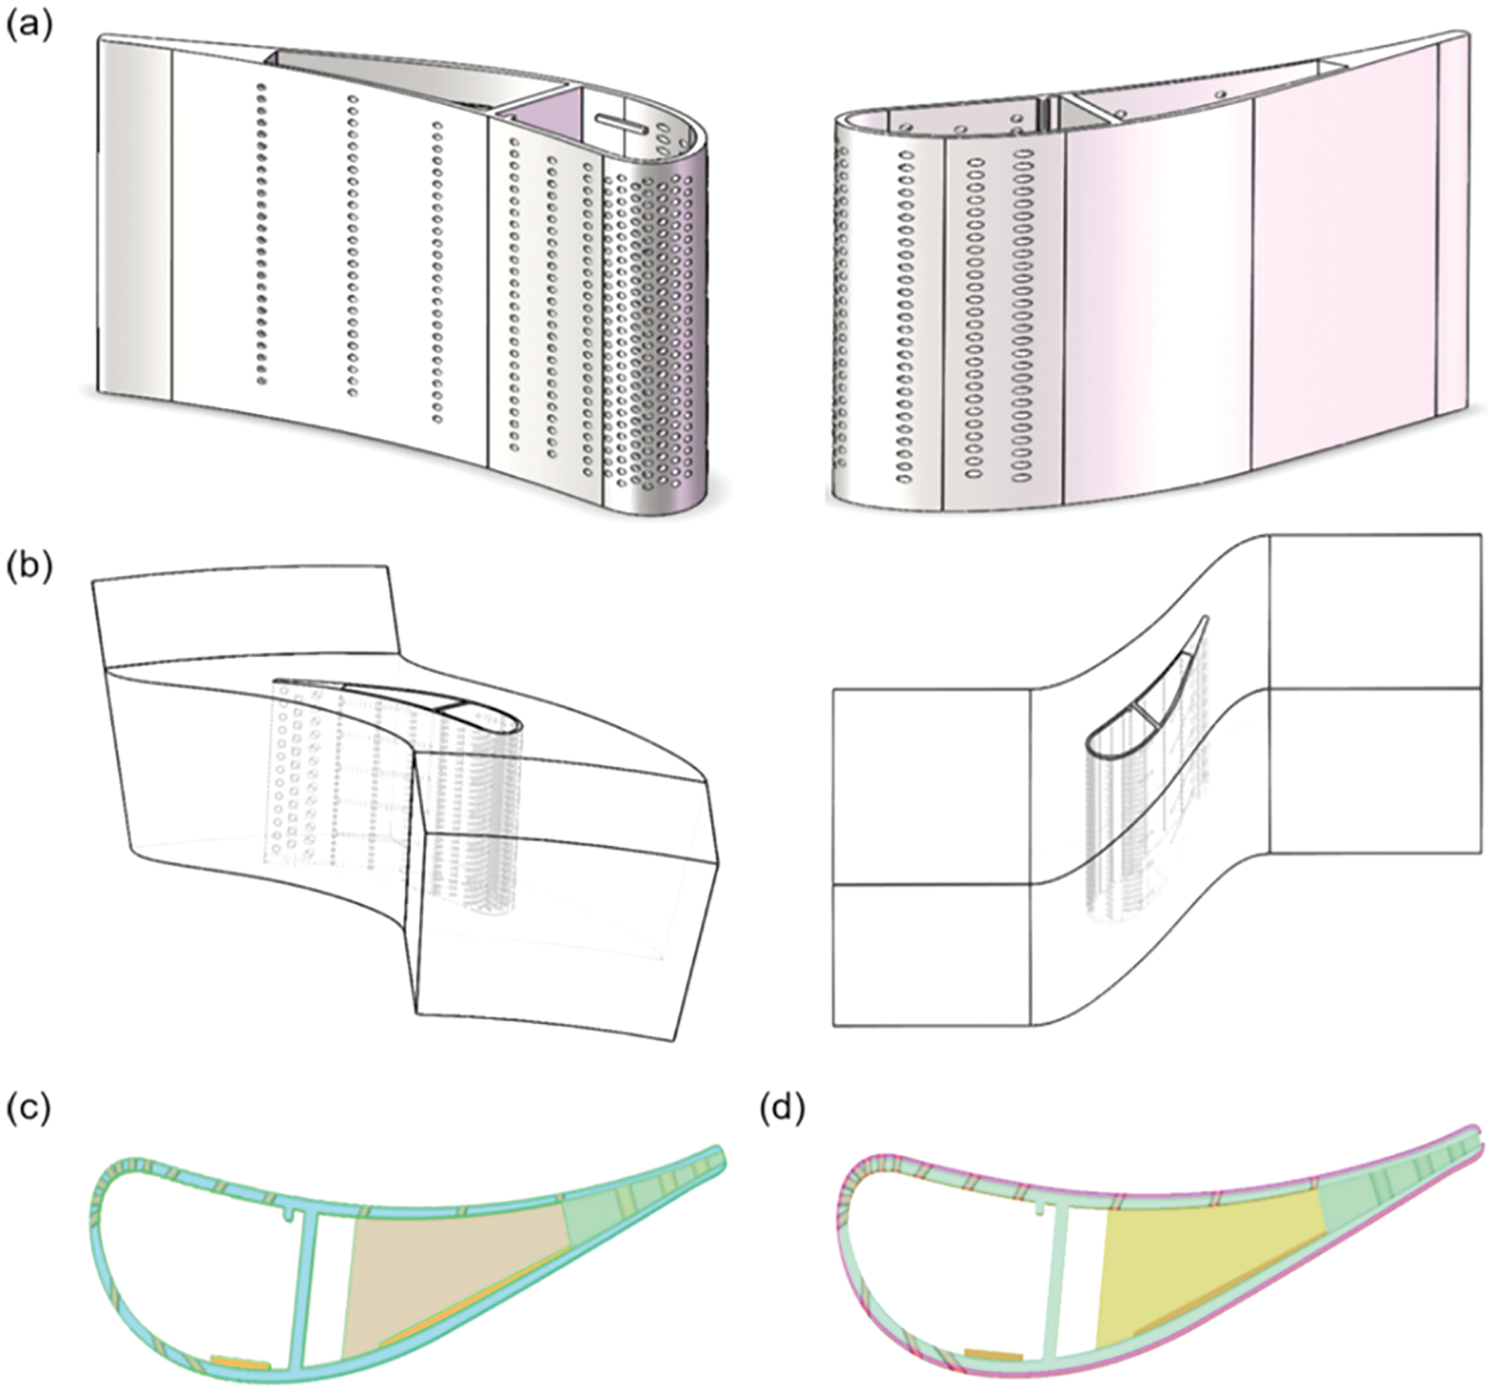
Figure 8: The finite element model. (a) Turbine blade, (b) Fluid domain, (c) Blade model with substrate only, (d) Blade model with substrate and coating
The mesh model is established based on the geometry, as shown in Fig. 9. The meshes near the blade boundary layer are refined to ensure that the Y+ of the surface is able to meet the requirements of turbulence model. The structure of cooling cavity is complex, so it is necessary to refine the mesh of the ribs and air film holes. The periodic meshes are generated on periodic boundary surfaces to ensure that the nodes on boundaries correspond to each other. Tables 3 and 4 record the mesh size and quality of each region in the two models, respectively. Table 3 shows that the virtual wall thickness method can improve the mesh quality by 20% with the same average element mesh size. Table 4 shows that the virtual wall thickness method can reduce the number of meshes by 76.7% under the same mesh quality. It can be seen that the virtual wall thickness method can significantly reduce the number of meshes, improve the mesh quality, and save modeling time. This advantage is more evident for thin-walled structures such as TBCs, because meshes in thin-walled areas tend to increase the aspect ratio and the number of surrounding meshes, reducing the overall mesh quality.

Figure 9: The finite element model of turbine blade


4.2 Boundary Conditions and Calculation Method
The substrate and coating are considered to be isotropic materials. The density, specific heat and thermal conductivity of the simplified coating are taken as the weighted average of each layer. Without considering thermal radiation, the inlet and outlet boundary conditions parameters are listed in Table 5. The surfaces of the blade and the air film holes are set as the no-slip coupling boundary, and the hub and the casing surface are set as the convective heat transfer boundary. The convective heat transfer coefficient and free flow temperature of the upper and lower end faces of the flow field channel are set to 1500 W/(m2·K) and 800 K, respectively, which are obtained from experimental measurements. The two sides of the flow field are set as the rotation period boundary.

The flow field and temperature field of the turbine blade are calculated and analyzed using the fully implicit discretization of the equations and the coupled solver of ANSYS Fluent commercial fluid dynamics software. The shear stress transport (SST) model is selected as the turbulence model. According to the actual operating conditions of the turbine and the results of Menter [30] and Ho et al. [31], the SST model has a better performance compared to SA, RNG, k-ε turbulence models. The calculation method adopts the couple algorithm, and the research state is steady state. When the residuals of each item are lower than 10−4 and the temperature of the monitoring point no longer changes, the calculation is considered to be converged [32]. Under the same computing power, the real wall thickness method takes 307 min to complete the calculation, while the virtual wall thickness method takes 198 min, saving 35.5% of the calculation time.
4.3 Validation of Virtual Wall Thickness Method Using Blade Model
In order to describe the temperature field conveniently on the blade surface, profile lines at 25%, 50% and 75% blade heights are illustrated in Fig. 10. Fig. 11a shows the temperature field of the two methods on the section with 50% blade height. It can be clearly found that there is a large temperature gradient caused by film cooling between the turbine blade and the incoming gas and a low-temperature line caused by tail splitting slit behind the trailing edge of the blade. By comparing the two temperature fields, it can be seen that setting the virtual wall thickness will not affect the temperature distribution of the fluid. Figs. 11b and 11c show the temperature field of the coating surface and the substrate surface obtained by the two methods, respectively. The highest temperature occurs at the leading edge, and the temperature in the suction surface (SS) and pressure surface (PS) are relatively low due to the effect of air film cooling and internal cooling. The overall temperature fields are similar, indicating that the virtual wall thickness method has certain feasibility.
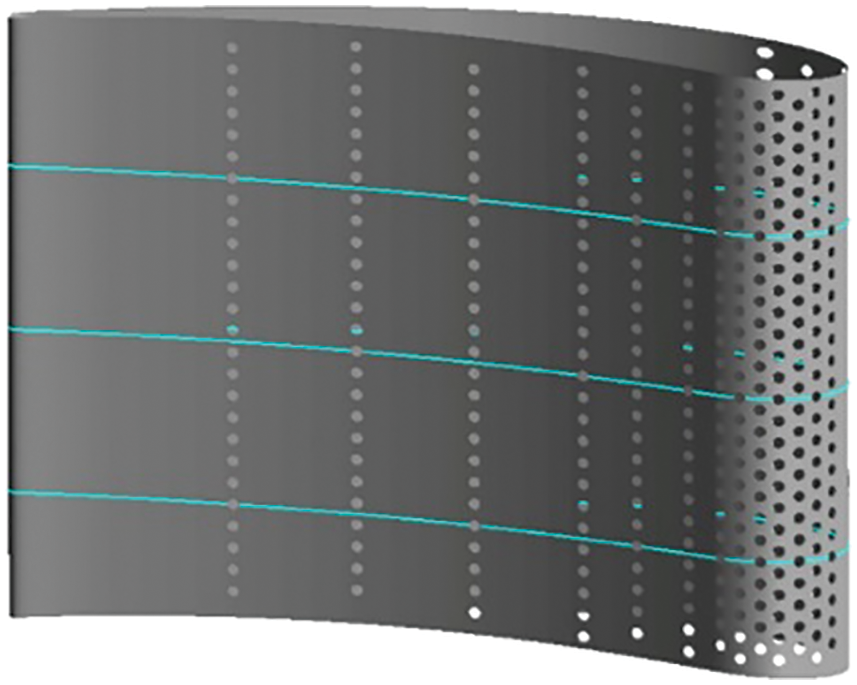
Figure 10: The profile lines at 25%, 50% and 75% blade heights
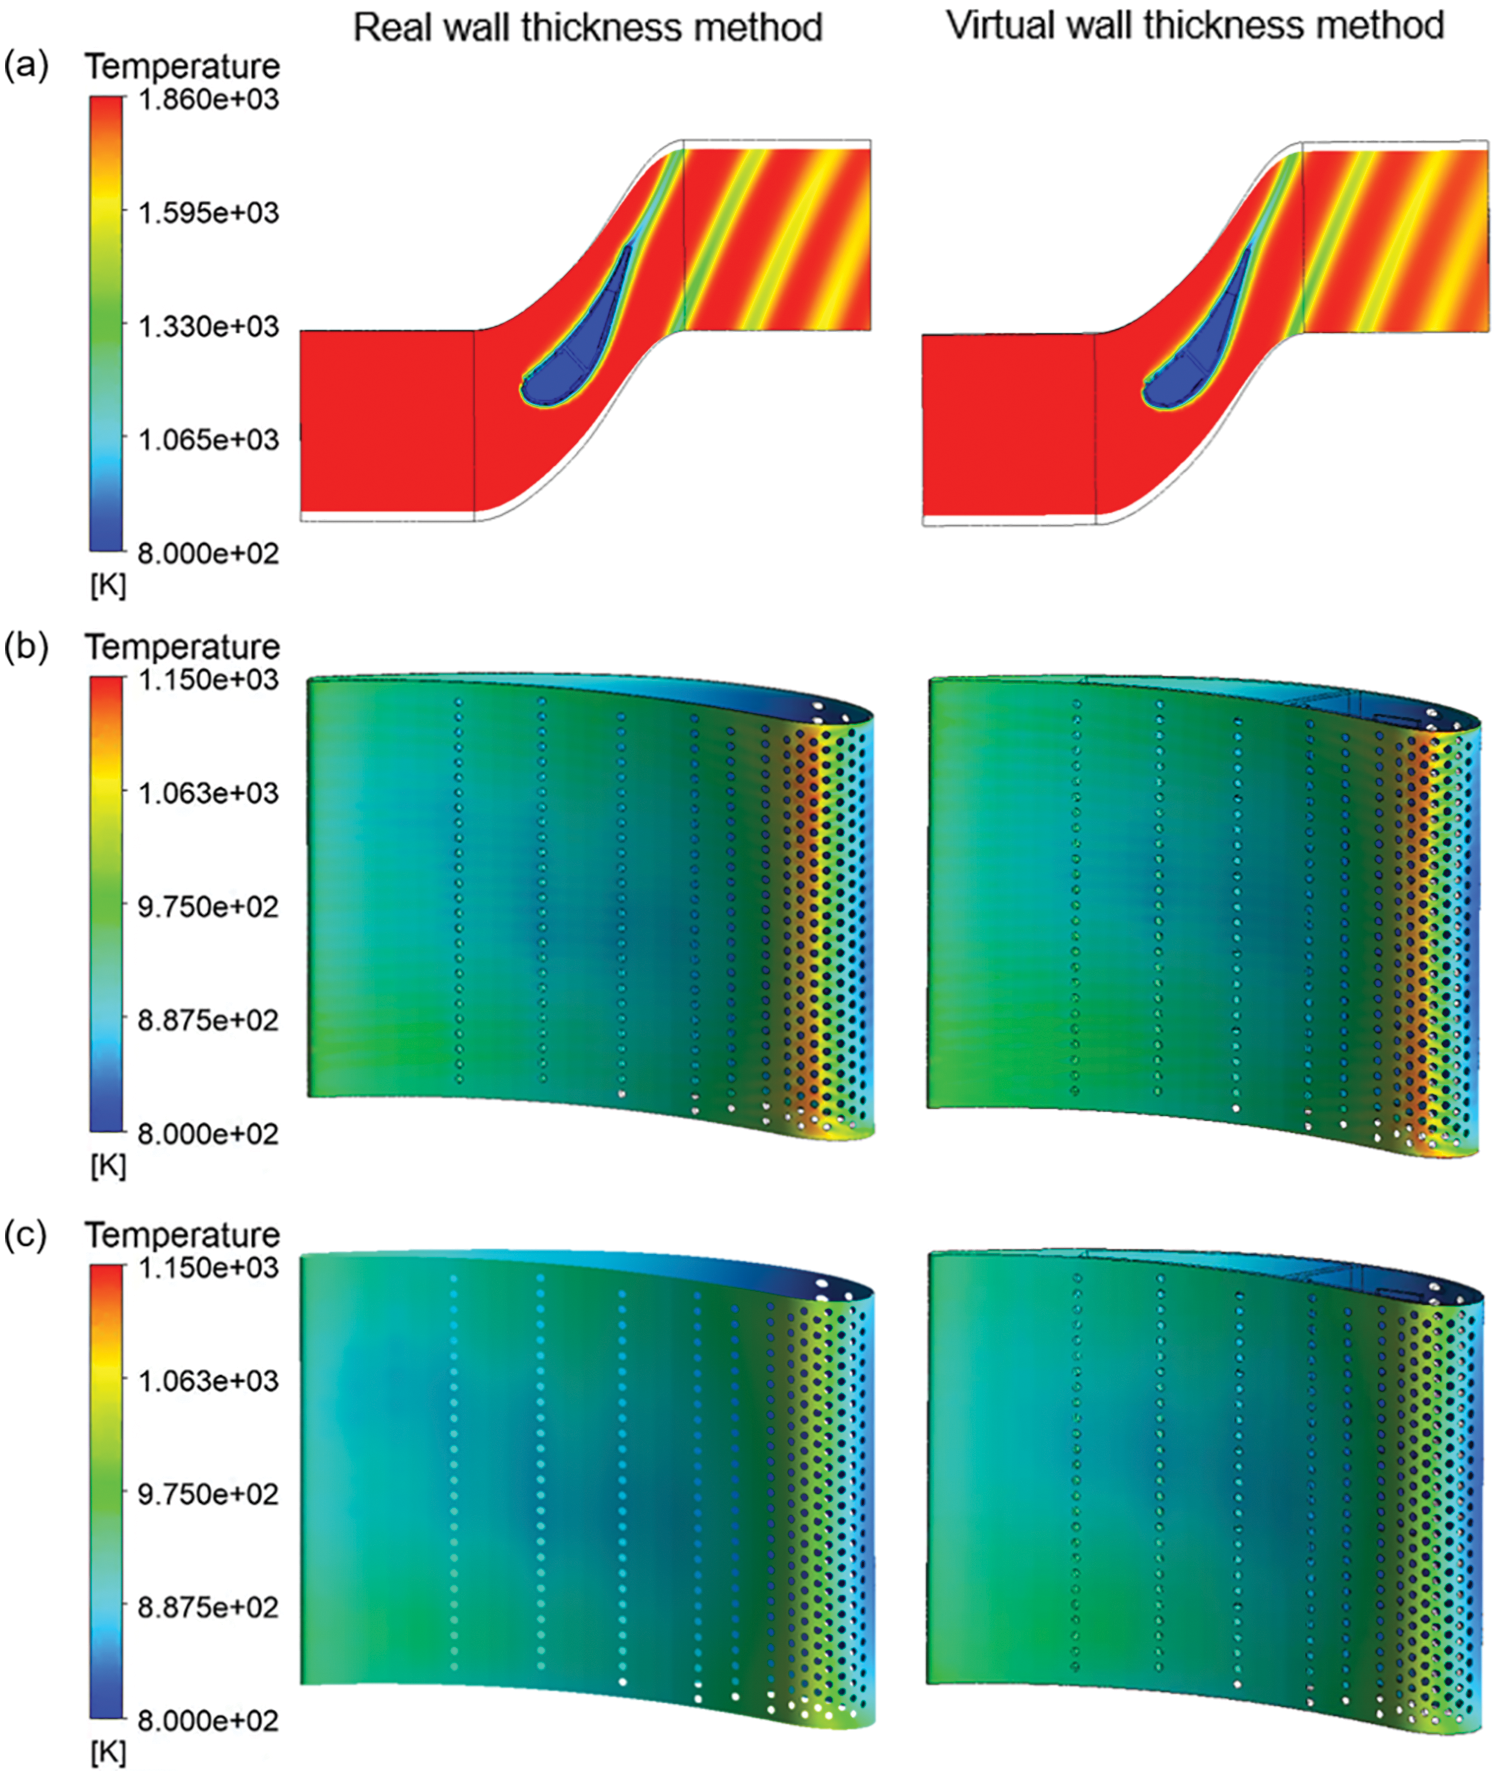
Figure 11: The temperature field of turbine blades. (a) 50% blade height section, (b) Coating surface, (c) Substrate surface
The nodes’ temperature on the same blade profile line is extracted, as shown in Fig. 12. It can be seen that the calculation results of the two methods are basically consistent, and the maximum temperature difference appears at the trailing edge area of the SS. The temperature difference and error of each position under two calculation methods are recorded in Table 6. The maximum temperature difference between the two calculation methods is 31.14 K. The reason for the difference may be that the virtual wall thickness can only calculate the one-dimensional heat conduction equation in its normal direction, and the deviation occurs when there is a large heat flow in the horizontal direction. It can be calculated that the average temperature difference of each profile line is 2.53 K–11.05 K, and the average error is 0.21%–0.93%. Therefore, the method of virtual wall thickness can be used to calculate the temperature field of turbine blades.
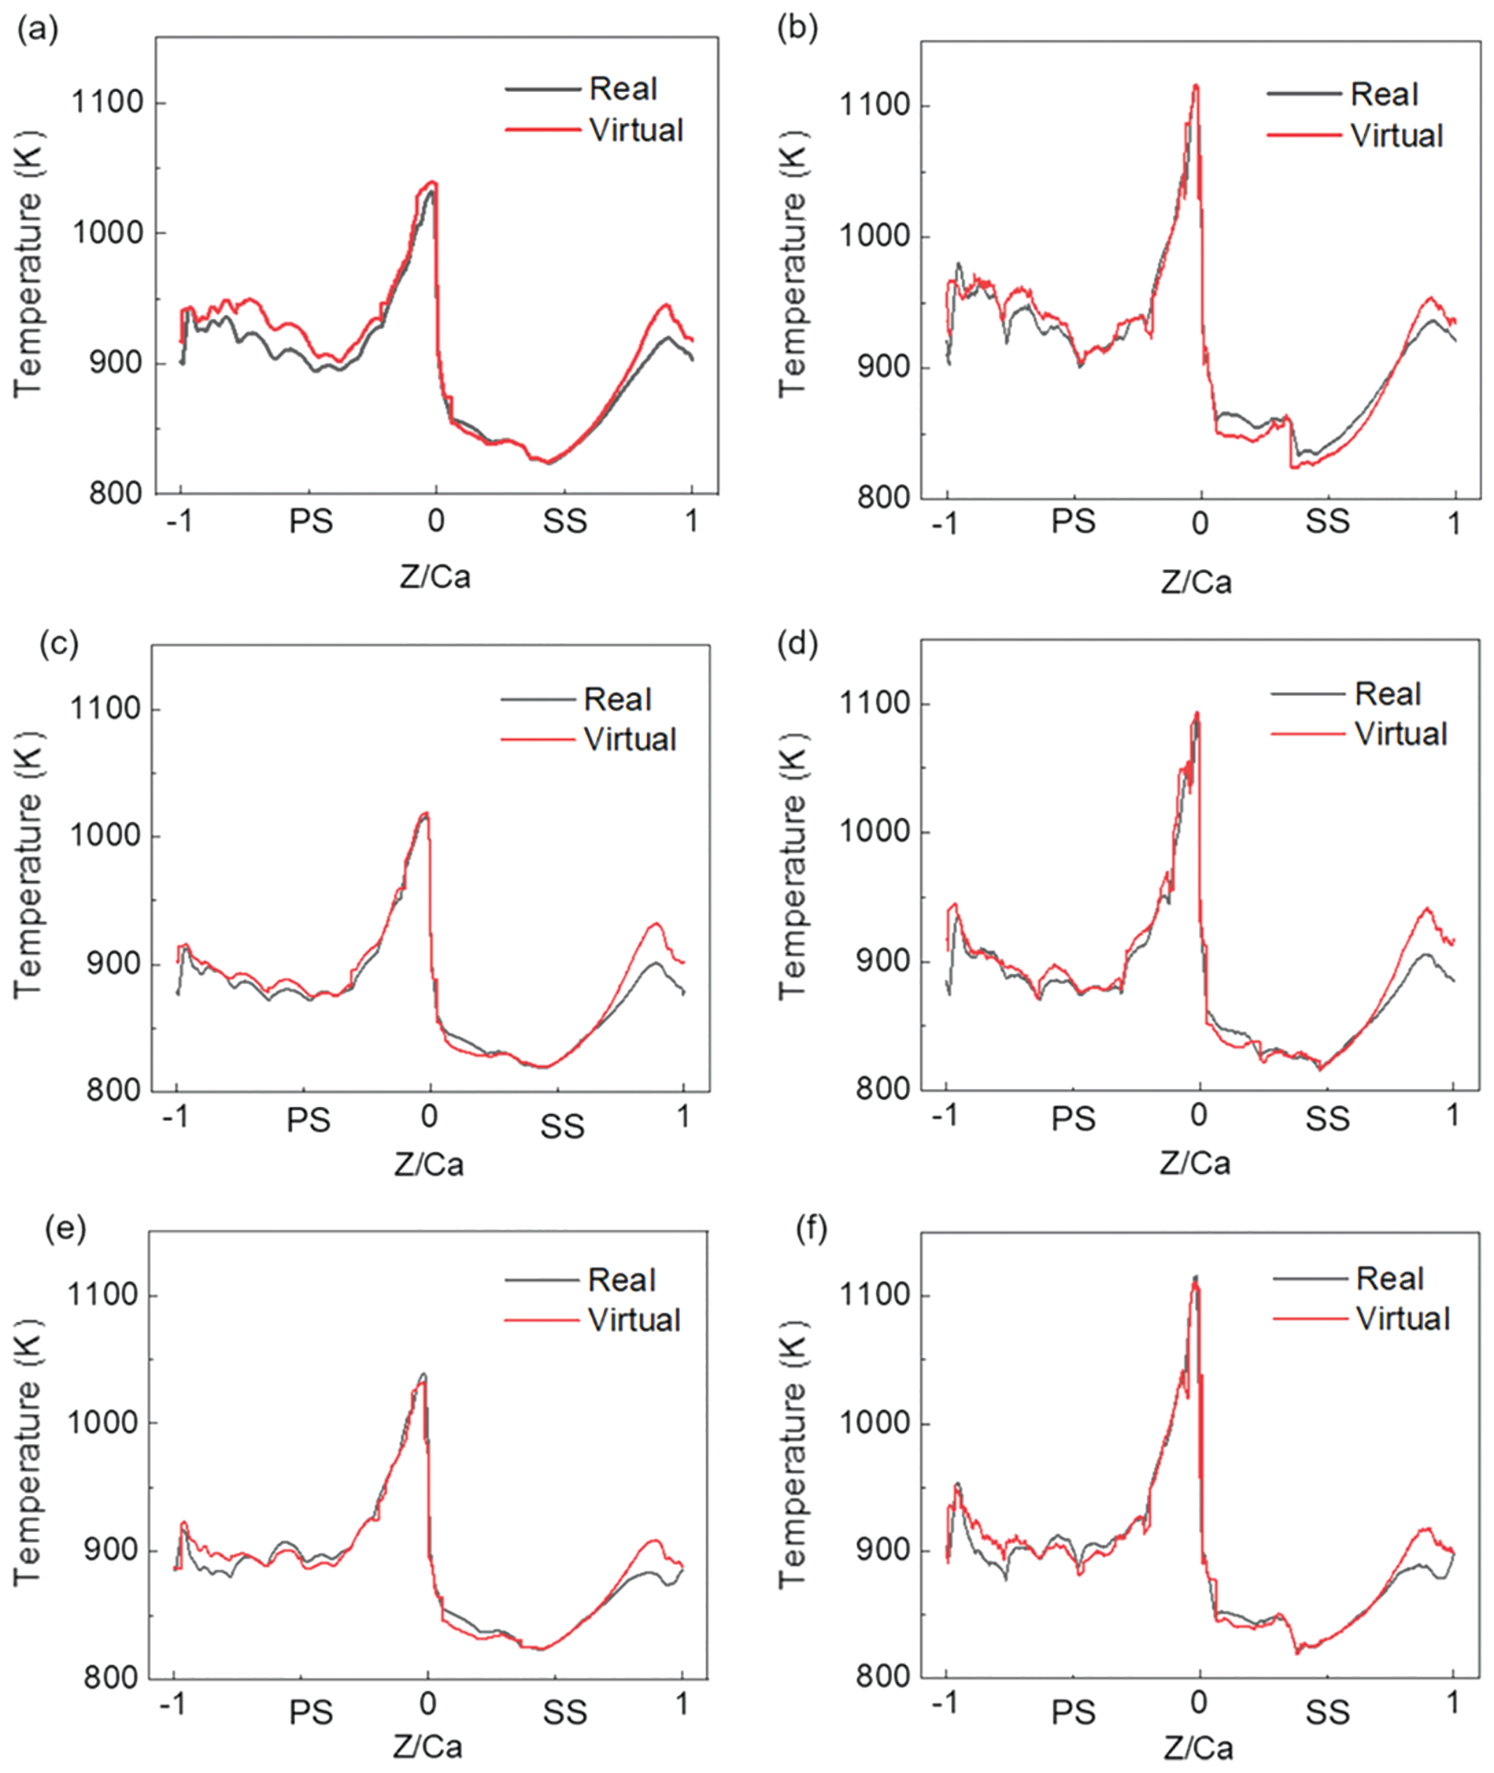
Figure 12: The temperature distribution of substrate and coating at three blade heights calculated using two calculation methods. (a) and (b) 25% blade height at the substrate and coating surface, (c) and (d) 50% blade height at the substrate and coating surface, (e) and (f) 75% blade height at the substrate and coating surface

4.4 Analysis of Blade Temperature Field
The virtual wall thickness method is applied to analysis the temperature field of turbine blade. Fig. 13 shows the temperature distribution of the substrate and coating surface along the blade profile at three blade heights (0 represents the leading edge, positive values to 1 represent the SS, and negative values to −1 represent the PS). It can be seen that the temperature distribution characteristics of the substrate and the coating are similar. The highest temperature appears at the leading edge of the blade, the lowest temperature appears at the SS, and the average temperature of the PS is higher than that of the SS. The highest temperature occurs at 25% height of the blade because of the joint action of external flow field and internal cooling channel. The temperature at 50% height of blade is the lowest among the three heights, because the cooling air flow rate in the middle area is the highest, resulting in the best cooling effect [15]. In addition, the profile line passes through the air film hole with lower ambient temperature, so there are many abrupt points on the temperature curve.
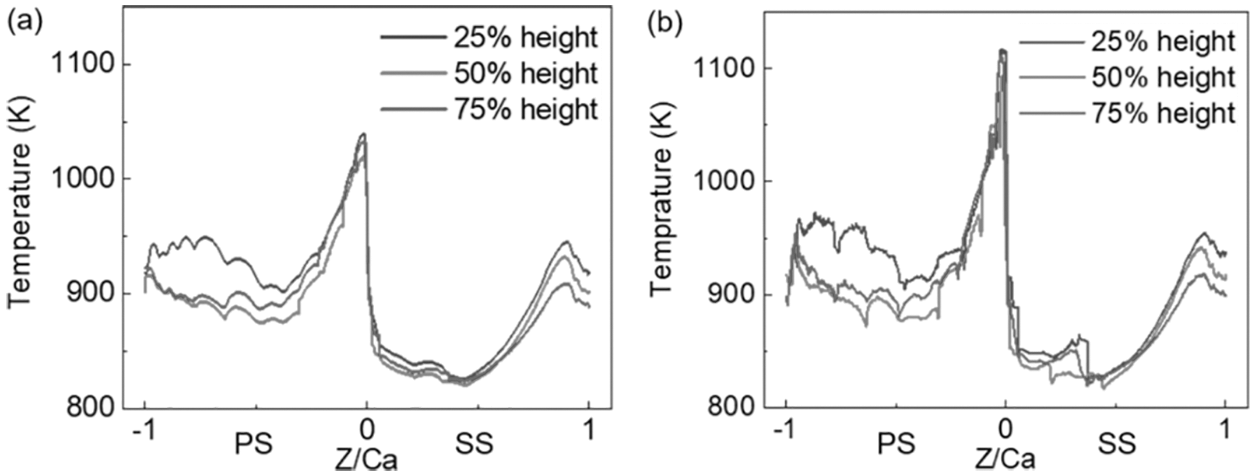
Figure 13: The temperature distribution on the blade profile at 25%, 50% and 75% blade heights. (a) Substrate surface, (b) Coating surface
The thermal insulation effect of the TBCs at each position can be described by comparing the surface temperature of the substrate and coating at different blade heights, as shown in Figs. 14a–14c. It can be seen that the thermal insulation effect of TBCs at the blade’s leading edge is the most obvious. Fig. 14d illustrates the thermal insulation temperature difference of TBCs at different positions. The maximum thermal insulation temperature difference occurs at the leading edge of the blade. The thermal insulation effect of TBCs near the air film hole is the least obvious, which is because the air film cooling dominates the region, and reduces the heat flux density.
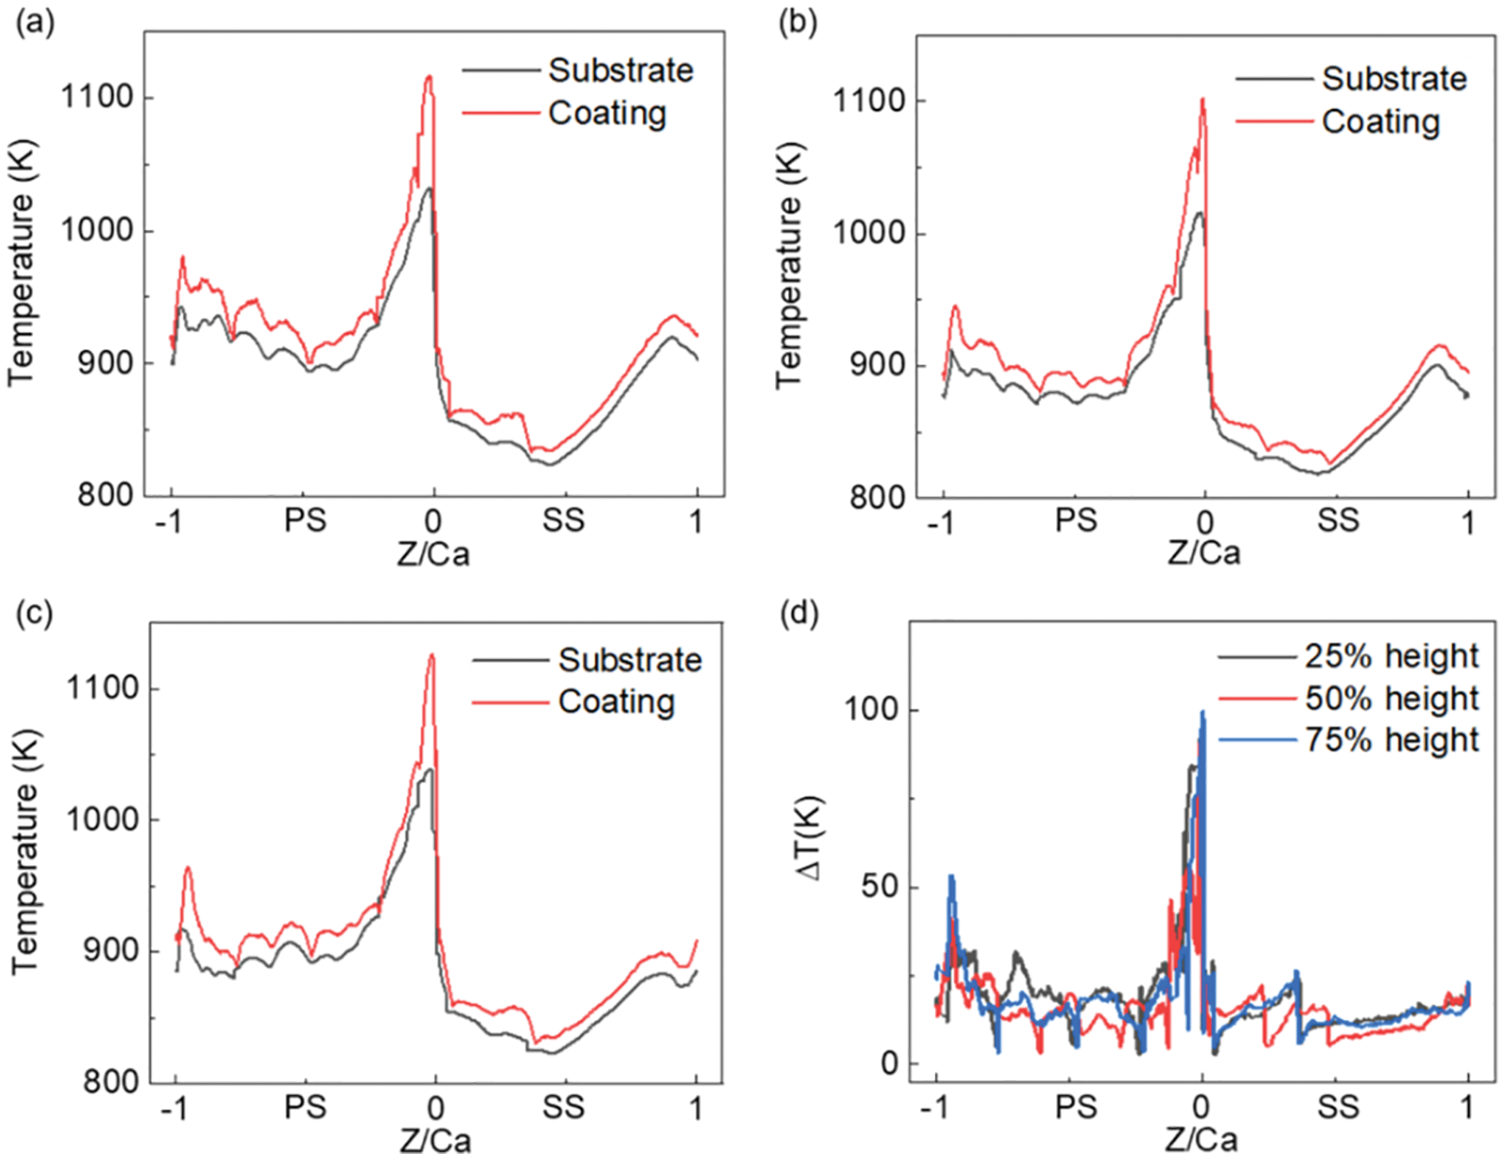
Figure 14: The thermal insulation effect of the coating at different locations of the blade. (a) 25% blade height, (b) 50% blade height, (c) 75% blade height, (d) Insulation temperature at different heights
5 Thermal Analysis of Substrate-Coating System
The substrate-coating system is composed of a load carrying substrate, a ceramic layer TC, a metallic layer BC, and an oxide layer TGO that forms between TC and BC. Commonly, TGO formed during the high-temperature oxidation has the maximum thickness of about 10–50 μm [33]. When complex blades are analyzed, the cross-scale membrane structure is challenging to carry out in the process of mesh generation. In order to meet the appropriate aspect ratio, the number of meshes near the cross-scale region will increase sharply, which greatly reduces the computational efficiency. However, using the virtual wall thickness method can easily solve this problem.
The temperature field of the substrate-coating system is calculated in this section using the virtual wall thickness method. The finite element model is shown in Fig. 15. The thickness of TC, BC and TGO is set to 0.25, 0.125 and 0.01 mm, respectively [34]. The substrate is the real wall, and the BC, TGO and TC layers are virtual walls with uniform thickness. The material parameters of each layer are shown in Table 2. The boundary conditions of the model are shown in Table 5. Due to the existence of a multi-layer virtual layer, the method of shell heat transfer model is adopted. The three-dimensional thermal differential equation is calculated by setting the virtual thickness and material parameters of each layer.
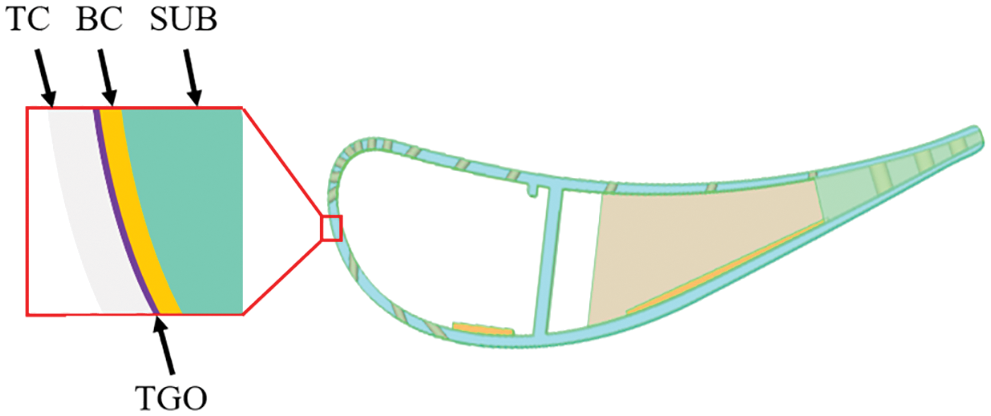
Figure 15: The finite element model of blade with multi-layer coating structure
5.2 Temperature Field of Each Layer
The temperature field of each layer of substrate-coating system is shown in Fig. 16. The average surface temperature of TC, TGO, BC and SUB is 915.31, 890.35, 889.94 and 888.63 K, respectively. The temperature distribution of the surface of each layer along the blade profile at 50% blade height is shown in Fig. 17. It can be seen that the TC layer has the best thermal insulation effect because of its low thermal conductivity, but the thermal insulation effect of other layers is not apparent. Each layer shows the trend of high temperature at the leading edge of the blade and low temperature at the suction surface and pressure surface. The maximum and average insulation temperatures of each layer are shown in Table 7. The maximum insulation temperature of TC layer is 172.01 K. The thermal insulation effect of BC layer is higher than that of TGO layer, but it can be ignored compared with TC layer. The average insulation temperature of each layer decreases significantly compared with the maximum insulation temperature. This is because the heat flow on the suction surface and pressure surface is low and the temperature difference of each layer decreases. From the average insulation temperature of each layer, it can be calculated that the thermal insulation proportion of TC, TGO and BC is 93.55%, 1.54% and 4.91%, respectively. TC layer plays a crucial role in the thermal protection of blades.


Figure 16: The temperature field of each layer. (a) TC surface, (b) TGO surface, (c) BC surface, (d) SUB surface
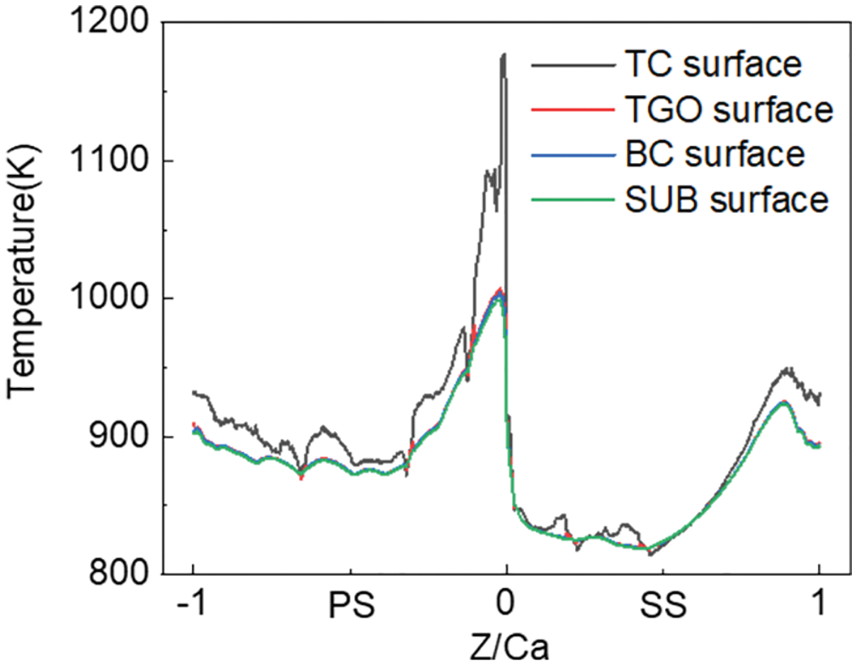
Figure 17: The surface temperature distribution of each layer along the blade profile at 50% blade height

This paper firstly compares the simulation results and experimental data. It preliminarily verifies the accuracy and feasibility of thermal analysis using virtual wall thickness method. Secondly, the obvious advantages of the virtual wall thickness method in analyzing the temperature field of the blade are proven, when compared with the real wall thickness method. Finally, the temperature fields of the substrate-coating system are discussed in detail. The main conclusions are as follows:
(1) Compared with the real wall thickness method, the virtual wall thickness method can improve the mesh quality by 20%, reduce the number of the mesh by 76.7%, and save the calculation time by 35.5%. The average calculation error of the virtual wall thickness method is 0.21%–0.93%, which can be used for the thermal analysis of coated turbine blades.
(2) The temperature at the blade leading edge is the highest, and the average temperature of the blade PS is higher than that of the SS. The blade surface presents a high temperature at both ends and a low temperature at the middle height, due to the influence of the cooling gas flow rate. The thermal insulation effect of coating at the blade’s leading edge is the most obvious. Coatings near the air film holes provide the least thermal insulation.
(3) The TC layer has the highest thermal insulation effect at the leading edge of blade, which is 172.01 K. The thermal insulation proportion of TC, TGO and BC is 93.55%, 1.54% and 4.91%, respectively, in the substrate-coating system. Therefore, TC layer plays a key role in the thermal protection of blades.
Acknowledgement: The authors wish to express their appreciation to the reviewers for their helpful suggestions which greatly improved the presentation of this paper.
Funding Statement: This work is supported by the National Science and Technology Major Project (J2019-IV-0003-0070), the National Natural Science Foundation of China (Grant No. 12102320), the Advanced Aviation Power Innovation Workstation Project (HKCX2019-01-003) and China Postdoctoral Science Foundation (2021M692571).
Conflicts of Interest: The authors declare that they have no conflicts of interest to report regarding the present study.
References
1. Padture, N. P., Gell, M., Jordan, E. H. (2002). Thermal barrier coatings for gas-turbine engine applications. Science, 296(5566), 280–284. DOI 10.1126/science.1068609. [Google Scholar] [CrossRef]
2. Li, D., Jiang, P., Sun, F., Jin, X. C., Fan, X. L. (2021). Experimental and numerical investigation on the thermal and mechanical behaviors of thermal barrier coatings exposed to CMAS corrosion. Journal of Advanced Ceramics, 10(3), 551–564. DOI 10.1007/s40145-021-0457-2. [Google Scholar] [CrossRef]
3. Li, C., Jin, X. C., Zhao, W., Yang, J., Jiang, P. et al. (2021). Detecting the erosion of atmosphere-plasma-sprayed thermal barrier coating system using luminescent multi-sublayers. Ceramics International, 47(10), 14689–14692. DOI 10.1016/j.ceramint.2021.02.042. [Google Scholar] [CrossRef]
4. Li, C. L., Fan, X. L., Jiang, P., Jin, X. C. (2018). Delamination-indicating of atmosphere-plasma-sprayed thermal barrier coating system using Eu3+ luminescence mapping. Materials Letters, 222, 41–44. DOI 10.1016/j.matlet.2018.03.116. [Google Scholar] [CrossRef]
5. Fan, X., Xu, R., Wang, T. J. (2014). Interfacial delamination of double-ceramic-layer thermal barrier coating system. Ceramics International, 40(9), 13793–13802. DOI 10.1016/j.ceramint.2014.05.095. [Google Scholar] [CrossRef]
6. Wang, X. M., Hui, Y. Z., Hou, Y. Y., Yu, Z. Y., Li, L. et al. (2019). Direct investigation on high temperature tensile and creep behavior at different regions of directional solidified cast turbine blades. Mechanics of Materials, 136, 103068. DOI 10.1016/j.mechmat.2019.103068. [Google Scholar] [CrossRef]
7. Rani, S., Agrawal, A. K., Rastogi, V. (2017). Failure analysis of a first stage IN738 gas turbine blade tip cracking in a thermal power plant. Case Studies in Engineering Failure Analysis, 8, 1–10. DOI 10.1016/j.csefa.2016.11.002. [Google Scholar] [CrossRef]
8. Chung, H., Sohn, H., Park, J. S., Kim, K. M., Cho, H. H. (2017). Thermo-structural analysis of cracks on gas turbine vane segment having multiple airfoils. Energy, 118, 1275–1285. DOI 10.1016/j.energy.2016.11.005. [Google Scholar] [CrossRef]
9. Qu, S., Fu, C. M., Dong, C., Tian, J. F., Zhang, Z. F. (2013). Failure analysis of the 1st stage blades in gas turbine engine. Engineer Failure Analysis, 32, 292–303. DOI 10.1016/j.engfailanal.2013.03.017. [Google Scholar] [CrossRef]
10. Kargarnejad, S., Djavanroodi, F. (2012). Failure assessment of nimonic 80A gas turbine blade. Engineering Failure Analysis, 26, 211–219. DOI 10.1016/j.engfailanal.2012.05.028. [Google Scholar] [CrossRef]
11. Kusterer, K., Bohn, D., Sugimoto, T., Tanaka, R. (2004). Conjugate calculations for a film-cooled blade under different operating conditions. Proceedings of ASME Turbo Expo 2004: Power for Land, Sea, and Air, pp. 675–684. Vienna, Austria. DOI 10.1115/GT2004-53719. [Google Scholar] [CrossRef]
12. Sipatov, A., Gomzikov, L., Latyshev, V., Gladysheva, N. (2009). Three dimensional heat transfer analysis of high pressure turbine. Proceedings of ASME Turbo Expo 2009: Power for Land, Sea and Air, pp. 71–79. Orlando, Florida, USA. DOI 10.1115/GT2009-59163. [Google Scholar] [CrossRef]
13. Mangani, L., Cerutti, M., Maritano, M., Spel, M. (2010). Conjugate heat transfer analysis of NASA C3X film cooled vane with an object-oriented CFD code. Proceedings of ASME Turbo Expo 2010: Power for Land, Sea and Air, pp. 1805–1814. Glasgow, UK. DOI 10.1115/GT2010-23458. [Google Scholar] [CrossRef]
14. Ni, R. H., Humber, W., Fan, G., Johnson, P. D., Downs, J. et al. (2012). Conjugate heat transfer analysis for a film-cooled turbine vane. Proceedings of ASME Turbo Expo 2011: Turbine Technical Conference and Exposition, pp. 423–434. Vancouver, British Columbia, Canada. DOI 10.1115/GT2011-45920. [Google Scholar] [CrossRef]
15. Ni, R. H., Humber, W., Fan, G., Clark, J. P., Anthony, R. J. et al. (2013). Comparison of predictions from conjugate heat transfer analysis of a film-cooled turbine vane to experimental data. Proceedings of ASME Turbo Expo 2013: Turbine Technical Conference and Exposition, San Antonio, Texas, USA. DOI 10.1115/GT2013-94716. [Google Scholar] [CrossRef]
16. Zhu, W., Wang, J. W., Yang, L., Zhou, Y. C., Wei, Y. G. et al. (2017). Modeling and simulation of the temperature and stress fields in a 3D turbine blade coated with thermal barrier coatings. Surface and Coating Technology, 315, 443–453. DOI 10.1016/j.surfcoat.2017.03.012. [Google Scholar] [CrossRef]
17. Wang, Z., Wang, D., Liu, Z., Feng, Z. (2017). Numerical analysis on effects of inlet pressure and temperature non-uniformities on aero-thermal performance of a HP turbine. International Journal of Heat and Mass Transfer, 104, 83–97. DOI 10.1016/j.ijheatmasstransfer.2016.08.018. [Google Scholar] [CrossRef]
18. Yongbin, J., Chao, M., Bing, G., Shusheng, Z. (2016). Conjugate heat transfer investigation on the cooling performance of air cooled turbine blade with thermal barrier coating. Journal of Thermal Science, 25(4), 325–335. DOI 10.1007/s11630-016-0867-6. [Google Scholar] [CrossRef]
19. Reyhani, M. R., Alizadeh, M., Fathi, A., Khaledi, H. (2013). Turbine blade temperature calculation and life estimation-a sensitivity analysis. Propulsion and Power Research, 2(2), 148–161. DOI 10.1016/j.jppr.2013.04.004. [Google Scholar] [CrossRef]
20. Sadowski, T., Golewski, P. (2012). The influence of quantity and distribution of cooling channels of turbine elements on level of stresses in the protective layer TBC and the efficiency of cooling. Computational Materials Science, 52(1), 293–297. DOI 10.1016/j.commatsci.2011.02.027. [Google Scholar] [CrossRef]
21. Vo, D. T., Mai, T. D., Kim, B., Ryu, J. (2022). Numerical study on the influence of coolant temperature, pressure, and thermal barrier coating thickness on heat transfer in high-pressure blades. International Journal of Heat and Mass Transfer, 189, 122715. DOI 10.1016/j.ijheatmasstransfer.2022.122715. [Google Scholar] [CrossRef]
22. Maikell, J., Bogard, D., Piggush, J., Kohli, A. (2019). Experimental simulation of a film cooled turbine blade leading edge including thermal barrier coating effects. Proceedings of ASME Turbo Expo 2009: Power for Land, Sea and Air, pp. 1001–1008. Orlando, Florida, USA. DOI 10.1115/1.4000537. [Google Scholar] [CrossRef]
23. Shen, Q., Li, S. Z., Yang, L., Zhou, Y. C., Wei, Y. G. et al. (2018). Coupled mechanical-oxidation modeling during oxidation of thermal barrier coatings. Computational Materials Science, 154, 538–546. DOI 10.1016/j.commatsci.2018.08.017. [Google Scholar] [CrossRef]
24. Song, J., Qi, H., Shi, D., Yang, X., Li, S. (2019). Effect of non-uniform growth of TGO layer on cracking behaviors in thermal barrier coatings: A numerical study. Surface and Coatings Technology, 370, 113–124. DOI 10.1016/j.surfcoat.2019.04.069. [Google Scholar] [CrossRef]
25. Zhu, W., Cai, M., Yang, L., Guo, J. W., Zhou, Y. C. et al. (2015). The effect of morphology of thermally grown oxide on the stress field in a turbine blade with thermal barrier coatings. Surface and Coatings Technology, 276, 160–167. DOI 10.1016/j.surfcoat.2015.06.061. [Google Scholar] [CrossRef]
26. Li, B., Fan, X., Li, D., Jiang, P. (2017). Design of thermal barrier coatings thickness for gas turbine blade based on finite element analysis. Mathematical Problems in Engineering, 2017, 1–13. DOI 10.1155/2017/2147830. [Google Scholar] [CrossRef]
27. Smetankina, N. V., Postnyi, O. V., Merkulova, A. I., Merkulov, D. O. (2020). Modeling of non-stationary temperature fields in multilayer shells with film heat sources. IEEE KhPI Week on Advanced Technology, pp. 242–246. Kharkiv, Ukraine. DOI 10.1109/KhPIWeek51551.2020.9250139. [Google Scholar] [CrossRef]
28. Traeger, F., Vassen, R., Rauwald, K. H., Stover, D. (2003). Thermal cycling setup for testing thermal barrier coatings. Advanced Engineering Materials, 5(6), 429–432. DOI 10.1002/adem.200300337. [Google Scholar] [CrossRef]
29. Rosler, J., Baker, M., Aufzug, K. (2004). A parametric study of the stress state of thermal barrier coatings: Part I: Creep relaxation. Acta Materialia, 52, 4809–4817. DOI 10.1016/j.actamat.2004.06.046. [Google Scholar] [CrossRef]
30. Menter, F. R. (2009). Review of the shear-stress transport turbulence model experience from an industrial perspective. International Journal of Computational Fluid Dynamics, 23, 305–316. DOI 10.1080/10618560902773387. [Google Scholar] [CrossRef]
31. Ho, K., Liu, J., Elliott, T., Aguilar, B. (2016). Conjugate heat transfer analysis for gas turbine film-cooled blade. Proceedings of ASME Turbo Expo 2016: Turbomachinery Technical Conference and Exposition, Seoul, Korea. DOI 10.1115/GT2016-56688. [Google Scholar] [CrossRef]
32. Cai, L., He, Y., Wang, S., Li, Y., Li, F. (2021). Thermal-fluid-solid coupling analysis on the temperature and thermal stress field of a nickel-base superalloy turbine blade. Materials, 14(12), 3315. DOI 10.3390/ma14123315. [Google Scholar] [CrossRef]
33. Yang, L., Liu, Q. X., Zhou, Y. C., Mao, W. G., Lu, C. (2014). Finite element simulation on thermal fatigue of a turbine blade with thermal barrier coatings. Journal of Materials Science and Technology, 30(4), 371–380. DOI 10.1016/j.jmst.2013.11.005. [Google Scholar] [CrossRef]
34. Guan, P., Ai, Y. T., Fei, C. W., Yao, Y. D. (2019). Thermal fatigue life prediction of thermal barrier coat on nozzle guide vane via master–slave model. Applied Sciences, 9, 43–57. DOI 10.3390/app9204357. [Google Scholar] [CrossRef]
Cite This Article
 Copyright © 2023 The Author(s). Published by Tech Science Press.
This work is licensed under a Creative Commons Attribution 4.0 International License , which permits unrestricted use, distribution, and reproduction in any medium, provided the original work is properly cited.


 Submit a Paper
 Propose a Special lssue
 View Full Text
 Download PDF
 Downloads
 Citation Tools