
 Submit a Paper
 Propose a Special lssue
 Open Access
ARTICLE
Failure Mode and Effects Analysis Based on Z-Numbers and the Graded Mean Integration Representation
1 School of Automation Engineering, Shanghai University of Electric Power, Shanghai, 200090, China
2 State Key Laboratory of Nuclear Power Safety Monitorig Technology and Equipment, Shenzhen, 518172, China
* Corresponding Author: Xiaoyan Su. Email:
(This article belongs to the Special Issue: Computer-Aided Structural Integrity and Safety Assessment)
Computer Modeling in Engineering & Sciences 2023, 134(2), 1005-1019. https://doi.org/10.32604/cmes.2022.021898
Received 11 February 2022; Accepted 21 March 2022; Issue published 31 August 2022
 View Full Text
 Download PDF
Abstract
Failure mode and effects analysis (FMEA) is a widely used safety assessment method in many fields. Z-number was previously applied in FMEA since it can take both possibility and reliability of information into consideration. However, the use of fuzzy weighted mean to integrate Z-valuations may have some drawbacks and is not suitable for some situations. In this paper, an improved method is proposed based on Z-numbers and the graded mean integration representation (GMIR) to deal with the uncertain information in FMEA. First, Z-numbers are constructed based on the evaluations of risk factors O, S, D for each failure mode by different experts. Second, weights of the three risk factors and experts are determined. Third, the integration representations of Z-numbers are obtained by a new method based on the GMIR method. Finally, risk priorities of the failure modes are derived considering the weights of experts and risk factors. Two examples and a case study are given to show the use of the proposed method and comparison with other methods. The results show that the proposed method is more reasonable, universal and simple in calculation.Keywords
Safety assessment is an important task for large complex systems, such as nuclear power plants [1], aerospace systems [2], metro tunnels [3,4], bridges [5], and gas pipelines [6,7]. It includes structure reliability analysis [8,9], component reliability analysis [10,11] and even human reliability analysis [12], and can been conducted by using various methods, both qualitative [13,14] and quantitative [15–17]. Failure mode and effects analysis (FMEA) that originated in 1955 [18] is a widely used safety assessment method in many industry fields such as aircraft manufacturing, military systems, and engineering designs [19–22]. In these fields, there are multiple failure modes with different associated probabilities and consequences. FMEA is a method which aims to aggregate information for risk management decisions. It not only helps people to pick out failure modes by considering the causes and consequences, but also helps people to pick out the key point in designing which requires improvement and special control.
Risk priority number (RPN) which is used to prioritize failure modes in FMEA has been conducted a lot of considerable research by investigators over the years [23–28]. The traditional RPN method has been widely used to solve the problem of risk evaluation and maintenance strategy design under limited time and resources in a quantity of industries. However, the use of the traditional RPN in FMEA exposes some drawbacks.
Uncertainty is an important problem in failure analysis in traditional RPN. In order to deal with uncertain information more effectively, fuzzy set theory was first introduced to represent the uncertainty in risk evaluations. It relies on the membership functions and reasons by the if-then rules and is developing constantly [29–31]. Wang et al. [27] used fuzzy set theory to make the uncertainty quantitative in failure analysis in RPN. Failure modes’ risk factors with their relative weights can be evaluated through the method. However, in situations where the systems are lack of experimental data, the fuzzy weighted geometric mean method (FWGM) proposed by Wang et al. [27] cannot be used.
Dempster-Shafer (D-S) evidence theory is another effective method to deal with uncertainty [32,33]. Yang et al. [34] applied D-S evidence theory in handling uncertain evaluations of the risk factors in RPN. In their method, a modified D-S evidence theory is employed to gather different opinions with inaccuracy and uncertainty. However, in the situation that experts evaluate risk factors with different and accurate values, there will be highly conflict evidence in the basic belief assignments (BBAs) and Dempster’s combination rule can not fuse it. In order to avoid conflicting evidence in combination in FMEA, the boundaries of the focal elements are made fuzzy and a new BBA is constructed through the method to handle conflicting evidence [35]. However, in Su et al.’s method [35], the generalization is not complete and the basic assumption of D-Sevidence theory that the basic elements in the frame of discernment are mutually exclusive is unrealistc. Thus, D numbers which can be seen as the generalization of D-S evidence theory is also investigated in the RPN evaluation in FMEA [36–38]. It can represent both mutually related uncertain information and incomplete situations.
Information in reality not only has uncertainty limits on values, but also has partial reliability. Zadeh [39] proposed Z-number to describe information more fully in reality. According to the definition of Z-number, a Z-number can be expressed as
In this paper, an improved method based on the Z-numbers and the graded mean integration representation method is proposed. The subsequent parts of the paper are structured as follows. In Section 2, basic concepts are briefly reviewed. In Section 3, a new method based on Z-number and the graded mean integration presentation is proposed. In Section 4, two examples are given to point out the advantages of the proposed method. In Section 5, a case study is used to illustrate the application of the proposed method and compare results with other methods. Section 6 provides concluding remarks.
2.1 Risk Priority Number (RPN)
RPN is the product of three risk factors, i.e., the occurrence (
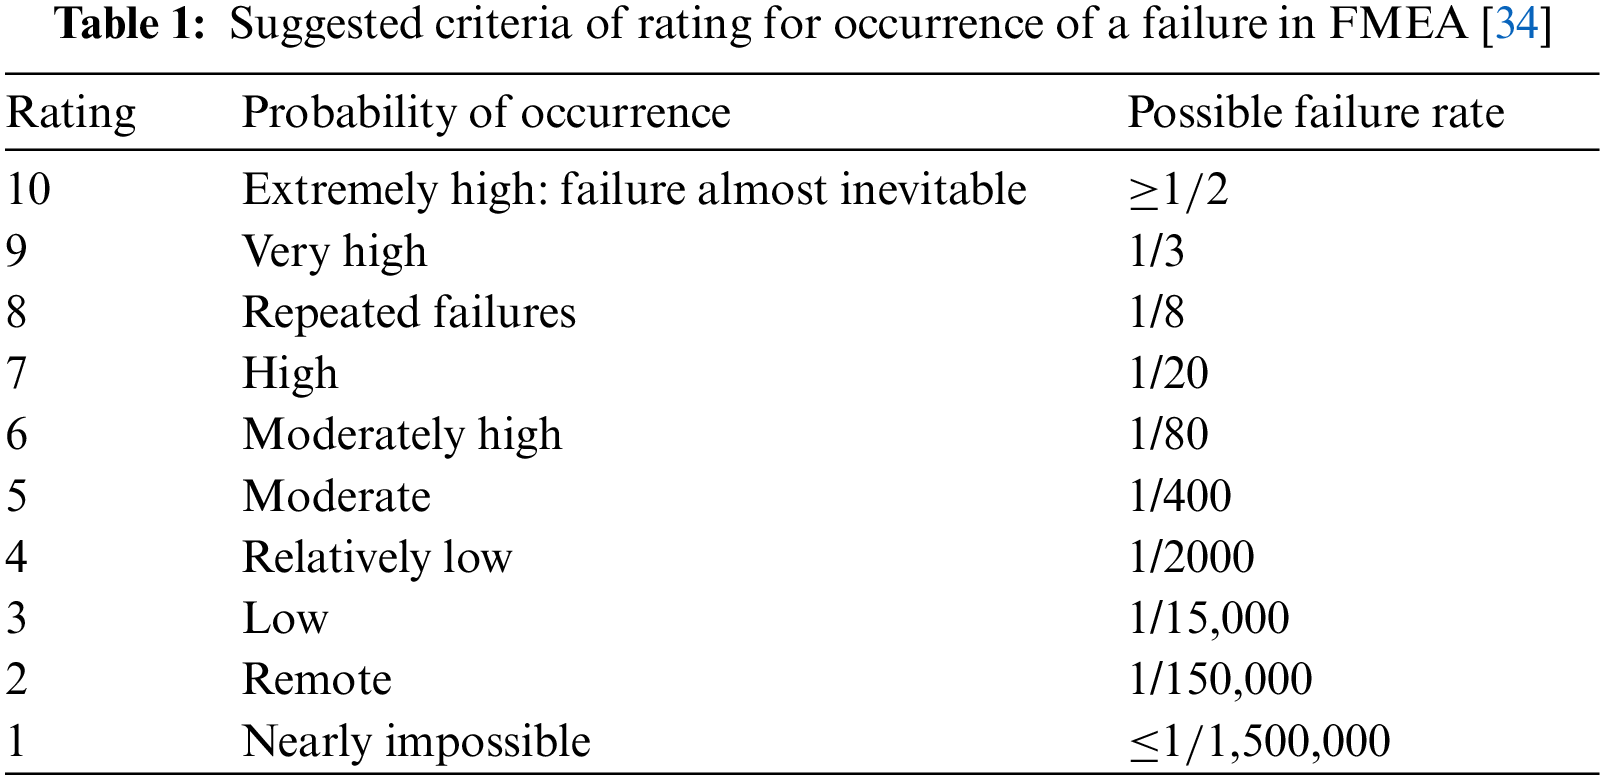
where S is the severity of a failure effect, O is the probability of occurrence of a failure mode and D is the probability of a failure being detected. Each risk factor is evaluated using the 10 ratings from 1 to 10. Take risk factor Occurrence (
Information that is uncertain and indistinct can be represented by fuzzy numbers [44].
Definition 2.2.1 A discrete and finite fuzzy set A which membership function is
Definition 2.2.2 Fuzzy sets can be expressed with intervals, which are named
The defuzzified centroid of
Definition 2.2.3 A discrete triangular fuzzy number A and a discrete trapezoidal fuzzy number A with membership function
Definition 2.2.4 In Fig. 1, a, b, c, and d are real numbers. The fuzzy number A in general is defined as
where
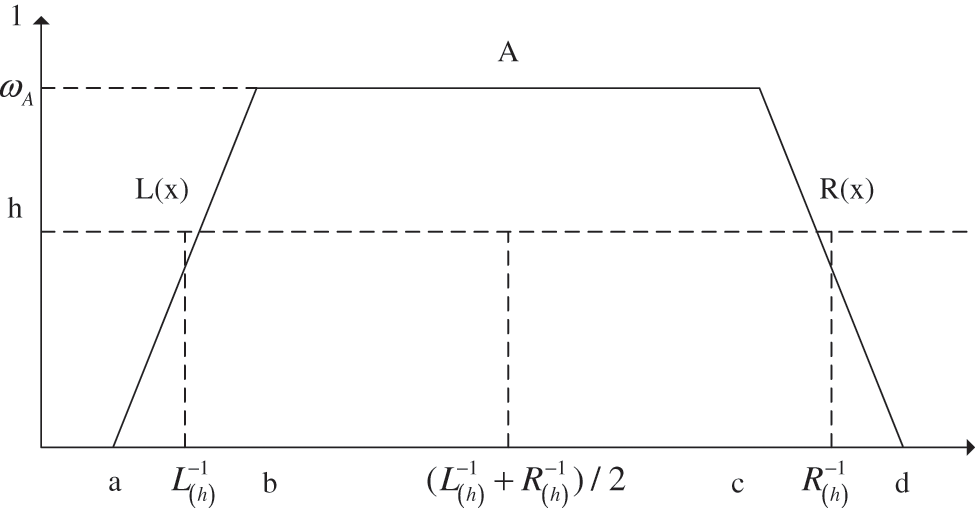
Figure 1: The graded mean h-level value of generalized number A = (a;b;c;d;ωA)LR [47]
Zadeh proposed Z-numbers’ contents in 2011 [39]. According to Zadeh, the Z-number is a pair of ordered fuzzy numbers expressed as
If X is a random variable with probability density function,
where
Some examples of Z-valuations are given below:
(dogs’ life, nearly 15 years, likely);
(size of German, about 36 million hectares, very sure);
(level of Sam’s effort, low, not sure).
3 Improved FMEA Method Based on Z-Numbers and GMIR
In this section, a new method is proposed to rank failure modes. There are much uncertain information to deal with in FMEA. With the development of Z-number, as it can express both possibility and reliability, large numbers of studies apply the Z-number to the risk priority numbers in the FMEA. However, the use of fuzzy weighted mean to integrate the Z-valuations of failure mode are not greatly suitable.
This article uses the graded mean integration representation (GMIR) method to integrate Z-valuations and propose a new method for calculating the risk priority numbers.
As is shown in Fig. 2, assume the potential failure modes in the system are previously identified based on historical data, the procedures of the new method are as follows.
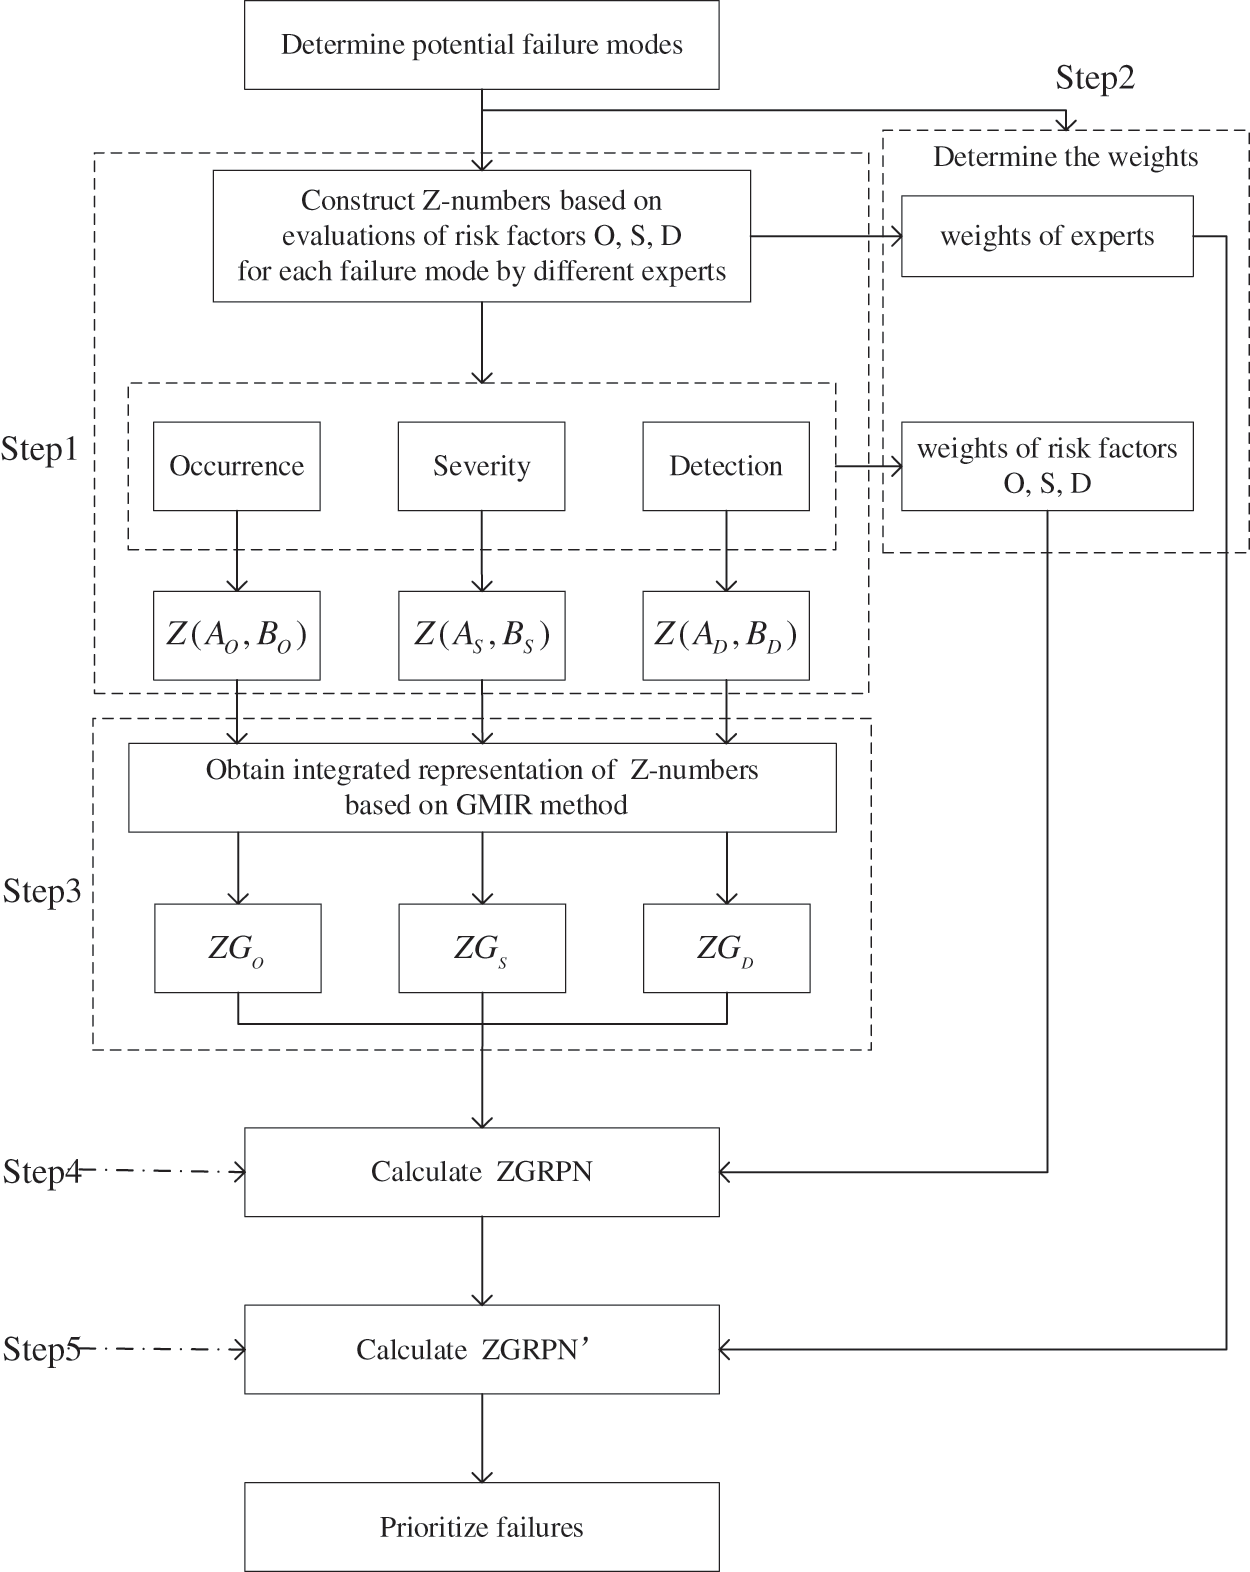
Figure 2: Procedures of the new method
Step 1: Construct Z-numbers based on evaluations of risk factors (
Assume that there are M potential failure modes in FMEA and each potential failure mode includes three risk factors. And, there are K experts making evaluations. In a Z-number, the component A and B are modeled as trapezoidal fuzzy number set and triangle fuzzy number set, respectively.
The risk factor
where
Step 2: Determine the weights of experts and risk factors.
Weights of experts and weights of risk factors O, S, D in FMEA are usually investigated by decision support group by using weight determination methods such as Analytic Hierarchy Process [48].
Step 3: Obtain integrated representation of Z-numbers based on GMIR method.
In this step, we obtain integrated representation of Z-numbers (
Definition 3.1 The integrated representation of Z-numbers
where
Step 4: Calculate the ZGRPNs of failure modes.
In this step, the integrated representations of three risk factors (
Definition 3.2 Assume the system has M failure modes, K experts and three risk factors, the ZGRPN of the
where
Step 5: Calculate the ZGRPN’s of failure modes and give the failure modes’ rankings in descending order of the ZGRPN’s.
In this step, evaluations from k different experts about one specific failure mode m (
Definition 3.3 Assume that there are K experts, the ZGRPN’ of the
where
Then give the failure modes’ rankings in descending order according to the ZGRPN’s. The failure modes with higher ZGRPN’ are riskier (have higher priority) and should be paid more attention to.
To show the validity of modified method, two examples are given in this section.
To make the calculation simple, we assume that risk factors O, S, D have the same weight in this paper.
Example 1. Suppose that Z-numbers based on evaluations of risk factors O, S, D have the same component A (possibility) and the component B (reliability part) is equal to zero or a specialized trapezoidal fuzzy number with four same coordinate values which means that the fuzzy number degenerates into crisp number (as shown in Table 2).
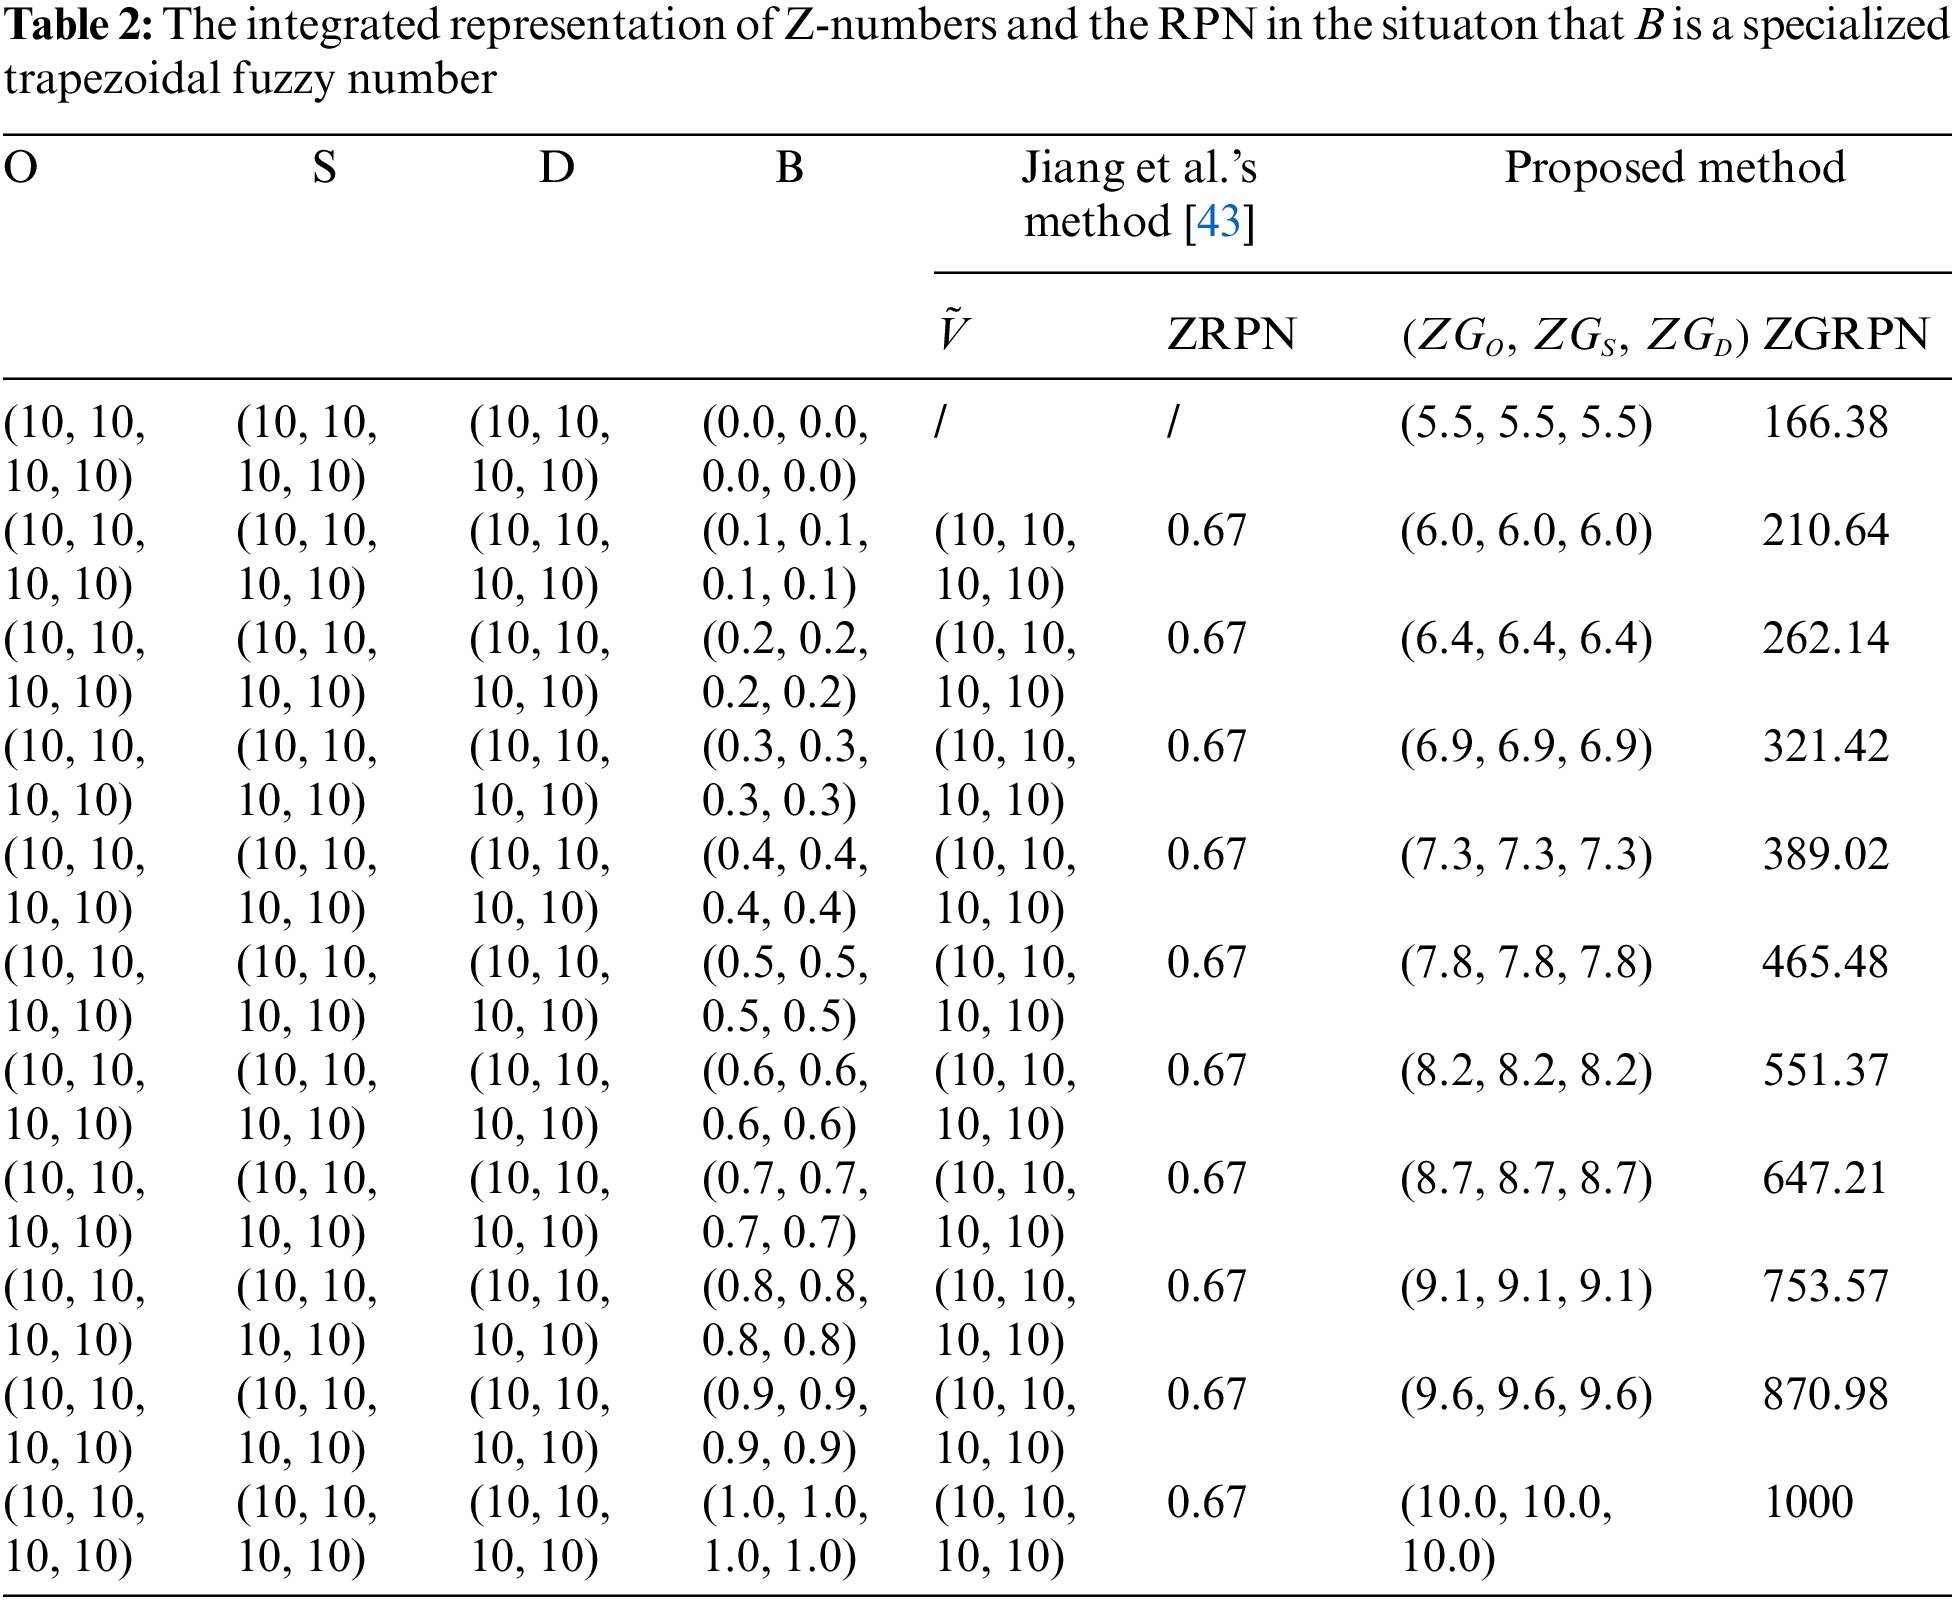
As can be seen from Table 2, in the situation that the component B (reliability part) is a specialized trapezoidal fuzzy number with four same coordinate values, the value of ZRPN does not change when part B changes. This means that, in such case, the part B does not work. Especially, when the part B is equal to zero, Jiang et al.’s method [43] cannot handle such situation since the denominator in the fuzzy weighted mean formula becomes zero. Different from ZRPN, the value of ZGRPN obtained by the proposed method increased with increasing value of part B (reliability). This is reasonable: as can be seen from Table 2, part A of risk factors O, S, D belongs to the highest rating (the most risk), the priority of such failure mode should be promoted with a higher confidence level (reliability).
Example 2. Assume that the Z-number constructed based on the evaluation of risk factor is Z = (A, B) = ((7, 8, 8, 9), (6, 6, 6.3, 6.3)). Now assume that part A does not change, part B changes from (6, 6, 6.3, 6.3) to (5.7, 6, 6.3, 6.3). In such case, since part A shows high risk (higher than average rating “5”) for a certain risk factor, if part B (reliability of part
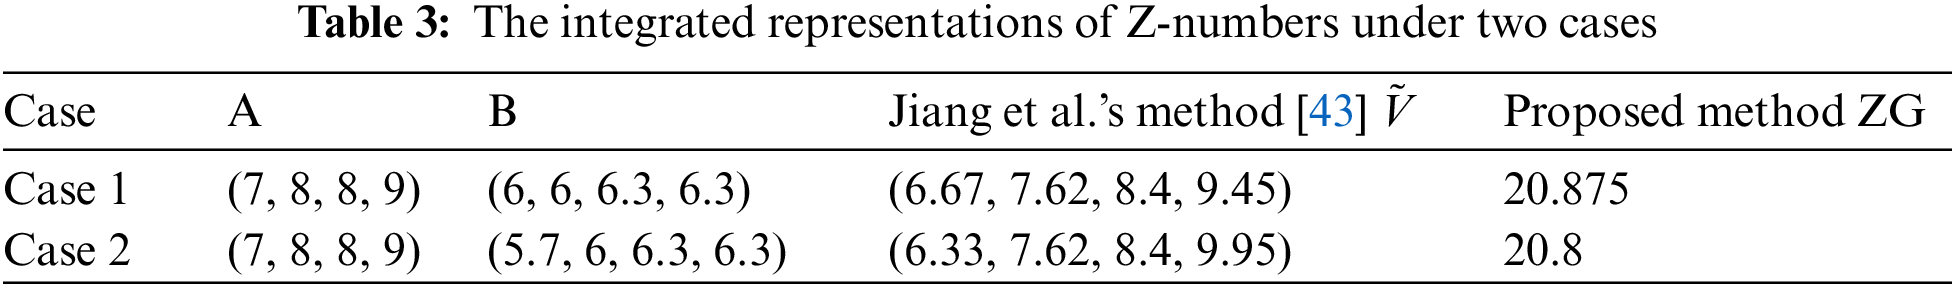
As can be seen in Table 4, the integrated representation of Z-number by Jiang et al.’s method [43] is in the form of a fuzzy number which is difficult to compare. Thus, we first defuzzify the fuzzy set by the centroid defuzzification method. Set
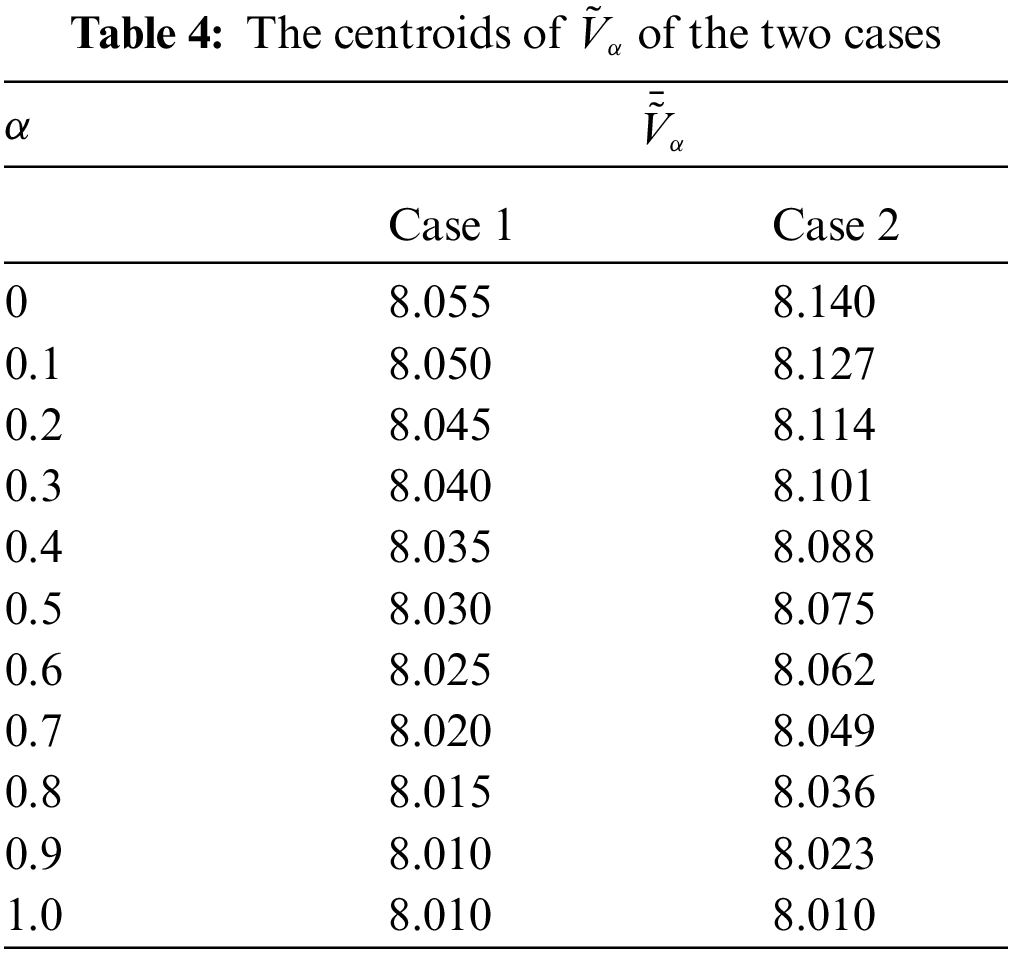
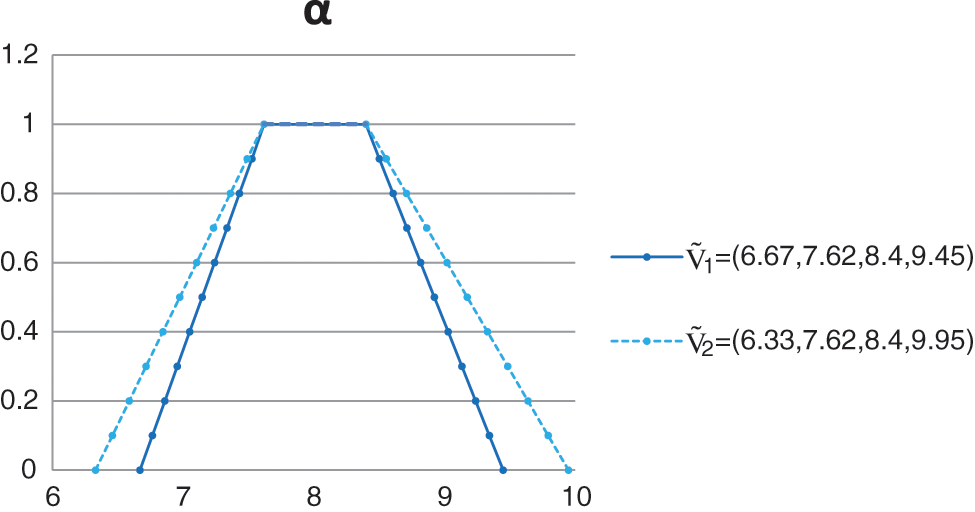
Figure 3: α-level cuts of the integrated valuations
It can be seen from Tables 3 and 4, in Jiang et al.’s method [43] that when the part A shows high risk evaluation, with the reliability of part A (part
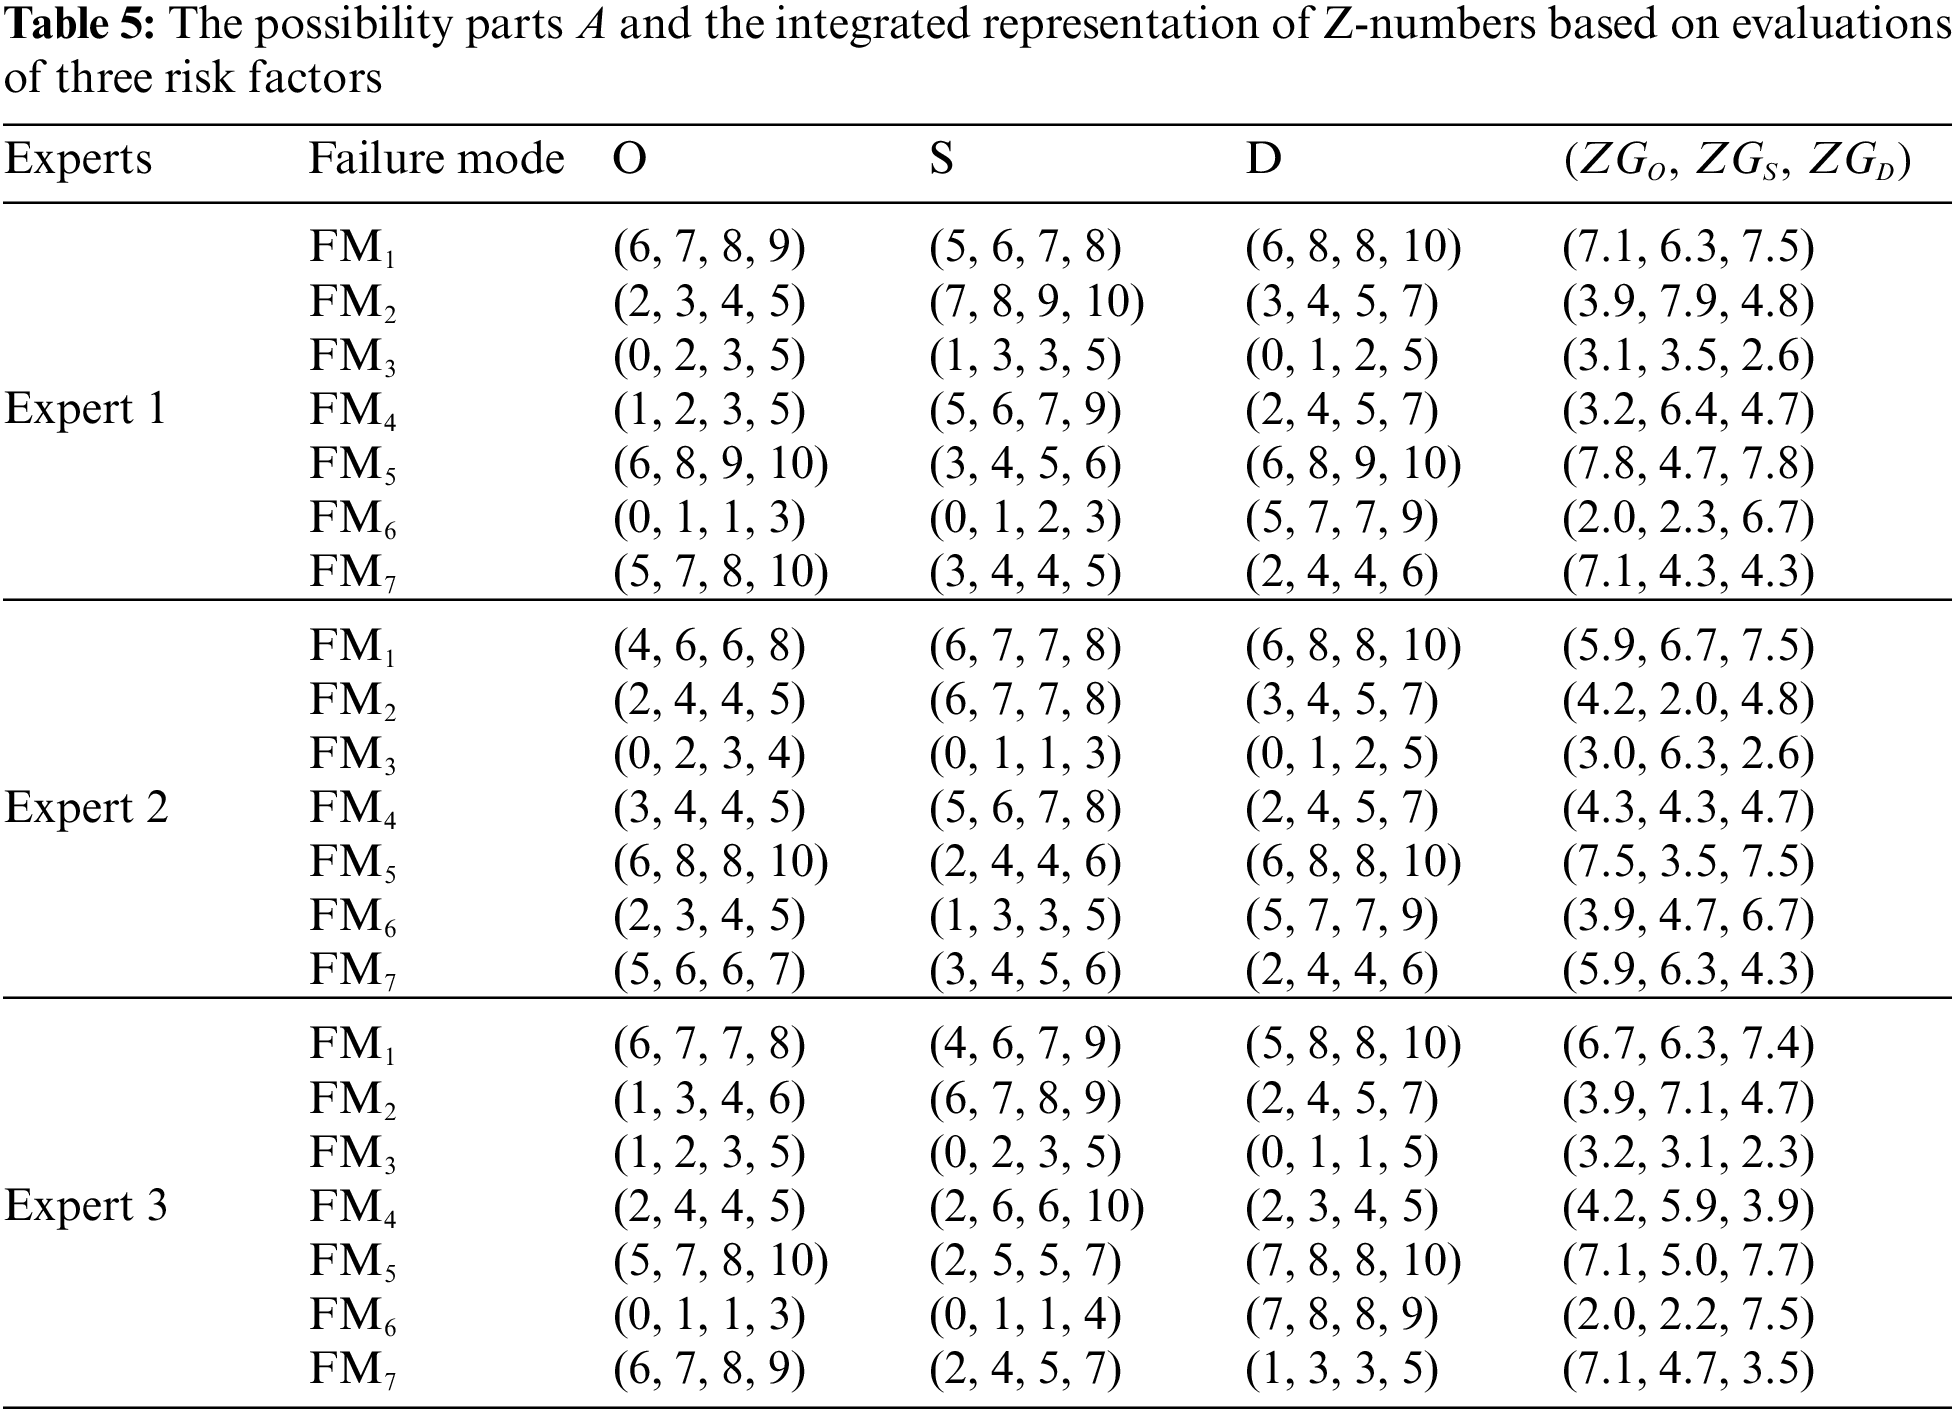
In this section, a case study of prioritizing risk levels of failure modes in an aircraft turbine’s rotor blades system from reference [43] is given to show the use and effectiveness of the proposed method.
Seven failure modes are identified and analyzed in the aircraft turbine’s rotor blades system. Assume that there are three experts and their weights are 0.4, 0.3, 0.3, respectively. And suppose the Z-numbers based on evaluations of risk factors O, S, D have the same reliability parts
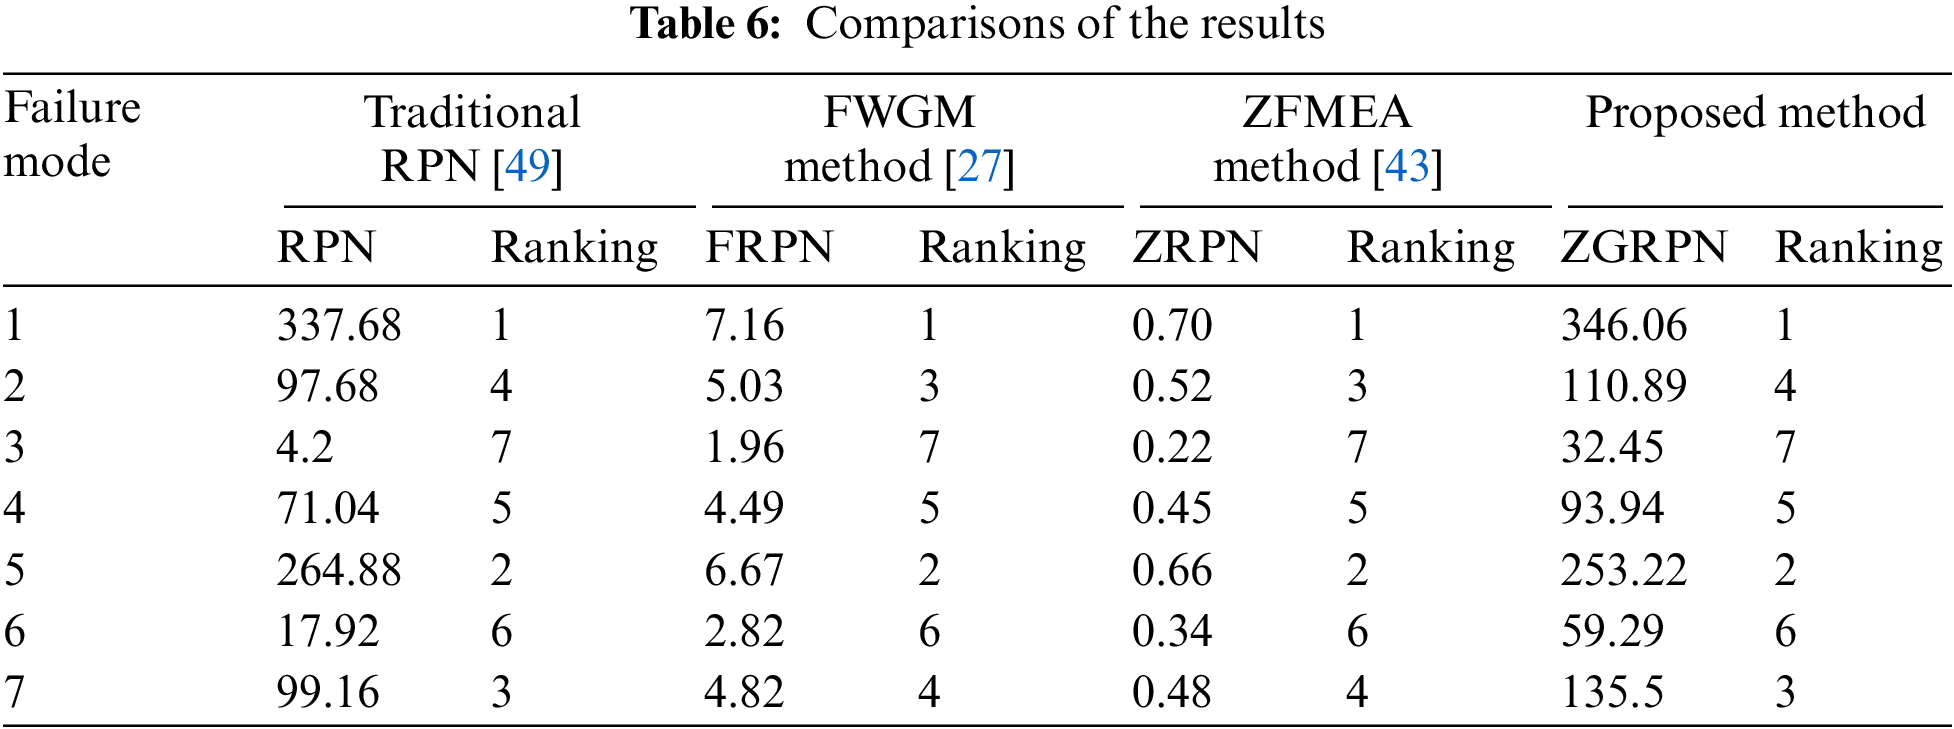
In Table 6, the new proposed method (ZGFMEA method) is compared with the traditional RPN method [49], Wang et al.’s FWGM method [27] and Jiang et al.’s ZFMEA method [43].
It can be seen from Table 6 that the ranking of the failure modes by the proposed method is the same as the traditional RPN. That is
This paper proposed a new method based on Z-numbers and the graded mean integration representation (GMIR) to handle the risk priority ranking problem in FMEA. Z-numbers are used to model the uncertainty of the evaluation results of the risk factors O, S, and D. The graded mean integration representation method is used to help integrate the Z-evaluations. Two examples and the case study are used to illustrate the superiority of the proposed method: the proposed method can handle some situations while other methods cannot, e.g., when part A shows high risk (higher than average rating “5”) for a certain risk factor, if part B (reliability of part
Funding Statement: The work is partially supported by Shanghai Rising-Star Program (Grant No. 21QA1403400), Shanghai Natural Science Foundation (Grant No. 19ZR1420700), Shanghai Key Laboratory of Power Station Automation Technology (Grant No. 13DZ2273800).
Conflicts of Interest: The authors declare that they have no conflicts of interest to report regarding the present study.
References
1. Maio, F. D., Picoco, C., Zio, E., Rychkov, V. (2017). Safety margin sensitivity analysis for model selection in nuclear power plant probabilistic safety assessment. Reliability Engineering and System Safety, 162, 122–138. DOI 10.1016/j.ress.2017.01.020. [Google Scholar] [CrossRef]
2. Narayanan, G. (2021). Probabilistic fatigue model for cast alloys of aero engine applications. International Journal of Structural Integrity, 12(3), 454–469. DOI 10.1108/IJSI-05-2020-0048. [Google Scholar] [CrossRef]
3. Ai, Q., Yuan, Y., Shen, S. L., Wang, H., Huang, X. C. (2020). Investigation on inspection scheduling for the maintenance of tunnel with different degradation modes. Tunnelling and Underground Space Technology, 106, 103589. DOI 10.1016/j.tust.2020.103589. [Google Scholar] [CrossRef]
4. Ai, Q., Yuan, Y., Mahadevan, S., Jiang, X. (2017). Maintenance strategies optimisation of metro tunnels in soft soil. Structure and Infrastructure Engineering, 13(8), 1093–1103. DOI 10.1080/15732479.2016.1243564. [Google Scholar] [CrossRef]
5. Liu, Z., Yu, T., Zhang, L. (2021). Study on the effect of load level and carriageway slab thickness on fatigue performance of concrete T-girder bridges. International Journal of Structural Integrity, 12(2), 284–305. DOI 10.1108/IJSI-02-2020-0015. [Google Scholar] [CrossRef]
6. Nahal, M., Khelif, R. (2021). A finite element model for estimating time-dependent reliability of a corroded pipeline elbow. International Journal of Structural Integrity, 12(2), 306–321. DOI 10.1108/IJSI-02-2020-0021. [Google Scholar] [CrossRef]
7. Yang, Y. J., Wang, G., Zhong, Q., Zhang, H., He, J. et al. (2021). Reliability analysis of gas pipeline with corrosion defect based on finite element method. International Journal of Structural Integrity, 12(6), 854–863. DOI 10.1108/IJSI-11-2020-0112. [Google Scholar] [CrossRef]
8. Meng, D. B., Lv, Z. Y., Yang, S. Y., Wang, H. T., Xie, T. W. et al. (2021). A time-varying mechanical structure reliability analysis method based on performance degradation. Structures, 34, 3247–3256. DOI 10.1016/j.istruc.2021.09.085. [Google Scholar] [CrossRef]
9. Meng, D. B., Yang, S. Q., Zhang, Y., Zhu, S. P. (2019). Structural reliability analysis and uncertainties-based collaborative design and optimization of turbine blades using surrogate model. Fatigue and Fracture of Engineering Materials and Structures, 42(6), 1219–1227. DOI 10.1111/ffe.12906. [Google Scholar] [CrossRef]
10. Liao, D., Zhu, S. P., Keshtegar, B., Qian, G., Wang, Q. (2020). Probabilistic framework for fatigue life assessment of notched components under size effects. International Journal of Mechanical Sciences, 181, 105685. DOI 10.1016/j.ijmecsci.2020.105685. [Google Scholar] [CrossRef]
11. He, J. C., Zhu, S. P., Liao, D., Niu, X. P. (2020). Probabilistic fatigue assessment of notched components under size effect using critical distance theory. Engineering Fracture Mechanics, 235, 107150. DOI 10.1016/j.engfracmech.2020.107150. [Google Scholar] [CrossRef]
12. Gao, X. H., Su, X. Y., Qian, H., Pan, X. L. (2021). Dependence assessment in human reliability analysis under uncertain and dynamic situations. Nuclear Engineering and Technology, 54(3), 948–958. DOI 10.1016/j.net.2021.09.045. [Google Scholar] [CrossRef]
13. Xiao, F. Y. (2021). Caftr: A fuzzy complex event processing method. International Journal of Fuzzy Systems, 24, 1098–1111. DOI 10.1007/s40815–021–01118–6. [Google Scholar] [CrossRef]
14. Xiao, F. Y. (2021). A distance measure for intuitionistic fuzzy sets and its application to pattern classification problems. IEEE Transactions on Systems, Man, and Cybernetics: Systems, 51(6), 3980–3992. DOI 10.1109/TSMC.2019.2958635. [Google Scholar] [CrossRef]
15. Meng, D. B., Wang, H. T., Yang, S. Y., Lv, Z. Y., Hu, Z. G. et al. (2022). Fault analysis of wind power rolling bearing based on EMD feature extraction. Computer Modeling in Engineering & Sciences, 130(1), 543–558. DOI 10.32604/cmes.2022.018123. [Google Scholar] [CrossRef]
16. Meng, D. B., Li, Y., He, C., Guo, J. B., Lv, Z. Y. et al. (2021). Multidisciplinary design for structural integrity using a collaborative optimization method based on adaptive surrogate modelling. Materials and Design, 206, 109789. DOI 10.1016/j.matdes.2021.109789. [Google Scholar] [CrossRef]
17. Meng, D. B., Yang, S. Y., Li, T., Wang, J. P., Yang, H. F. et al. (2022). RBMDO using Gaussian mixture model-based second-order mean-value saddlepoint approximation. Computer Modeling in Engineering & Sciences, 132(2), 553–568. DOI 10.32604/cmes.2022.020756. [Google Scholar] [CrossRef]
18. Stamatis, D. H. (1995). Failure mode and effect analysis: FMEA from theory to execution. Milwaukee, WI: ASQC Quality Press. [Google Scholar]
19. Braglia, M., Frosolini, M., Montanari, R. (2003). Fuzzy TOPSIS approach for failure mode, effects and criticality analysis. Quality and Reliability Engineering International, 19, 425–443. DOI 10.1002/(ISSN)1099-1638. [Google Scholar] [CrossRef]
20. Kim, K. M., Yun, N., Jeon, Y., Lee, D. H., Cho, H. H. (2010). Failure analysis in after shell section of gas turbine combustion liner under base-load operation. Engineering Failure Analysis, 17, 848–856. DOI 10.1016/j.engfailanal.2009.10.018. [Google Scholar] [CrossRef]
21. Liu, H. C., You, J. X., Fan, X. J., Lin, Q. L. (2014). Failure mode and effects analysis using D numbers and grey relational projection method. Expert Systems with Applications, 41, 4670–4679. DOI 10.1016/j.eswa.2014.01.031. [Google Scholar] [CrossRef]
22. Silveira, E., Atxaga, G., Irisarri, A. M. (2010). Failure analysis of two sets of aircraft blades. Engineering Failure Analysis, 17, 641–647. DOI 10.1016/j.engfailanal.2008.10.015. [Google Scholar] [CrossRef]
23. Sawant, A., Dieterich, S., Svatos, M., Keall, P. (2010). Failure mode and effect analysis-based quality assurance for dynamic MLC tracking systems. Medical Physics, 37(12), 646–680. DOI 10.1118/1.3517837. [Google Scholar] [CrossRef]
24. Gargama, H., Chaturvedi, S. K. (2011). Criticality assessment models for failure mode effects and criticality analysis using fuzzy logic. IEEE Transactions on Reliability, 60, 102–110. DOI 10.1109/TR.2010.2103672. [Google Scholar] [CrossRef]
25. Sankar, N. R., Prabhu, B. S. (2001). Modified approach for prioritization of failures in a system failure mode and effects analysis. International Journal of Quality and Reliability Management, 18, 324–336. DOI 10.1108/02656710110383737. [Google Scholar] [CrossRef]
26. Chang, K. H. (2009). Evaluate the orderings of risk for failure problems using a more general RPN methodology. Microelectronics Reliability, 49, 1586–1596. DOI 10.1016/j.microrel.2009.07.057. [Google Scholar] [CrossRef]
27. Wang, Y. M., Chin, K. S., Poon, G. K. K., Yang, J. B. (2009). Risk evaluation in failure mode and effects analysis using fuzzy weighted geometric mean. Expert Systems with Applications, 36, 1195–1207. DOI 10.1016/j.eswa.2007.11.028. [Google Scholar] [CrossRef]
28. Chin, K. S., Wang, Y. M., Poon, G. K. K., Yang, J. B. (2009). Failure mode and effects analysis using a group-based evidential reasoning approach. Computers and Operations Research, 36(6), 1768–1779. DOI 10.1016/j.cor.2008.05.002. [Google Scholar] [CrossRef]
29. Deng, J. X., Deng, Y. (2021). Information volume of fuzzy membership function. International Journal of Computers Communications and Control, 16(1), 4106. DOI 10.15837/ijccc.2021.1.4106. [Google Scholar] [CrossRef]
30. Fei, L. G., Deng, Y. (2020). Multi-criteria decision making in pythagorean fuzzy environment. Applied Intelligence, 50(2), 537–561. DOI 10.1007/s10489-019-01532-2. [Google Scholar] [CrossRef]
31. Zhou, Q. L., Mo, H. M., Deng, Y. (2020). A new divergence measure of pythagorean fuzzy sets based on belief function and its application in medical diagnosis. Mathematics, 8(1), 142. DOI 10.3390/math8010142. [Google Scholar] [CrossRef]
32. Xiao, F. Y. (2021). CEQD: A complex mass function to predict interference effects. IEEE Transactions on Cybernetics, 52(8), 7402–7414. DOI 10.1109/TCYB.2020.3040770. [Google Scholar] [CrossRef]
33. Xiao, F. Y. (2020). EFMCDM: Evidential fuzzy multicriteria decision making based on belief entropy. IEEE Transactions on Fuzzy Systems, 28(7), 1477–1491. DOI 10.1109/TFUZZ.2019.2936368. [Google Scholar] [CrossRef]
34. Yang, J. P., Huang, H. Z., He, L. P., Zhu, S. P., Wen, D. W. (2011). Risk evaluation in failure mode and effects analysis of aircraft turbine rotor blades using dempster-shafer evidence theory under uncertainty. Engineering Failure Analysis, 18, 2084–2092. DOI 10.1016/j.engfailanal.2011.06.014. [Google Scholar] [CrossRef]
35. Su, X. Y., Deng, Y., Mahadevan, S. (2012). An improved method for risk evaluation in failure modes and effects analysis of aircraft engine rotor blades. Engineering Failure Analysis, 26, 164–174. DOI 10.1016/j.engfailanal.2012.07.009. [Google Scholar] [CrossRef]
36. Deng, X. Y., Deng, Y. (2019). D-AHP method with different credibility of information. Soft Computing, 23(2), 683–691. DOI 10.1007/s00500-017-2993-9. [Google Scholar] [CrossRef]
37. Liu, B. Y., Deng, Y. (2019). Risk evaluation in failure mode and effects analysis based on D numbers theory. International Journal of Computers Communications and Control, 14(5), 672–691. DOI 10.15837/ijccc.2019.5.3558. [Google Scholar] [CrossRef]
38. Tian, B., Zheng, H. Y., Yin, L. K., Deng, Y. (2018). Failure mode and effects analysis based on D numbers and TOPSIS. Quality and Reliability Engineering International, 34, 501–515. DOI 10.1002/qre.2268. [Google Scholar] [CrossRef]
39. Zadeh, L. A. (2011). A note on Z-numbers. Information Sciences, 181(14), 2923–2932. DOI 10.1016/j.ins.2011.02.022. [Google Scholar] [CrossRef]
40. Jiang, W., Cao, Y., Deng, X. (2020). A novel Z-network model based on Bayesian network and Z-number. IEEE Transactions on Fuzzy Systems, 28(8), 1585–1599. DOI 10.1109/TFUZZ.91. [Google Scholar] [CrossRef]
41. Zhu, R. N., Li, Y. A., Cheng, R. L., Kang, B. Y. (2022). An improved model in fusing multi-source information based on Z-numbers and POWA operator. Computational and Applied Mathematics, 41(1), 16–44. DOI 10.1007/s40314–021–01722–0. [Google Scholar] [CrossRef]
42. Tian, Y., Liu, L. L., Mi, X. J., Kang, B. Y. (2021). ZSLF: A new soft likelihood function based on Z-numbers and its application in expert decision system. IEEE Transcations on Fuzzy Systems, 29(8), 2283–2295. DOI 10.1109/TFUZZ.2020.2997328. [Google Scholar] [CrossRef]
43. Jiang, W., Xie, C. H., Wei, B. Y., Tang, Y. C. (2017). Failure mode and effects analysis based on Z-numbers. Intelligent Automation and Soft Computing, 24(1), 1–8. DOI 10.1080/10798587.2017.1327158. [Google Scholar] [CrossRef]
44. Dubois, D., Prade, H. (1978). Operations on fuzzy numbers. International Journal of Systems Science, 9, 613–626. DOI 10.1080/00207727808941724. [Google Scholar] [CrossRef]
45. Zadeh, L. A. (1965). Fuzzy sets. Information and Control, 8, 338–353. DOI 10.1016/S0019-9958(65)90241-X. [Google Scholar] [CrossRef]
46. Zadeh, L. A. (1972). A fuzzy-set-theoretic interpretation of linguistic hedges. Cybernetics and Systems, 2(3), 4–34. DOI 10.1080/01969727208542910. [Google Scholar] [CrossRef]
47. Chou, C. C. (2003). The canonical representation of multiplication operation on triangular fuzzy numbers. Computers and Mathematics with Applications, 45, 1601–1610. DOI 10.1016/S0898-1221(03)00139-1. [Google Scholar] [CrossRef]
48. Su, X. Y., Mahadevan, S., Xu, P. D., Deng, Y. (2015). Dependence assessment in human reliability analysis using evidence theory and AHP. Risk Analysis, 35(7), 1296–1316. DOI 10.1111/risa.12347. [Google Scholar] [CrossRef]
49. Pillya, A., Wang, J. (2003). Modified failure mode and effects analysis using approximate reasoning. Reliability Engineering and System Safety, 79(1), 69–85. DOI 10.1016/S0951-8320(02)00179-5. [Google Scholar] [CrossRef]
Cite This Article
 Copyright © 2023 The Author(s). Published by Tech Science Press.
This work is licensed under a Creative Commons Attribution 4.0 International License , which permits unrestricted use, distribution, and reproduction in any medium, provided the original work is properly cited.
 Downloads
 Citation Tools