
 Submit a Paper
 Propose a Special lssue
 Open Access
ARTICLE
Monitoring Study of Long-Term Land Subsidence during Subway Operation in High-Density Urban Areas Based on DInSAR-GPS-GIS Technology and Numerical Simulation
1 College of Civil and Architecture Engineering, Guilin University of Technology, Guilin, 541004, China
2 School of Civil Engineering and Architecture, Zhejiang University of Science and Technology, Hangzhou, 310023, China
3 Hangzhou Metro Group Co., Ltd., Hangzhou, 310003, China
4 China Railway Tunnel Bureau Group Co., Ltd., Guangzhou, 511458, China
5 General Supervision Station of Construction Engineering Quality and Safety of Hangzhou, Hangzhou, 310005, China
* Corresponding Author: Baoping Zou. Email:
(This article belongs to the Special Issue: Mechanical Reliability of Advanced Materials and Structures for Harsh Applications)
Computer Modeling in Engineering & Sciences 2023, 134(2), 1021-1039. https://doi.org/10.32604/cmes.2022.021164
Received 30 December 2021; Accepted 18 March 2022; Issue published 31 August 2022
 View Full Text
 Download PDF
Abstract
During subway operation, various factors will cause long-term land subsidence, such as the vibration subsidence of foundation soil caused by train vibration load, incomplete consolidation deformation of foundation soil during tunnel construction, dense buildings and structures in the vicinity of the tunnel, and changes in water level in the stratum where the tunnel is located. The monitoring of long-term land subsidence during subway operation in high-density urban areas differs from that in low-density urban construction areas. The former is the gathering point of the entire urban population. There are many complex buildings around the project, busy road traffic, high pedestrian flow, and less vegetation cover. Several existing items require monitoring. However, monitoring distance is long, and providing early warning is difficult. This study uses the 2.8 km operation line between Wulin Square station and Ding’an Road station of Hangzhou Subway Line 1 as an example to propose the integrated method of DInSAR-GPS-GIS technology and the key algorithm for long-term land subsidence deformation. Then, it selects multiscene image data to analyze long-term land subsidence of high-density urban areas during subway operation. Results show that long-term land subsidence caused by the operation of Wulin Square station to Ding’an Road station of Hangzhou Subway Line 1 is small, with maximum subsidence of 30.64 mm, and minimum subsidence of 11.45 mm, and average subsidence ranging from 19.27 to 21.33 mm. And FLAC3D software was used to verify the monitoring situation, using the geological conditions of the soil in the study area and the tunnel profile to simulate the settlement under vehicle load, and the simulation results tended to be consistent with the monitoring situation.Keywords
Subways constructed in soft soil areas, such as Shanghai and Hangzhou in China, are currently in operation. By the end of 2020, 45 cities in mainland China have opened subway lines with a total length of 7978.19 km [1]. The urban distribution of subway operation indicates that nearly 90% of the operating mileage is concentrated in the high-density urban areas of Beijing–Tianjin–Hebei, Yangtze River Delta, and Pearl River Delta city clusters. After a certain period of subway operation, some factors will cause long-term land subsidence, such as the vibration subsidence of foundation soil caused by train vibration load, incomplete consolidation deformation of foundation soil during tunnel construction, dense buildings (structures) in the vicinity of the tunnel, and changes in water level in the stratum where the tunnel is located [2]. For example, the long-term subsidence increment of Shanghai Dapu Road Cross River Tunnel after 16 years of operation reaches 120 mm, and the subsidence caused by the construction of the Grimsby tunnel took 10 years to reach equilibrium [3]. Therefore, the occurrence of long-term land subsidence is a relatively slow process, but the accumulation of subsidence over a long period will have an adverse impact on the normal operation and safe usage of a subway, such as causing tunnel leakage, tunnel cracking, and damage, and endangering adjacent buildings (structures), pile foundations, and underground pipelines. Moreover, it will seriously affect the smoothness of a track, increase the interaction force of the wheel-rail system, increase the vibration of the tunnel structure, affect the vibration and noise of buildings close to the subway tunnel or above it, and affect the ride comfort of passengers [4].
Long-term land subsidence monitoring in high-density urban areas during subway operation differs from those in low-density urban construction areas, urban suburbs, and other areas. A high-density urban area is a commercial, financial and trade, entertainment, and cultural center of a city. It is also the gathering point of the urban population. Many existing items require monitoring, including the main structure of a foundation pit, and buildings and structures along with subways, pipelines, and bridges [2]. However, the characteristics of the linear distribution of a subway exhibit a long monitoring distance and difficulty in providing early warning. If traditional urban land subsidence monitoring methods, such as GPS, precise leveling observation, and underground fine observation methods (bedrock marks, and layering marks) are adopted, then a considerable amount of time, labor, material, and financial resources will be consumed; observation points will be sparsely distributed; the operation cycle will be long, and labor intensity will be high. These traditional methods cannot be used for all-weather observation. Simultaneously, they will have difficulty in accurately determining the deformation influence range of regional land subsidence. However, existing early warning systems for land subsidence during subway operation exhibit limitations, such as considering only cumulative subsidence and subsidence rate when characterizing subsidence, which cannot reflect the three-dimensional distribution of long-term land subsidence. Moreover, a clear long-term land subsidence classification and early warning index system are lacking in the relevant norms of China’s subway industry, which causes certain difficulties in the prevention and control of land subsidence disasters in high-density urban areas. Therefore, a scientific, efficient, and comprehensive high-tech monitoring method is urgently required to conduct a long-term land subsidence study during subway operation; to provide decision-making information for the prevention, control, and early warning of long-term land subsidence disasters in high-density urban areas during subway operation; and to effectively prevent and control long-term land subsidence disasters in cities.
Given the limitation in the period, most current domestic and foreign studies on long-term land subsidence during subway operation have focused on body subsidence and dynamic response caused by train vibration and the prediction of long-term land subsidence. In terms of body subsidence and dynamic response, Leclerc et al. [5] explored the use of submarine coral reefs as a record of long-term coastal vertical motion to determine the deformation rate and discuss its origins. Chen et al. [6] studied the long-term deformation in lava fields emplaced between 1998 and 2007 at Piton de la Fournaise, and conducted an in-depth investigation over the influence of post-emplacement lava subsidence processes on the instability of the Eastern Flank. Tang et al. [7] systematically studied the dynamic response of soft soils in high-speed rail foundations. Shi et al. [8] analyzed the evolution law of cumulative plastic dynamic strain and established the prediction model of cumulative plastic strain based on the dynamic triaxial tests of intensely and moderately weathered argillaceous siltstone. Di et al. [9] analyzed the settlement differences of five subways in the Yangtze River Delta region on soft deposits and proposed measures to reduce settlement differences. Qiu et al. [10] used finite element software to simulate the consolidation behavior of loess and found that the long-term settlement results obtained from the simulation matched the results of field monitoring. Huang et al. [11] used finite element simulation software, through the soil-water full coupling dynamic finite element method, to analyze the settlement of saturated clay soil under trainload. Tan et al. [12] conducted a monitoring study on the deformation of subway tunnels and found that there is variability in the amount of settlement in different areas. Di et al. [13] conducted a study on the long-term settlement of Nanjing Metro Line 10 and found that the maximum settlement of Metro Line 10 was 240 mm within 5.75 years of completion. However, the a forementioned studies rarely involved long-term land subsidence problems caused by train reciprocating vibrations in tunnels, monitoring methods, and early warning systems for long-term land subsidence in high-density urban areas during subway operation remain lacking.
In recent years, interferometric synthetic aperture radar (InSAR) technology has been increasingly applied to the topographic survey. This technology exhibits the following characteristics: noncontact survey, unnecessary monitoring of control network setting, sub-millimeter accuracy, high efficiency, low cost, wide-coverage, no weather influence, and high spatial resolution. Therefore, InSAR has also been applied to the monitoring of land subsidence during subway operations. Fadhillah et al. [14] used the InSAR technique to generate deformation time series maps using the Stamfs method to investigate subsidence in four areas. Shi et al. [15] used the SBAS-InSAR technique to analyze subsidence in Xi’an and to predict land subsidence. Hu et al. [16] used the SBAS-InSAR technique to analyze the subsidence in the Fuzhou area and found that the SBAS-InSAR technique is a more effective monitoring tool in the construction and maintenance of the city. Given that InSAR technology exhibits the characteristics of all-weather observation and high spatial resolution, its satellite archived data can be used to monitor the historical long-term land subsidence characteristics of high-density urban areas during subway operation, monitor ground deformation at any time in the present and in the future, and overcome the inability of the traditional level setting and GPS monitoring network to obtain long-term land subsidence historical deformation information. However, this technology is highly sensitive to atmospheric errors, remote sensing satellite orbit errors, surface conditions, and temporal irrelevance. In addition, InSAR images lack natural surface features, which causes difficulty in their application. By contrast, GPS technology belongs to point positioning. It has a high time resolution and can perform the continuous observation. Therefore, the two technologies, InSAR and GPS, are complementary. GIS technology can collect, manage, operate, analyze, simulate, and display spatial data. It can be used to interpret and analyze the results of InSAR-GPS comprehensively and spatially. Therefore, the integration of InSAR-GPS-GIS technology to monitor long-term land subsidence in high-density urban areas during subway operation can overcome the limitations of a single technology application, quantitatively study long-term land subsidence, and monitor land subsidence changes at the sub-millimeter level in real-time during subway operation.
In this study, the 2.8 km operating line from Wulin Square station to Ding’an Road station of Hangzhou Metro Line 1 is used as an example to analyze the long-term subsidence in high-density urban areas during metro operation by InSAR-GPS-GIS technology.
2 DInSAR-GPS-GIS Integrated Method
2.1 Sentinel-1A Satellite Data
With a total length of 2.8 km, the region from Wulin Square station to Ding’an Road station of Hangzhou Subway Line 1 is selected as the research area, including Wulin Square station, Fengqi Road station, Longxiangqiao station, and Ding’an Road station. The study area is the largest commercial street in Hangzhou. Yan’an Road connects the three largest business circles of Hangzhou (Wulin, Hubin, and Wushan Business Circles) in series, and the population of the study area is large. Many important buildings, such as Hangzhou Tower, Yintai Wulin Department Store, and Hangzhou Department Store, are distributed on both sides of the road. A total of 20 scenes Sentinel-1A satellite data are downloaded for processing in the research area. For InSAR techniques, the atmospheric delay benefit is one of the most significant error sources and cannot be completely eliminated, so various researchers find ways to reduce the errors. This study uses GPS technology for precise coordinates and multi-scene image data for error reduction.
2.2 Digital Elevation Model (DEM) Data
The DEM data used in this study are obtained from Shuttle Radar Topography Mission (SRTM) 90 m data. The converted DEM data in standard format are shown in Fig. 1.
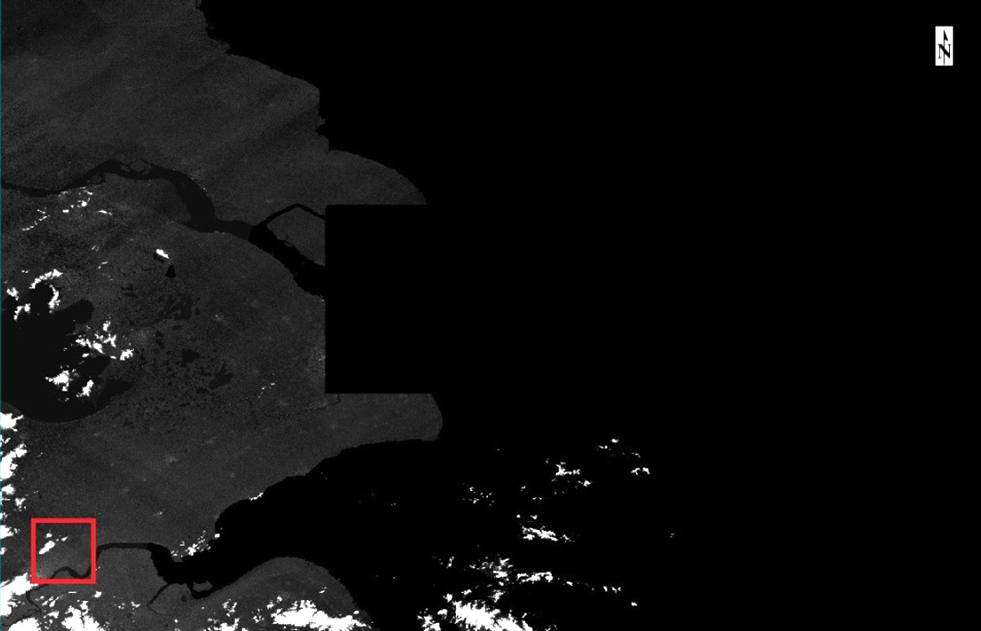
Figure 1: DEM data of the study area
2.3 Satellite Precision Orbit Data (POD)
POD Precise Orbit Ephemerides data are adopted to remove systematic errors caused by orbital errors. Sentinel-1 satellite POD are imaged into time format file S1A_OPER_AUX_POEORB_OPOD_20170628T121621_V20170607T225942_20170609T005942. The empirical orthogonal function (EOF) indicates that the imaging satellite is S1A, the release date of POD is June 28, 2017, and the data imaging date is June 08, 2017.
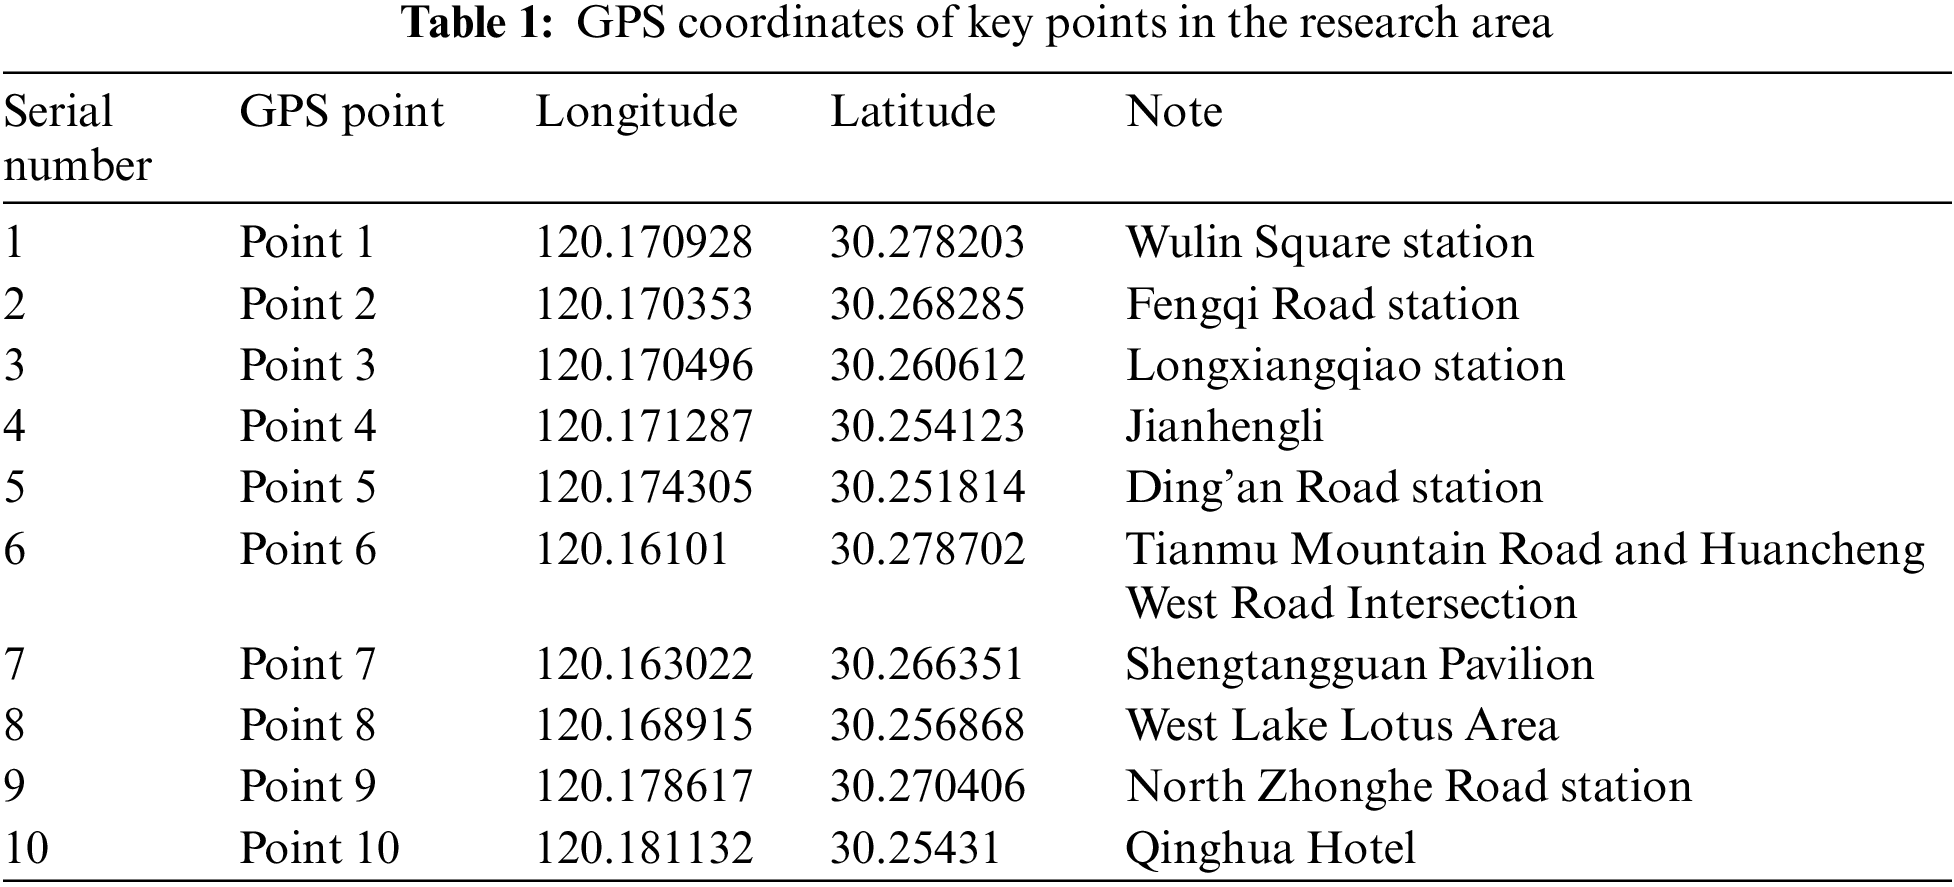
2.4 GPS Control Point in Research Area
Combined with the research area, the key coordinates of the region from Wulin Square station to Ding’an Road station are located, and the coordinates of the key points are obtained, as shown in Fig. 2 and Table 1. The soil type of the study area mainly includes clayey silt, mucky clay, very soft silty clay, and silty clay. The surface water in the project area has a great influence on the construction of adjacent stations and tunnels.
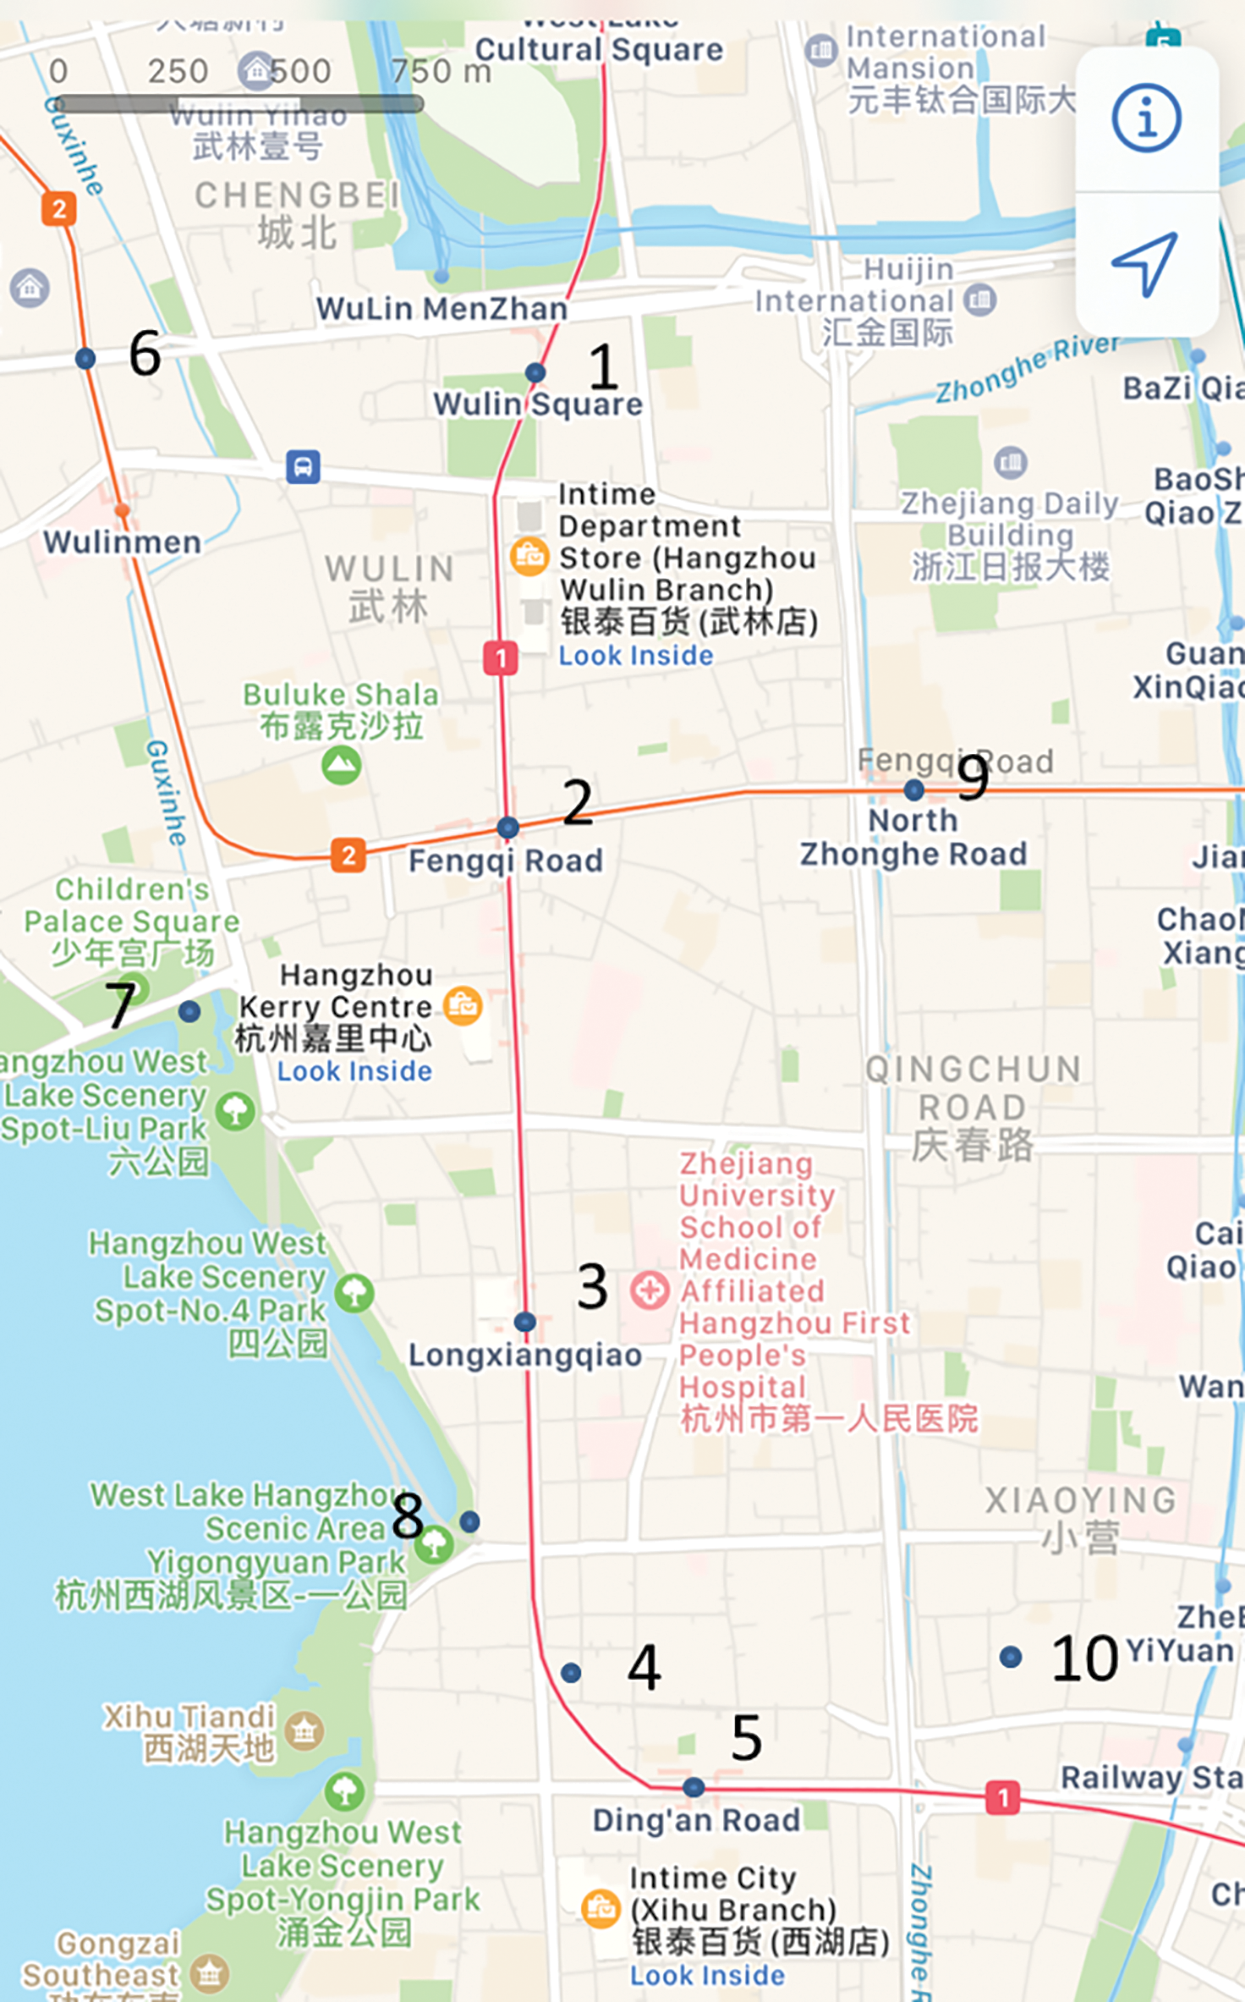
Figure 2: Locations of key points in the research area
2.5 Data Processing Based on ArcGIS
The ArcMap component of ArcGIS Desktop is used for data processing to import experimental data and display them inline chart form through ArcMap software to illustrate the law of long-term land subsidence changing with time.
2.6 DInSAR-GPS-GIS Integrated Method
The DInSAR-GPS-GIS integrated method is primarily based on the multi-view integration platform, as shown in Fig. 3.
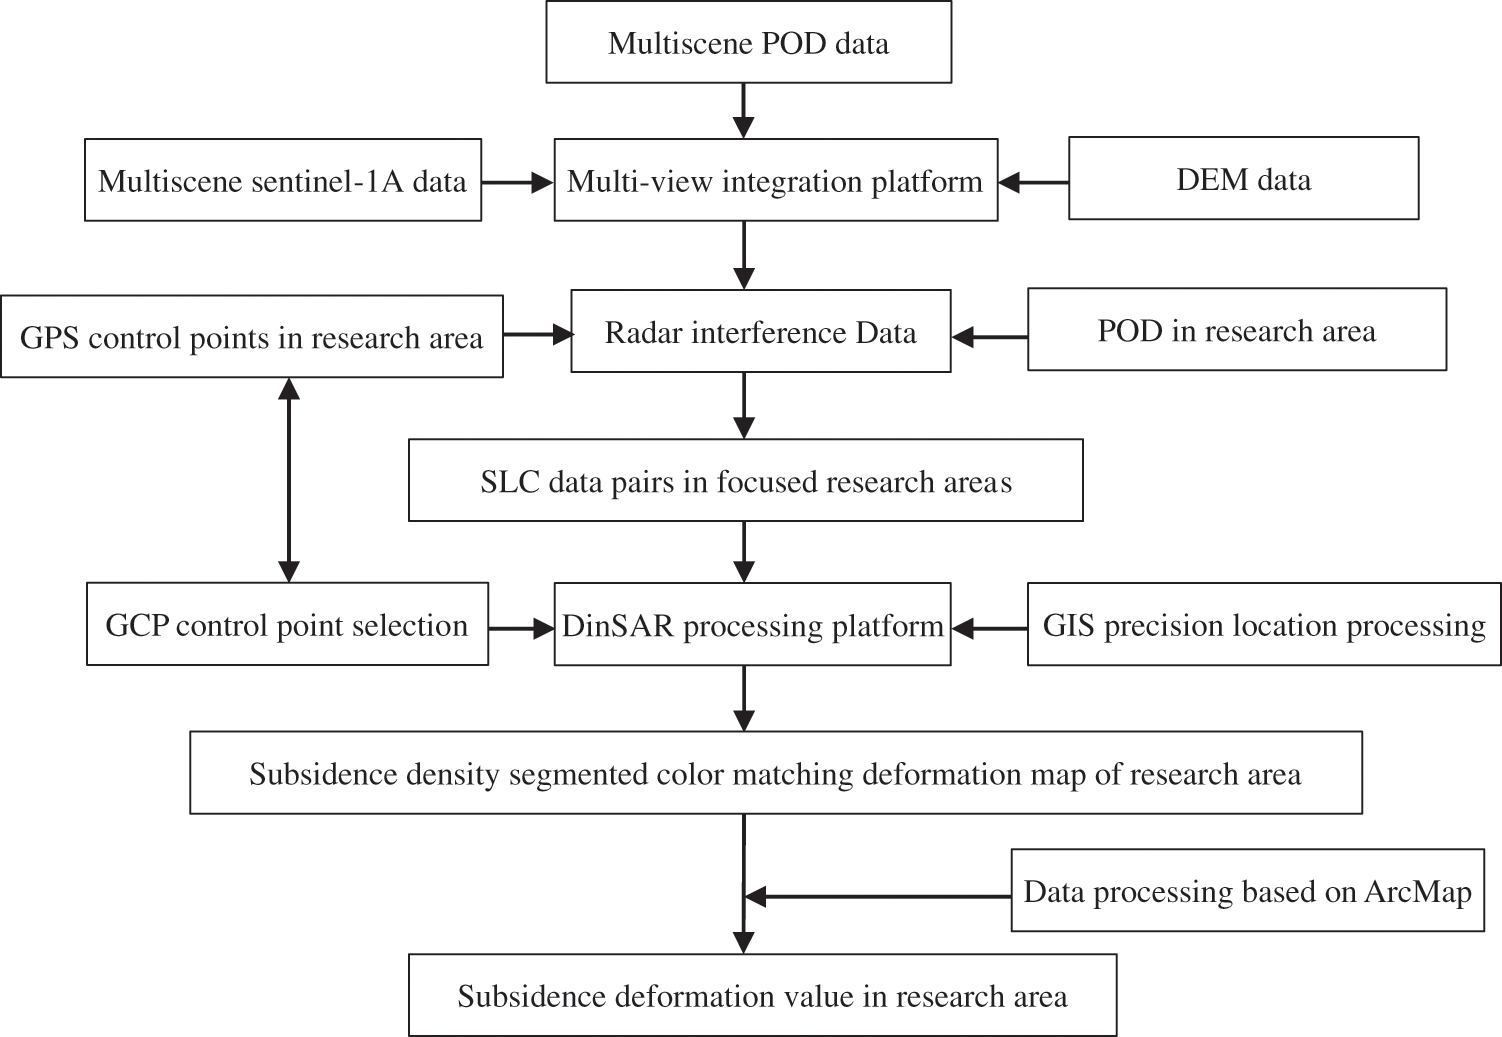
Figure 3: DInSAR-GPS-GIS integrated process
3 Key Algorithm of DInSAR Deformation
3.1 DInSAR Deformation Processing Flow
The flowchart of DInSAR deformation processing is shown in Fig. 4.
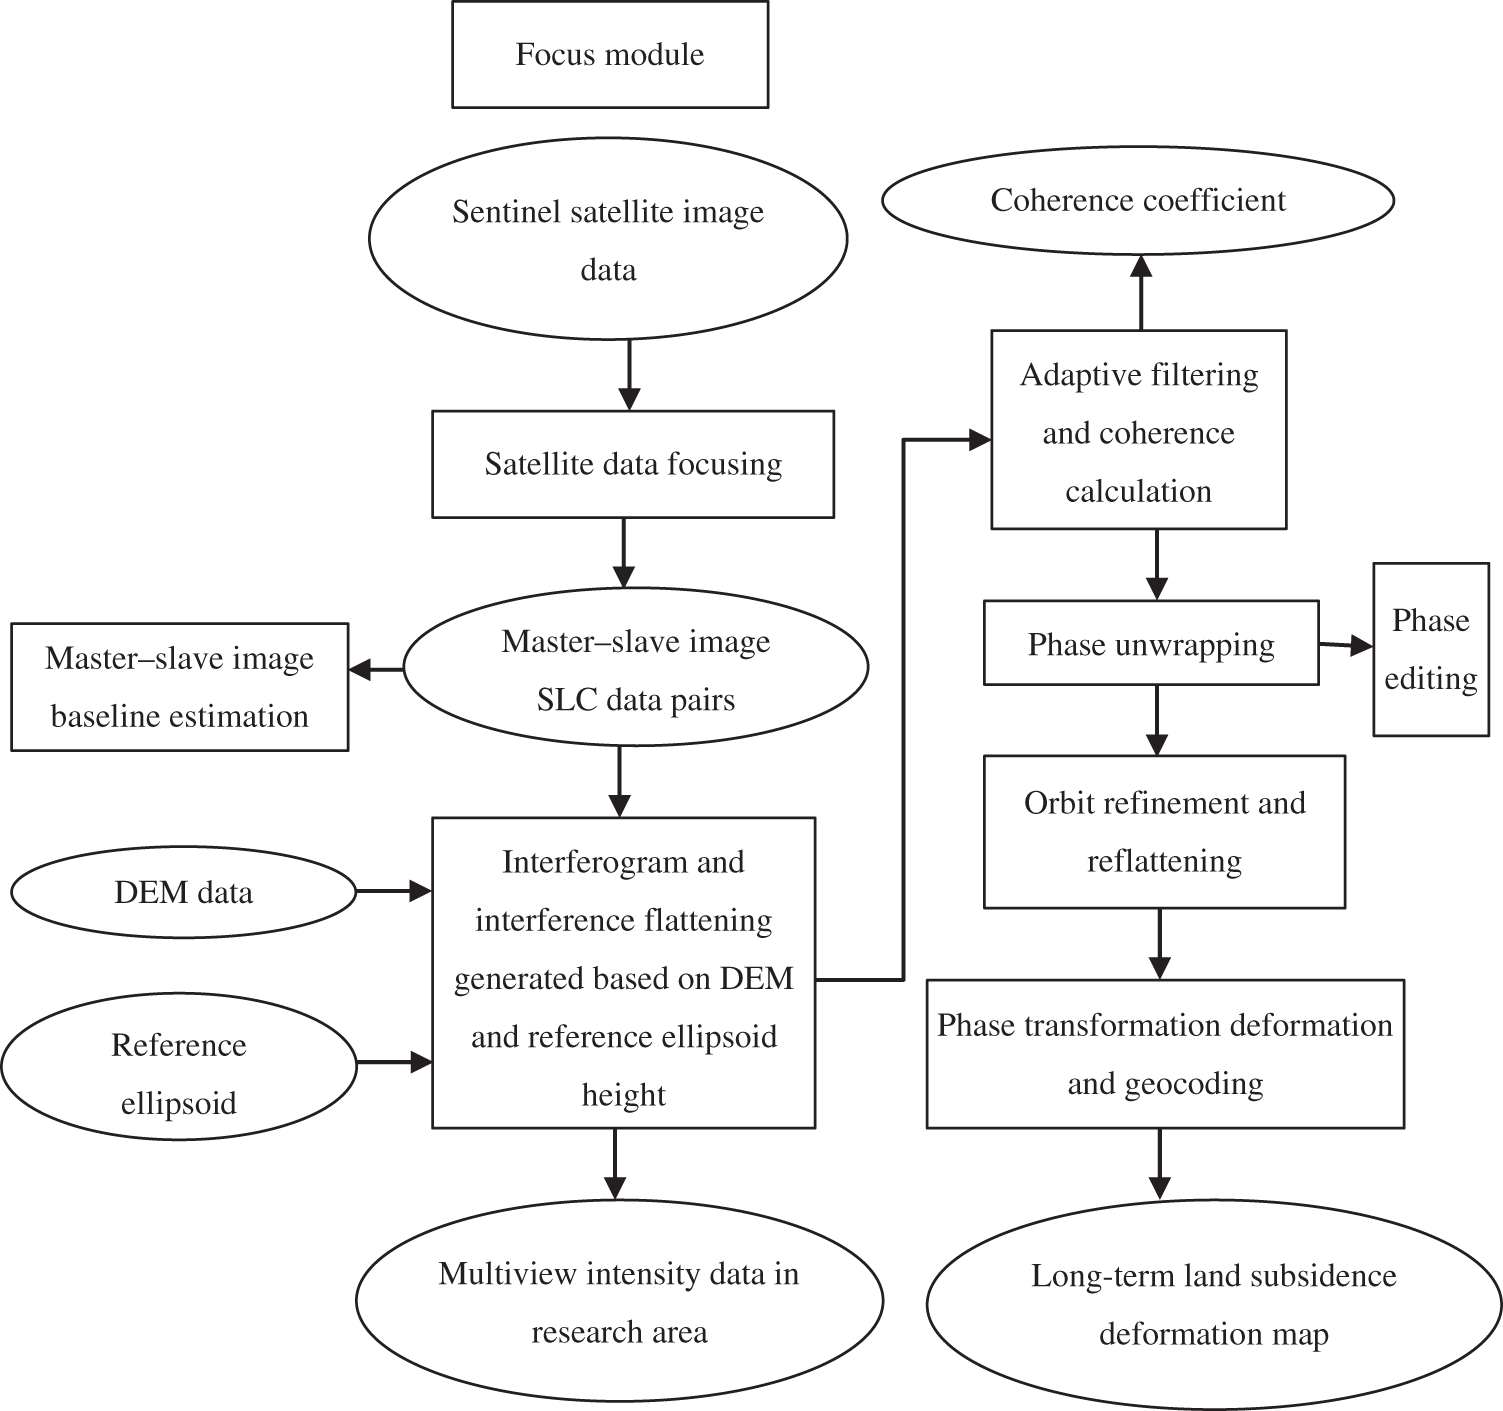
Figure 4: Flowchart of DInSAR deformation processing
3.2 Intensity Data of the Entire Scene Image
The obtained satellite data of Sentinel-1A for two scenes are used as an example, namely 20160601 and 20161128. 20160601 satellite data are selected as master images, whereas 20161128 satellite data are selected as slave images. The intensity map of the entire scene image in the research area is presented in Fig. 5.
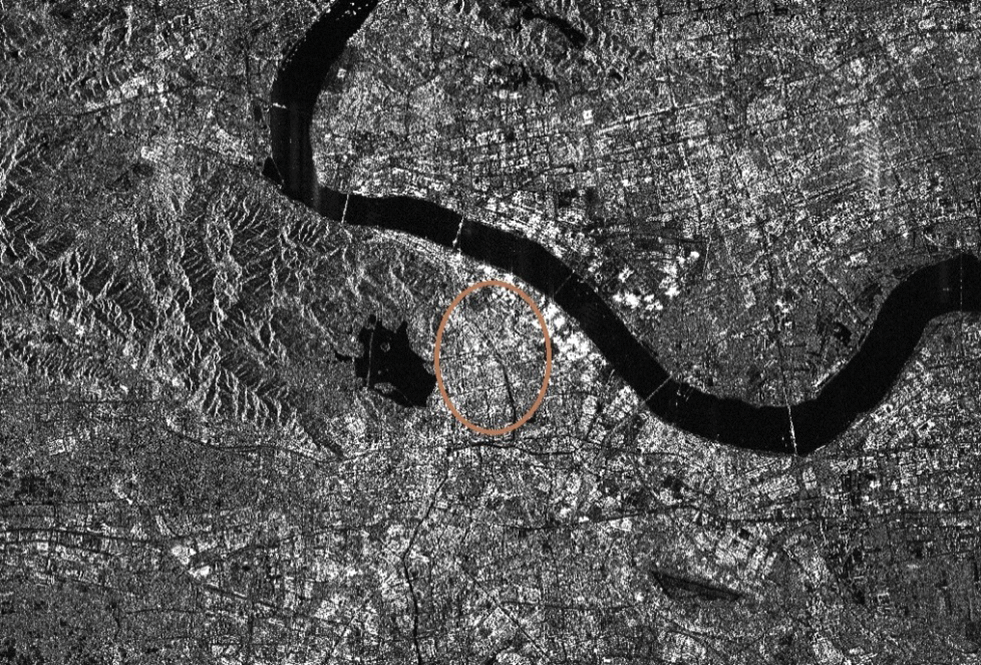
Figure 5: Intensity map of the entire scene image in the research area
3.3 Baseline Estimation Analysis
The theoretical height and theoretical deformation accuracy of baseline estimation in the research area are shown in Figs. 6 and 7, respectively.
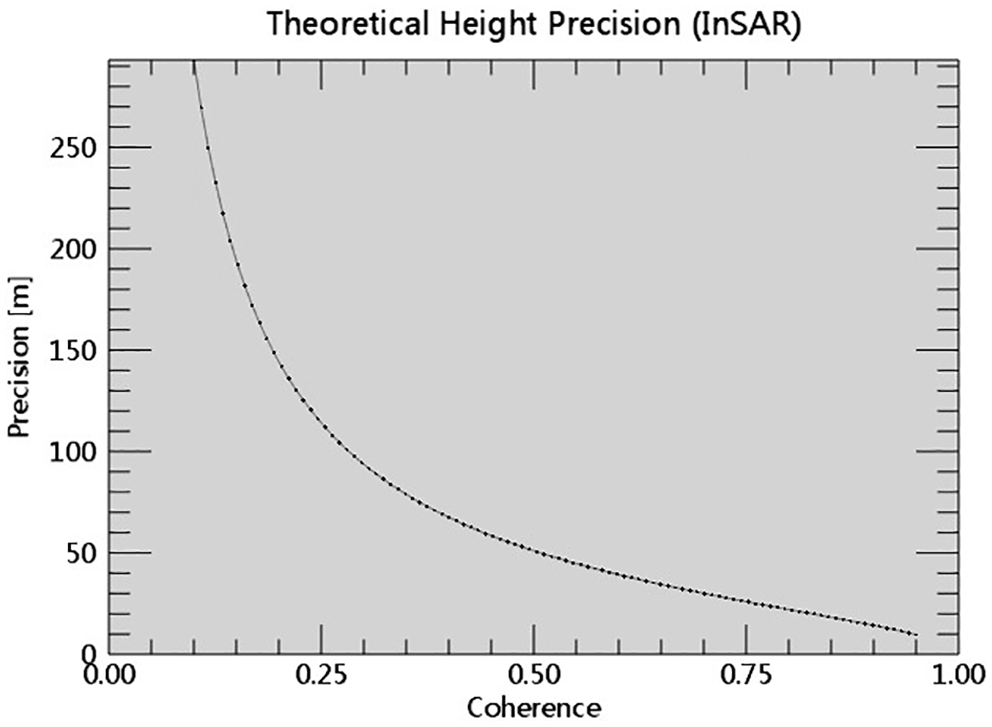
Figure 6: Theoretical height accuracy
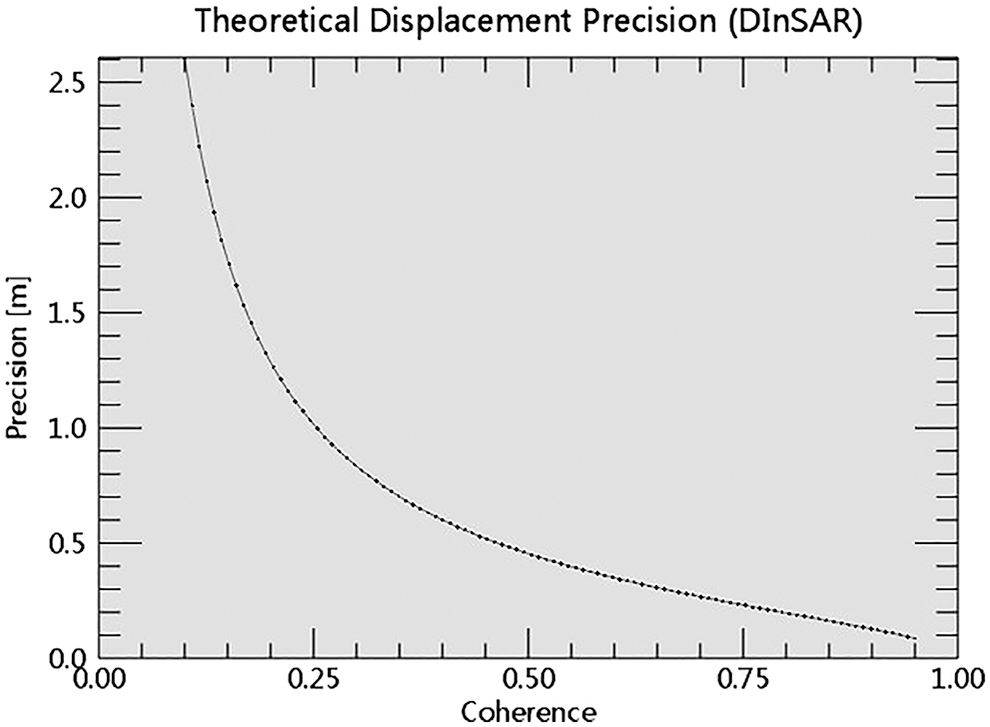
Figure 7: Theoretical deformation accuracy
The baseline estimation results in the research area are as follows:
Normal Baseline (m) = 59.401, Critical Baseline min-max (m) = [−6452.217]−[6452.217], Range Shift (pixels) = 2.734, Azimuth Shift (pixels) = −8.031, Slant Range Distance (m) = 879019.561, Absolute Time Baseline (Days) = 180, Doppler Centroid diff. (Hz) = −31.079, Critical min-max (Hz) = [−486.486]−[486.486], 2π Ambiguity height (InSAR) (m) = 261.718, 2π Ambiguity displacement (DInSAR) (m) = 0.028, 1 Pixel Shift Ambiguity height (Stereo Radargrammetry) (m) = 21984.307, 1 Pixel Shift Ambiguity displacement (Amplitude Tracking) (m) = 2.330, Master Incidence Angle = 39.623, Absolute Incidence Angle difference = 0.004.
The baseline estimation results indicate that the spatial baseline of the two-scene master-slave satellite data is 59.401 m, which is considerably less than the critical baseline of 6452.217 m. It satisfies the accuracy condition. The time baseline is 180 days. The surface deformation represented by a phase change period during DInSAR processing is 0.028 m.
Image alignment is the first step that needs to be performed in InSAR data processing. This process requires that the same pair of pixel points of the two images correspond to the same pixel cell on the ground according to the coordinate mapping relationship between the corresponding points of the two images, and the complex values corresponding to the corresponding image elements in the two images are multiplied by the complex values, and the result of the two-phase conjugate multiplication is the interferogram. The selected polarization mode is VV, Range Looks is 5, Azimuth Looks is 1, Grid Size for Suggested Looks is 20, and Coregistration with DEM is True. The Global parameter sets Make TIFF True. The obtained interferogram after flattening in the research area is shown in Fig. 8 (One color cycle in the interferogram represents a 2π change in phase: red-yellow-blue-green is a complete 2π change cycle), and the master image intensity map is shown in Fig. 9.
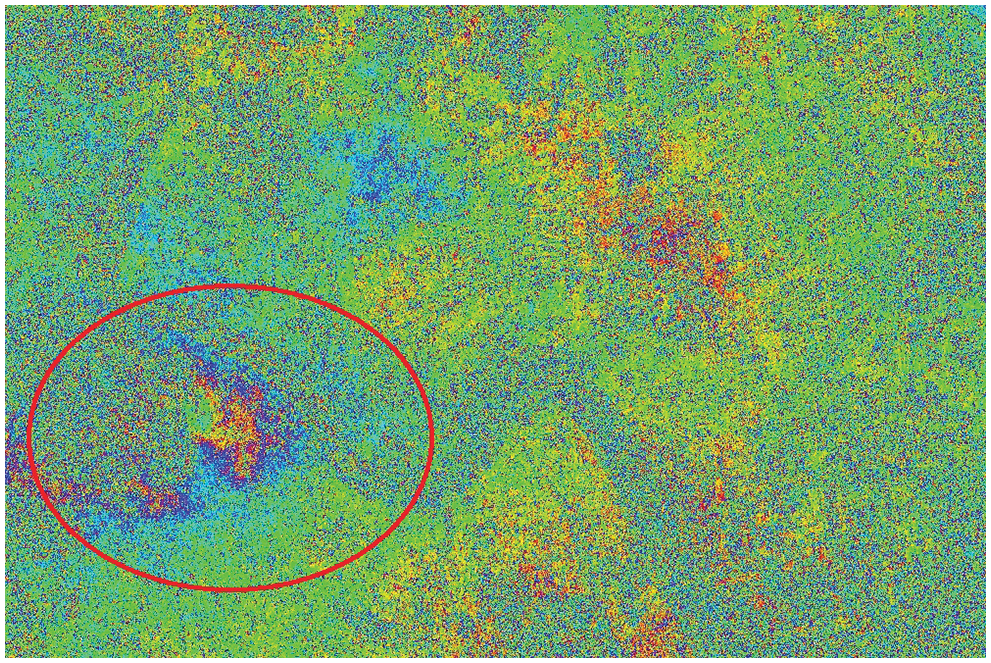
Figure 8: Interferogram after flattening in the research area
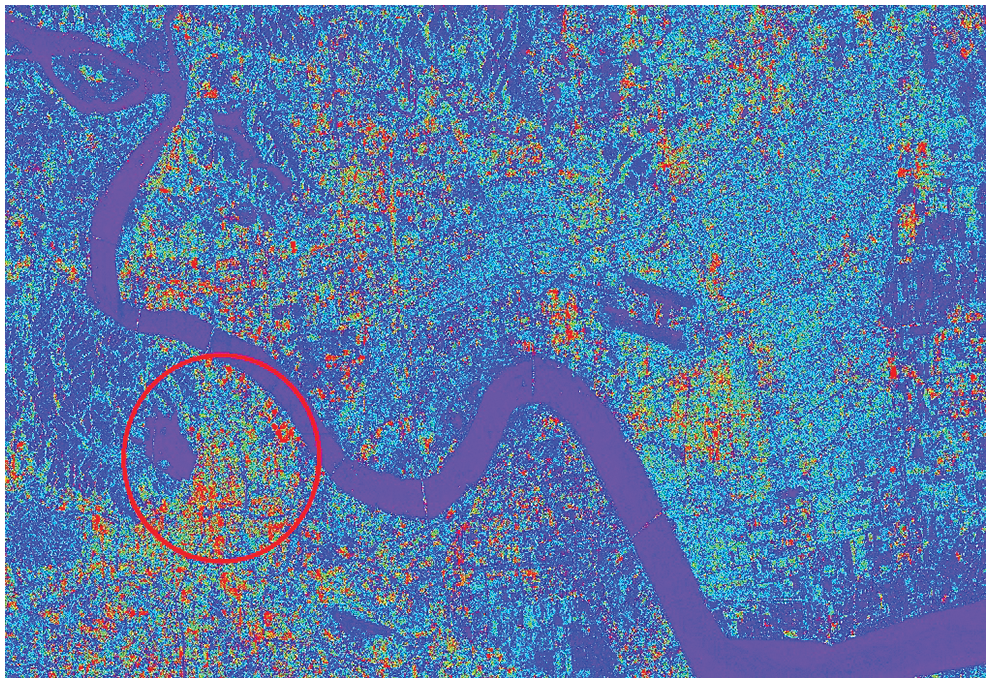
Figure 9: Master image intensity map after flattening in the research area
3.5 Filtering and Coherence Calculation
Three filtering methods, namely, adaptive, boxcar, and Goldstein, are available. Considering that the adaptive method is suitable for high-resolution data, the boxcar method uses the frequency of local interference fringes to optimize the filter and maintain small interference fringes as much as possible. Despite the variability of the filter in the Goldstein method, it improves the definition of interference fringes in the research area and reduces the decorrelation noise caused by spatial or temporal baselines. Therefore, the Goldstein method is selected to process the filtering of the research area, and the interferogram INTERF_out _fint (as shown in Fig. 10) and the coherence coefficient map INTERF_out _cc (as shown in Fig. 11) after filtering in the research area.
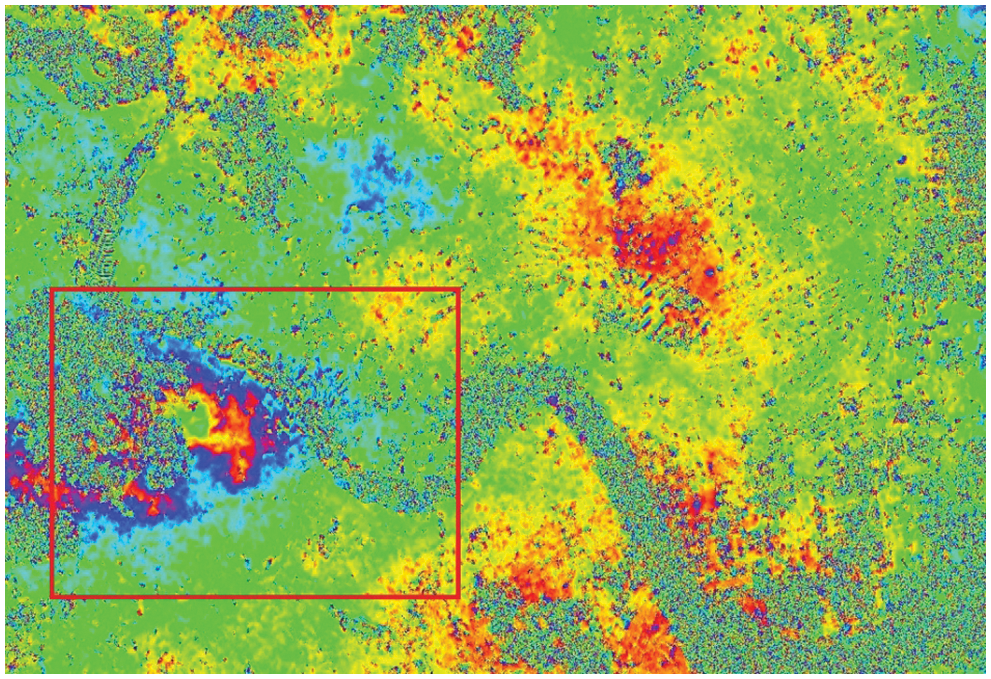
Figure 10: Interferogram after filtering in the research area
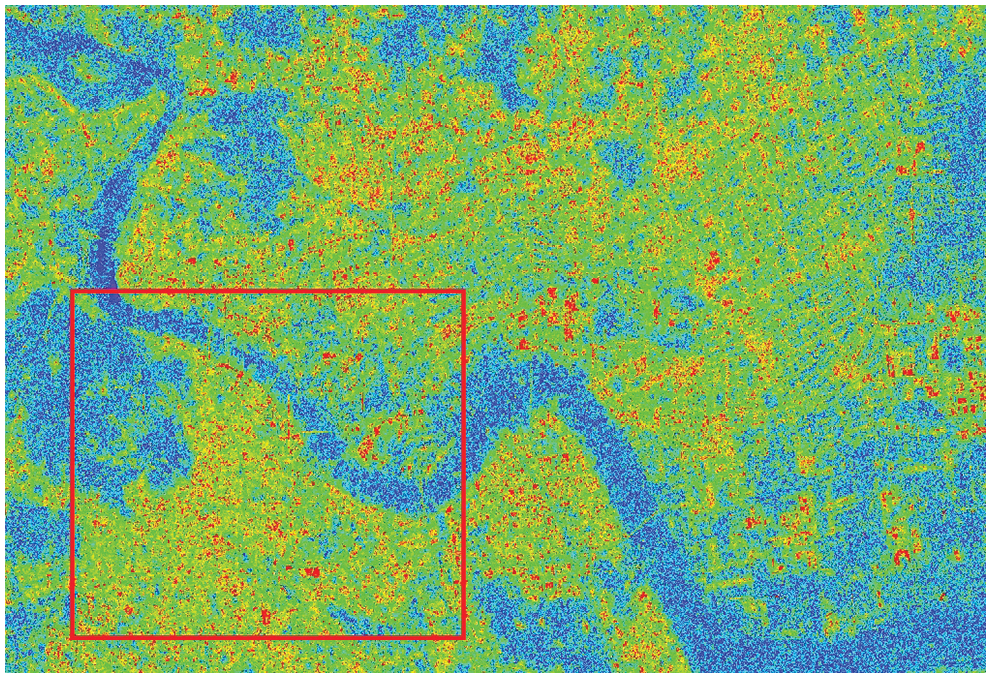
Figure 11: Coherence coefficient map in the research area
Phase change takes 2π as its period. As long as the phase change exceeds 2π, the phase will start and the cycle will begin again. Therefore, phase unwrapping involves unwrapping the phase after flattening and filtering, such that it corresponds to the linearly changing terrain information, and solving the 2π ambiguity problem. Three types of unwrapping methods, namely, region growing, minimum cost flow (MCF), and Delaunay MCF, are available. The region growing method does not set an extremely high coherence threshold to leave adequate free growth space. The phase mutation part exists as an unwrapped island on the unwrapped image. This method reduces the errors caused by phase mutation. The MCF method can achieve better results than the region growing method when unwrapping is difficult due to a large area of low coherence or other factors that restrict growth. This method uses a square grid, considers all the pixels in the image, and masks the pixels whose coherence is less than the threshold. The Delaunay MCF method is different from the MCF method because it does not consider all the pixels in an image but only those whose coherence is greater than the threshold value. Moreover, it uses Droney triangular grids instead of square grids. Therefore, the MCF method is selected as the unwrapping method, 1.0 is selected for the unwrapping decomposition level, and 0.2 is selected for the unwrapping coherence threshold. The phase unwrapping results in INTERF_out_upha are shown in Fig. 12.
Figure 12: Phase unwrapping results
3.7 Selection of Ground Control Points (GCPs)
GCPs should be selected away from the deformation area, phase jump area with unwrapping errors, and residual terrain phase. When dealing with surface deformation caused by DInSAR, a GCP can be selected at a position far from the deformation area in the absence of orbital errors. If orbital errors occur, then multiple GCPs should be considered as stable reference points from which the error phase can be calculated and removed by the program. The selection of GCPs is shown in Fig. 13.
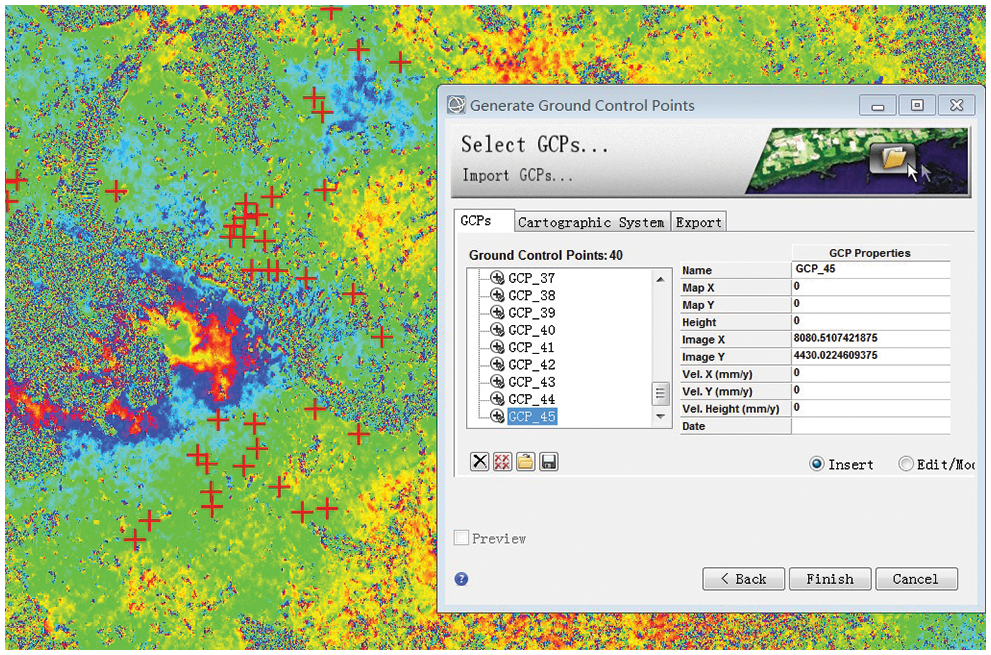
Figure 13: Selection of GCPs
3.8 Refinement and Reflattening
Refinement and reflattening involve the calculation of orbit refinement and phase shift, the elimination of possible slope phase, and the correction of satellite orbit and phase shift. Polynomial refinement is selected as the refinement method. The algorithm is robust and can be used even when the baseline is small. The Refinement Res Phase Poly Degree selects 3, which is the number of polynomials used to estimate the phase slope in the deflattening process. If the number of control point inputs is small, then the number of times will automatically decrease. The number 3 indicates that the phase slope with a constant phase shift in the range and azimuth directions will be corrected.
After the refinement and reflattening process, the optimized results are as follows:
ESTIMATE A RESIDUAL RAMP
Points selected by the user = 40, Valid points found = 40, Extra constrains = 2, Polynomial Degree choose = 3, Polynomial Type: = k0 + k1 * rg + k2 * az, Polynomial Coefficients (radians): k0 = 24.7173808990, k1 = 0.0006048432, k2 = −0.0046972519, Root Mean Square error (m) = 63.2093312825, Mean difference after Remove Residual refinement (rad) = −0.1101105943, Standard Deviation after Remove Residual refinement (rad) = 1.5099697025.
The interferogram INTERF_out_reflat_fint after reflattening is shown in Fig. 14, and the unwrapping results in INTERF_out_reflat_upha after reflattening are presented in Fig. 15.
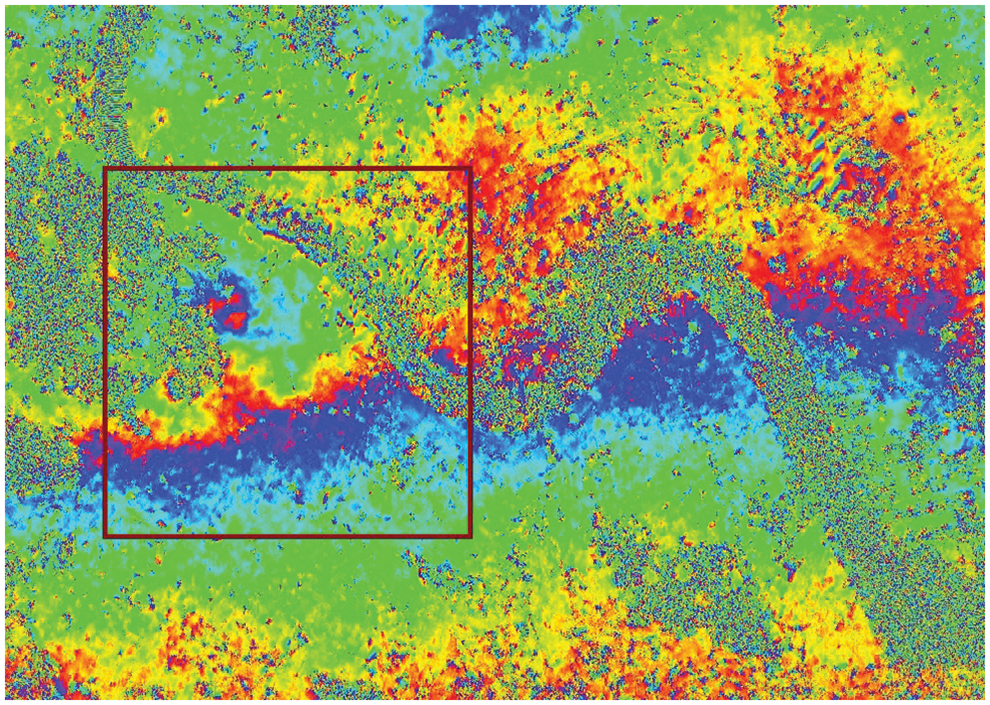
Figure 14: Interferogram after reflattening in the research area
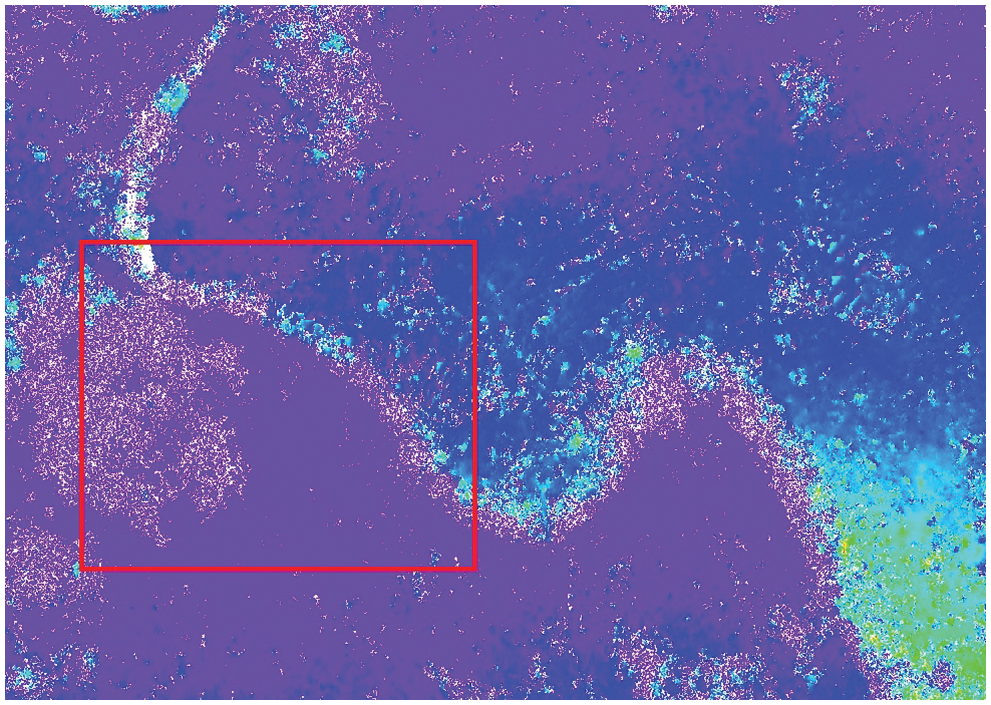
Figure 15: Unwrapping results after reflattening in the research area
3.9 Phase-to-Displacement Conversion and Geocoding
Phase-to-displacement conversion and geocoding combine the absolutely calibrated and unwrapped phases with the composite phase and convert them into deformation data and geocode them into a mapping coordinate system. By default, the system obtains deformation in the LOS direction. The product coherence threshold is 0.2, and the phase whose coherence is greater than this value is changed to the deformed value. Vertical displacement selects False, and the deformation in the vertical direction is not calculated. Slope displacement selects False, and the deformation in the slope direction is not calculated. Displacement custom direction selects False. Azimuth angle selects 0. The inclination angle selects 0. X dimension (m) selects 20. Y dimension (m) selects 20. Dummy removal selects True to mask the areas outside the image.
The deformation in the LOS direction is shown in Fig. 16. The coherency coefficient map of geocoding _slc_out_disp_cc_geo is shown in Fig. 17.
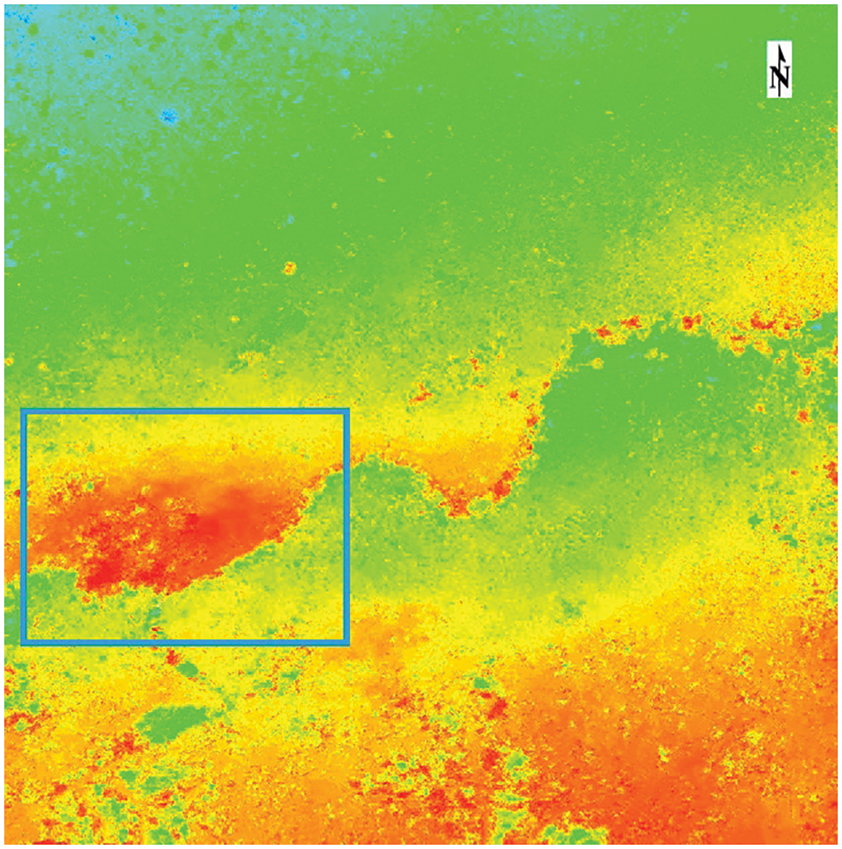
Figure 16: Deformation in the LOS direction in the research area
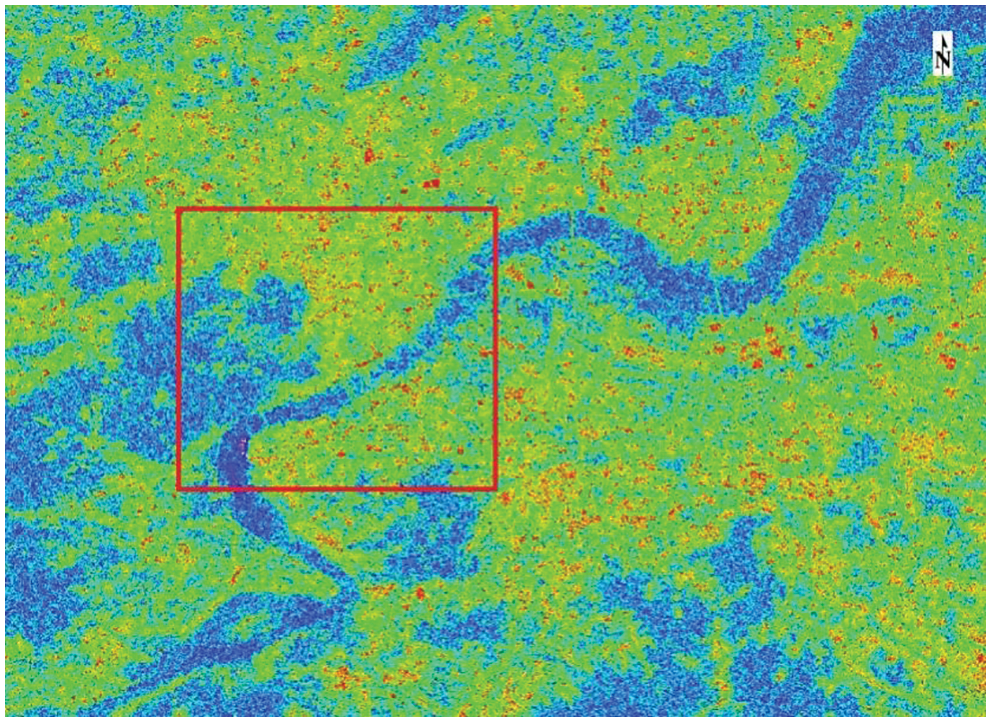
Figure 17: Coherency coefficient map of geocoding in the research area
4 Dynamic Analysis of Long-Term Land Subsidence during Subway Operation
20160601 Satellite Data Analysis
The deformation in the LOS direction _slc_out_disp is shown in Fig. 18.
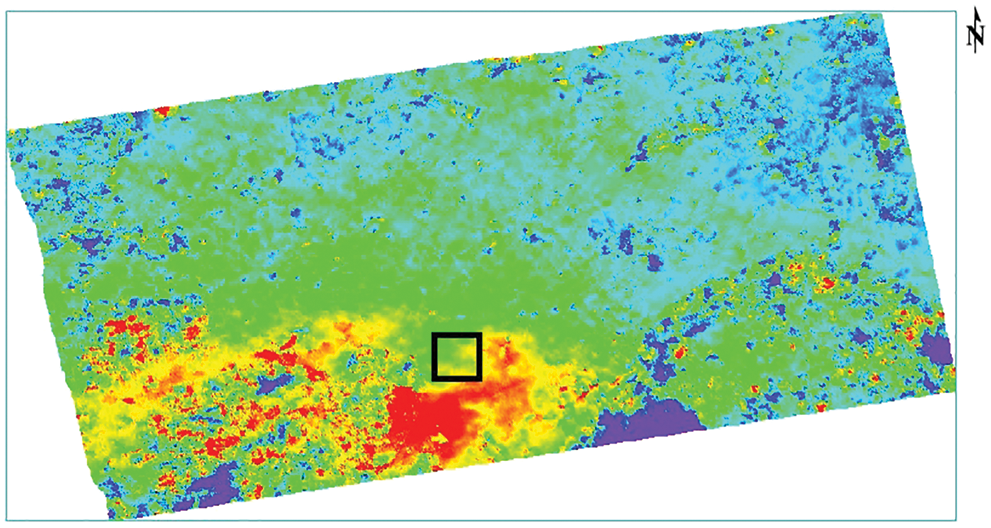
Figure 18: Deformation in the LOS direction in the research area
The comparison between satellite DEM and deformation area in the research area is presented in Fig. 19, and the deformation value in the research area is provided in Fig. 20. The satellite image data on June 01, 2016 indicate that the maximum subsidence is 27.76 mm, the minimum subsidence is 14.71 mm, and the average subsidence is 21.33 mm in the research area from Wulin Square station to Ding’an Road station of Hangzhou Subway Line 1.
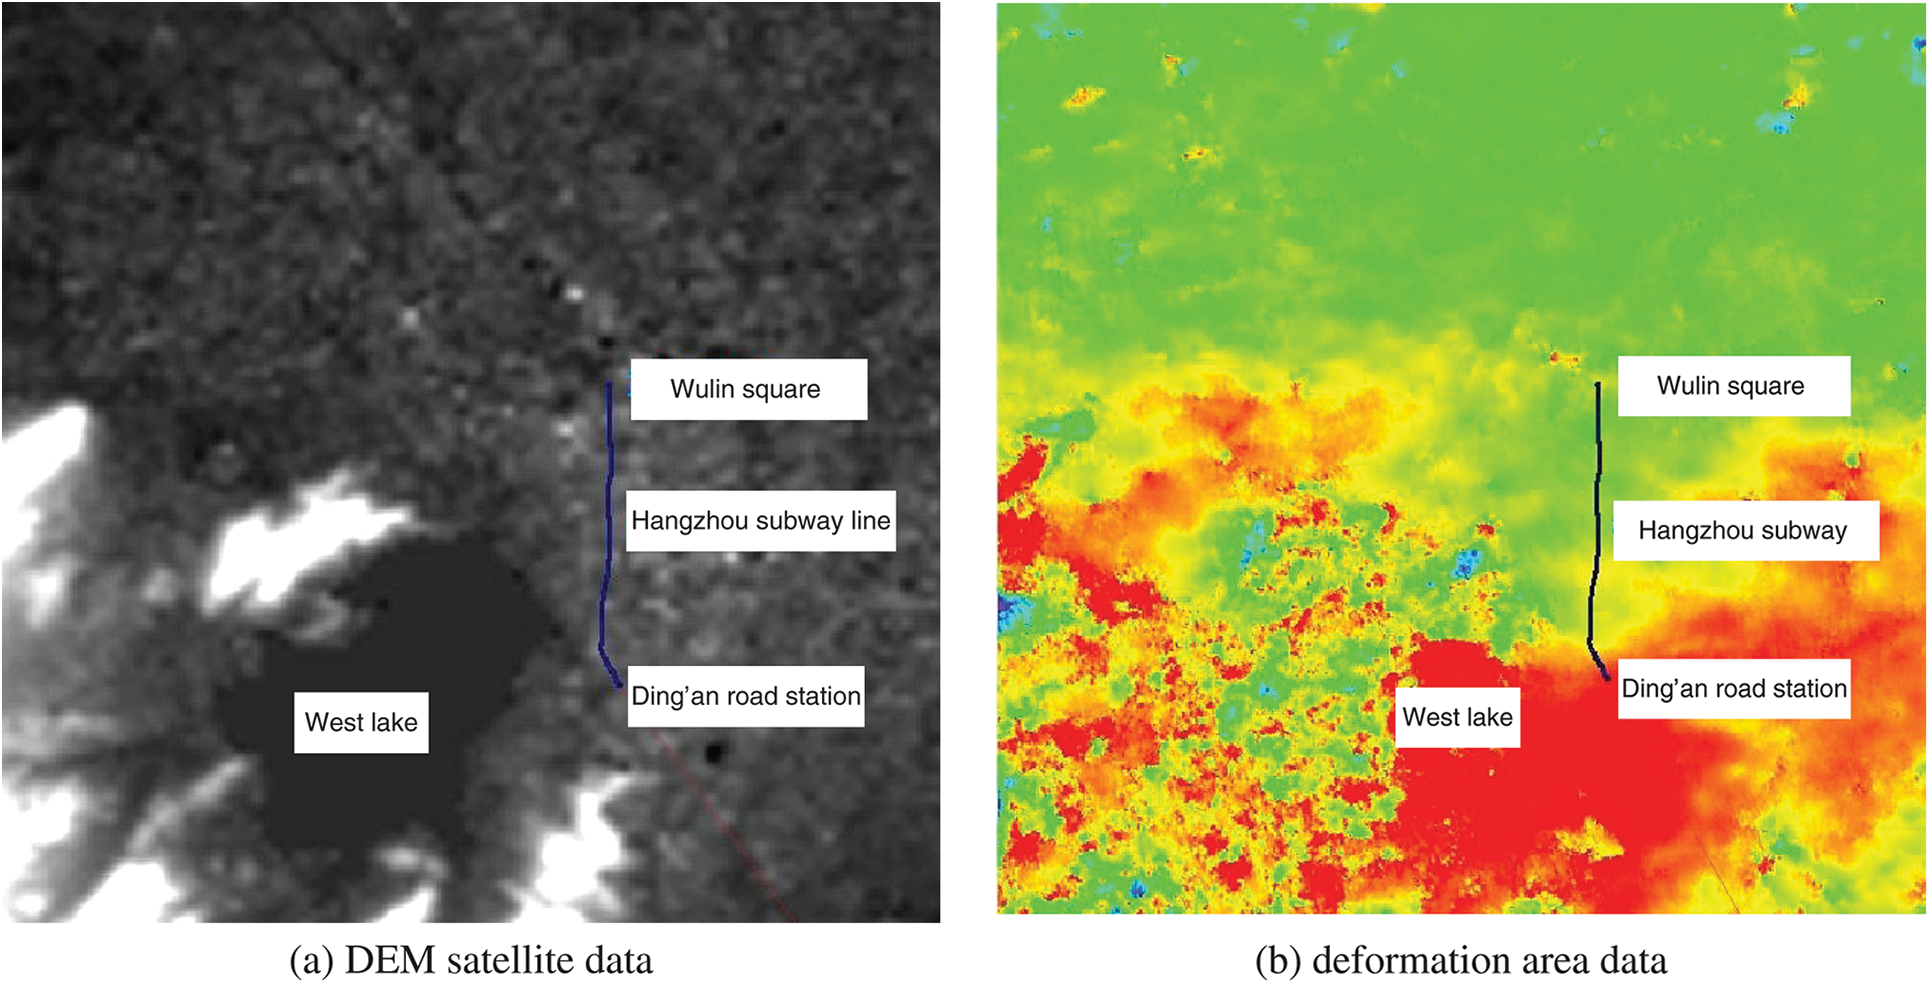
Figure 19: Comparison between DEM satellite data and deformation area data in the research area
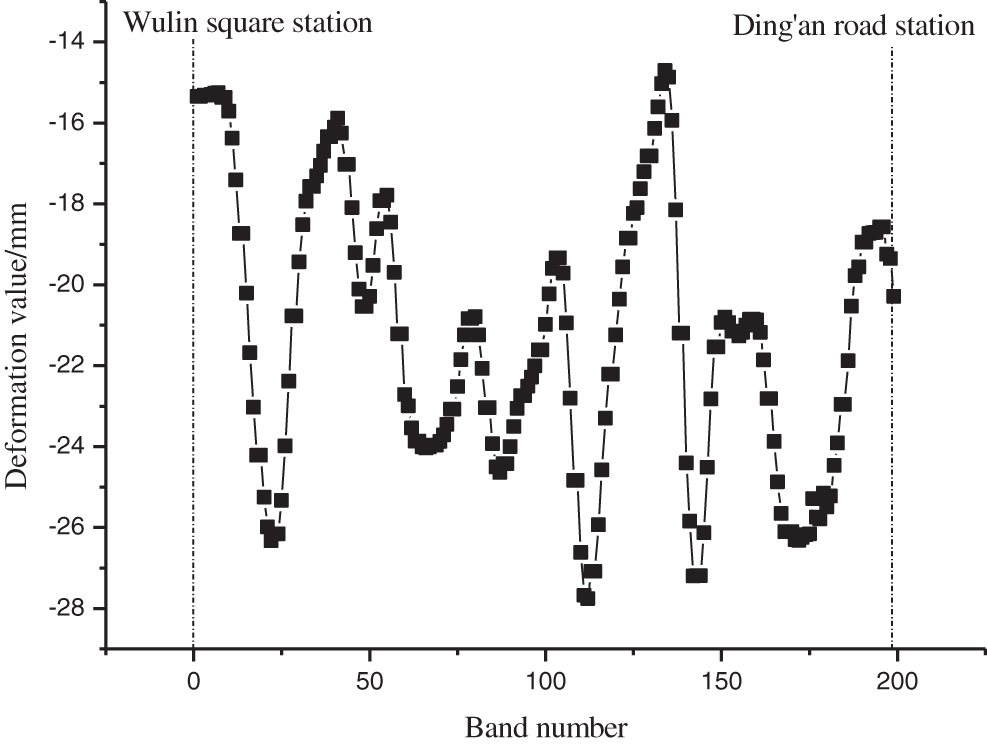
Figure 20: Deformation value in the research area
5 Numerical Simulation and Analysis of Results
According to the location of Hangzhou Subway Line 1 and the surrounding location of the soil geological conditions, as shown in Table 2; using rhino software to construct the tunnel-soil 3D geological generalization model of Hangzhou Subway Line 1; and imported into FLAC3D software, as shown in Fig. 21. The model size is 100 m in horizontal length, 60 m in height and 60 m in width, and the complex soil layer is simplified into a five-layer soil structure to facilitate the calculation. The Moore-Coulomb soil ontology model is used, the soil layers include fill layer, powder clay layer, silt clay layer, powder clay layer, powder clay sand layer; the diameter of the tunnel is 6 m, and double tunnels are used, 12 m apart, located 15 m below the surface edge and 6 m from the centerline of the surface.
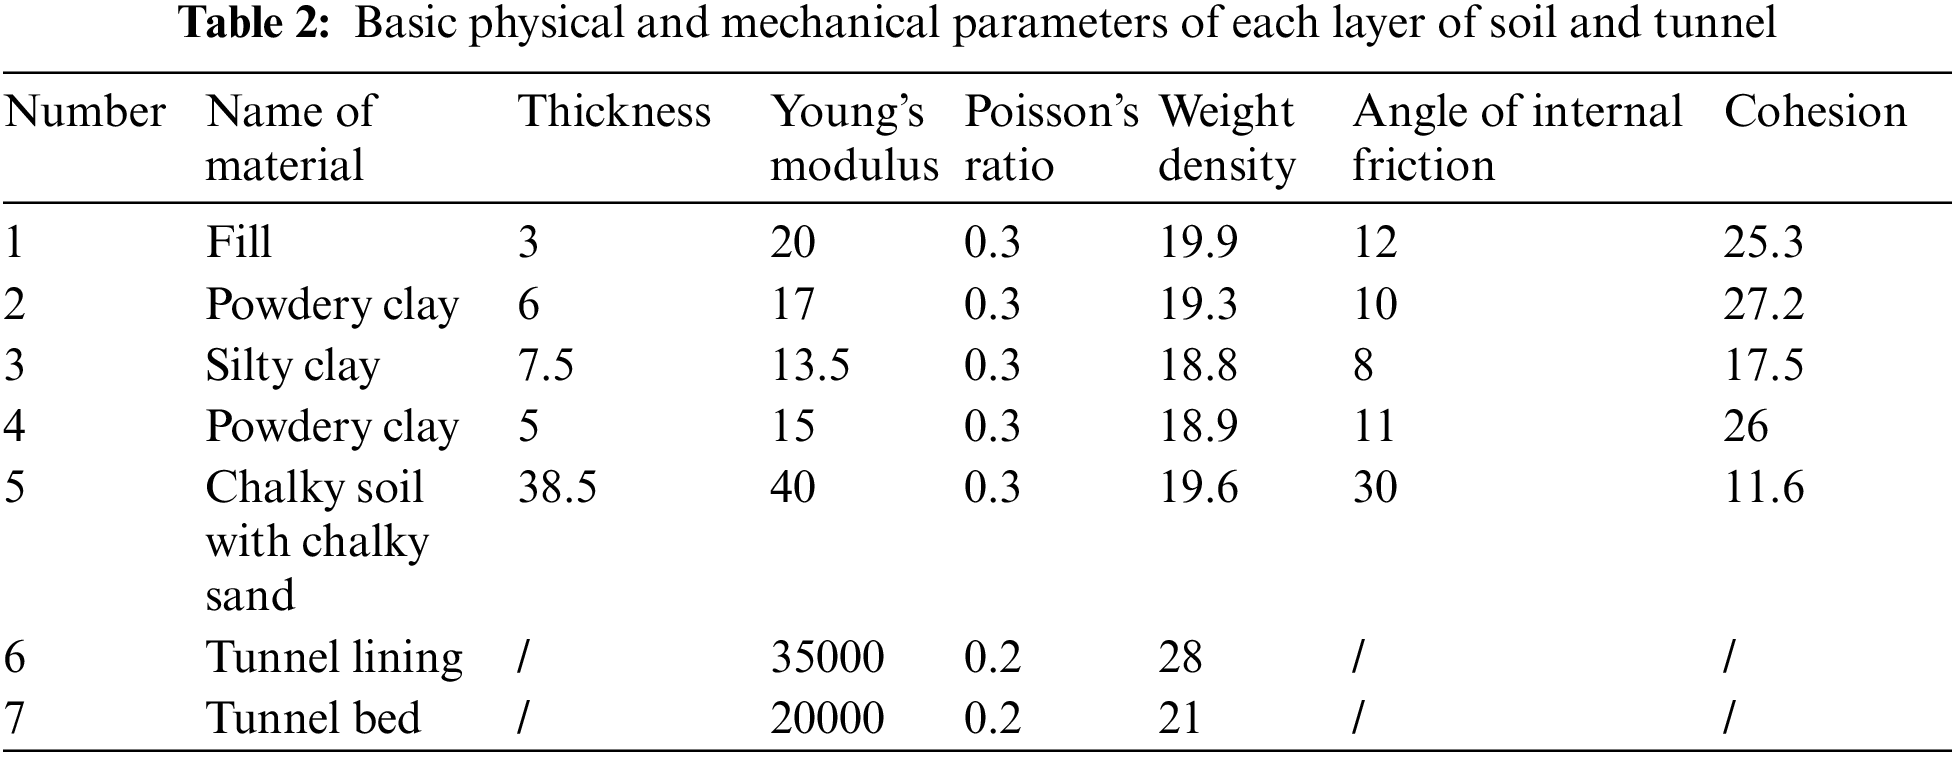
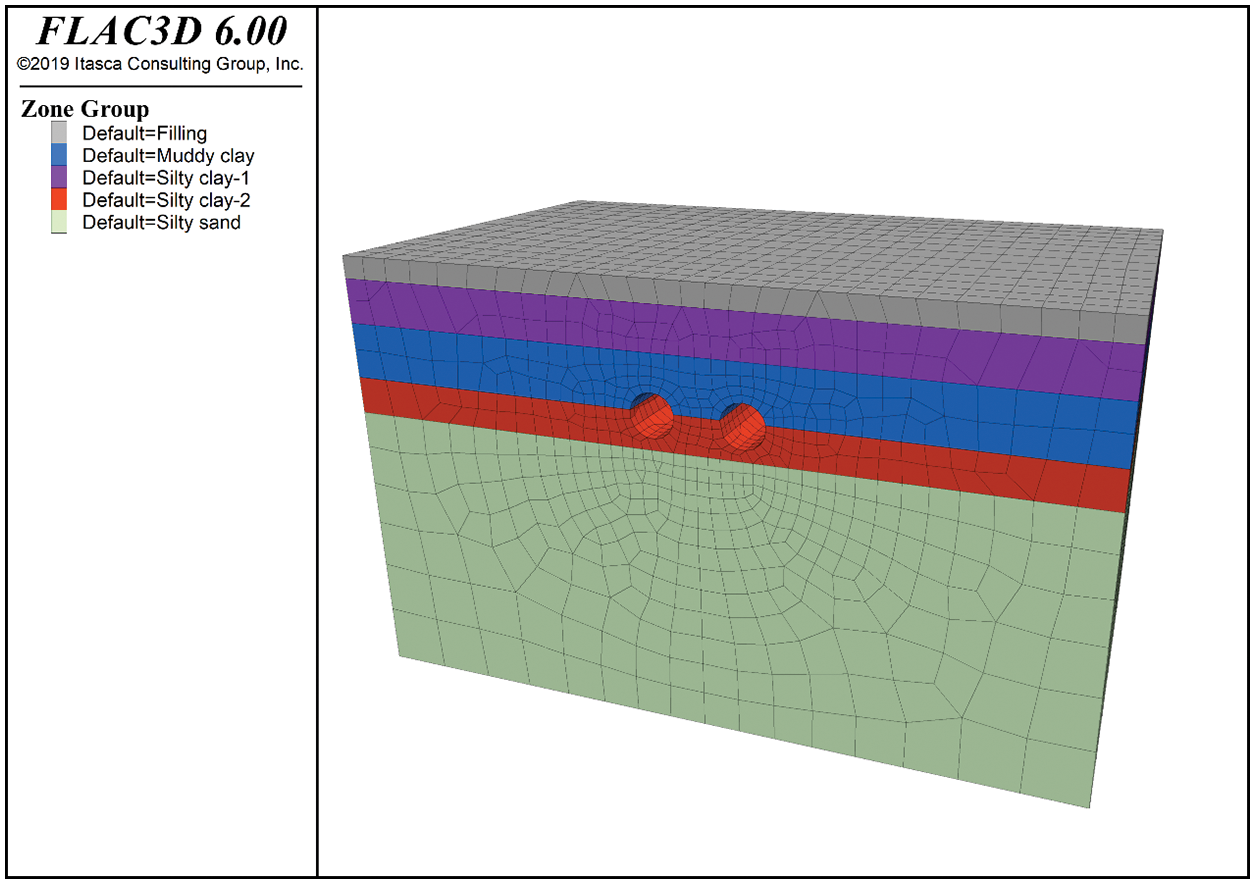
Figure 21: Tunnel-soil 3D model
5.2 Analysis of Numerical Simulation Results
The train dynamic load is the key to subway environmental vibration response analysis. Considering the limitation of the test conditions of the subway train dynamic load real measurement method and the limitation of the empirical formula method, the train one-track model is established using the US five-level track upset spectrum to obtain the train dynamic load; through a series of steps such as modeling, grid calculation cell division, parameter setting, constraint boundary conditions, establishing force field, calculating yield criterion establishment, etc., the vertical stress, maximum principal stress and displacement clouds of the tunnel-soil 3D finite element model are obtained and the results are analyzed, respectively.
(1) Analysis of vertical stress and maximum principal stress results
The train will be subject to vertical force and horizontal force at the same time during operation, and the horizontal force usually dominates during high-speed travel.
From Figs. 22 and 23, it can be seen that the horizontal stress is numerically greater than the vertical stress during the high-speed operation of the train, and in the soil layer in the area below the excavated tunnel, it can be clearly seen that its horizontal stress is greater than the vertical stress, which is more consistent with the actual situation.
Figure 22: Vertical stress images
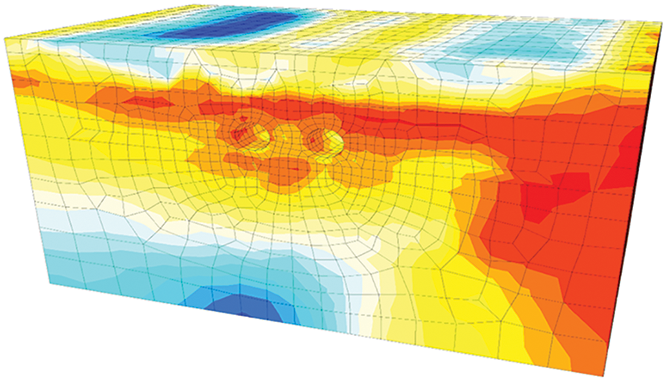
Figure 23: Horizontal stress of images
The main stress is positively correlated with the tunnel depth and soil depth, and the maximum main stress is usually at the bottom, but due to the excavation of the tunnel, the stress concentration phenomenon is generated on the surrounding soil, resulting in a rapid increase in stress, and with the completion of excavation, the stress concentration phenomenon gradually disappears, and the stress near the tunnel only increases to a certain extent compared to the distal end, and the overall trend of stress distribution becomes larger with the increase of depth, and the maximum main stress also appears at The maximum principal stresses also appear at the bottom of the soil, and the results presented in the model calculation clouds agree with the basic theory to a large extent. The maximum principal stress diagram is shown in Fig. 24.
(2) Displacement results analysis
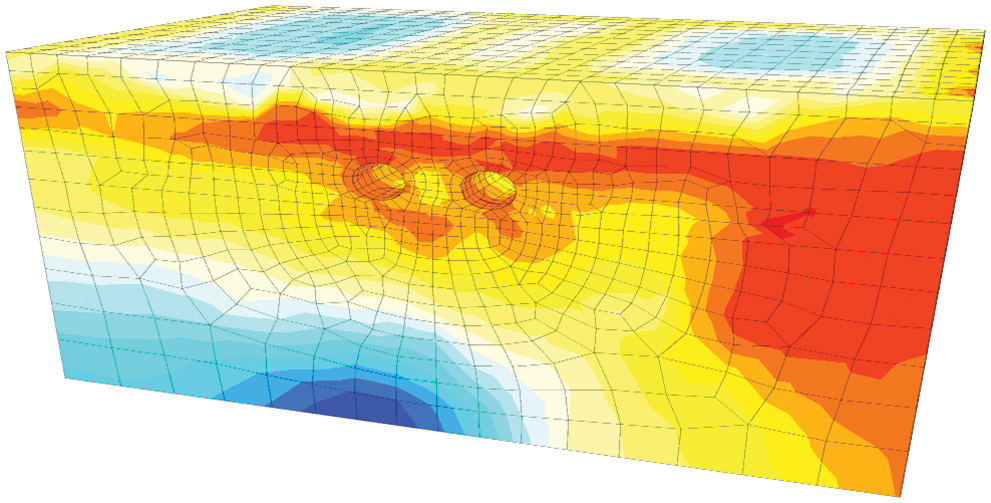
Figure 24: The maximum principal stress diagram
The train vibration load will cause deformation, and the ground surface will collapse under long-term train vibration load, uneven settlement, and other geohazard problems.
From Fig. 25, it can be concluded that the soil layer beneath the tunnel has a large deformation under the joint action of vibration load and stress concentration of the train, and the displacement deformation gradually decreases along the direction of the buried thickness of the soil layer, which is caused by the additional stress effect generated by the vibration load, and the long-term settlement maximum value of the ground surface has a tendency to increase first and then gradually decrease under the action of long-term vibration load. Overall, the deformation trends shown by the numerical simulation displacement cloud results are basically consistent with the DInSAR-GPS-GIS Integrated Method.
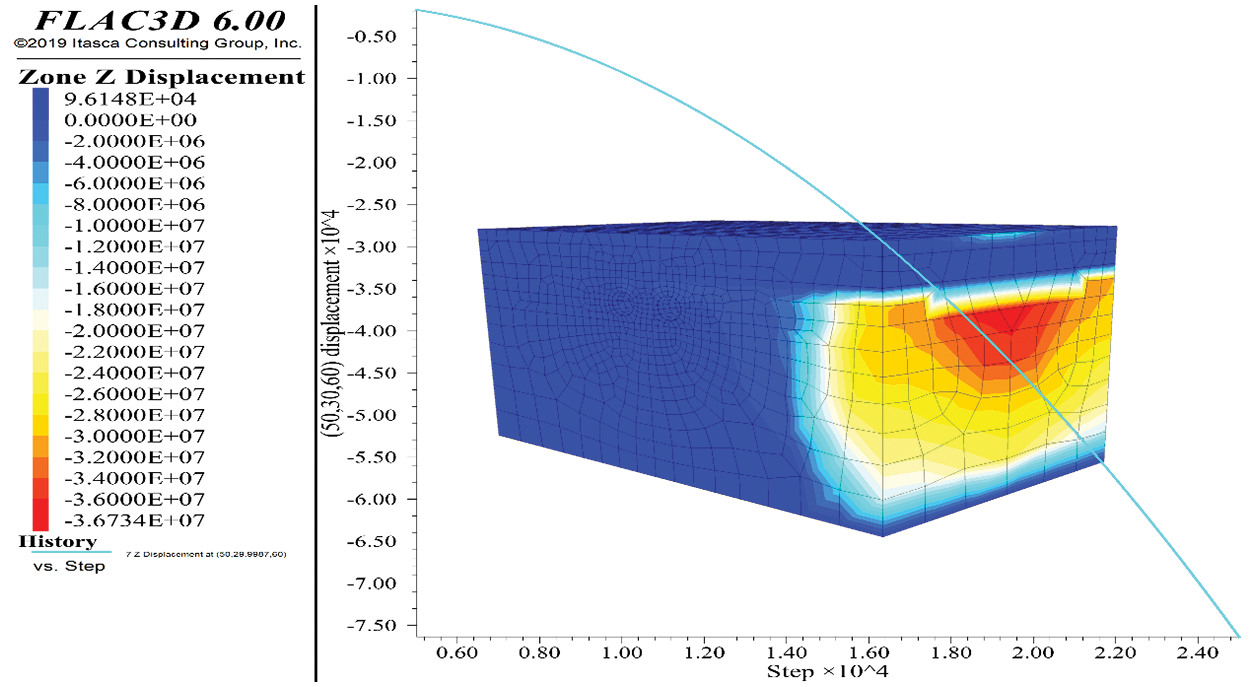
Figure 25: Vertical displacement diagram
Using the 2.8 km operation line between Wulin Square station and Ding’an Road station of Hangzhou Subway Line 1 as an example, this study proposes the integrated method of DInSAR-GPS-GIS technology, including Sentinel-1A satellite data, satellite POD, DEM data, GPS control points, and ArcGIS processing methods. This study presents the key algorithm for long-term land subsidence deformation during subway operation, including DInSAR deformation processing flow, baseline estimation, master-slave image file polarization mode selection, interferogram generation, filtering and coherence calculation, phase unwrapping, control point selection, orbit refinement and reflattening, phase transformation deformation, and geocoding. Multiscene image data, such as 20160601, 20161128, 20170608, and 20170912 satellite data, are selected to analyze long-term subsidence in high-density urban areas during subway operation. The long-term subsidence caused by the operation of Hangzhou Metro Line 1 from Wulin Square station to Ding’an Road station was found to be smaller in the study section compared to the long-term maximum subsidence of 240 mm in Nanjing Metro Line 10, China. The maximum subsidence is 30.64 mm, the minimum subsidence is 11.45 mm, and the average subsidence ranges from 19.27 to 21.33 mm. Based on the basic data of the study area, FLAC3D software was used to simulate the settlement of the study area subjected to vehicle loading, and it was found that the simulation results tended to be consistent with the monitoring by DInSAR-GPS-GIS technology, thus proving the reasonableness and accuracy of the algorithm.
Funding Statement: The financial supports for this research project by the National Natural Science Foundation of China (Nos. 41602308, 41967037). This research was supported by Zhejiang Provincial Natural Science Foundation of China under Grant No. LY20E080005. This research was funded by National Key Research and Development Projects of China (No. 2019YFC507502) and Guangxi Science and Technology Plan Project (No. RZ2100000161).
Conflicts of Interest: The authors declare that they have no conflicts of interest to report regarding the present study.
References
1. China Business Information Network (2021). List of Subway Lines in Operation in Chinese Cities in 2020 (in Chinese). https://top.askci.com/news/20210303/1630341373357.shtml. [Google Scholar]
2. Zou, B. P., Sun, D., Mu, J. D., Xu, Z. P. (2021). Comprehensive risk evaluation in the long-term operation of urban subway based on multiple indices. Mathematical Problems in Engineering, 2021, 1–13. DOI 10.1155/2021/5521630. [Google Scholar] [CrossRef]
3. Zhang, D. M., Huang, H. W., Yang, J. (2005). Influence of partial drainage of linings on long-term surface settlement over tunnels in soft soils. Chinese Journal of Geotechnical Engineering, 27(12), 1430–1436 (in Chinese). DOI 10.3321/j.issn:1000-4548.2005.12.012. [Google Scholar] [CrossRef]
4. Zou, B. P., Wang, J. X., Tian, Q., Guo, W., Yang, J. H. et al. (2015). Numerical analysis of the soil deformation caused by tunneling under vehicle loads in the coastal reclamation area. Mathematical Problems in Engineering, 2015, 1–11. DOI 10.1155/2015/937245. [Google Scholar] [CrossRef]
5. Leclerc, F., Feuillet, N. (2019). Quaternary coral reef complexes as powerful markers of long-term subsidence related to deep processes at subduction zones: Insights from Les Saintes (Guadeloupe French West Indies). Geosphere, 15(4), 983–1007. DOI 10.1130/GES02069.1. [Google Scholar] [CrossRef]
6. Chen, Y., Zhang, K. F., Froger, J., Tan, K., Remy, D. et al. (2018). Long-term subsidence in lava fields at piton de la Fournaise volcano measured by InSAR: New insights for interpretation of the Eastern Flank motion. Remote Sensing, 10(4), 597. DOI 10.3390/rs10040597. [Google Scholar] [CrossRef]
7. Tang, Y. Q., Yang, Q., Ren, X. W., Xiao, S. Q. (2019). Dynamic response of soft soils in high-speed rail foundation: In situ measurements and time domain finite element method model. Canadian Geotechnical Journal, 56(12), 1832–1848. DOI 10.1139/cgj-2018-0555. [Google Scholar] [CrossRef]
8. Shi, Y. F., Cao, C. W., Chen, X. S., Zhang, L. C., Huang, Y. et al. (2021). Dynamic distortion and long-term settlement of weathered argillaceous siltstone under subway tunnel base in Nanchang, China. Journal of Performance of Constructed Facilities, 35(6), 1--9. DOI 10.1061/(ASCE)CF.1943-5509.0001659. [Google Scholar] [CrossRef]
9. Di, H. G., Zhou, S. H., Guo, P. J., He, C., Zhang, X. H. et al. (2020). Observed long-term differential settlement of metro structures built on soft deposits in the Yangtze River Delta region of China. Canadian Geotechnical Journal, 57(6), 840–850. DOI 10.1139/cgj-2018-0524. [Google Scholar] [CrossRef]
10. Qiu, J. L., Liu, H. Q., Lai, J. X., Lai, H. P., Chen, J. X. et al. (2018). Investigating the long-term settlement of a tunnel built over improved loessial foundation soil using jet grouting technique. Journal of Performance of Constructed Facilities, 32(5), 04018066. DOI 10.1061/(ASCE)CF.1943-5509.0001155. [Google Scholar] [CrossRef]
11. Huang, Q., Huang, H. W., Ye, B., Zhang, D. M., Gu, L. L. et al. (2017). Dynamic response and long-term settlement of a metro tunnel in saturated clay due to moving train load. Soils and Foundations, 57(6), 1059–1075. DOI 10.1016/j.sandf.2017.08.031. [Google Scholar] [CrossRef]
12. Tan, J., Cui, Z. D., Yuan, L. (2016). Study on the long-term settlement of subway tunnel in soft soil area. Marine Georesources and Geotechnology, 34(5), 486–492. DOI 10.1080/1064119X.2015.1030806. [Google Scholar] [CrossRef]
13. Di, H. G., Zhou, S. H., Xiao, J. H., Gong, Q. M., Luo, Z. (2016). Investigation of the long-term settlement of a cut-and-cover metro tunnel in a soft deposit. Engineering Geology, 204, 33–40. DOI 10.1016/j.enggeo.2016.01.016. [Google Scholar] [CrossRef]
14. Fadhillah, M., Achmad, A., Lee, C. (2020). Integration of InSAR time-series data and GIS to assess land subsidence along subway lines in the Seoul Metropolitan Area, South Korea. Remote Sensing, 12(21), 1--25. DOI 10.3390/rs12213505. [Google Scholar] [CrossRef]
15. Shi, W., Chen, G., Meng, X. M., Jiang, W. Y., Chong, Y. et al. (2020). Spatial-temporal evolution of land subsidence and rebound over Xi’an in Western China revealed by SBAS-InSAR analysis. Remote Sensing, 12(22), 1--21. DOI 10.3390/rs12223756. [Google Scholar] [CrossRef]
16. Hu, B., Yang, B., Zhang, X. F., Chen, X. L., Wu, Y. (2019). Time-series displacement of land subsidence in Fuzhou downtown, monitored by SBAS-InSAR technique. Journal of Sensors, 2019, 1–12. DOI 10.1155/2019/3162652. [Google Scholar] [CrossRef]
Cite This Article
 Copyright © 2023 The Author(s). Published by Tech Science Press.
This work is licensed under a Creative Commons Attribution 4.0 International License , which permits unrestricted use, distribution, and reproduction in any medium, provided the original work is properly cited.
 Downloads
 Citation Tools