 Open Access
ARTICLE
Slope Collapse Detection Method Based on Deep Learning Technology
1 Yellow River Engineering Consulting Co., Ltd., Zhengzhou, 450003, China
2 School of Artificial Intelligence and Automation, Huazhong University of Science and Technology, Wuhan, 430074, China
* Corresponding Author: Di Wu. Email:
(This article belongs to the Special Issue: Enabled and Human-centric Computational Intelligence Solutions for Visual Understanding and Application)
Computer Modeling in Engineering & Sciences 2023, 134(2), 1091-1103. https://doi.org/10.32604/cmes.2022.020670
Received 06 December 2021; Accepted 15 March 2022; Issue published 31 August 2022
Abstract
So far, slope collapse detection mainly depends on manpower, which has the following drawbacks: (1) low reliability, (2) high risk of human safe, (3) high labor cost. To improve the efficiency and reduce the human investment of slope collapse detection, this paper proposes an intelligent detection method based on deep learning technology for the task. In this method, we first use the deep learning-based image segmentation technology to find the slope area from the captured scene image. Then the foreground motion detection method is used for detecting the motion of the slope area. Finally, we design a lightweight convolutional neural network with an attention mechanism to recognize the detected motion object, thus eliminating the interference motion and increasing the detection accuracy rate. Experimental results on the artificial data and relevant scene data show that the proposed detection method can effectively identify the slope collapse, which has its applicative value and brilliant prospect.Keywords
The Yellow River is the Mother River of the Chinese nation, which gave birth to the ancient and great Chinese civilization. However, the Yellow River is easy to silt, burst, and move. It burst twice in three years and changed its diversion once within one hundred years in history, which has brought severe disasters to the people along the coast [1]. Since the founding of the new China, the party and the state have attached great importance to the governance of the Yellow River. The construction of large-scale embankment engineering and river regulation engineering have provided an important guarantee for the flood control safety of the Yellow River.
It is the important work of the water administration to manage and maintain the river defense engineering and to ensure that the engineering can play the role of flood control and security for a long time [2,3]. Piping leakage [4] and foundation stone collapse [5] are the main forms of deformation and failure of river defense engineering. One ant hole may cause the collapse of a thousand-li dyke. Early detection and prevention is not only the practical needs of safety management of the river defense engineering but also the most important task of the water administration department. At present, this task mainly relies on manned patrol [6]. However, the scale of the Yellow River defense engineering is huge [7]. Relying on manpower for patrol inspection not only requires a lot of material resources, but also it is difficult to avoid problems such as missed inspection and late inspection.
Since entering the new century, with the development of information technology, water conservancy big data has been more and more applied in the governance of the Yellow River and other drainage basins [8]. In the National Informatization Development Strategy Outline issued by the CPC Central Committee and the State Council, it is proposed to improve the application level of informatization and guide the deep integration of the new generation of information technology and the economic and social fields. The Guidelines on Promoting the Development of Water Conservancy Big Data, the Top-level Design for the Integration and Sharing of Water Conservancy Informatization Resources, the Overall Plan for Smart Water Conservancy, and other documents issued by the Ministry of Water Resources have repeatedly proposed major measures such as using the dynamic monitoring data of the space-earth integration, focusing on the new service of flood and drought disaster prediction and early warning. The research on early warning of dynamic monitoring and safety risk of river defense engineering can effectively make up for the deficiencies in the engineering supervision information collection and perception ability of the current digital Yellow River. Aiming at the problems existing in the inspection task of river defense engineering, this paper plans to use deep learning and image processing technology to design the corresponding detection and recognition model to assist or replace the manual inspection of slope stability of river defense engineering.
2 Current Situation and Problems
So far, the stability monitoring of the slope of river defense engineering mainly depends on human resources, which has the following major problems:
The cost of manual inspection is high. First, the characteristic of Yellow River defense engineering is multiple types and long tunnels, and it is requiring comprehensive and regular manual inspection, which needs a large number of personnel investments. Second, manual-style inspection requires equipping with professional and technical personnel and establishing relevant management institutions, thus resulting in large expenditure on management and maintenance. Only taking the management and protection of the river defense engineering in the lower reaches of the Yellow River as an example, the annual management and protection cost of embankment per kilometer is about 170,000 yuan and that of channel dangerous project is about 200,000 yuan. The total annual management and protection cost of the embankment and dangerous works has reached 200 to 300 million yuan a year.
The reliability of manual inspection is low. First, manual inspection is limited by natural and traffic conditions. During the flood, it is often accompanied by rainfall and strong convective weather, which is difficult to achieve full coverage of river defense engineering and timely capture of dangerous situations only with the help of simple equipment and limited manual inspection range. Second, the quality of the early river defense engineering of the Yellow River is uneven, the new projects lack large flood inspection, and there are many hidden danger points in the embankment body and dam foundation, which leads to dangerous situations occurring frequently and gustily.
The personal safety risk of manual inspection is high. First, during the flood period, the river level rises and the flow velocity is large, which may lead to dangerous situations such as river regime change and bank collapse. These dangerous situations are often sudden, and result in the personal safety of patrol inspectors is often at great risk. Second, the flood of the Yellow River, especially the flood in the upper reaches, usually lasts a long time. Continuous work makes the inspection team face fatigue, and the fatigue state further increases the personal safety risk.
In addition, some researchers try to use computer vision algorithms to automatically monitor debris flow and landslides. Patent [9] proposed a landslide monitoring device based on computer vision, which includes monitoring equipment, control equipment, electric control system, and characteristic targets. The landslide can be monitored by solving and analyzing the target position information through the monitoring equipment. The device can monitor the mountain deformation to a certain extent. However, the picture flutter caused by external interference has a negative impact on the analysis process. In addition, the device is still based on the contact type, and the installation process is complex and dangerous. Literature [10–13] used object detection networks to learn the characteristics of earthquake landslides and mud-rock flow landslides. This kind of method can effectively identify the disasters with obvious landslide characteristics to a certain extent. However, when the landslide characteristics are not obvious, the recognition performance will be greatly degraded, which cannot meet the requirements of real-time landslide detection.
In addition, there is no work to study the stability monitoring of river defense engineering, which is still a major problem to be solved in the fields of scientific research and industry.
Aiming to the above current situation and existing problems, this paper proposes a slope collapse monitoring method of river defense engineering based on deep learning and image processing technology. The method first uses a designed attention U-net model to accurately segment the slope area. Then the background modeling algorithm is adopted to detect the moving targets in the slope area based on the segmentation results. Finally, a lightweight convolution neural network is proposed to identify the detected moving targets to eliminate the interference of incoherent moving targets. The experimental results on simulated and real scene data show that the proposed method can effectively detect the slope collapse and eliminate the interfering movement, which has a good practical application effect.
The overall framework of the proposed model is shown in Fig. 1, which is divided into four steps:
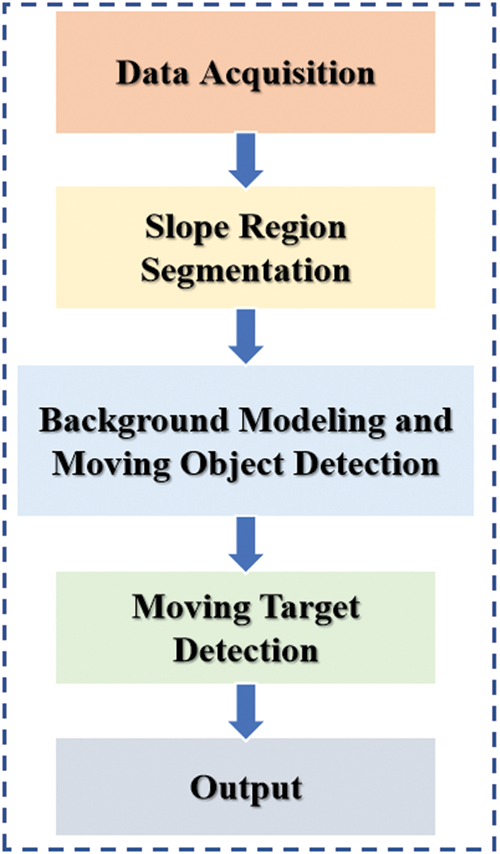
Figure 1: The overall framework of the proposed method
Firstly, the slope data set used for slope reg. Ion segmentation is collected and labeled. Secondly, a lightweight U-net network model based on an attention mechanism is designed and trained with the collected data set. Thirdly, the background modeling and moving object detection algorithm are used to detect the moving objects in the segmented slope area. Finally, we design a lightweight convolutional neural network to identify the detected moving target, to judge whether the movement is caused by the slope collapse. Each of the steps is described in detail below.
3.1 Slope Region Segmentation Based on Deep Learning
Accurate segmentation of the slope area of river defense engineering is the first step of the proposed method. The segmentation effect has a direct impact on the later movement detection results. Considering the accuracy and timeliness of the algorithm, a lightweight U-net segmentation network based on an attention mechanism is designed to segment the engineering slope region.
The U-net network was proposed by Ronneberger et al. [14]. The model realizes the fusion between high-resolution information and low-level semantic information through a “U” network structure, and the skip connections mechanism between symmetrical layers is used to better restore the detail information of the original image, which can be well applied to image segmentation tasks. The network mainly includes the contraction path and expansion path. The contraction path is used to extract context information, which can reduce the dimension of feature space and increase the number of feature channels at the same time. The shrinkage path in the original network contains four stages, in which each stage contains two convolution operations with a 3
In this paper, to improve the efficiency of the segmentation network, we design a lightweight U-net. Specifically, the four stages in the shrinkage path and expansion path in the original model are changed into three stages, in which the number of channels in each stage is reduced to one-third of the raw one, and the rest settings remain unchanged. In addition, to strengthen the attention of the U-net model on important feature information, we further introduce the attention mechanism module into the lightweight segmentation network. The common attention mechanism modules are SENet [15] (Squeeze-and-Excitation Networks), CBAM [16] (Convolutional Block Attention Module), BAM [17] (Bottleneck Attention Module and SKNet) [18] (Selective Kernel Networks). We use BAM as the mechanism module, which includes a channel attention module and a spatial attention module. The channel attention module is composed of an average pool layer and two linear layer mapping layers, which outputs a set of corresponding weight coefficients for each feature graph. The spatial attention module includes two reduction layers with 1
3.2 Motion Detection Based on Background Modeling
After segmenting the slope region, we use the background modeling and moving object detection algorithm to detect the movement of the slope area. The basic principle of the background subtraction method is to approximate the simulated background with a mathematical background model, and then distinguish the current frame image from the background model to obtain the movement area. Common background models include mixed Gaussian model, K-nearest neighbor model, and codebook model. In this paper, a mixed Gaussian model (GMM) is used to detect the movement of the slope region.
GMM model [19] first defines K (K
where P is the current pixel value,
The process can be formulated as:
where K is the number of Gaussian distributions,
To improve the robustness of the motion detection model,
The Eq. (4) is used to update the weight of the GMM algorithm:
where
For the Gaussian distribution matching the pixel value to be measured, the update rules of mean value and variance are shown in (5):
wherein
3.3 Moving Target Recognition Based on Lightweight Convolutional Neural Network
In the actual engineering environment, except for the movement information formed by slope collapse, there are many interference movements, such as birds, pedestrians, leaves fluttering, etc. The movement information caused by these interference sources can also be detected by the background modeling algorithm, resulting in the false detection of slope collapse movement. In order to effectively identify the detected moving target, a lightweight convolutional neural network is proposed to identify the detected moving target to improve the detection accuracy of the proposed method. The architecture of the proposed network is shown in Fig. 2.

Figure 2: The proposed lightweight network
The main framework of the proposed lightweight network is based on the squeezenet [20] module, including two convolution layers, one maximum pooling layer, a global average pooling layer, five fire layers, and a softmax probability output layer. The fire module includes two parts: squeeze and expand. Squeeze is a convolution operation with the kernel size of 1
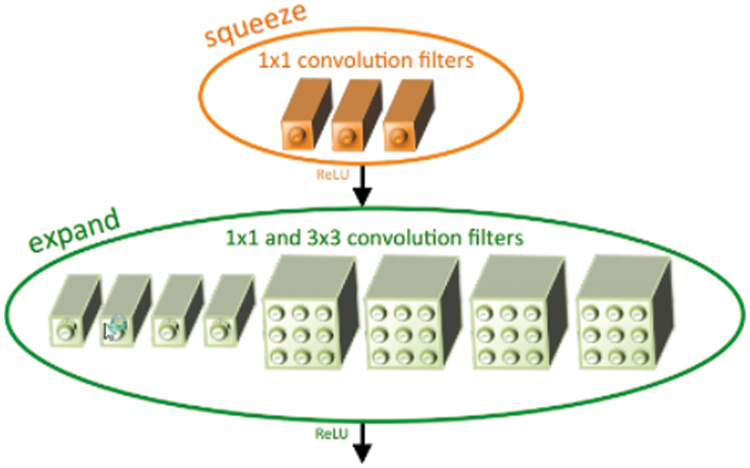
Figure 3: Fire module [20]
The experimental data in this paper mainly includes the following three kinds: slope region segmentation data set, motion detection data set and interference elimination data set. The detail of the three datasets is described below.
4.1.1 Slope Region Segmentation Dataset
To effectively segment the slope area, we collected nearly 1000 slope image data from Madu Channel Dangerous Project along the Yellow River in Zhengzhou and Da Yulan in Jiaozuo and used the labelme tool to annotate 800 of them. Some sample data is shown in Fig. 4.

Figure 4: Sample images of slope region dataset
4.1.2 Motion Detection Dataset
To verify the effect of the background modeling algorithm on motion detection, we collected video data of dangerous accidents in Madu and Da Yulan. In addition, the landslide motion data is also simulated. The data sample is shown in Fig. 5. The first line of the figure is the simulated slope collapse movement scene. The second and the third lines of the figure show the dangerous accidents of Madu and Da Yulan in Jiaozuo, respectively.

Figure 5: Sample images of motion detection data set
4.1.3 Interference Elimination Dataset
Since there may be human, bird, dog, and other interference sources in the slope area, the motion generated by these interference sources would also be detected by the background modeling algorithm, resulting in movement interference. To identify the moving objects and eliminate the disturbing motion, we collected nearly 2000 image data which includes pedestrians, birds, leaves, cats, and dogs from Madu and Da Yulan and divided the dataset into 10 categories, each of which contains 150 to 220 images. The samples of the dataset are shown in Fig. 6. We use this dataset to train the designed lightweight convolutional neural network so that it can effectively identify the moving target, eliminate the interference movement, and improve the detection accuracy of the method.
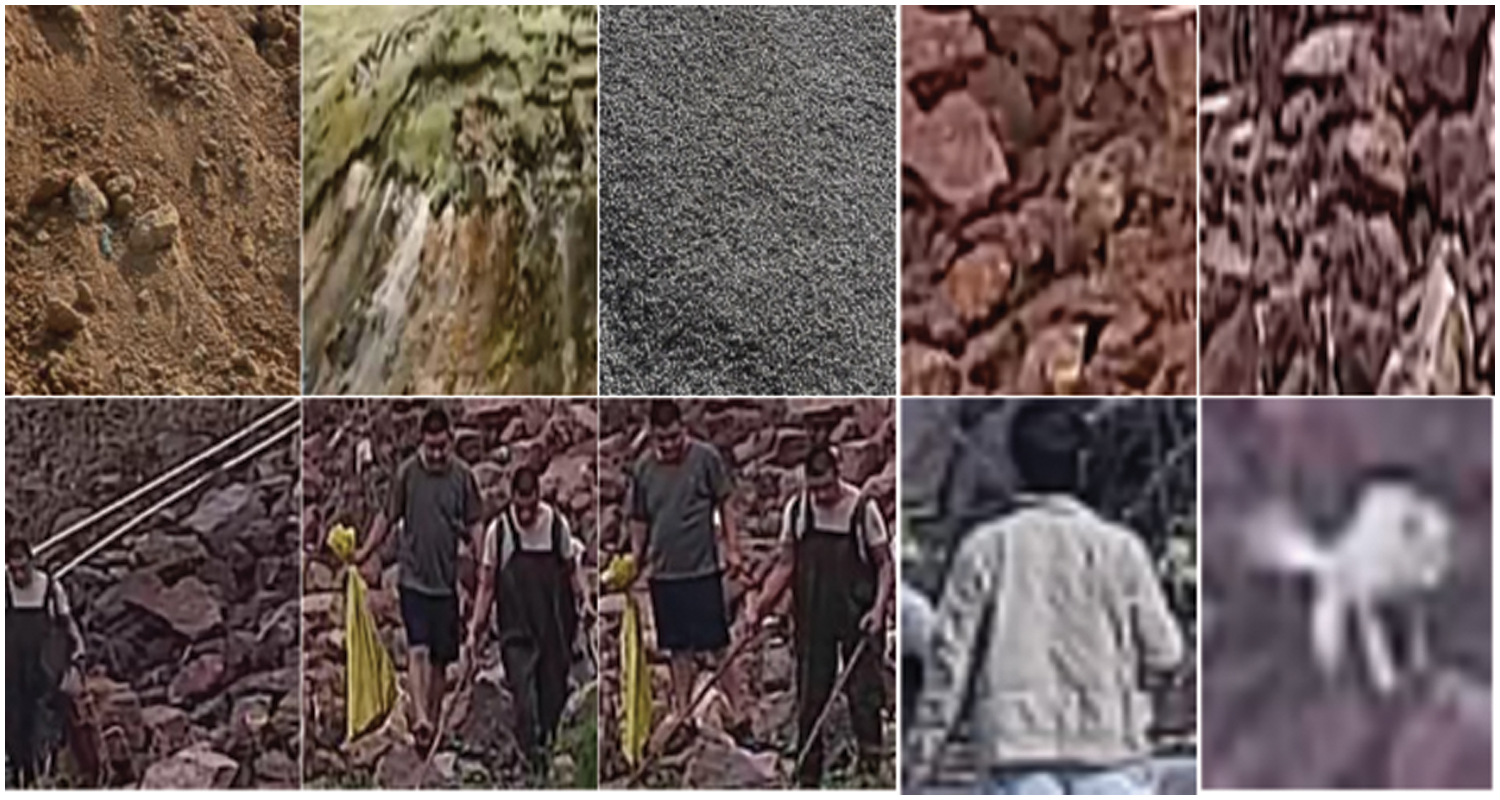
Figure 6: Sample images of interference elimination dataset
4.2 Experimental Parameter Setting
For the slope segmentation experiment, we resize the images into 640
For the lightweight convolutional neural network, the size of input images is set to
4.3 Experimental Results and Analysis
4.3.1 Slope Segmentation Experiment
We use 400 images of the slope region segmentation dataset to train the designed U-net. The rest of the 400 images are used for testing. Some testing results are shown in Fig. 7. From the figure, we can observe that the designed model can well segment the slope region.

Figure 7: Segmentation results
To verify the effectiveness of the attention mechanism, we further evaluate the performance of the proposed model with the IoU (Intersection-over-Union) value. The test results are shown in Table 1, in which U-net/attention is the model without attention mechanism and U-net is the model proposed in this paper. From the table, it can be seen that the U-net segmentation network with attention mechanism has reached a higher IoU value. Thus, the effectiveness of the attention mechanism introduced in the U-net model can be obtained.

In addition, to verify the effectiveness of the proposed lightweight U-net model, we use the dataset to test the original U-net model and the designed lightweight U-net/attention model. The IoU value and the time spent on the segmentation of a single picture are used for comparison. The comparison results are shown in Table 2. From the Table 2, we can see that the IoU values of the two models are almost the same, while the lightweight U-net model has less time-consuming and has higher efficiency, which demonstrates the effectiveness of the proposed lightweight model.

4.3.2 Movement Detection Experiment
We used the collected motion detection dataset to test the performance of the background modeling algorithm. The experimental results are shown in Fig. 8. The left is the original video with motion information. The right is the corresponding results, in which the red part in each image is the detected motion region. Compared with the movement area in the video, it is concluded that the algorithm can well detect the movement generated in the slope region, verifying the effectiveness of the adopted moving target detection algorithm.
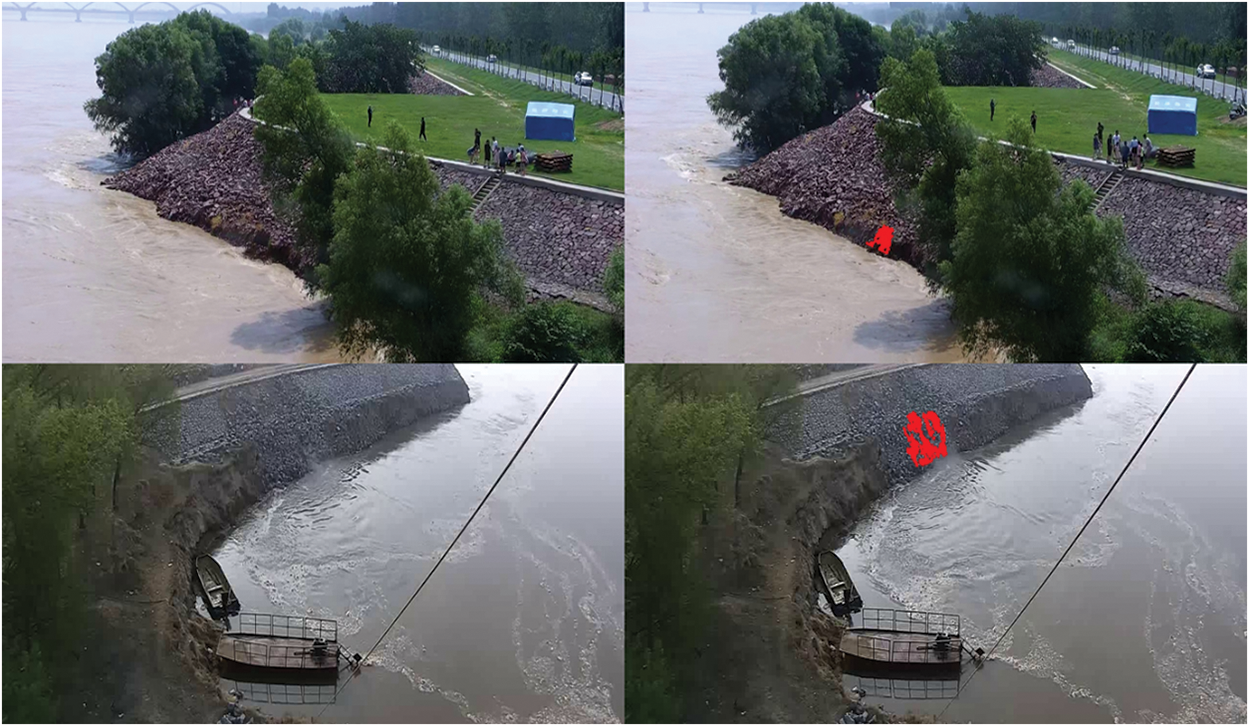
Figure 8: Motion detection results
4.3.3 Interference Elimination Experiment
We randomly select 1500 images to compose the train set for the interference elimination dataset. The remainder of 500 images is used for testing. To verify the rationality of the designed CNN model, we further designed two comparison models. One model added two fire layers based on the proposed model, naming CNN+. The other model removed fire2 and fire3 layers and named CNN−. We used the dataset to train and test the three models and used the top-1 recognition rate as the evaluating indicator. The comparative experimental results are shown in Table 3. From the table, the CNN model has achieved the highest recognition rate. In contrast, whether increasing or reducing the depth of the model will lead to the reduction of the recognition performance of the algorithm, which demonstrates the effectiveness of the proposed CNN model.

4.3.4 Engineering Application Experiment
We embed the proposed method into the monitoring hardware equipment. On this basis, one-pole equipment for river revetment image recognition is developed. The equipment is placed at the Channel Dangerous Project of Madu on the Yellow River for 24-h unattended monitoring. As shown in Fig. 9, on July 05, 2020, the algorithm effectively captured the slope collapse and notified the relevant defense Bureau staff to reinforce the collapse position through network transmission equipment.
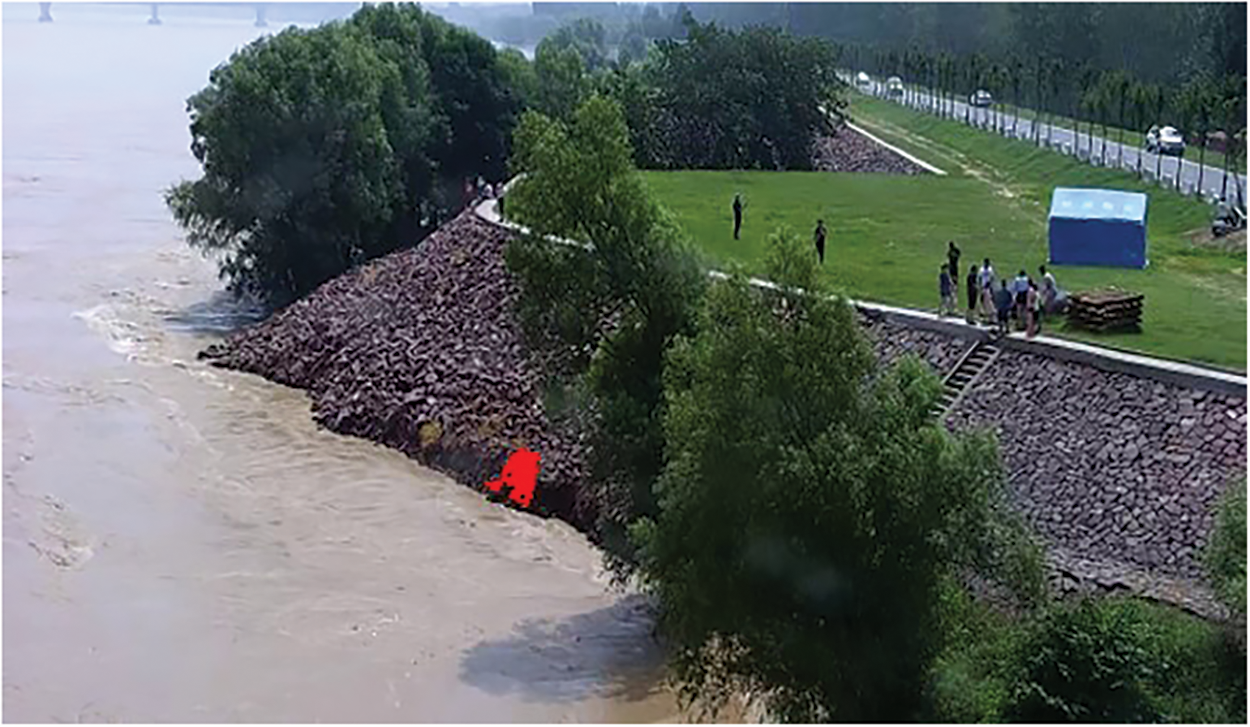
Figure 9: Actual engineering application effect
All the above experimental results show that the method proposed in this paper has a good detection effect on engineering slope collapse both in simulated data and in real scene application, which has high practical value.
Aiming at the existing problems of current engineering slope safety inspection, this paper designs an engineering slope collapse detection algorithm based on deep learning technology. Firstly, the slope area is automatically segmented and extracted, then the moving target in the slope region is detected by the background modeling algorithm. Finally, the detected moving target is effectively identified by the designed CNN model. The proposed method has a good performance on the slope collapse detecting both in simulated and real data scenes, which has a good application prospect. Future work will focus on how to use optical flow estimation based on deep learning technology to capture the motion information produced by slope collapse.
Funding Statement: This work was supported in part by the National Science Foundation of Guangxi Province under Grant 2021JJA170199, and in part by the Research Project of Yellow River Engineering Consulting with No. 2021ky015.
Conflicts of Interest: The authors declare that they have no conflicts of interest to report regarding the present study.
References
1. Zhang, J., Liu, J., Wan, Z., Jun, L. (2018). Channel morphology evolution and corresponding coping strategy in the lower Yellow River—Study in ecological reconstruction and management of the floodplains in the lower Yellow River. Yellow River, 40(7), 1–6+37. [Google Scholar]
2. Niu, Y., Zhang, J. (2020). Thoughts on the national strategy of ecological protection and high-quality development in the Yellow River Basin. Yellow River, 42(11), 1–4+10. [Google Scholar]
3. Zhang, J. (2014). On the management of the Yellow River regulation project. Science and Technology Vision, 30(6), 317. [Google Scholar]
4. Li, D. (2020). Uncover the secret of the instrument of “pseudo flow field method” for detecting the hidden danger of piping leakage in dikes and dams. Scientific and Cultural Popularization of Natural Resources, 55, 1–7. [Google Scholar]
5. Li, Z., Guo, Y., Cui, Y. (2011). Research for new technology on root stone detection of Yellow River training engineering. Yellow River, 33(7), 5–6. [Google Scholar]
6. Xue, Y., Du, J., Wei, C. (2020). A method and system for early warning and diagnosis of embankment deformation and leakage. Technology Innovation and Application, (19), 124–126. [Google Scholar]
7. Ministry of Water Resources (2013). Comprehensive planning of the Yellow River Basin: 2012–2030. Wuhai: Yellow River Water Conservancy Press. [Google Scholar]
8. Jiang, Y., Ye, Y., Zhao, H., Liang, L., Cao, Y. et al. (2020). Research status and prospects on water conservancy big data. Journal of Hydroelectric Engineering, 39(101–32. [Google Scholar]
9. Song, S., Xu, H., Yao, H. (2021). A mountain disaster early warning monitoring device and early warning monitoring method based on machine vision. Shanghai: CN112284263A. http://pss-system.cnipa.gov.cn/sipopublicsearch/patentsearch/showViewList-jumpToView.shtml. [Google Scholar]
10. Ju, Y., Xu, Q., Jin, S., Li, W., Dong, X. et al. (2020). Automatic recognition of loess landslide using depth learning method. Journal of Wuhan University (Natural Science Edition), 45(11), 1747–1755. [Google Scholar]
11. Ghorbanzadeh, O., Blaschke, T., Gholamnia, K. (2019). Evaluation of different machine learning methods and deep-learning convolutional neural networks for landslide detection. Remote Sensing, 11(2), 196–216. DOI 10.3390/rs11020196. [Google Scholar] [CrossRef]
12. Ghorbanzadeh, O., Meena, S. R., Blaschke, T. (2019). UAV-based slope failure detection using deep-learning convolutional neural networks. Remote Sensing, 11(17), 2046–2069. DOI 10.3390/rs11172046. [Google Scholar] [CrossRef]
13. Ji, S., Yu, D., Shen, C. (2020). Landslide detection from an open satellite imagery and digital elevation model dataset using attention boosted convolutional neural networks. Landslides, 17(6), 1337–1352. DOI 10.1007/s10346-020-01353-2. [Google Scholar] [CrossRef]
14. Ronneberger, O., Fischer, P., Brox, T. (2015). U-net: Convolutional networks for biomedical image segmentation. International Conference on Medical Image Computing and Computer-Assisted Intervention, pp. 234–241. Cham, Springer. [Google Scholar]
15. Hu, J., Shen, L., Sun, G. (2018). Squeeze-and-excitation networks. Proceedings of the IEEE Conference on Computer Vision and Pattern Recognition, pp. 7132–7141. USA. [Google Scholar]
16. Woo, S., Park, J., Lee, J., Kweon, I. S. (2018). CBAM: Convolutional block attention module. European Conference on Computer Vision, pp. 3–19. Germany. [Google Scholar]
17. Park, J., Woo, S., Lee, J., and. Kweon, I. S. (2018). BAM: Bottleneck attention module. https://arxiv.org/abs/1807.06514. [Google Scholar]
18. Li, X., Wang, W., Hu, X. (2019). Selective kernel networks. Proceedings of the IEEE/CVF Conference on Computer Vision and Pattern Recognition, pp. 510–519. USA. [Google Scholar]
19. Kim, K., Chalidabhongse, T. H., Harwood, D. (2005). Real-time foreground-background segmentation using Codebook model. Real-Time Imaging, 11(3), 172–185. DOI 10.1016/j.rti.2004.12.004. [Google Scholar] [CrossRef]
20. Iandola, F. N., Han, S., Moskewicz, M. W. (2016). SqueezeNet: AlexNet-level accuracy with 50x fewer parameters and <0.5 MB model size. https://arxiv.org/abs/1602.07360. [Google Scholar]
Cite This Article
 Copyright © 2023 The Author(s). Published by Tech Science Press.
This work is licensed under a Creative Commons Attribution 4.0 International License , which permits unrestricted use, distribution, and reproduction in any medium, provided the original work is properly cited.


 Submit a Paper
 Propose a Special lssue
 View Full Text
 Download PDF
 Downloads
 Citation Tools