
 Submit a Paper
 Propose a Special lssue
 Open Access
ARTICLE
Detecting Icing on the Blades of a Wind Turbine Using a Deep Neural Network
1
School of Control and Computer Engineering, North China Electric Power University, Beijing, 102206, China
2
R&D, State Grid Information & Telecommunication Group Co., Beijing, 102211, China
* Corresponding Author: Jiaohui Xu. Email:
(This article belongs to the Special Issue: Hybrid Intelligent Methods for Forecasting in Resources and Energy Field)
Computer Modeling in Engineering & Sciences 2023, 134(2), 767-782. https://doi.org/10.32604/cmes.2022.020702
Received 07 December 2021; Accepted 14 March 2022; Issue published 31 August 2022
 View Full Text
 Download PDF
Abstract
The blades of wind turbines located at high latitudes are often covered with ice in late autumn and winter, where this affects their capacity for power generation as well as their safety. Accurately identifying the icing of the blades of wind turbines in remote areas is thus important, and a general model is needed to this end. This paper proposes a universal model based on a Deep Neural Network (DNN) that uses data from the Supervisory Control and Data Acquisition (SCADA) system. Two datasets from SCADA are first preprocessed through undersampling, that is, they are labeled, normalized, and balanced. The features of icing of the blades of a turbine identified in previous studies are then used to extract training data from the training dataset. A middle feature is proposed to show how a given feature is correlated with icing on the blade. Performance indicators for the model, including a reward function, are also designed to assess its predictive accuracy. Finally, the most suitable model is used to predict the testing data, and values of the reward function and the predictive accuracy of the model are calculated. The proposed method can be used to relate continuously transferred features with a binary status of icing of the blades of the turbine by using variables of the middle feature. The results here show that an integrated indicator system is superior to a single indicator of accuracy when evaluating the prediction model.Keywords
China and the United States have recently released the Joint Glasgow Declaration on Enhancing Climate Action at the United Nations (UN) climate conference, known as COP26, in Scotland [1]. China had set itself the goals of achieving a carbon peak and carbon neutralization prior to this [2]. As it is a major form of renewable energy, advances in the use of wind power are expected to continue towards this end (wind power generation in China had increased by 34.4% as of May 2021 [3]). Most of these wind turbines have been installed in high-latitude areas, where the climate is severe. The blades of these turbines are often covered with a thick layer of ice in late autumn and winter, as shown in Fig. 1. The icing of the blades is a critical problem that affects the capacity of the turbine for power generation as well as its safety [4–6]. Some researchers have claimed that the power output of a wind turbine declines by 27% in the case of icing [7].

Figure 1: A wind turbine covered with ice
Many solutions have been proposed to the problem of ice buildup upon the blades of a wind turbine. Rizk et al. [8] proposed using hyperspectral imaging to detect the icing of the blades of a wind turbine, where this requires the construction of a hyperspectral imaging system. Research on the icing of the blades of wind turbines has focused on the analysis of data from SCADA (Supervisory Control and Data Acquisition) without using any additional devices. For example, engineers determine whether the blades of a turbine are covered with ice by monitoring SCADA data [9]. Some researchers have designed machine learning models to predict icing by using this data. Xiong et al. [10] built a model to predict the icing of the blades of a wind turbine in the short term based on Bi-LSTM and the SVM. Xu et al. [7] also proposed a prediction model based on the SVM, and demonstrated how to obtain better parameters for it by using particle swarm optimization. Such models can be used to detect the status of wind turbines, but most of them run into the problem of overfitting and are thus unsuitable for practical use. Moreover, the accuracy of their predictions decreases when they are transferred to the operating environments of wind turbines other than the ones for which they were designed. A universal machine learning-based model is thus needed for predicting ice buildup upon the blades of wind turbines.
In this paper, the authors first select features from SCADA data that are closely correlated with ice buildup upon the blades of a wind turbine. Big data from SCADA are then prepared for use in machine learning, and are labeled and preprocessed. Following this, a model is built based on a deep neural network (DNN). This model features an integrated indicator system that can not only measure the accuracy of the model, but also its ability to be used on datasets of wind turbines other than the specific one on which it is based. The remainder of this paper is organized as follows: Section 2 details the data preprocessing, including data labeling and normalization, the balancing of the data distribution, and the division of the data into groups. Section 3 discusses feature selection based on previous studies in the area, and Section 4 introduces the model based on the DNN and parameters of the model. Section 5 describes the experimental process used to verify the proposed model and its results. It involves building an integrated indicator system that can assess the accuracy of the model, a description of the experimental process, and a comparative analysis of the results. Finally, Section 6 concludes by summarizing the limitations of the proposed method and its implications for future work in the area.
A model based on machine learning involves the use of big data. Two datasets of SCADA, corresponding to two wind turbines in a wind farm in North China, were used. Data from one, called turbine #1, was used to train the model. The dataset contained more than 190,000 items. Data from the other, called turbine #2, was used to validate the model. Its dataset contained nearly 170,000 data items. The distributions of data in the two sets are presented in Table 1.

The sources of data from SCADA have 26 measurements, as shown in Table 2.

These SCADA data were automatically generated by using sensors and programs in the empirical environment. They were highly structured and time-serialized, and thus were suitable for analysis and data mining.
The distribution of the data shown in Table 1 indicates that the datasets contained a significantly greater amount of data on icing-free blades than those representing their icing. This imbalance is reasonable because most wind turbines operate normally most of the time. However, most machine learning algorithms used for classification are sensitive to the distribution of the training samples, which means that this imbalance would lead to a poor model that is complex and inaccurate. It was thus necessary to balance the distribution of the sampled data. Oversampling, undersampling, and other sampling methods based on both are recommended to balance the data.
Methods to balance the data have been provided in [7,11]. Among the normal data, we first eliminated the icing-free data and then eliminated redundant data. For data representing icing, we first removed data representing heavy icing and then eliminated redundant data. The resulting amount of icing-free data in the sample dataset was approximately equal to the data representing icing.
The magnitudes of different monitoring points are in general different. Some are very large and others are quite small. This numerical size can affect the weights of the model, and can even cause some features that are related to icing to be ignored during model training. This reduces the predictive accuracy of the model. To reduce the impact of this numerical difference, the sample data needs to be normalized [12].
There are many methods to normalize data—for example, min-max normalization and the Z-score [12]. Given that the model will be used in empirical environments, where it is impossible to compute the standard deviation, the min-max standard method is more suitable for use.
In the above, “min” is the minimum value of variable x while “max” is its maximum value, and
The values of the characteristic variable x can be mapped to the range [0, 1] by using Eq. (1).
3 Selecting Features Correlated with Icing
The process of ice buildup upon the blades of a turbine is complex, and is directly related to such environmental factors as the ambient temperature, wind speed, and humidity. It is challenging to establish a mathematical model to predict the ice buildup upon wind turbine blades by using only these factors. Moreover, the aerodynamic performance of the blades of wind turbines changes when they are frozen. For example, the power generated at the same wind speed is reduced. These factors can be used to predict icing, but it is difficult to identify the variables related to the icing of the blades.
There are 26 measurements in SCADA for wind turbines, as shown in Table 2, and some of them are correlated with the icing of the blades. Only a model formulated by using the features related to icing can accurately predict it when transferred to other turbines.
Even if the manner in which a given feature affects icing is known, that in which a group of features impacts icing cannot be determined by simply aggregating the effects of all features due to the influence that the variables have on one another. Transfer learning is a useful solution to the problem of an insufficient number of samples. Pandeya et al. provided a model to detect the needs of pet cats according to their emitted sounds by transferring some features of such sounds from their previous research [13]. This suggests that some features of the icing of blades can also be transferred over from similar past studies and utilized as well.
Wei et al. [9] provided features related to the icing of the blades based on practical experience. Li et al. [11] proposed a method to identify features correlated with the icing of the blades based on logistic regression and experiments. We use these two studies to extract some features related to icing, as shown in Table 3.

Some of the feature variables in Table 3 are copied from Table 2 while the others were calculated by using the variables in Table 2.
3.2 Feature Correlation Analysis
It was necessary to check each feature in Table 3 to determine the extent to which it was correlated with the icing of the blades. A chart is a visible and direct way to show the relationships between the relevant variables and the status of the icing of blades. However, whether or not icing has occurred is a binary proposition in time rather than a continuous one, such as wind speed, ambient temperature, and power output. We thus seek a “middle feature” that is continuous in time and closely correlated with the icing of the blades, and use it to relate the continuous features in time with the icing of the blades.
The rotation of the blades of the turbine generates power. The stronger the wind is, the more power is generated. When the blades are covered with ice, the aerodynamic characteristics of the wind turbine change and its power output decreases under the same wind-induced force. Goshima et al. claimed that the power output at a rated wind speed in case of icing is smaller than that without icing, as is the maximum thrust of the rotor, whereas the wind speed at which the turbine’s rated power can be reached in case of icing is higher than that without icing [14]. The power output of the wind turbine thus directly reflects whether icing has occurred on it, and is a suitable middle feature.
By taking power as the middle feature, the relation between a given variable and the power output can reflect the status of the wind turbine. An example is the variable of wind speed, which is one of the most apparent features related to the power output. The relationship between wind speed, power, and the icing of the blades is clearly presented in Fig. 2. Certainly, the data in the below figures are normalized to ignore the influence of the measurement scale.


Figure 2: Relation between wind speed and power output of a wind turbine. (a) Distribution of wind speed with changes in time (gray points) and power (red points) (the upper horizontal blue lines in the figure represent periods of icing of the wind turbine). (b) Partial magnification of the diagram of the relationship between wind speed and power (the circled part represents no icing while the rectangular part represents icing)
The relation between power and Wind_Speed_Face in Fig. 2a indicates that the power output of the wind turbine is approximately linearly related to wind speed when there is no icing on its blades, but this linear relationship is lost in case of icing. Part of Fig. 2a is enlarged to show the relationship between wind speed and power in Fig. 2b. In the case of icing, the power output of the turbine departs further in relation to wind speed than in the icing-free case.
To clearly show the relationship between wind speed and power, a comparison between the cases with and without icing is presented in Fig. 3. In the case of no icing, the wind speed is almost directly proportional to power, whereas, in the case of icing, the relation between the power and the wind speed is lost just as shown in the lower picture in Fig. 3.
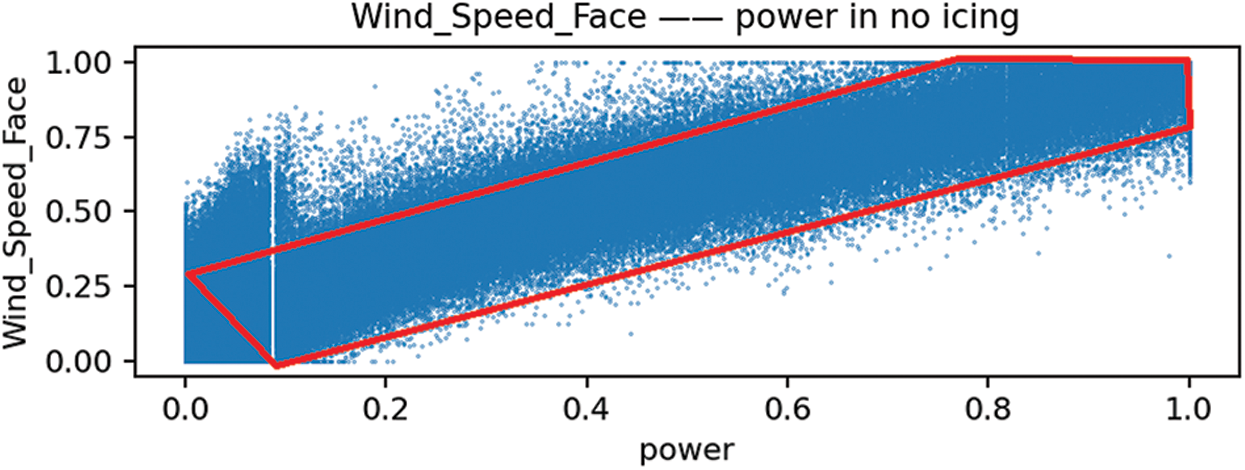

Figure 3: Comparison between cases with and without the icing of the blades of the turbine
Fig. 2 shows the relationship between certain variables and the middle feature in time, and Fig. 3 presents a direct comparison between cases with and without icing. They can be combined into one single figure.
Similarly, we can obtain the relationships between power, and the pitch angle (Fig. 4), as well as the ambient temperature (Fig. 5), and the difference in temperature (Fig. 6).

Figure 4: Relation between the pitch angle and power

Figure 5: Relation between ambient temperature and power
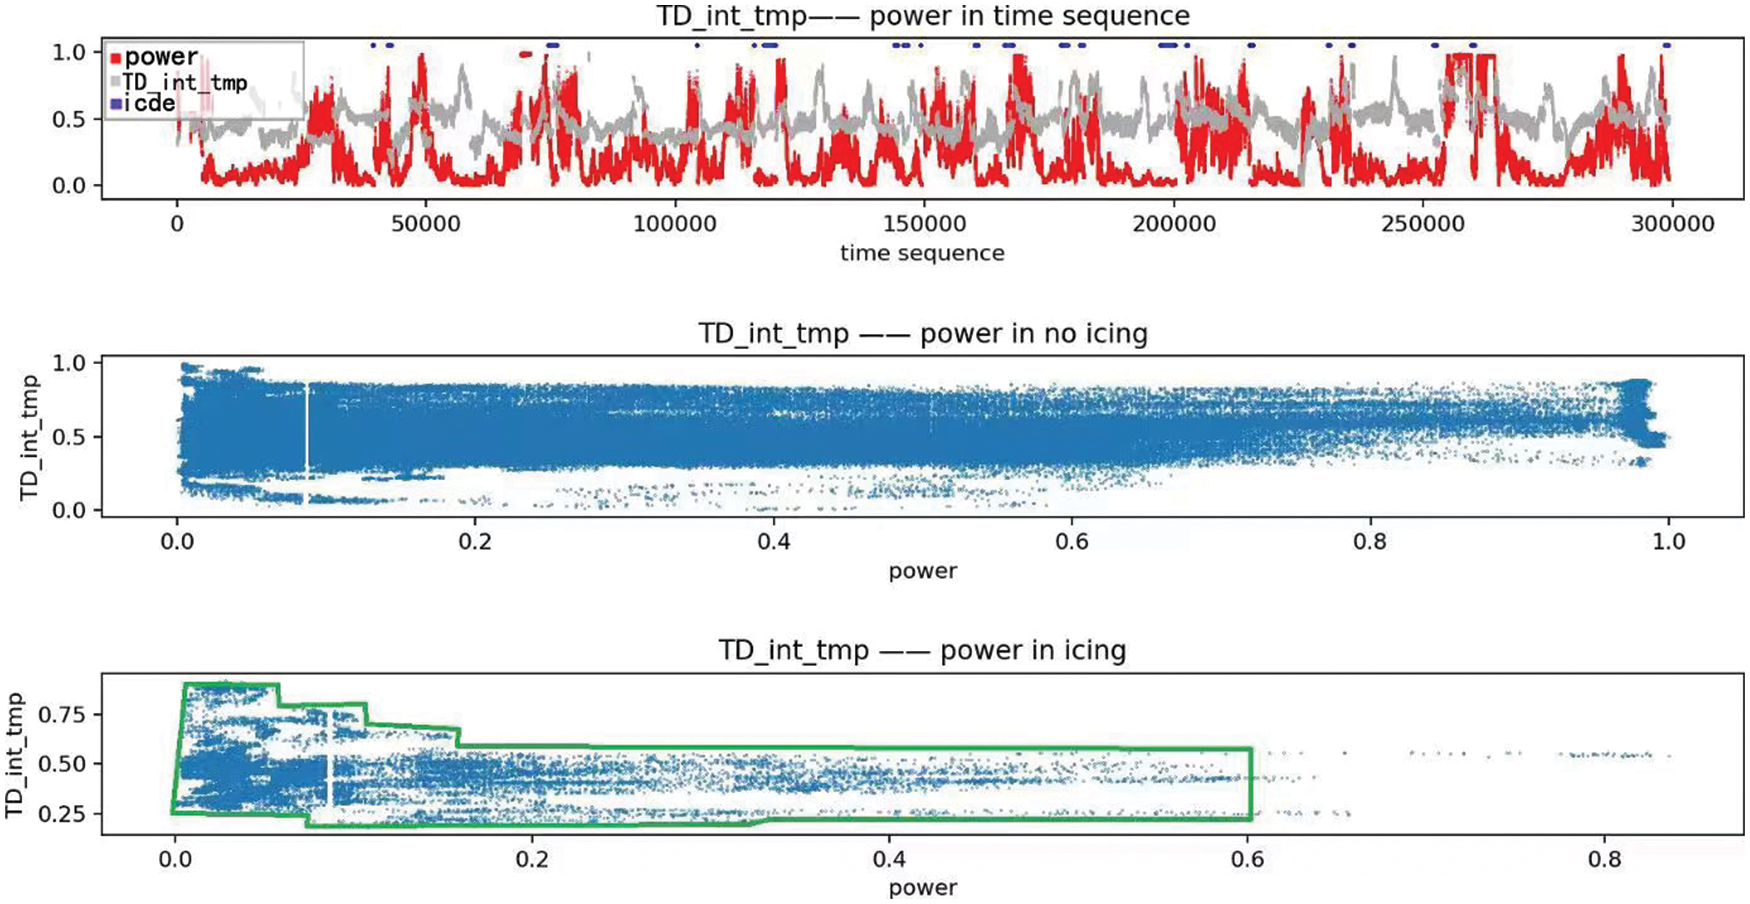
Figure 6: Relationship between temperature difference and power
Fig. 4 shows that when the pitch angle was greater than 0.5, the likelihood of icing of the blades was very low.
The icing of the blades mostly occurs at low temperatures, as shown in Fig. 5.
Fig. 6 shows that the icing of the blades often occurs in a certain range of temperature, leading to reduced power output.
The relationship between the icing of the blades and the feature variables in SCADA is non-linear, and the DNN can be used to fit this relationship in theory [15]. The model of icing the blades of a turbine based on the DNN is shown in Fig. 7.

Figure 7: Model of icing of the blades based on the DNN
The model has five hidden layers and uses ReLU as the activation function cross-entropy as the cost function [16]. The sigmoid function is used in the output layer for logistic regression.
To avoid overfitting when training the model on the data samples and enhance its capability of being used on other datasets, the dropout parameter can be added to the hidden layer [17,18]. The values of dropout were [0, 0.4, 0.3, 0.2, 0.2].
5 Experimental Process and Results
5.1 Indicators of Model Performance
Predictive accuracy is the most important criterion to assess the performance of a model in general, but is insufficient for the problem of binary classification. Therefore, Li et al. [11] proposed a reward function to measure how a model is fitted. It is shown in Eq. (2):
where P1 is the predictive accuracy of data with label 1 and P0 is that of data with label 0. Each occupied 50% of the total weight. The weights here are changeable according to the given circumstance.
The reward function can help avoid the influence of unbalanced classification distribution in the sample data. Its value together with the predictive accuracy determines how well the model fits the data.
The experimental process is presented in Fig. 8. First, the sample data was prepared. After extracting data from the dataset for wind turbine #1 by using the transferred features, they were preprocessed as the sample data. Second, we divided the sample data into training and testing data. The training data was used to train the icing model and the testing data to validate it. Third, we identified the icing model that yielded the highest value of the reward function within the range of the maximum number of epochs. Finally, we used it to predict the data on wind turbine #2, and calculated the values of the reward function as well as predictive accuracy.
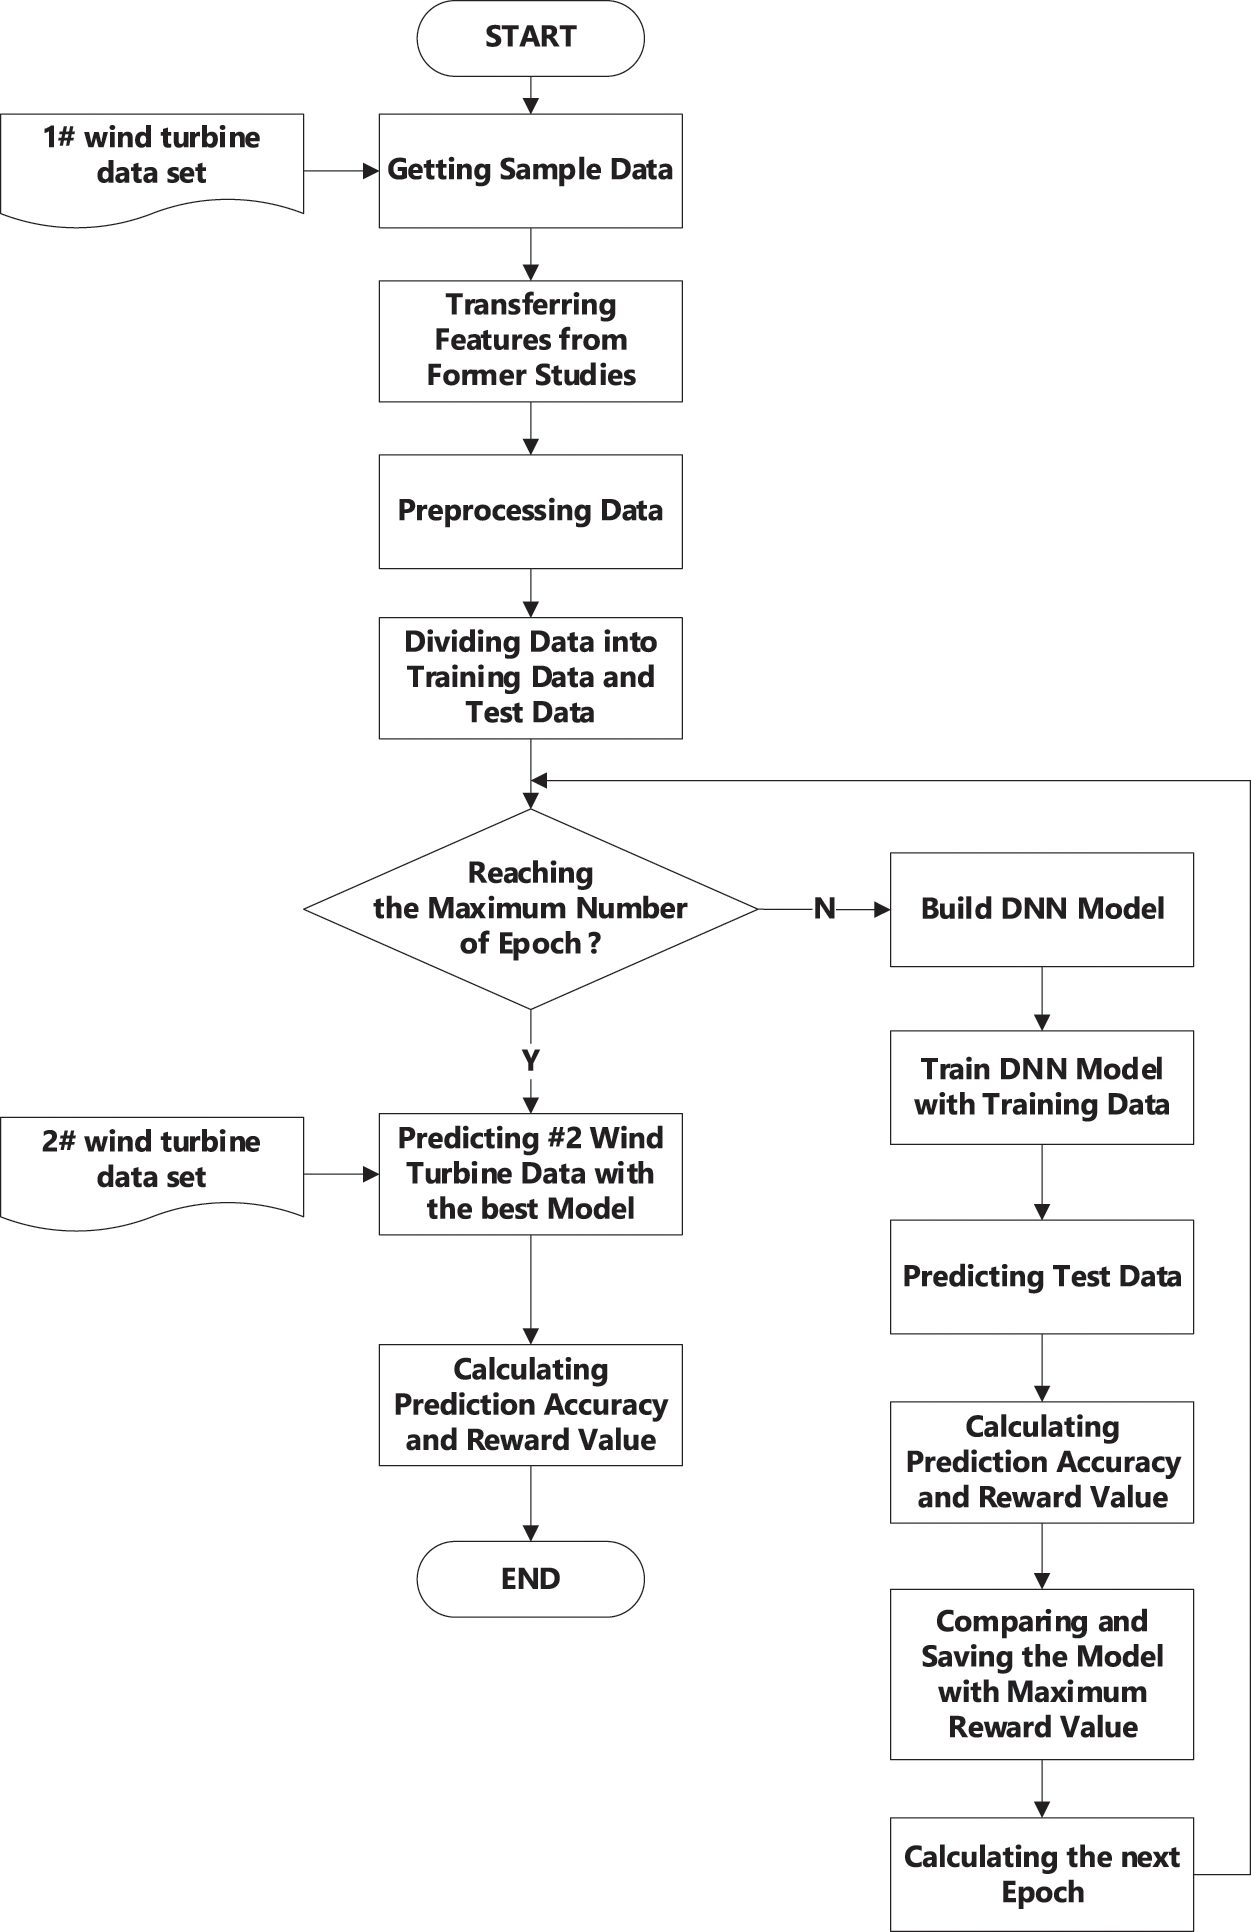
Figure 8: Experiment process of the proposed model
5.3 Experimental Results and Analysis
5.3.1 Effects of Different Models
The data on wind turbines is called time-series data, and the status of ice buildup upon the wind turbine blades is binary. So, the Bi-directional long short-term memory (Bi-LSTM) appears to be a reasonable choice to predict wind fan icing. Xiong et al. built a model of icing the blades of a wind turbine based on Bi-LSTM and the SVM, and reported accurate predictions [9]. However, the effect when the model is used to predict the data for a different turbine is unknown. Therefore, we tested different models, including the neural network (NN), DNN, and LSTM, by using the above experimental process. The results are shown in Table 4.

Table 4 indicates that when only predictive accuracy was considered, LSTM delivered the best performance. But the reward value is lower when LSTM is transferred to a #2 wind fan. It means that there are many blade-icing alarms missing when the model is transferred to another wind fan, which is not acceptable in practical environments. So, DNN is actually the best one.
5.3.2 Effect of Transferred Features
Following the above experimental process, we carried out a contrast test of the 26 transferred features, and the results are presented in Table 5.

We can draw the flowing conclusions from the results in Table 5: 1) The results obtained when the transferred features were used were better than those when all 26 features were used, both in terms of accuracy and the reward function. 2) The accuracy obtained when using wind turbine #1 data was lower than that when using wind turbine #2 data. But Table 4 shows that the value of the reward function for data from wind turbine #1 was higher than that for turbine #2. This is because the target of the test was to obtain a high reward in addition to high accuracy.
Fig. 9 uses a column chart to directly compare the results of wind turbine #2 and the results of the prediction of the DNN model using the transferred features.

Figure 9: Comparison charts between the results of wind turbine #2 and the predictions of the DNN model trained on transferred features
5.3.3 Effect of Further Optimization
The above DNN model still has room for improvement. Some engineers have suggested that the pitch angle must be changed when wind turbines are covered by ice [6]. The variables of the pitch angle (pitch1_angle, pitch2_angle, pitch3_angle) should be combined according to this. For example, the relation between pitch1_angle and power are shown in Fig. 10.

Figure 10: Relation between pitch1_angle and power of the wind turbine
Fig. 10 shows that the icing of the blades occurred only when pitch1_angle was small, and the power output was small in this case. This means that pitch1_angle was closely correlated with the icing of the blades.
A better DNN model is obtained after combining the variables of the pitch angle and using the above experimental process, as shown in Fig. 8, and the results are shown in Table 6.

The DNN model could thus be optimized, which shows that the use of suitable feature variables related to the icing of the blades can improve the model. Admittedly, there is room to improve the current model.
5.3.4 Comparison with Recent Work
In 2020, Xu et al. [7] proposed a model of blade-ice development by using particle swarm optimization and the support vector machine. They obtained reasonably accurate predictions as shown in Table 7.

A comparison of Tables 6 and 7 shows that the model of the blades icing proposed in [7] had higher accuracy (nearly 97%) on the validation dataset than the optimized DNN model (91.58%) proposed in this paper. But an interesting result was obtained on the test dataset: the accuracy of icing free in Table 7 (94.5%) is higher than one in Table 6 (90.03%), on the other hand, the accuracy of icing in Table 7 (80.8%) is lower than one in Table 6 (88.69%). So, it is difficult to decide which model is the better one only by accuracy indicator. However, when the reward indicator was used, we found that its value in Table 6 (89.36) was higher than that in Table 7 (87.65). This indicates that the proposed model obtained more balanced predictions than the one proposed in [7]. Furthermore, it highlights the need for an integrated system of indicators.
Models obtained by using machine learning can help improve products in a variety of industries. In this study, the authors transferred some feature variables related to the icing of the blades of a wind turbine from previous studies to obtain a model that can accurately predict icing. To establish a correlation between a given feature and the status of icing, power was used as a middle feature. This was used to establish a correlation between a continuous variable and the binary status of icing on the blades. The results of experiments showed that the transferred feature variables can obtain better results than the original features. The conclusions of this study are as follows:
1. An optimized model of blade icing upon turbines, based on DNN, was developed that delivered accurate predictions when transferred to data on other turbines. Once the value of the reward function was considered, the DNN was more suitable for such transference of data than LSTM, NN, and logistic regression.
2. It is suitable to build an integrated system of indicators, in addition to simply those regarding accuracy according to the given problem because this can help measure the model along different dimensions. Although the predictive accuracy of the machine learning model is an important indicator of its performance, it is not adequate on its own. The best model maybe not have the highest accuracy.
3. The feature variables, in addition to the training data, directly affected the predictions of the model. The predictions of the model were improved by transferring feature variables related to the icing of the blades from past studies to it, which means that knowledge of the domain can help quickly obtain a better model. Furthermore, the use of the middle feature shows that it can serve as a bridge between feature variables. Such indirect analysis can provide a solution to the problem considered here.
4. A better model can be obtained by using features that are more closely related to the icing of the blades than using original ones, and a better indicators system can help to determine which algorithm is more feasible than using only the metric of accuracy.
Credit Authorship Contribution Statement: Tingshun Li & Jiaohui Xu: Writing–review & editing. Wen Tan: Conceptualization. Zesan Liu & Dadi Wang: Project administration.
Funding Statement: This work was supported by the National Natural Science Foundation of China under Grant No. 61573138.
Conflicts of Interest: The authors declare that they have no conflicts of interest to report regarding the present study.
References
1. Xinhua (2021). China, US issue joint declaration on enhancing climate action. http://english.www.gov.cn/news/internationalexchanges/202111/11/content_WS618d0fe6c6d0df57f98e4d1b.html. [Google Scholar]
2. Ke, S. (2021). The power industry is the main battlefield of energy transformation under the goal of carbon peak and carbon neutralization. http://www.chinasmartgrid.com.cn/news/20210824/639568.shtml. [Google Scholar]
3. Zhang, D., Qin, H. (2021). Wind power will get broad prospects with helping double carbon green development. https://news.bjx.com.cn/html/20210708/1162787.shtml. [Google Scholar]
4. Liu, T., Meng, W., Dai, C. (2019). An overview of wind turbine generator anti-freezing and deicing. Hubei Electric Power, 43(1), 14–21. [Google Scholar]
5. Katsaprakakis, D. A., Papadakis, N., Ntintakis, I. (2021). A comprehensive analysis of wind turbine blade damage. Energies, 14(18), 1–31. DOI 10.3390/en14185974. [Google Scholar] [CrossRef]
6. Li, C. (2019). Discussion on the influence and countermeasures of wind turbine icing. Science and Technology Innovation Herald, 15, 93–94. [Google Scholar]
7. Xu, J., Tan, W., Li, T. (2020). Predicting fan blade icing by using particle swarm optimization and support vector machine algorithm. Computers and Electrical Engineering, 87(1), 106751–106753. DOI 10.1016/j.compeleceng.2020.106751. [Google Scholar] [CrossRef]
8. Rizk, P., Al Saleh, N., Younes, R., Ilinca, A., Khoder, J. et al. (2020). Hyperspectral imaging applied for the detection of wind turbine blade damage and icing. Remote Sensing Applications Society and Environment, 18(11), 100291–100293. DOI 10.1016/j.rsase.2020.100291. [Google Scholar] [CrossRef]
9. Wei, Z., Jiang, Z., Xiong, Q. (2020). Analysis of fan blade icing based on SCADA monitoring system. Science Wind, 3, 180–182. [Google Scholar]
10. Xiong, C. Q., He, Z. Q., Zhang, Y. N., Huang, S. (2021). Short-term icing status prediction model of wind turbine blades based on Bi-LSTM and SVM models. Sichuan Electric Power Technology, 44(3), 88–94. [Google Scholar]
11. Li, T., Tan, W., Liu, Z. (2019). A hybrid model based on logistic regression algorithm and extraction algorithm using reward extremum to real-time detect blade icing alarm. International Journal of Pattern Recognition and Artificial Intelligence, 2019(36), 1955016. DOI 10.1142/S0218001419550164. [Google Scholar] [CrossRef]
12. Li, H. (2012). Statistical learning methods (monograph). Tsinghua University Press. [Google Scholar]
13. Pandeya, Y. R., Lee, J. (2019). Domestic cat sound classification using transfer learning. International Journal of Fuzzy Logic & Intelligent Systems, 2019, 18. [Google Scholar]
14. Goshima, N., Maeda, T., Kamada, Y., Tada, T., Hanamura, M. et al. (2020). Study on influence of blade icing on operational characteristics of wind turbine at cold climate. Journal of Physics: Conference Series, 1618(5), 052021–052030. DOI 10.1088/1742-6596/1618/5/052021. [Google Scholar] [CrossRef]
15. Wen, K., Wei, Y., Dong, X. (2019). Survey of application of deep convolution neural network in image aesthetic evaluation. Computer Engineering and Applications, 55(15), 13–23,58. [Google Scholar]
16. Chen, Y., Zhang, F. (2018). Research on CNN traffic sign recognition method based on cross entropy. Software Guide, 17(12), 28–32. [Google Scholar]
17. Dang, J., Cong, X. (2021). Research on hybrid stock index forecasting model based on CNN and GRU. Computer Engineering and Applications, 57(16), 167–174. [Google Scholar]
18. Srivastava, N., Hinton, G., Krizhevsky, A., Sutskever, I., Salakhutdinov, R. (2014). Dropout: A simple way to prevent neural networks from overfitting. Journal of Machine Learning Research, 15(1), 1929–1958. [Google Scholar]
Cite This Article
 Copyright © 2023 The Author(s). Published by Tech Science Press.
This work is licensed under a Creative Commons Attribution 4.0 International License , which permits unrestricted use, distribution, and reproduction in any medium, provided the original work is properly cited.
 Downloads
 Citation Tools