| Computer Modeling in Engineering & Sciences |
DOI: 10.32604/cmes.2022.021160
ARTICLE
A Dynamic Management Scheme for Internet of Things (IoT) Environments: Simulation and Performance Evaluation
Department of Information Technology, College of Computers and Information Technology, Taif University, P.O. Box 11099, Taif, 21944, Saudi Arabia
*Corresponding Author: Omar Said. Email: o.saeed@tu.edu.sa
Received: 30 December 2021; Accepted: 09 March 2022
Abstract: In recent years, the Internet of Things (IoT) technology has been considered one of the most attractive fields for researchers due to its aspirations and implications for society and life as a whole. The IoT environment contains vast numbers of devices, equipment, and heterogeneous users who generate massive amounts of data. Furthermore, things’ entry into and exit from IoT systems occur dynamically, changing the topology and content of IoT networks very quickly. Therefore, managing IoT environments is among the most pressing challenges. This paper proposes an adaptive and dynamic scheme for managing IoT environments is proposed. This management scheme depends on the use of previous management methodologies, considering two main factors. The first factor is network status, which is determined in real-time. The second factor is a management method’s suitability according to its desired administration. To test the proposed management scheme, a simulation environment is created using NS3. The metrics used to measure the management scheme performance are bandwidth consumption, energy consumption, packet loss, throughput, delay, usage rate of individual management techniques, and transformation. The simulation results prove that the proposed management scheme outperformed the individual 6LowPAN-SNMP, CoAP, and LWM2M management schemes.
Keywords: Internet of Things; IoT management; IoT simulation; SNMP; neural networks; big data
Network management has become a necessity for all network systems because this management provides multiple methods to monitor network performance, detect faults, gather information about a network, control its operations, as well as other functions. The network management process generally requires a set of methods and protocols that support all types of networks and their components in addition to allowing exchanges of information between managers and agents. Due to great developments and diversity in communication devices and network systems, as well as an increase in internet speed and availability in most places, networks’ components and characteristics may have changed rapidly in terms of storage, processing capabilities, power consumption, number of users, types of devices, and other elements. Devices in network management are classified as unconstrained or constrained. Unconstrained devices do not have any restrictions that limit their processing, such as power and storage resources, and these devices are usually found in traditional networks that are typically managed—such as routers, switches, and servers. Constrained devices have limited resources, such as peripherals, sensors, and mobile devices. There are many types of network management—such as performance, security, and configuration—which must be highly accurate and operate smoothly with heterogeneous technologies and network components [1–4].
Recently, a new technology called the internet of things (IoT) has been developed. The IoT environment contains billions of different nodes and users in addition to heterogeneous networks. Also, it incorporates different techniques into databases, computations, and equipment. The network management success factors in any environment lie in a network ability to deal with heterogeneous components. Therefore, creating a complete network management system in an IoT environment that relies primarily on different technologies is among the most important challenges. Configuration, authentication, monitoring, maintenance, and provisioning are considered the tasks of IoT management devices [5–7].
There are two options with which to address the network management challenge in the IoT environment. The first option is to create an integrated network management model that considers all the complex characteristics of IoT environments. This option is difficult (if not impossible) due to such environments changing and escalating complexity. The second option is to use a set of available network management methods, one of which is applied according to a network status and user needs. Therefore, this paper's motivation is to propose a scheme with which to measure network performance metrics in real-time and compare these performance metrics with the approximated requirements of corresponding metrics of available management methods. Next, a suitable management method is selected after considering the primary management targets for the IoT environment, such as performance enhancement and security guarantee. Hence, the proposed management scheme will be able to deal with all IoT cases by choosing an optimal management technique and synthesizing it according to the network condition in real-time, which will positively affect the performance of the IoT system.
The paper offers the following contributions:
• It proposes a network management scheme to select the most suitable network management methodology for the IoT environment.
• It simulates an IoT environment to test the proposed management scheme.
• It presents and discusses the simulation results.
The remainder of this paper is structured as follows. Section 2 introduces the paper-related works. Section 3 demonstrates and discusses the proposed management scheme. Section 4 introduces the simulation environment structure. Section 5 presents and discusses the simulation results. Finally, Section 6 presents this paper’s conclusion and its future work.
The researches related to the paper are summarized as follows: Ramírez et al. [8] proposed a management system for IoT environments based on artificial intelligence (AI). This system is centralized and based on machine learning. The proposed system has mainly been used for resource discovery and allocation. Its main weakness is its performance measurement. Kamienski, introduced a management framework for context life cycles. This framework is used by administrators and developers to harness the wealth of information generated by IoT systems. Its main weaknesses are its performance measurement and its neglect of the IoT real-time status [9]. Novo, introduced a management system for IoT environments. This system has been distributed and used for security issues. It uses blockchain technology. The system’s main weakness is its neglect of IoT environment statuses [10]. Wu et al. [11] proposed an overlay structure based on distributed hashing technology. This structure has been used to control scalability, load balance, and fault tolerance issues. However, this simulation infrastructure did not represent the scalability issue accurately, so its results cannot be considered for large-scale IoT environments. Chen et al. [12] presented a protocol to manage large-scale cloud IoT systems. It permits users to submit their experiences with IoT systems’ services. This protocol simulation results are insufficient due to a lack of IoT representation and performance metrics’ measurement. Manogaran et al. [13] developed a management scheme for IoT data handling to extract user requests that are interpreted incorrectly. This management model uses machine learning technology, but it has inaccurate proof. Bashir et al. proposed a meta-model to manage big data in IoT environments. Their meta-model has facilitated cooperation between big-data management models and analytics ecosystems in smart environments. This model did not consider other big-data effects on IoT systems, such as storage, processing, and transmission [14]. Zhang et al. [15] introduced a model that reflects the role of green energy in addition to smart electrical grids. This model has been used for energy management by mapping link costs with utility functions of energy consumption. The experiments used to prove this claim were insufficient. Murugesan et al. [16] introduced a management framework for garbage monitoring in a smart-city, IoT-based system. This framework aims to save human effort, time, and charges. The framework implementation has faced many shortages, such as the number of nodes in the IoT system. Narang et al. [17] introduced a management model for IoT social networks. This model is based on both device intelligence and human intelligence. Additionally, it uses a mixture of dynamic and static graphs. This framework is considered a particular purpose. Rahman [18] presented a deep-learning-based architecture for a waste-management IoT system. It uses a microcontroller and sensors for intelligent trash bin management. Its performance metrics are insufficient because they only measure accuracy, and real-time metrics are not calculated. Eghbali et al. [19] introduced an approach to accelerate the management process between devices and clusters in IoT environments. This approach focuses on the load balancing issue. The experiments used to test the performance of this approach were inaccurate due to insufficient IoT parameters. Their simulation results were based on inaccurate environment representation. Kim et al. [20] presented a new active queue management (AQM) approach for fog/edge nodes. These algorithms are self-learning. They achieved a trade-off between throughput and queuing delays. The simulation results of these algorithms are considered inaccurate due to their weak IoT representation. Shayesteh et al. considered a monitoring service by proposing a hybrid trust computation scheme based on Bayesian learning. Their simulation experiments require enhancement because IoT networks’ real-time status was not considered [21]. Alelaiwi [22] introduced a cloud confederation model that determines the best choices for cloud providers. Also, they demonstrated a multi-objective optimization model to select the ideal cloud. This model’s main weakness is its neglect of other IoT aspects, such as security. Alshehri et al. proposed a fuzzy-logic-based model to detect contradictory behavior attacks and malicious nodes. Moreover, they introduced a secure message system. This model is considered a special-purpose solution [23]. Jeong et al. [24] proposed another data management model related to IoT security issues. This model is based on blockchain technology. Antunes et al. [25] presented a management platform for IoT devices. It operated locally and globally in addition to managing computing issues in an IoT environment. The model’s primary deficiency is that its performance evaluation lacked accuracy. Taneja et al. [26] introduced a management model for fog computing assistance in IoT systems to analyze animal behavior. The model implementation did not consider the different networks that may be found in an IoT system.
According to the discussion above, the works related to the current research topic have two major weaknesses. The first weakness is neglecting the status of IoT networks when applying a management methodology. Thus, a management methodology may itself represent an overhead in the IoT system. The second weakness is testing proposed solutions’ performance based on inaccurate representations of IoT environments that do not reflect such environments’ specifications, such as their scalability, heterogeneous components, and large-scale communication systems. In addition, minor works related to this paper have other specific weaknesses. Therefore, a network management model for IoT environments is proposed. This management model avoids the related work defects that are mentioned above.
The first sub-section of the current section discusses this proposed management scheme for IoT environments. The second sub-section presents a mathematical analysis.
3.1 Proposed Scheme Description
The proposed management scheme comprises four layers. The first layer is called “gather,” and it is used to determine and collect network management parameters, such as delays, packet loss ratios, and throughput. The collection process is achieved in real-time using monitor agents’ systems [27,28] because the parameters of the IoT environment may change periodically. The “gather” layer is represented as a group of agents collecting and sending data to the lower layer. The second layer is called “evaluation”, and it is used to analyze network parameters to determine the network status. It is represented as a neural network that takes the output of the “gather” layer as the input for the neural network layer and transforms it into quantitative values, which represent the output of the last layer in this neural network. Several layers are determined between the input and output depending on the neural network model used. The third layer of the proposed management scheme is called “selection”. This layer takes the output of the “evaluation” layer and determines the suitable network management technique, considering the most urgently required management target (i.e., security, quality of services (QoS), etc.). This layer is represented using smart agents. The fourth layer is called “adaptation”. This layer is used to adapt the selected network management methodology accomplished by the “selection” layer. In network bottlenecks or starvation cases, a new version will be generated from the originally selected method. The adaptation process is simply achieved by deleting some functions or fields and controlling the management process, such as sending or receiving messages (numbers or times), provided that the new version has not negatively affected the original version’s general efficiency. This layer is represented using a mapping process between the network status and the required parameters for network management methodologies. Fig. 1 demonstrates an overall view of the proposed management scheme. Fig. 2 shows the flow of processes in the proposed management scheme.
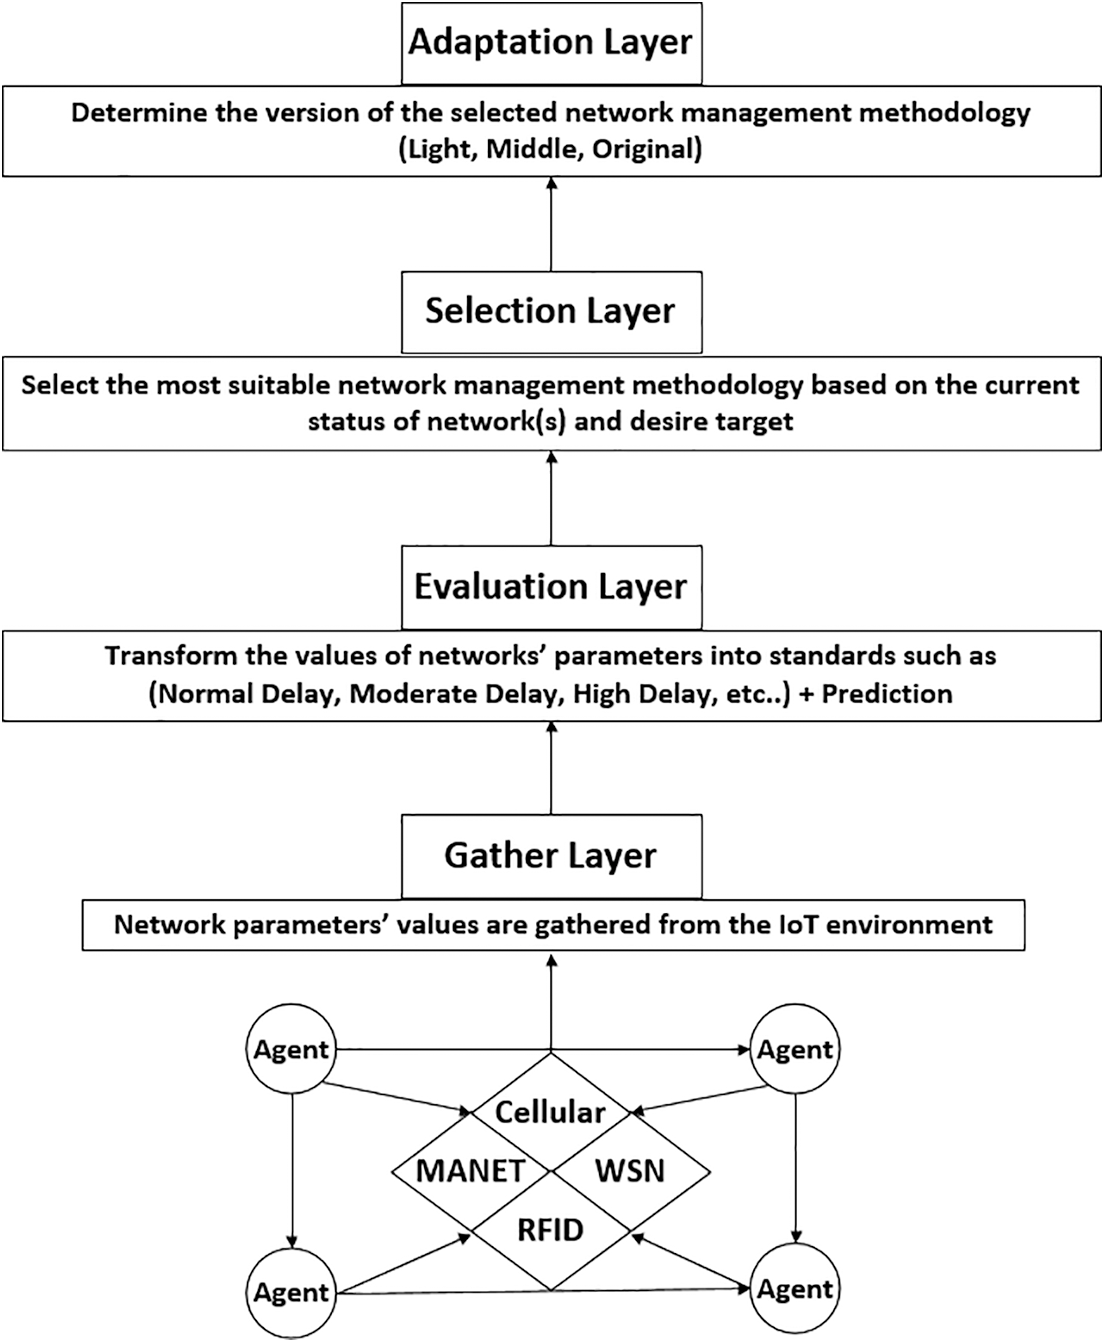
Figure 1: An overall view of the proposed management scheme
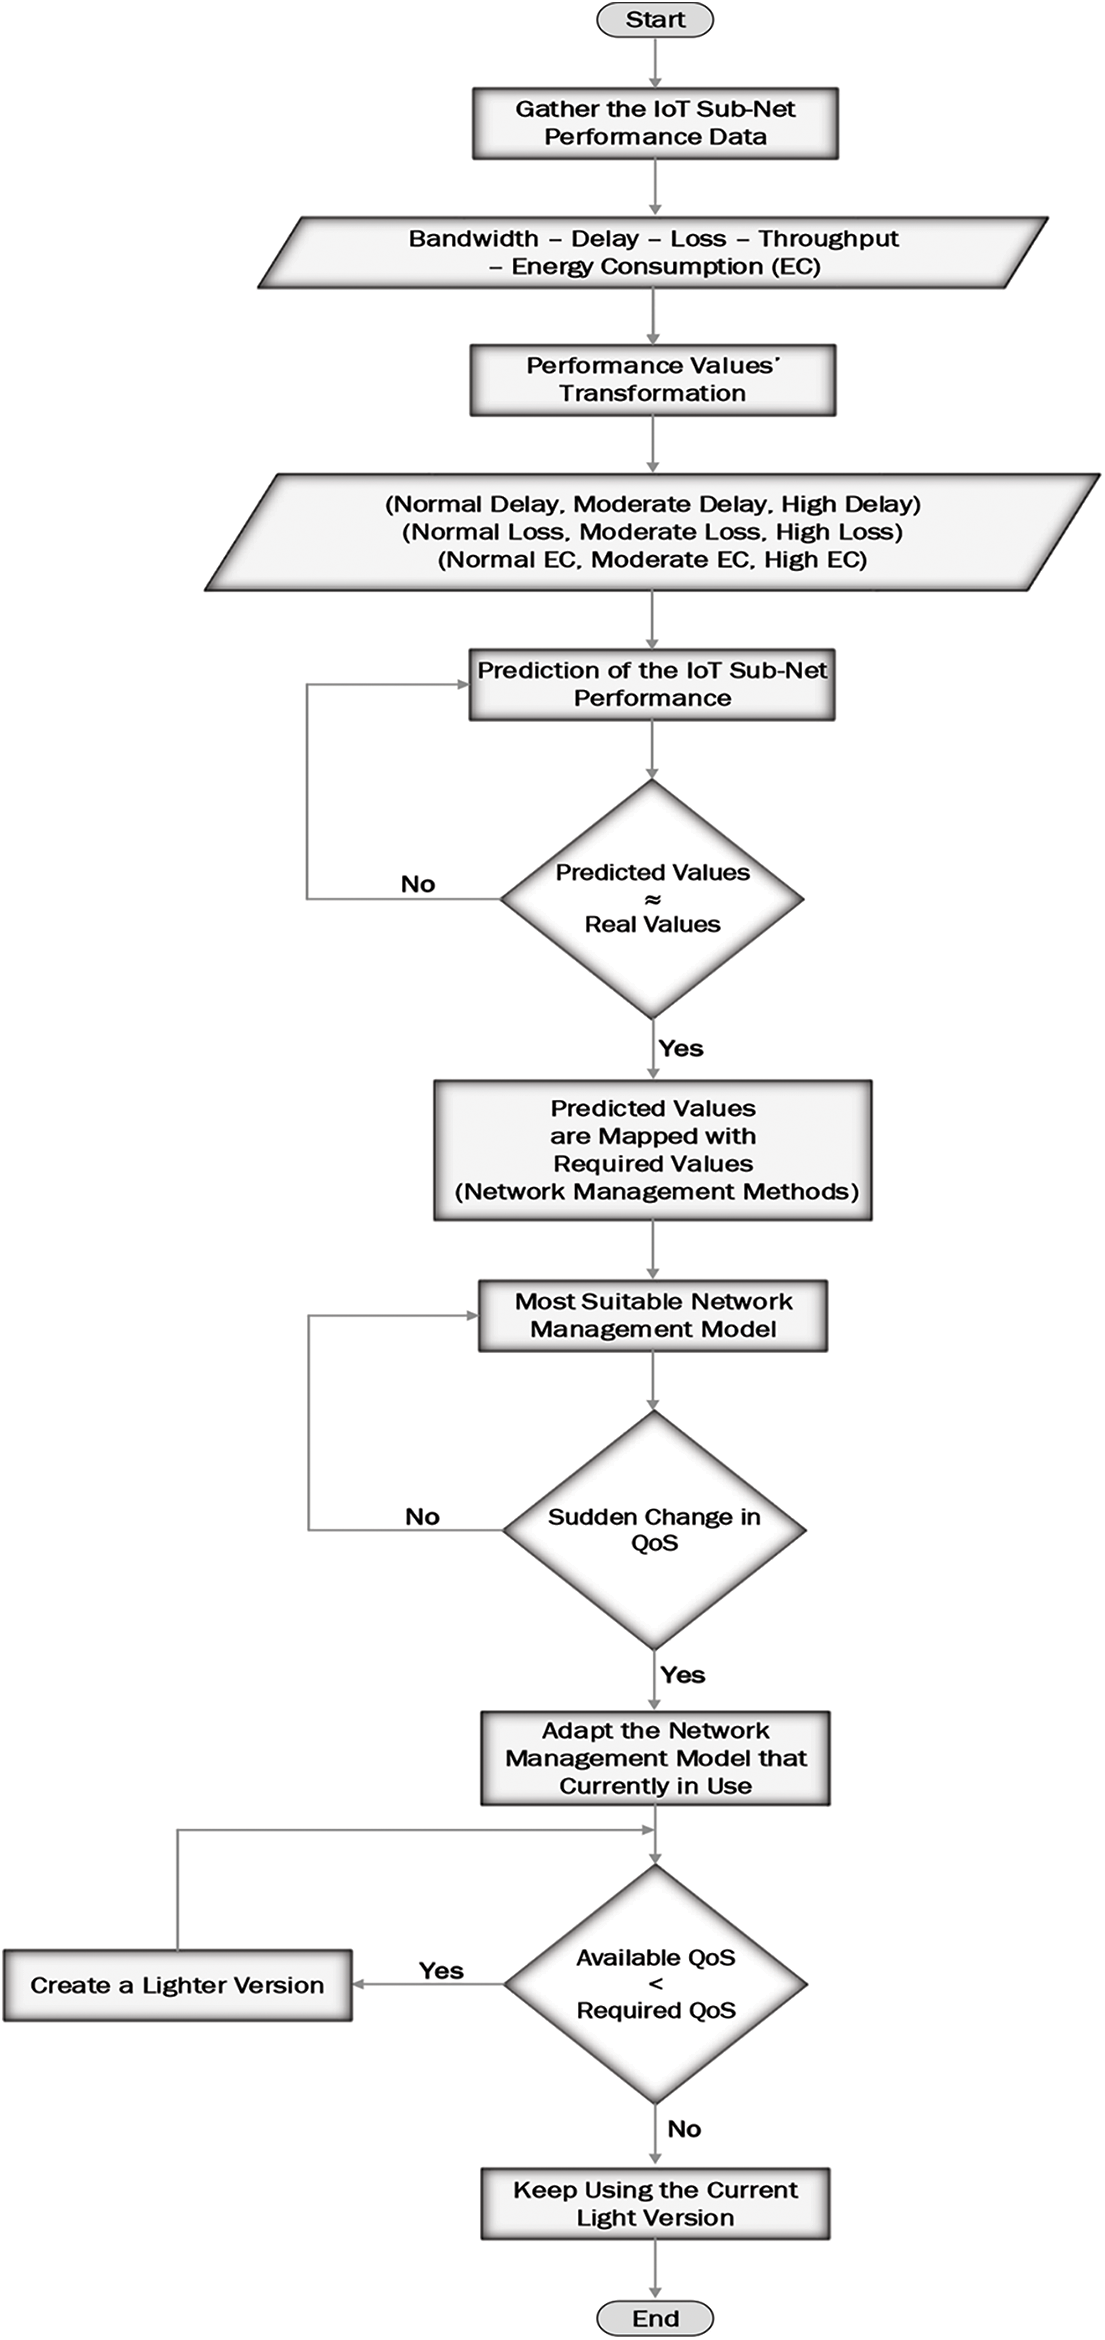
Figure 2: The flow of processes in the proposed management scheme
The “gather” layer collects information from different networks in an IoT environment. This information pertains to the predetermined performance metrics. Each IoT performance metric corresponds with an importance level. This level changes periodically, according to the current IoT status. For example, when the data type that is exchanged through the IoT environment is multimedia, the delay performance metric will have a first importance level. This ranking is explained by multimedia data having a high sensitivity to delays. The prioritization process of the performance metrics is determined using the technique stated by [29]. Each agent is responsible for gathering information about a performance metric. The agent stores its data in a storage medium (database). These agents communicate with each other so that, in the case of any agent failure, an agent will be replaced by an alternative agent. Additionally, the database used to store the IoT performance metric values is distributed. The layer agents (local agents) communicate with a general agent (or multiple general agents) that collects the performance metrics’ values and stores them in a database or multiple databases. The communication between local agents and general agents is achieved through management messages using three types of states. The first state is called “regular”, and it reflects the value of an agent performance metric and stores this value in its database. The second state is called “request/reply”, which allows the general agent to request one specific performance metric value from an agent at a time. The third state is called “sudden”, and it allows the local agent to send a value for a specific performance metric in the case of an extreme change in its value. The number of messages for the three states may increase or decrease according to the status of the network(s) (i.e., in the case of bottlenecks, the number of management messages decreases, based on the performance metrics’ importance levels), see Fig. 3.
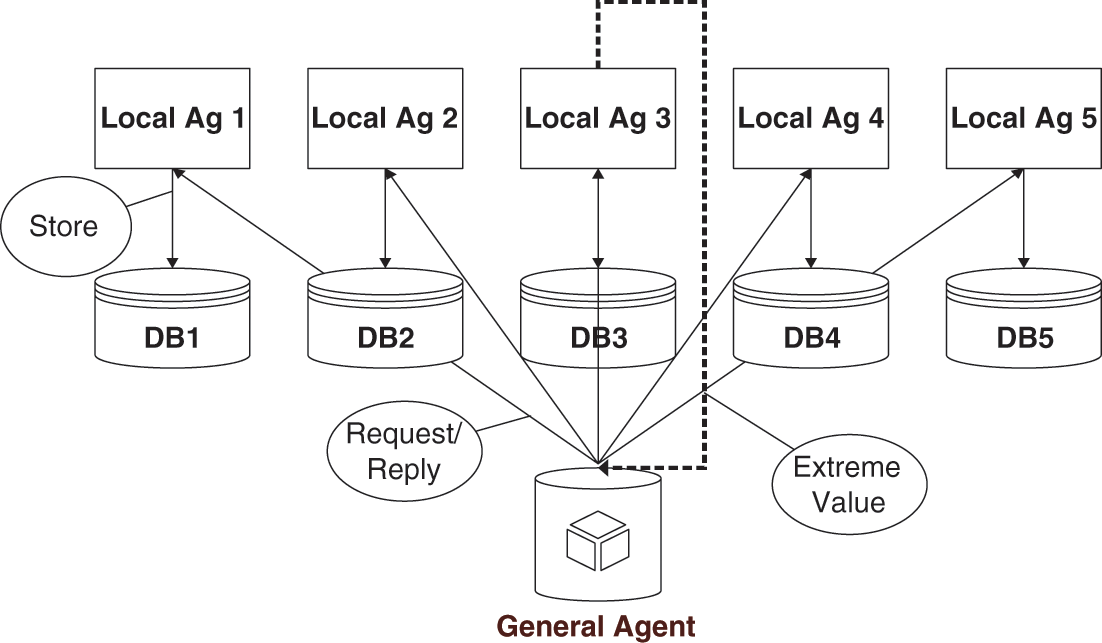
Figure 3: An overall view of the “gather” layer processes
The agent structure consists of four main modules. The first module is used to detect the data type. The second module is used to detect the performance metric type. The third module is used to detect the importance level of the intended performance metric. The fourth module is used to detect the value of its performance metric. The agent in the proposed scheme is autonomous. In an IoT environment, things are organized into clusters. A sufficient number of agents supports each cluster. These agents are used to monitor the cluster performance metrics in real-time. Each agent’s work should be done according to one of two ideas. In the first idea, each agent is installed on a monitor host. Hence, it directly acquires the value of its performance metric periodically. In the second idea, the agent is installed on each host in the cluster. Therefore, each agent receives the required data, which is used to calculate its performance metric values. After that, each agent sends the acquired (or calculated) values to the upper-layer agent. The number of things in each cluster is determined depending on their types, and the distance between them. Moreover, the number of agents in each cluster is determined depending on the agent work idea that will be implemented in that cluster. The number of agents’ layers is determined depending on the cluster size. The higher layer(s) (i.e., the second layer after the local agents’ layer) is responsible for collecting and organizing the performance metrics’ values. Then, it sends these values to the second layer in the proposed management scheme. As stated above, the IoT environment comprises different networks. Therefore, each agent adapts the method that will be used to calculate its assigned performance metric. The importance of each performance metric is determined by the system administrator(s) and saved in a simple file. Therefore, each agent connects to the importance file to be up-to-date in case of an importance level change, see Fig. 4.
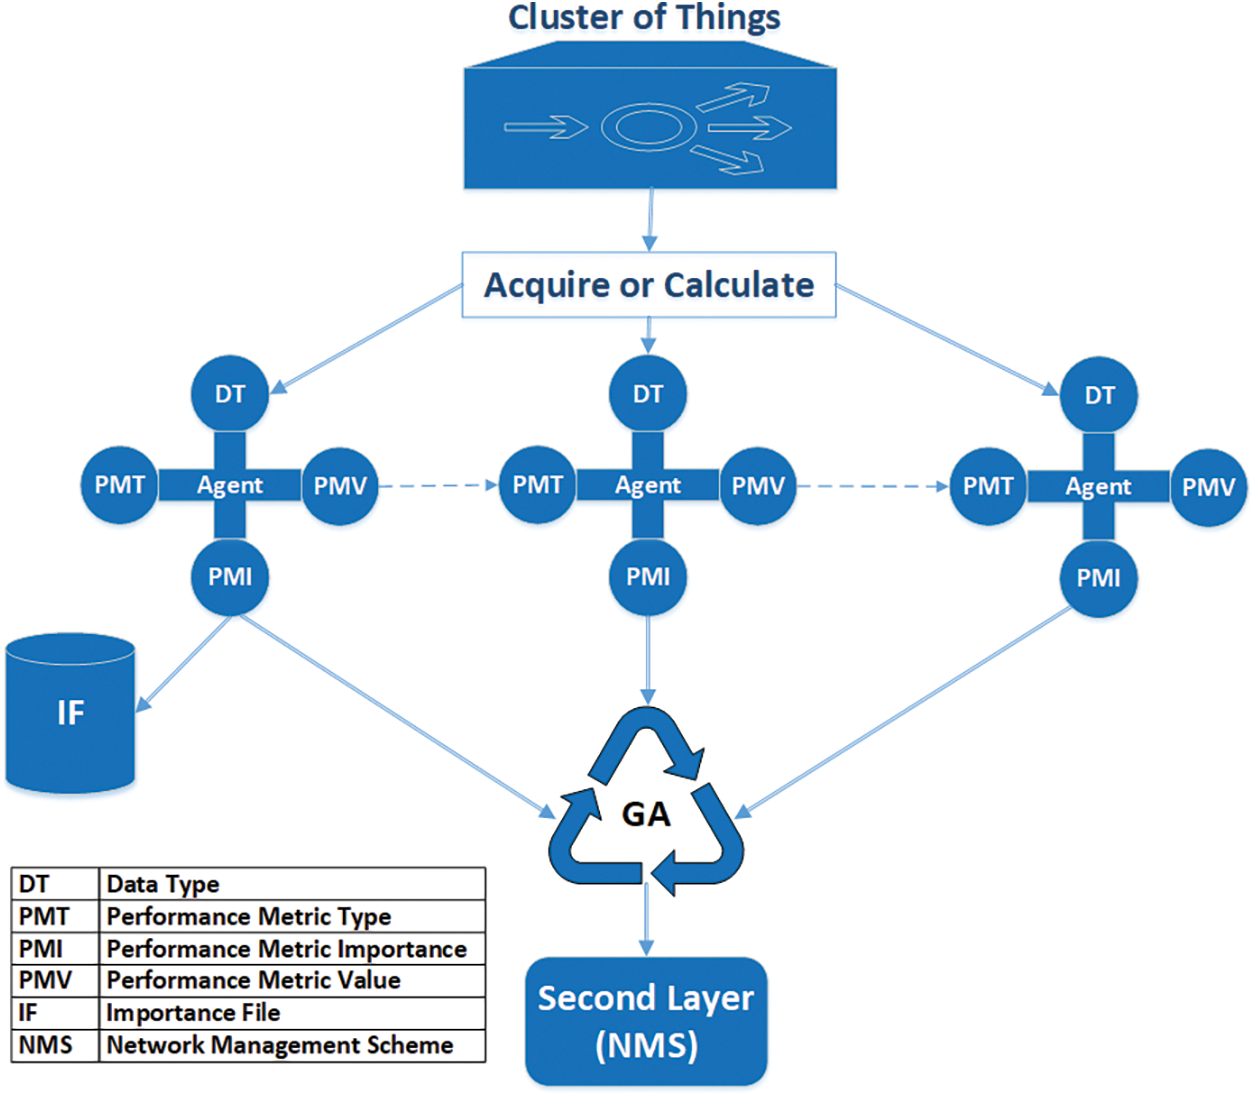
Figure 4: A specific view of the interaction between local and general agents
The “evaluation” layer collects the values from the general agents in the first layer. These values are entered as inputs into the neural network model. The neural network model analyzes the general agents’ values and predicts the output. The neural network comprises four layers. The first layer takes the output of the general agents found in the first layer. The second layer classifies the QoS parameters according to the network type. Since the IoT environment comprises different networks, these metrics may differ from one network to another. Therefore, the second layer should deal with each parameter according to its network to produce an accurate prediction. The IoT environment may comprise wireless sensor network (WSN), radio frequency identification (RFID), mobile ad-hoc network (MANET), and cellular. Delays in WSN are calculated with different methods than other networks (RFID, MANET, and cellular), see Fig. 5. The third layer is used to predict the QoS parameter according to the network type. The fourth layer is used to predict the QoS parameters for the entire IoT system. Therefore, the output of the second layer in the proposed management scheme determines the QoS parameters accurately. The full description of the neural network and its mathematical analysis have been stated by [30,31].
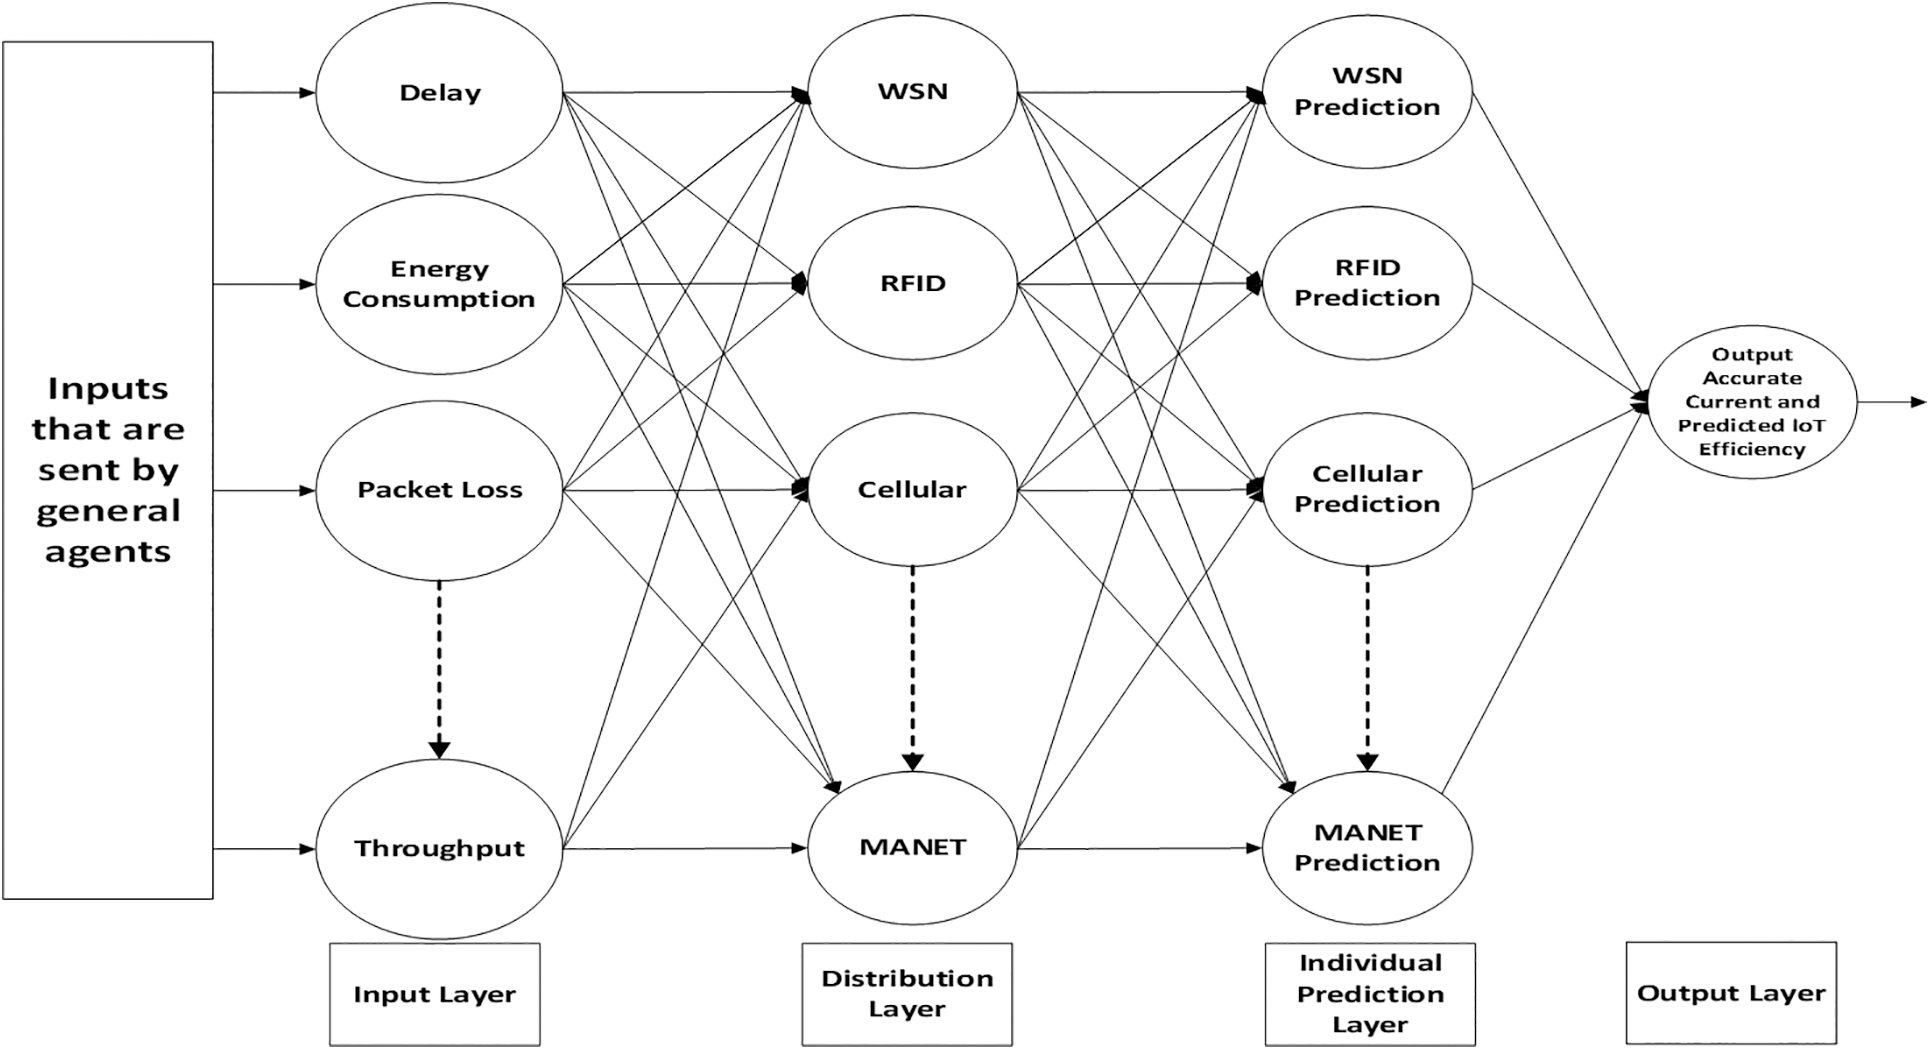
Figure 5: A simple view of the “evaluation” layer processes
For more clarification, the prediction layer in the neural network is described. It works as follows: the features of the IoT environment are extracted. These features include things’ specifications (hardware and software), specifications of the network on which these things are located, services that are provided to these things in a specific region, and specifications of their coverage tool. These features are classified into two groups: general and special. The general features are network and coverage tool specifications. The special features are the things’ specifications and their provided services. The features of things, networks, services, and coverage tools are clustered individually. As the characteristics of the IoT environment change fast and dynamically, the above features may be changed periodically. So, the soft cluster technique is used to determine the probability of each thing being found in a cluster instead of asserting the existence of that thing somewhere and the stability of its specifications. Hence, fuzzy c-means (FCM) are used to achieve the clustering process for the extracted features.
There are many overlapped areas, which may result in each cluster. To solve this challenge then, the futures of the most dominant networks in the cluster are considered. In the absence of a dominant network (i.e., each network type has the same number of devices in the cluster), the big cluster is divided into many small clusters and the prediction process will be executed on them. The training process is executed using datasets, which are extracted in the simulation process, to predict the performance metrics such as bandwidth consumption, energy consumption, packet loss, throughput, and delay. The relationship between the general and special features is used in the prediction process. For example, things that have the same specifications and are located in the same network type around the central hub of their cluster are approximately provided with the same services [32]. Moreover, the type of coverage tool and its features are used to determine the extent to which the QoS of a particular thing is changed, see Fig. 6.
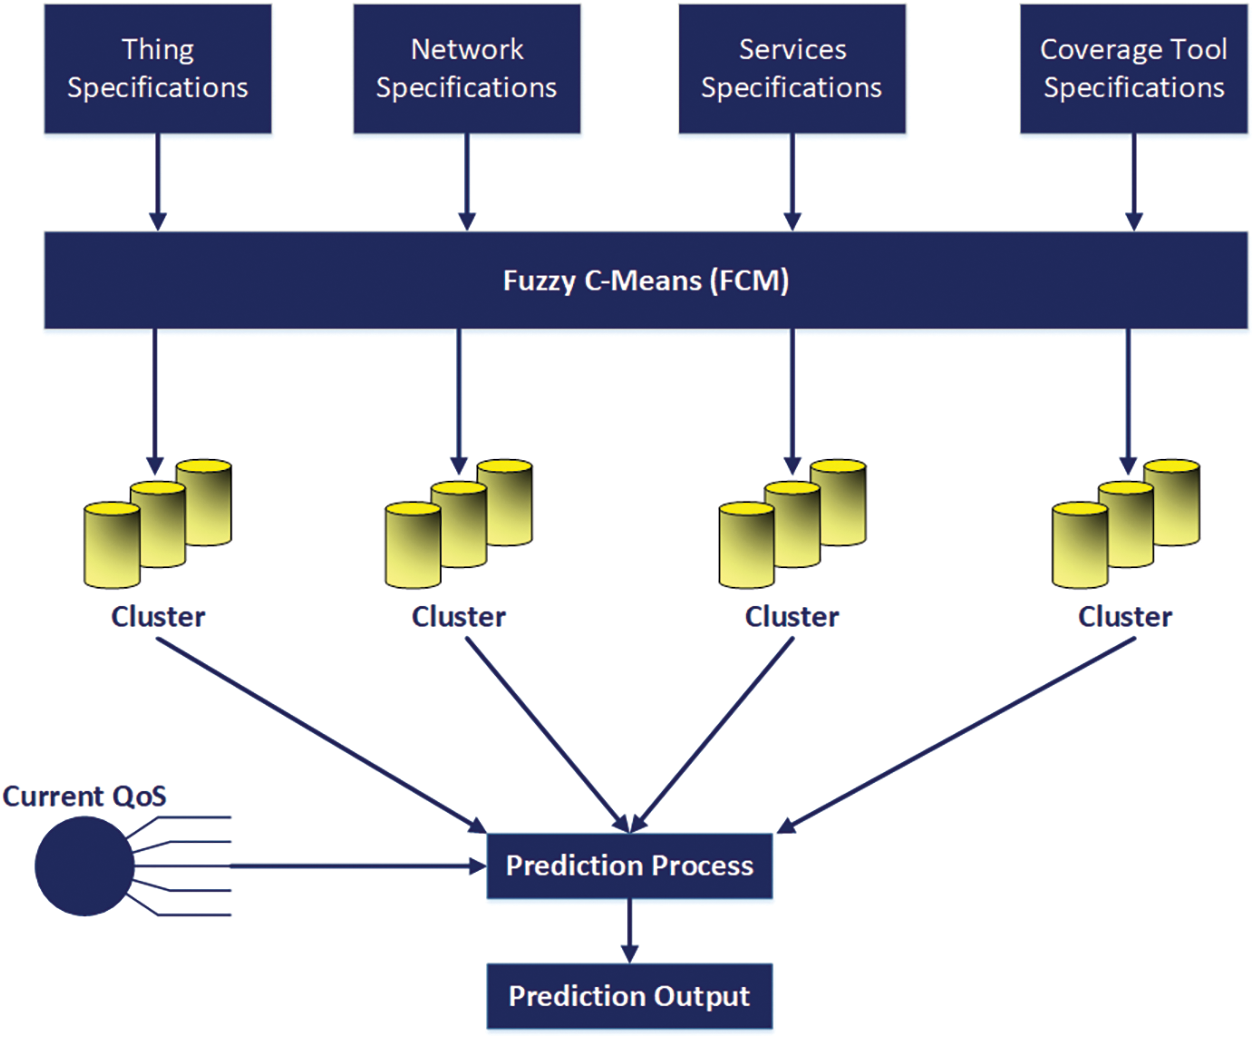
Figure 6: A specific view of the “prediction” layer processes
The third layer in the proposed management scheme is called the “selection” layer. It determines the most suitable network methodology. This selection process depends on three main factors. The first and second factors are the outputs of the second layer (i.e., predictions of network efficiency and current network efficiency). The third factor is administrator requirements, including high security or low delays. This layer function is achieved using an expert system that manages a simple database system comprising facts and rules that are mapped to define the output (i.e., the most suitable management technique), such as the system explained by [33], see Fig. 7.
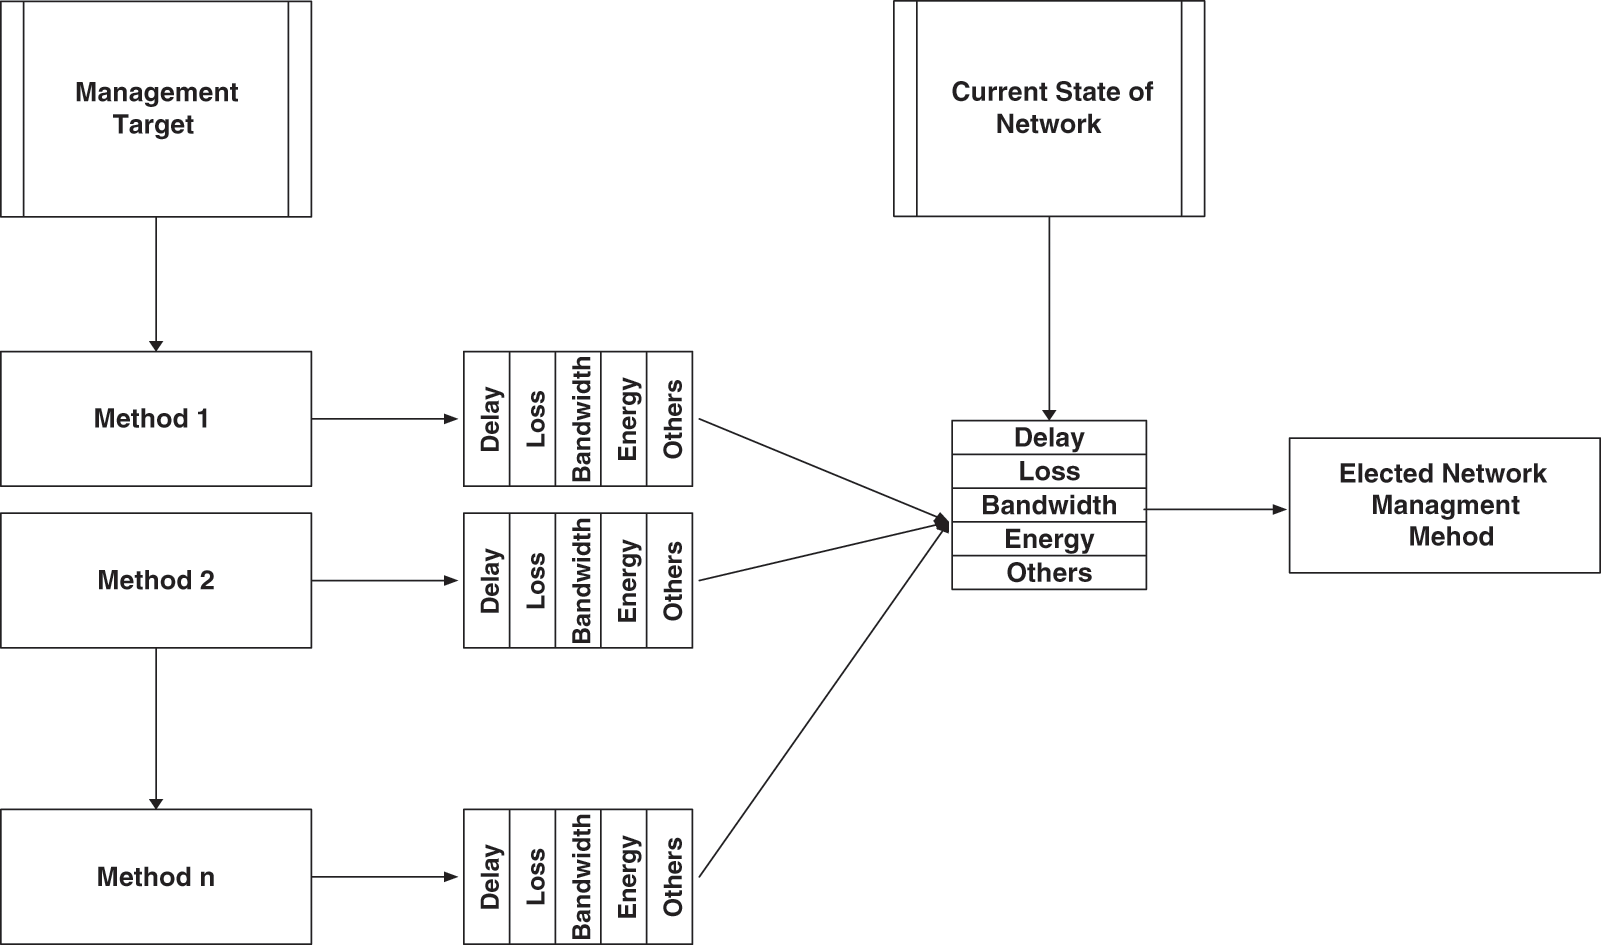
Figure 7: A simple view of the “selection” layer processes
For more clarification, the expert system is described. The main components of this expert system are knowledge base and inference engine. The knowledge base comprises the current and predicted performance metrics in addition to the corresponding required performance metrics, which are related to the individual management techniques. These performance metrics’ values are received from the second layer of the proposed management scheme. The results of their experiments predetermine the required QoSs for each individual management technique. As regards the inference engine, it is responsible for the main processing functions of the expert system. It comprises the rules that are used to obtain the most suitable management technique. The elements, which are used to create the expert system rules, are the coverage tool specs, performance metrics change rate, network specifications, and managed things specs. Simply, suppose that “CD” represents the current delay, “PD” represents the predicted delay, and “RD” represents the required delay of the management technique. (CD, PD) ≈ RD → (W), where “W” is the weight of the delay performance factor, determined depending on the extent of the convergence between the required and current delays. The weight of other important metrics is calculated using their specific rules and added to the delayed weight to extract the general (overall) weight. The weight calculation process considers network type, coverage tool cost, and the importance of data that is transmitted through the network in the IoT environment. The general weight of each management technique is calculated. Hence, the management technique with the highest general weight will be selected, see Fig. 8.
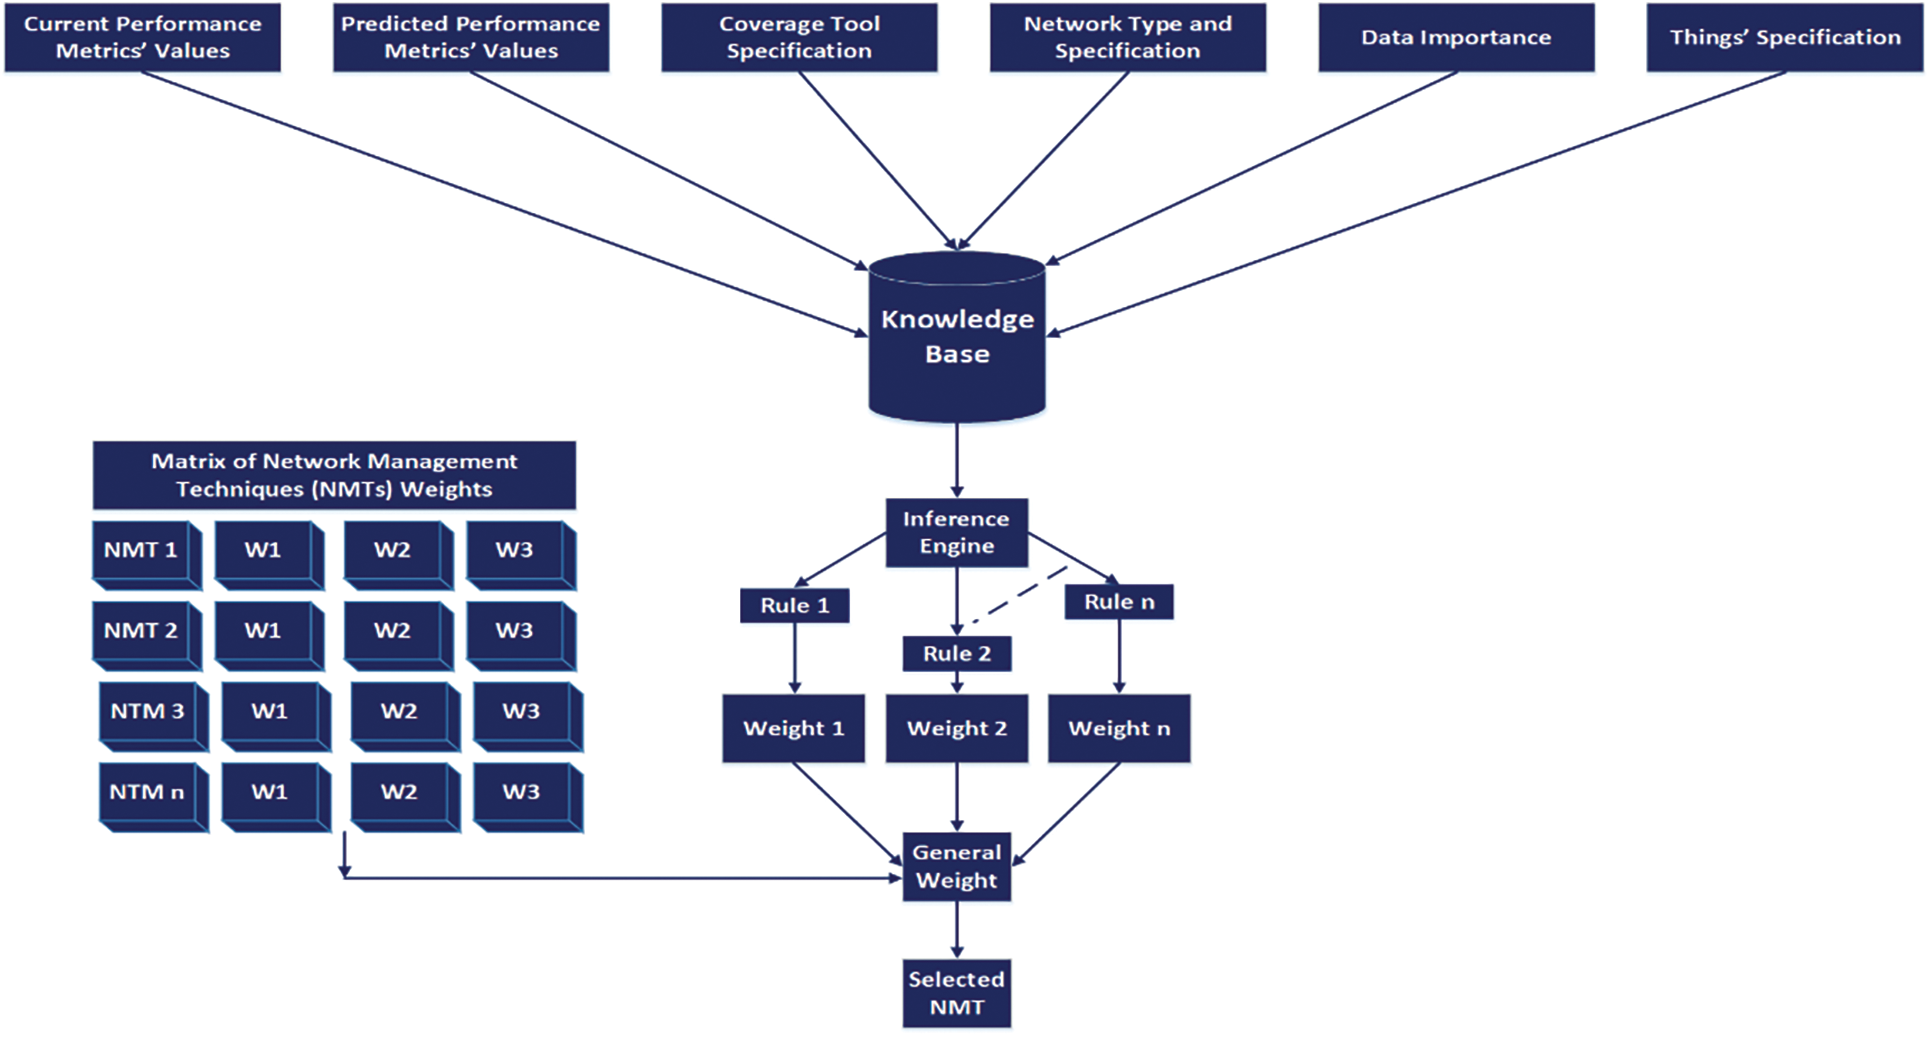
Figure 8: A specific view of the expert system processes
The adaptation layer is used to adapt the selected management methodology in the case of sudden changes to network efficiency parameters. As stated above in the introduction section, the IoT environment includes heterogeneous networks and users, so always guaranteeing QoS may be difficult (if not impossible). Therefore, using one version of a management methodology in all IoT session times will achieve poor results. Hence, a network management methodology should have multiple versions. When a network status is steady, the original version is used, and if the network efficiency changes (i.e., its parameters are underestimated), the lighter version will be used. Transforming from the original version to the lighter version is achieved by neglecting some functions and header fields—provided that this adaptation process does not negatively affect the entire network efficiency. Simulation experiments are used to reach the optimal versions from each network management methodology. Additionally, in the case of a failed adaptation process in a special network management methodology, the original version and its impact on the network should be considered in the third layer of the proposed management scheme. For example, Fig. 9 demonstrates the simple network management protocol (SNMP) GetRequest protocol data unit (PDU) format. This PDU is updated by neglecting some fields, such as error status and error index (in both request and replay PDUs), or decreasing the number of variables required by managers, such as in the variable binding field. Also, a light network management protocol—such as lightweight M2M (LWM2M) or CoAP management interface (CoMI) [4]—can decrease its overhead by increasing the period between two connective messages, which—in turn—decreases the number of control messages and decreases the consumption of QoS parameters, such as energy and bandwidth.

Figure 9: A simple view of the adaptation layer processes
This analysis is based on the mathematical analysis stated by [34]. The set of devices for WSN, RFID, MANET, and cellular networks was determined using Eqs. (1)–(4), respectively. The set of computing devices was determined using Eq. (5). The set of links between heterogeneous networks in the IoT was determined using Eq. (6).
where: n1, n2, n3, n4, and n5 are the number of devices in WSN, RFID, MANET, cellular, and computing-center networks, respectively;
The predicted end-to-end delay is calculated for the uploaded and downloaded data, considering each computing device's link bandwidth, communication technology, and capability.
The predicted energy consumption is determined using Eq. (9). This energy consumption calculation considers: processing, which is a function of computing and the total amount of data, determined using
The error percentage of the packet loss is determined using Eq. (10). The predicted packet loss is determined using Eq. (11).
The throughput calculation considers the link capacity related to the link type
To determine the suitable management method, based on the current network performance, therefore, the average of the performance metrics is calculated through the time needed to reach the steady state at which the performance values seem fixed. Finally, the current performance metrics are compared with the required performance metrics for each management methodology in Eq. (15), and the most suitable management methodology is determined in Eq. (16).
The proposed simulation environment comprises many heterogeneous networks with a large-scale coverage methodology. The networks represented in this simulation environment are MANET, cellular, WSN, and RFID. These networks are selected to construct the IoT environment due to their heterogeneity, in addition to scalability and dynamic change. Each network represents a special type of things, such as WSN represents sensors, RFID represents passive things, MANET represents temporally connected things, and cellular networks represent mobile things. The network simulator NS3 constructs the simulation IoT environment [35]. These networks are represented individually and in overlapping areas to accurately represent an IoT environment. Individual representation ensures that the different networks are arranged sequentially. Overlapping areas provide intersections between the heterogeneous networks whether these intersections are constituted from two or more networks. The coverage tools that transmit the data from one thing to another are the Internet, satellite, and high-altitude platform (HAP). Using more than one coverage tool provides the simulation environment with scalability and reliability. This scalability means that more and more things can join the IoT system despite no available internet signal. The environment reliability means that the data are transmitted through the best channel (in the case of a weak internet signal, another coverage tool will be used). In the simulation environment, one satellite and two HAPs are used. Increasing the number of satellites and HAPs used increases the IoT environment’s scalability rate. More accurately, the internet was selected as the first coverage priority because internet signals have become available for most things around the world. The HAP coverage tool receives the second priority, followed by the satellite coverage tool. Communication between heterogeneous networks is achieved using a tunneling process. The packet for one network is encapsulated within the following network’s suitable header. Therefore, to measure the proposed management scheme’s efficiency, its results are compared with other management techniques. These management techniques are LWM2M, CoAP, and 6LowPAN-SNMP, and they are used according to IoT network types. Simulations of LWM2M, CoAP, and 6LowPAN-SNMP are found in the works of [36–38]. For each network’s general parameters and values—in addition to the internet, satellites, and HAPs—see Fig. 10. The dataset, which is used in the neural network training process, comprises the features of the IoT clusters and other specifications such as information about service providers, in addition to the previous and current location coordinates of each thing. The works of [39,40] offered more descriptions of the IoT simulation environment.
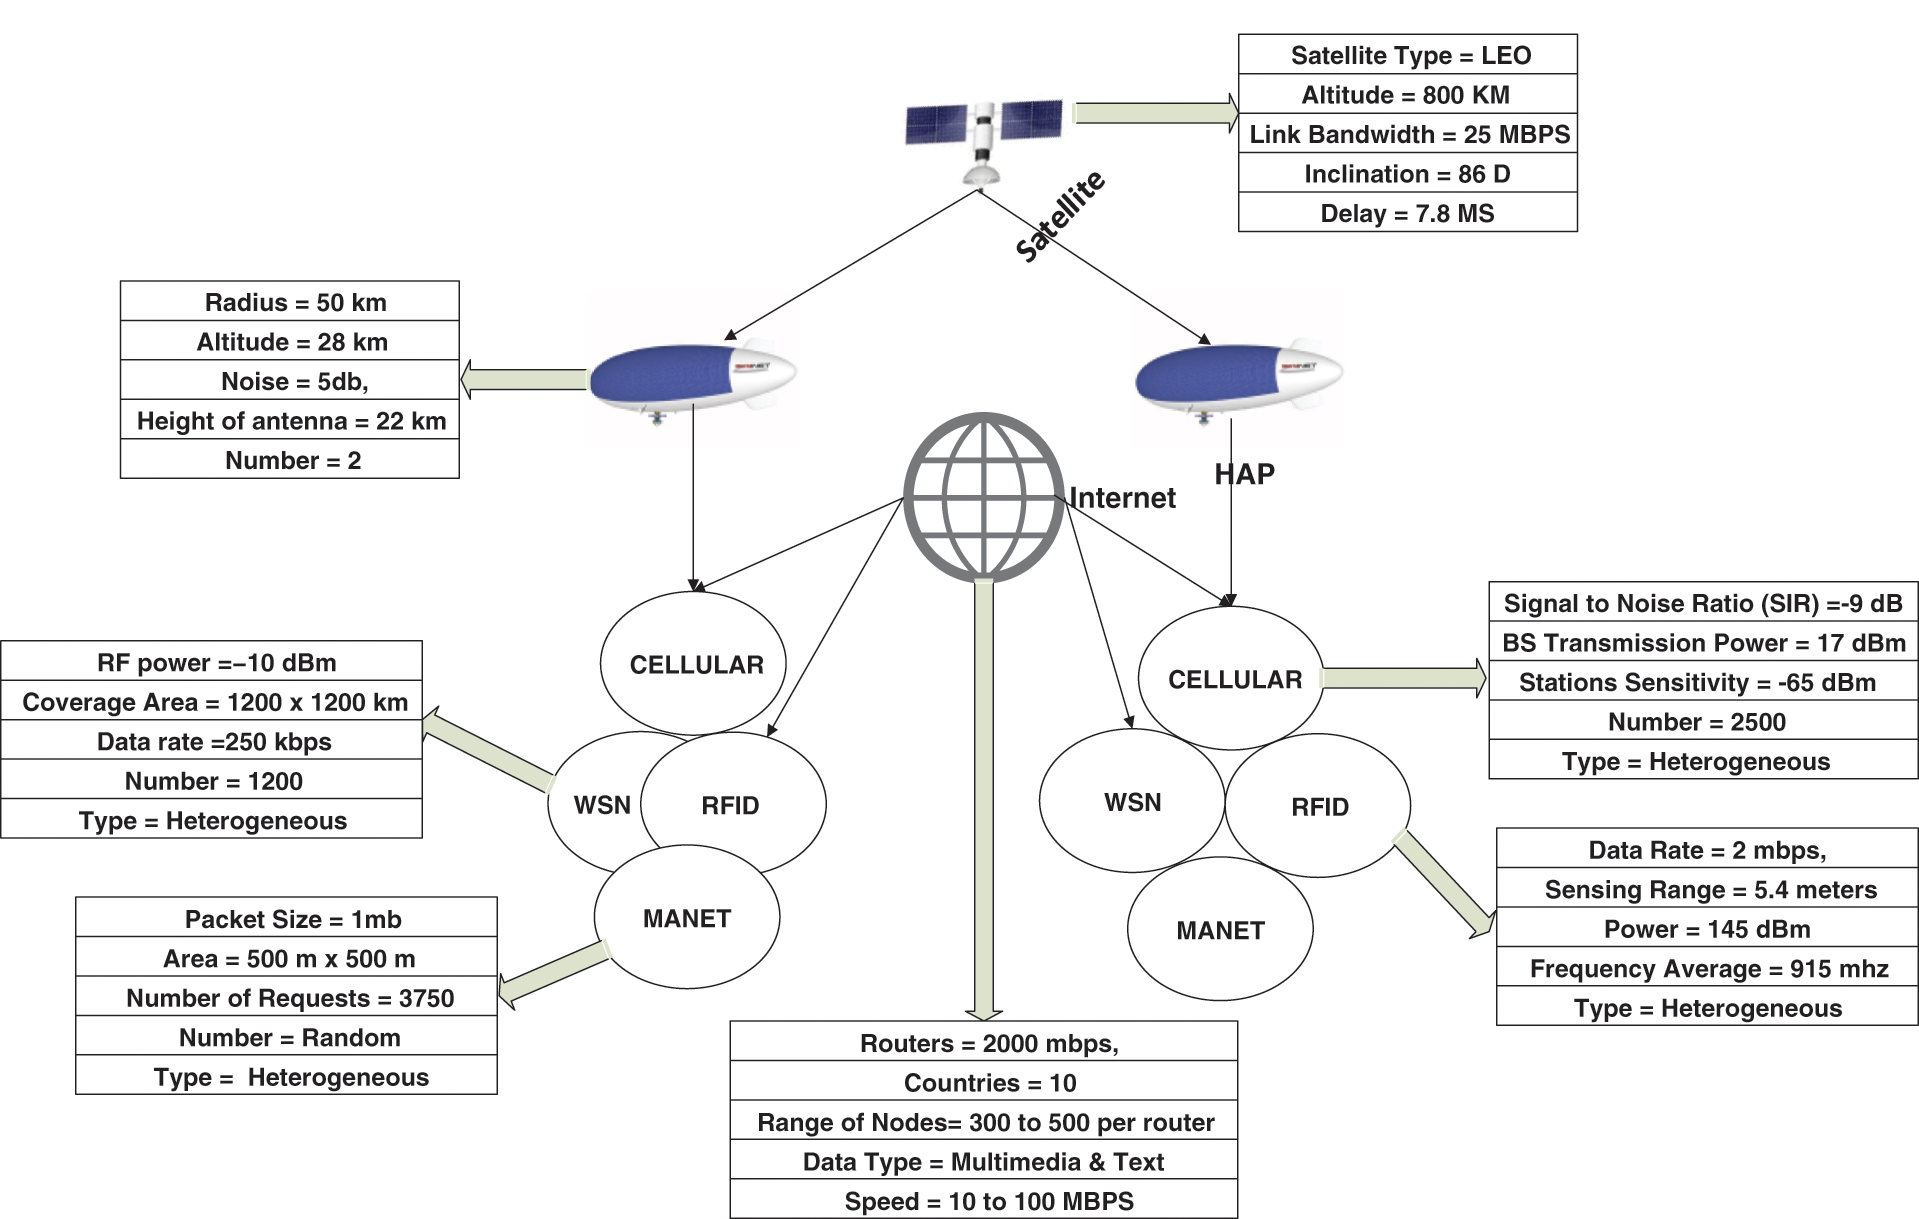
Figure 10: An overall view of the proposed management scheme
The performance metrics used to assess the proposed management scheme were classified into two groups. The first group was used to measure the overall efficiency of the IoT environment (networks), and it comprises bandwidth consumption, energy consumption, packet loss, throughput, and delay. The second group was used especially for the proposed management scheme, and it comprises the use of techniques and transformation.
The bandwidth consumption performance metric was defined as the bandwidth consumed by a network management technique within a time interval. This performance metric was measured by the bandwidth consumed for each packet sent through the simulated IoT environment for each management technique. These bandwidth values were summed. Fig. 11 presents the simulation’s bandwidth consumption ratio results as a performance metric. The x-axis denotes the simulation time divided by 10, and the y-axis denotes the bandwidth consumption percentage for each management technique. The plot of our proposed management scheme indicates that it consumed the least bandwidth. The bandwidth consumption ratios for the 6LowPAN-SNMP technique ranked after the proposed management scheme. Then, the bandwidth consumption ratios for CoAP and LWM2M management techniques ranked after the 6LowPAN-SNMP technique. This ranking is explained using the suitable management technique depending on the current network status. The plot of the proposed management scheme was steady—unlike the other management techniques, which depicted notable fluctuations. This difference was due to the management techniques individually lacking the required flexibility to handle bottlenecks that may occur during the transmission channels in IoT environments.
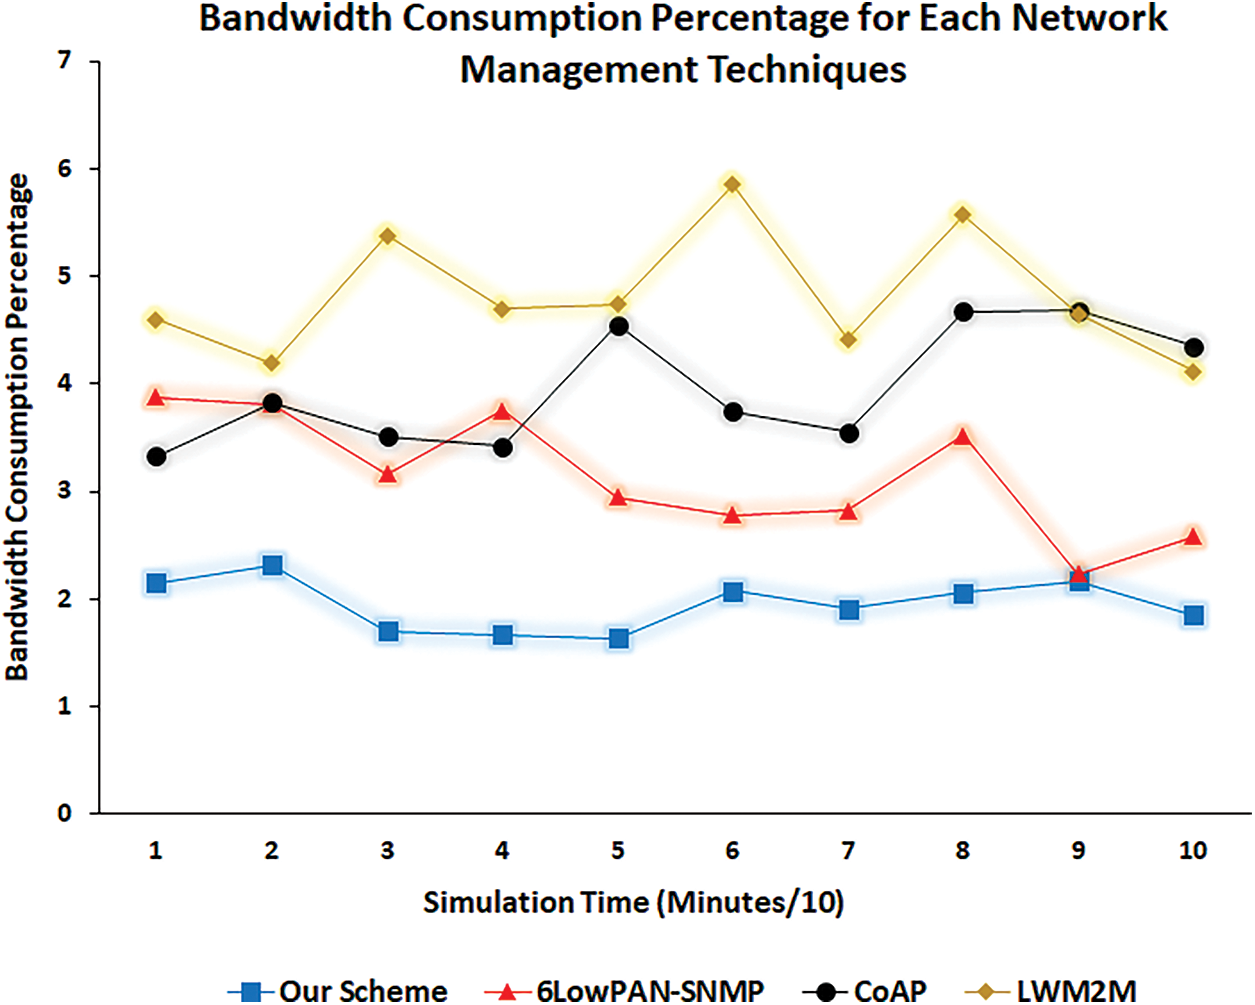
Figure 11: Bandwidth consumption percentage for the used network management techniques
The energy consumption performance metric was defined as the energy consumed by the processes achieved in the IoT environment for energy-based things. This performance metric was measured for the studied network management techniques by separately collecting the energy consumption values from energy-based things for each technique. Fig. 12 shows the energy consumption ratios for the proposed and 6LowPAN-SNMP, CoAP, and LWM2M management techniques. The x-axis denotes the simulation time divided by 10, and the y-axis denotes the 10 average energy consumption values in joules. At most simulation time points, the proposed management scheme achieved the lowest energy consumption values compared to the other management schemes. The fluctuations that appear in the plots were due to sudden events that occurred in the IoT environment, such as users joining or leaving, data transmission increasing or decreasing, and additions, deletions, or minimizations of the management processes. The endpoints in the figure plots for the 6LowPAN-SNMP, CoAP, and LWM2M management techniques were directed upward, and the endpoints for the proposed management scheme plot were directed downward. This difference means that the proposed management scheme offers the flexibility to decrease energy consumption if it notably increases.
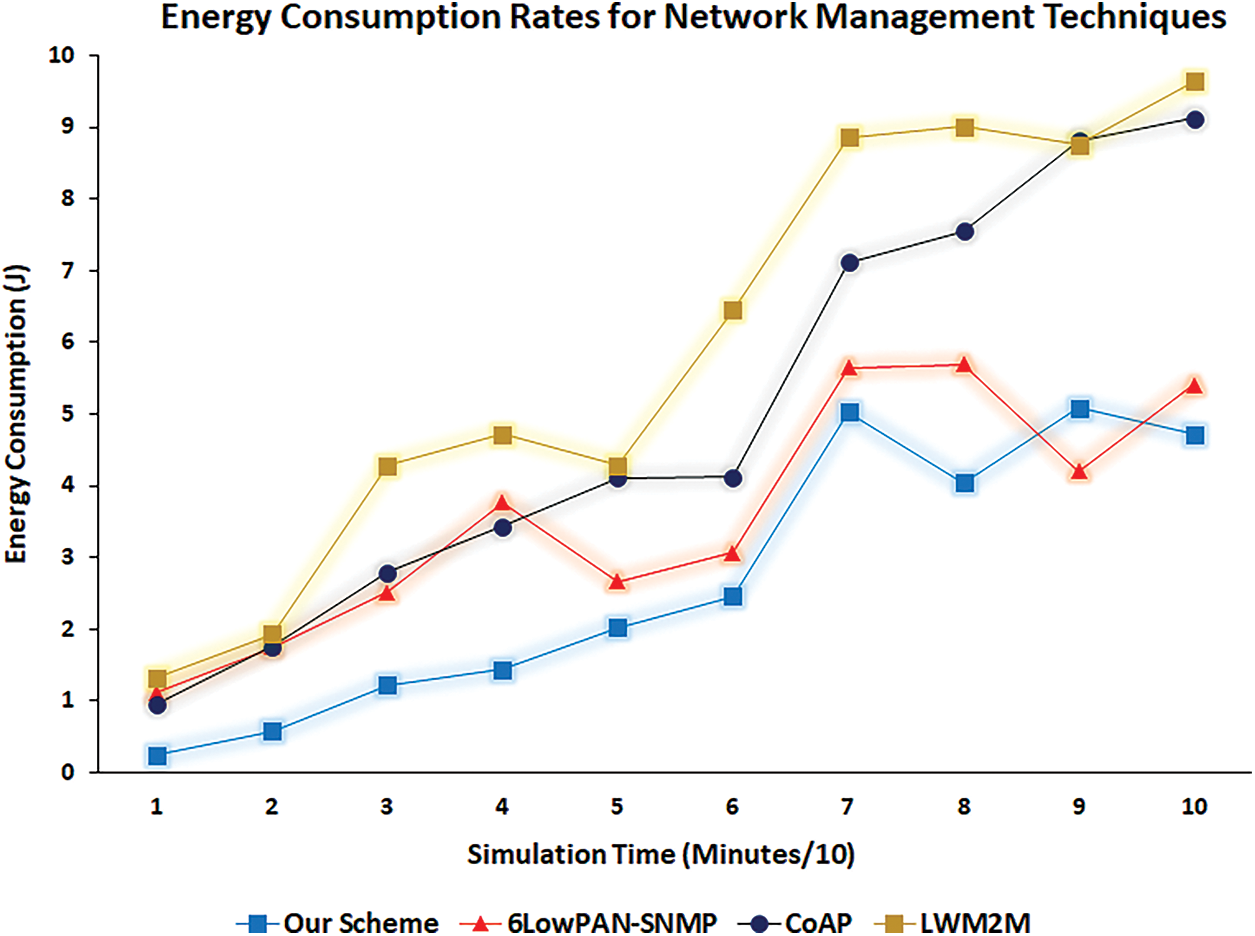
Figure 12: Energy consumption rates for the proposed management scheme and each network management technique
The packet loss performance metric was used to determine the entire IoT environment’s efficiency. This performance metric was measured using the total number of packets sent minus the total number of packets received. The delayed packets were considered losses. Fig. 13 shows the packet loss simulation results. The x-axis denotes the simulation time divided by 10 to calculate the average packet loss ratios for 10 simulation points. The y-axis denotes the packet loss ratios (as a percentage). Notably, the packet loss ratio for the proposed management scheme was less than the corresponding ratios of the 6LowPAN-SNMP, CoAP, and LWM2M management techniques. This difference can be explained by the extent of the proposed management scheme ability to deal with all network cases (starvation, normal, and excellent) by choosing an optimal management technique and synthesizing it according to the network condition in real-time, which positively affected the number of lost packets. Conversely, applying a single network management technique may not sufficiently account for the network status, which can—in turn—negatively affect lost data rates or the network management processes themselves. Additionally, and notably in the figure, the plot of the proposed management scheme shows stability that seems clear compared to the plots of the other network management techniques. This difference reveals a sufficiently flexible increase/decrease in complexity for the proposed scheme when applied to the IoT environment concerning its status.
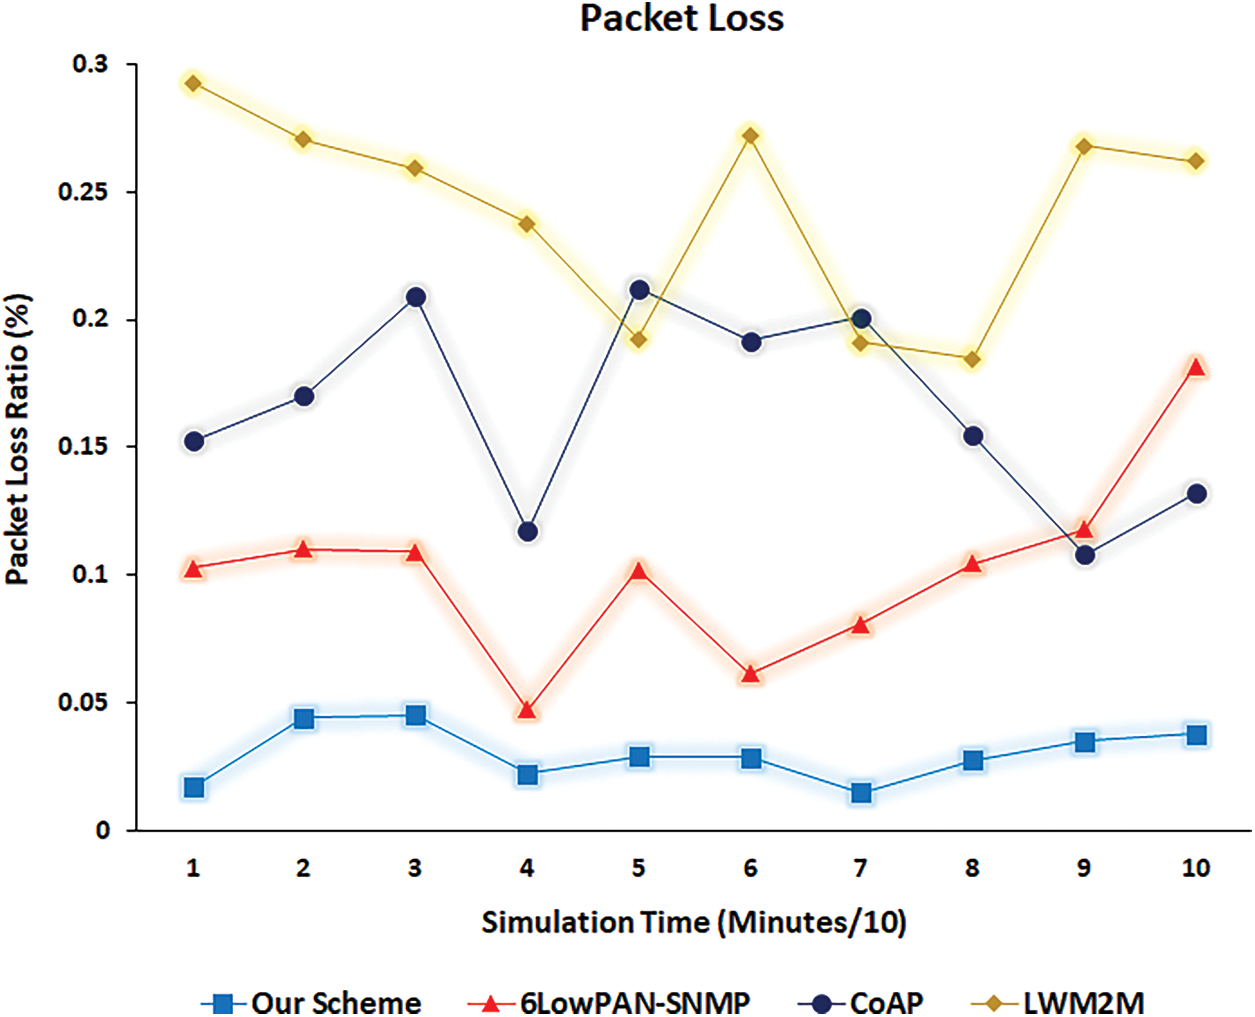
Figure 13: Packet loss ratios for the proposed management scheme and other management techniques
Throughput was also used as a performance metric to determine the total network efficiency and ensure that the proposed management scheme did not negatively affect the entire IoT system’s performance. It was measured by the number of packets received correctly by the destination within a time interval. Fig. 14 shows the throughput simulation results. The x-axis denotes the simulation time (minutes). The y-axis denotes the average of throughput (mb) for each management technique. Noticeably, the average throughput for the proposed management scheme exceeded the corresponding values of the other management techniques. This difference reflects decreasing data loss ratios and delays during the application of the proposed management scheme, which positively affected the throughput values. The other management techniques suffered a high rate of data loss and delays, especially when they were tested in a correctly and accurately represented IoT environment (i.e., an IoT environment containing a huge number of things in addition to many bottlenecks that may have resulted from sudden changes to internet speeds, sending and receiving devices, and heterogeneous transmission techniques and channels).
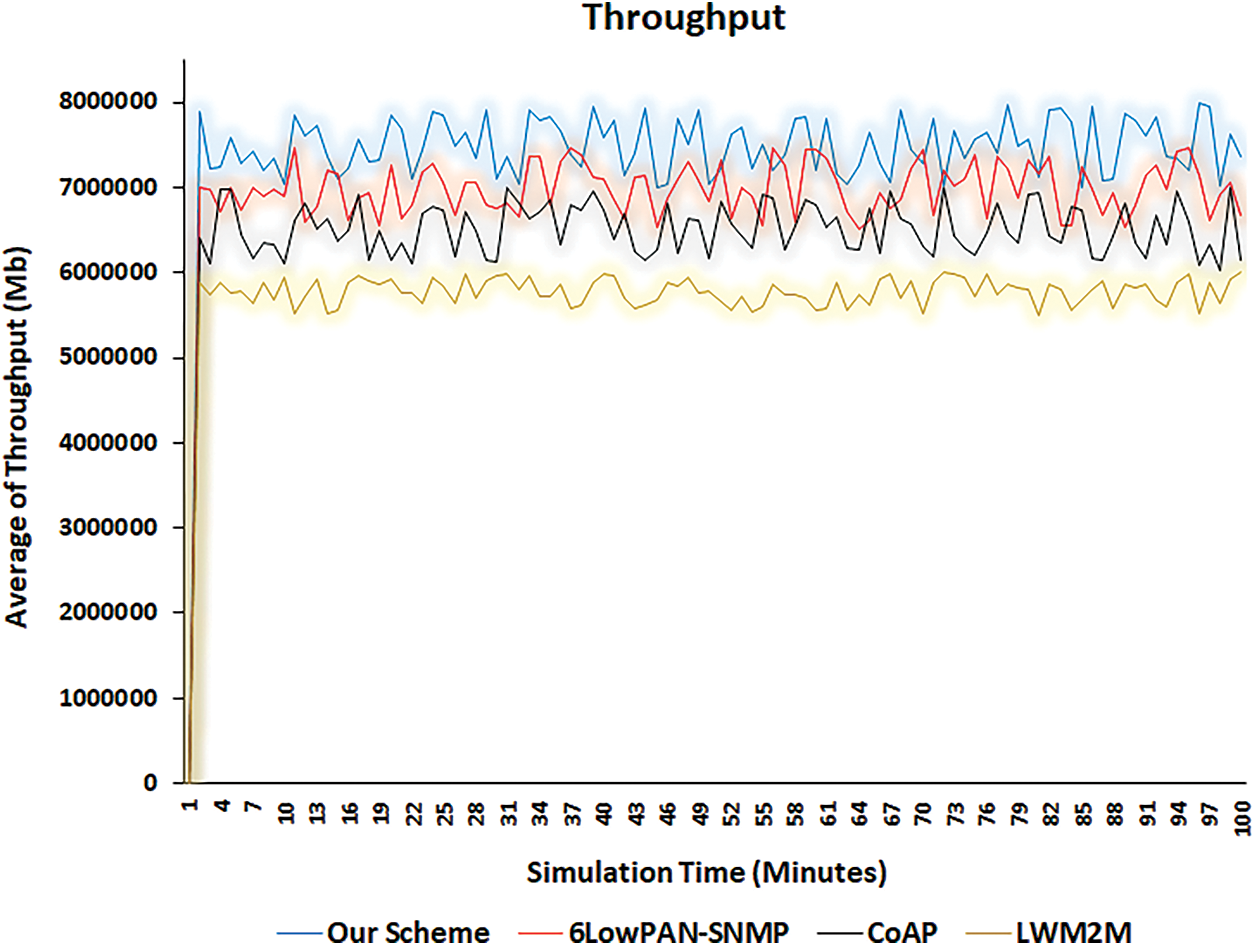
Figure 14: Throughput average for the proposed management scheme and other management techniques
End-to-end delay metric was also used to measure the entire performance of the IoT system. In addition, measurement of this performance metric proves that the proposed management scheme did not negatively affect the whole IoT system’s efficiency. The end-to-end delay metric considers processing, queueing, and transmission delays in its measurement. Fig. 15 shows the simulation results of the end-to-end delay performance metric. The x-axis denotes the simulation time after its division by 10 to calculate the average end-to-end delay for 10 simulation points. The y-axis denotes the end-to-end delay for each management technique. Notably, the end-to-end delay values for the proposed management scheme were less than the corresponding ratios of the 6LowPAN-SNMP, CoAP, and LWM2M management techniques. This difference is explained by the extent of the proposed management scheme's ability to deal with all network cases by choosing an optimal management technique and synthesizing it according to the network condition in real-time, which positively affected the average end-to-end delay. In addition, neglecting the performance changes, such as those made in the individual network management techniques, may cause severe congestion, which leads to an increase in delay values. Furthermore, applying multiple network management techniques may sufficiently account for the network status, which can—in turn—positively affect delay values or the network management processes themselves. Additionally, and notably in the figure, the plot of the proposed management scheme shows stability that seems clear compared to the plots of the other network management techniques. This difference reveals a sufficiently flexible increase or decrease in complexity of the proposed scheme when applied to the IoT environment concerning its status.
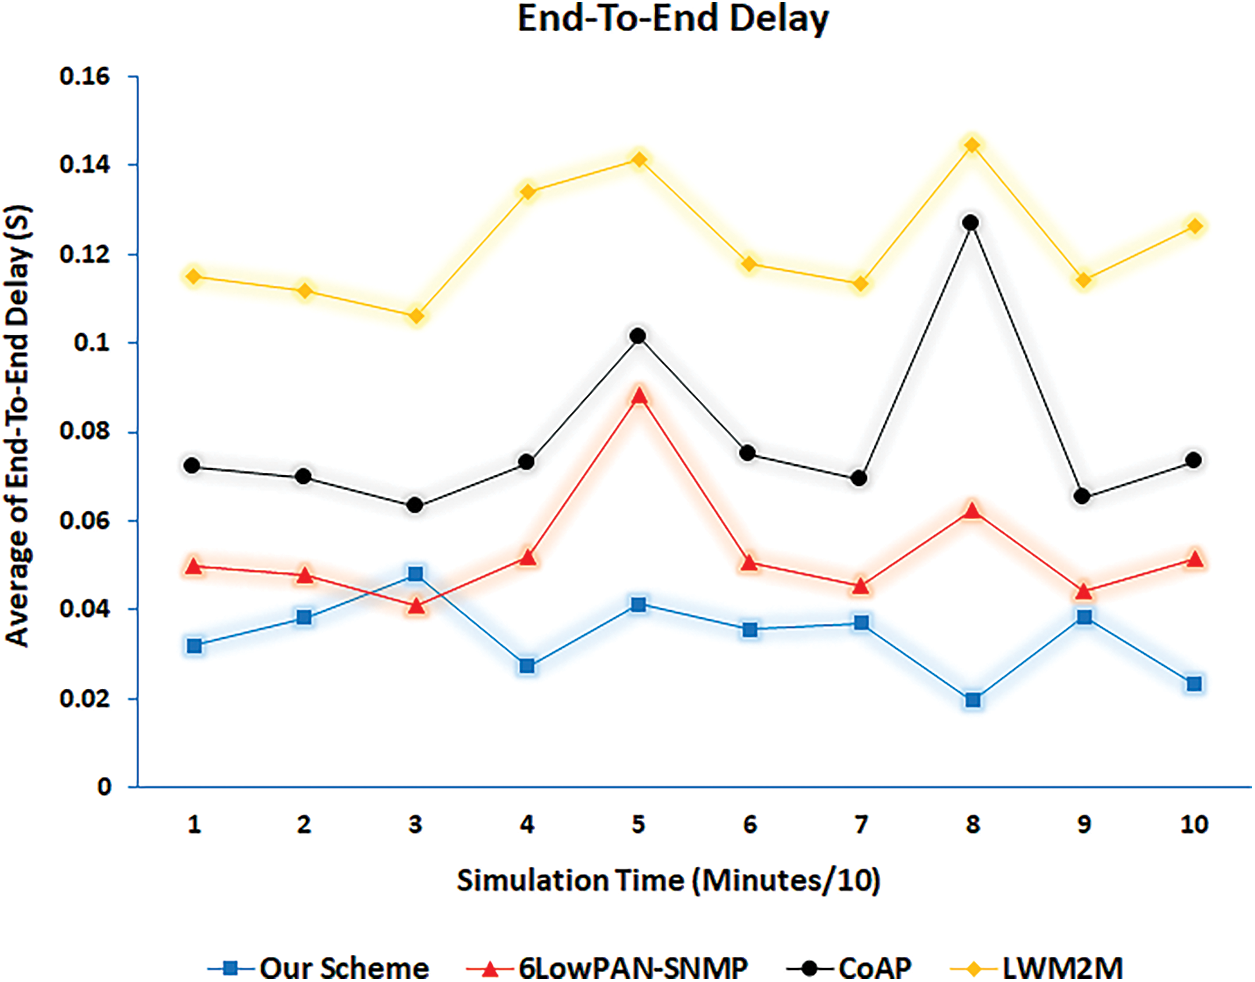
Figure 15: Delay average for the proposed management scheme and other management techniques
The special performance metrics of the proposed management scheme showed how many times it utilized the individual management techniques in addition to the transformation rate between many versions of each individual management technique. Fig. 16 shows the number of uses for each network management technique. The x-axis denotes the simulation time divided by 10, and the y-axis denotes the number of uses for each management technique. The largest average usage number over the simulation time points corresponded with the 6LowPAN-SNMP technique due to its simplicity and large bottlenecks in data transmission. CoAP and LWM2M ranked after 6LowPAN-SNMP. Notably, increases in the use of a network management technique reflected its suitability according to the user and network requirements.
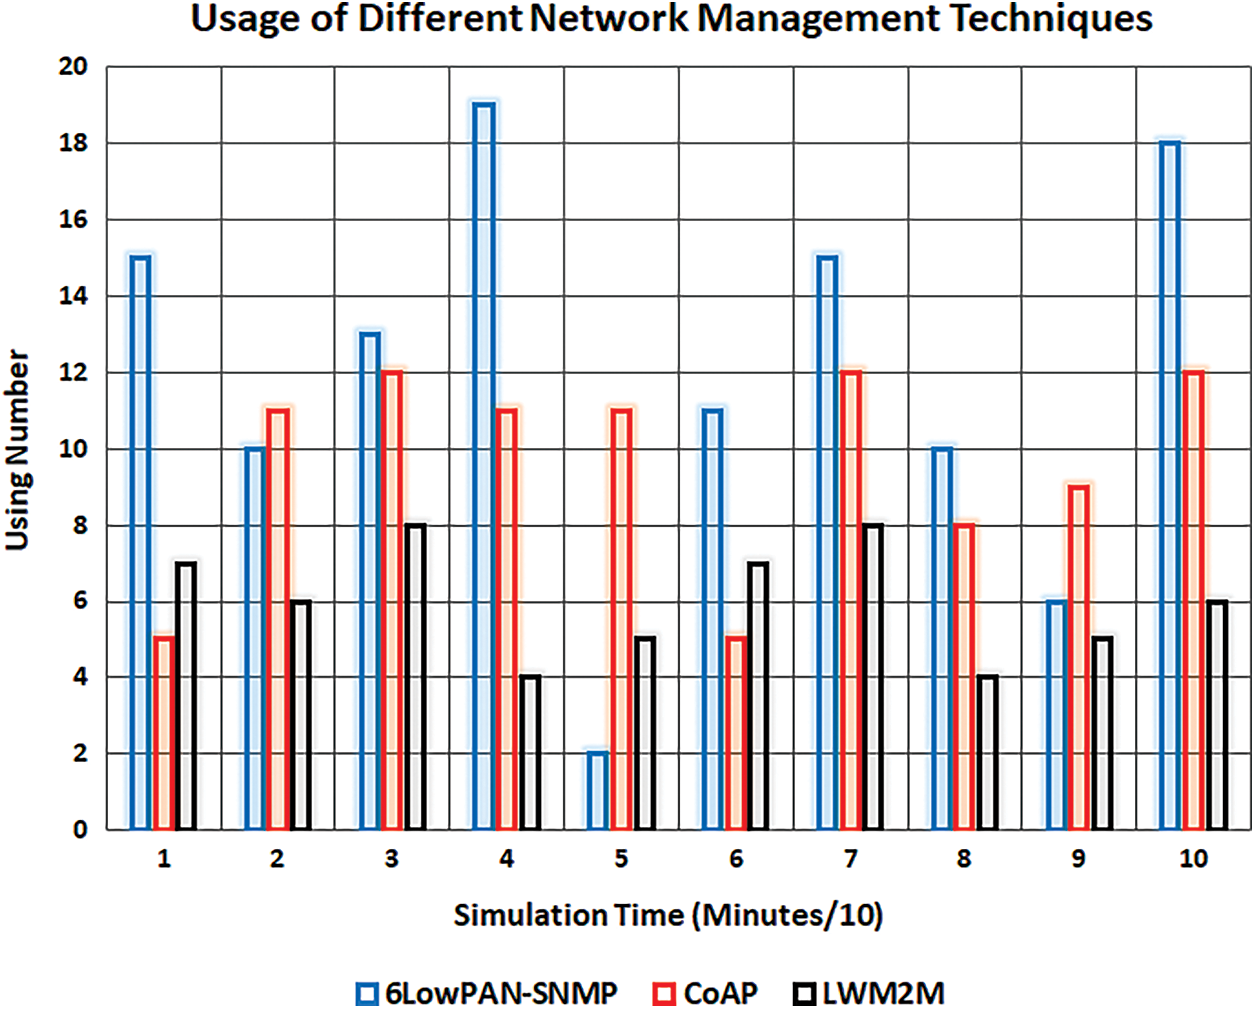
Figure 16: Number of uses for each management technique
The transformation performance metric showed that the proposed management scheme changed between many versions of each management technique, depending on the current status of the IoT networks, which also changed periodically. Fig. 17 shows the transformation between four different versions of each management technique. The management technique versions were created by reducing management packet sizes, decreasing the number of sent packets, or updating the management process—such as by updating agents’ or managers’ activity times. The x-axis denotes simulation time (minutes), and the y-axis denotes the versions created for each management technique and the transformation between them. This performance metric showed that the proposed management scheme was sufficiently elastic to face fluctuations and sudden changes that may occur in the IoT environment.
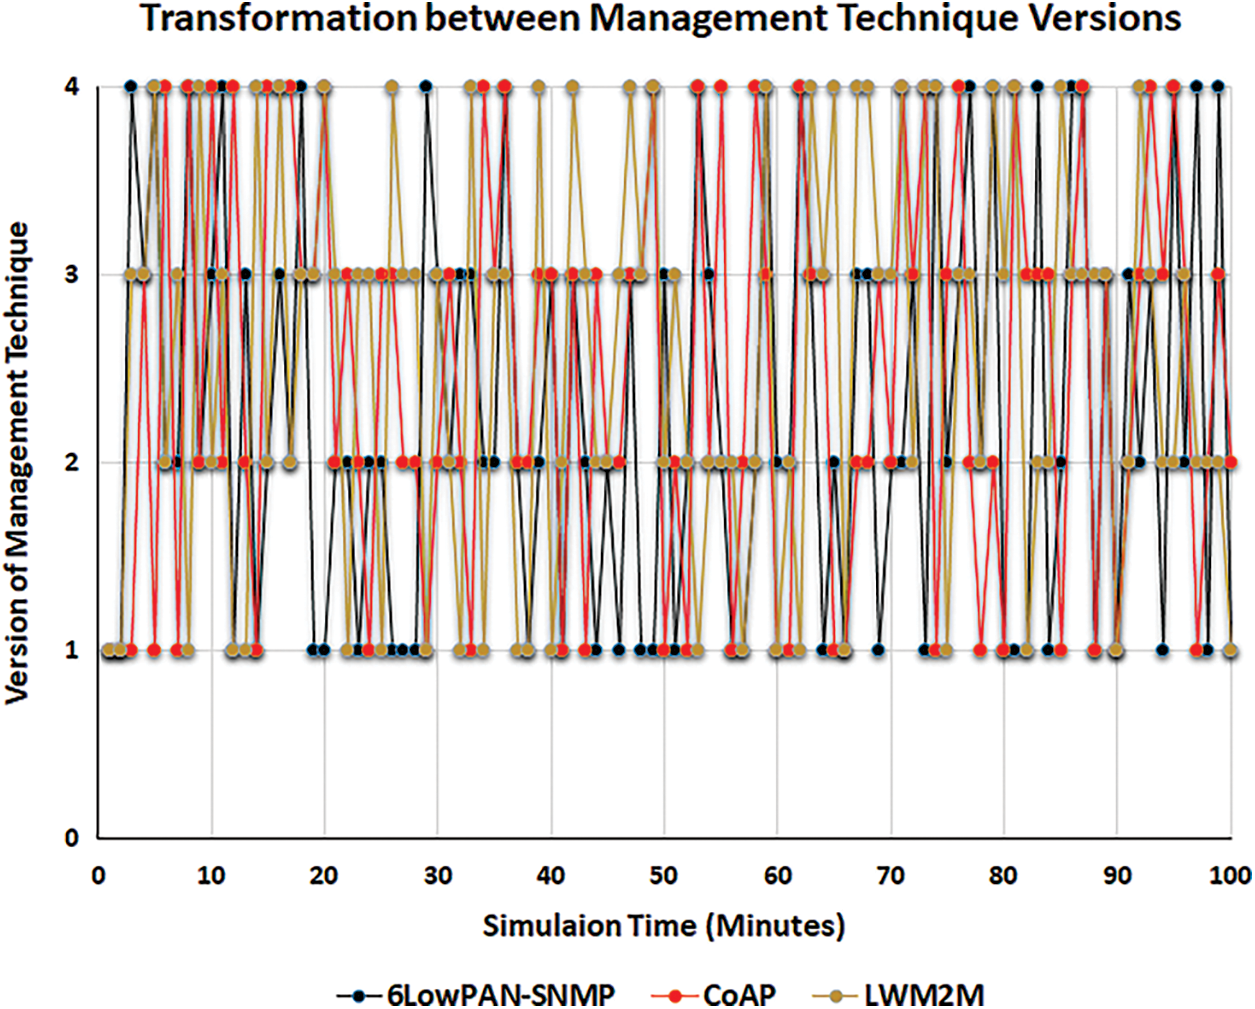
Figure 17: Transformations between versions of each management technique
This paper has proposed a management scheme for IoT environments. The basic rationale for the proposed scheme was based on the use of multiple techniques to manage the IoT environment. The selection and changing processes of management techniques were achieved according to IoT networks’ statuses, which were measured in real-time, and administrators’ predetermined requirements. The proposed management scheme comprises four different layers: “gather”, “evaluation”, “selection” and “adaptation”. Each layer accomplished its function and sent its output to each higher layer. The final output of the proposed management scheme was found to be the most suitable and adapted management technique. In the proposed scheme, a neural network was designed to determine and predict the status of the IoT networks. Furthermore, an intensive and accurate simulation environment for IoTs was constructed using NS3. Finally, the simulation results proved that the proposed management scheme outperformed the 6LowPAN-SNMP, CoAP, and LWM2M individual management techniques. Bandwidth consumption was reduced by 37.897%, energy consumption was reduced by 25.093%, packet loss was reduced by 30.199%, throughput was increased by 21.185%, and delay was reduced by 36.117%. Additionally, the usage rate of individual management techniques and transformation performance metrics were measured to ensure that the proposed management scheme was sufficiently flexible and able to change between management techniques after their adaptation. Therefore, the proposed management scheme is recommended to manage the IoT environments. In the future work, other management techniques will be evaluated under the proposed management scheme. Then, their results will be compared with the corresponding results that are demonstrated in this paper. Hence, the optimal management techniques will be recommended according to a real-time evaluation of the IoT system’s performance.
Acknowledgement: The author extends his appreciation to the Taif University Researchers Supporting Project No. (TURSP-2020/60), Taif University, Taif, Saudi Arabia.
Funding Statement: The work was funded by the Taif University Researchers Supporting Project No. (TURSP-2020/60), Taif University, Taif, Saudi Arabia.
Conflicts of Interest: The author declares that he has no conflicts of interest to report regarding the present study.
References
1. Braten, E., Kraemer, F., Palma, D. (2021). Autonomous IoT device management systems: Structured review and generalized cognitive model. IEEE Internet of Things Journal, 8(6), 4275–4290. DOI 10.1109/JIOT.2020.3035389. [Google Scholar] [CrossRef]
2. Musaddiq, A., Zikria, Y., Hahm, O., Yu, H., Bashir, A. et al. (2018). A survey on resource management in IoT operating systems. IEEE Access, 6, 8459–8482. DOI 10.1109/ACCESS.2018.2808324. [Google Scholar] [CrossRef]
3. Sinche, S., Raposo, D., Armando, N., Rodrigues, A., Boavida, F. et al. (2019). A survey of IoT management protocols and frameworks. IEEE Communications Surveys & Tutorials, 22(2), 1168–1190. DOI 10.1109/COMST.2019.2943087. [Google Scholar] [CrossRef]
4. Aboubakar, M., Kellil, M., Roux, P. (2021). A review of IoT network management: Current status and perspectives. Journal of King Saud University-Computer and Information Sciences, 53(9), 4163–4176. DOI 10.1016/j.jksuci.2021.03.006. [Google Scholar] [CrossRef]
5. Jazaeri, S., Jabbehdari, S., Asghari, P., Javadi, H. (2021). Edge computing in SDN-IoT networks: A systematic review of issues, challenges and solutions. Cluster Computing, 24(4), 3187–3228. DOI 10.1007/s10586-021-03311-6. [Google Scholar] [CrossRef]
6. Chattopadhyay, S., Chatterjee, S., Nandi, S., Chakraborty, S. (2020). Aloe: Fault-tolerant network management and orchestration framework for IoT applications. IEEE Transactions on Network and Service Management, 17(4), 2396–2409. DOI 10.1109/TNSM.2020.3008426. [Google Scholar] [CrossRef]
7. Achir, M., Abdelli, A., Mokdad, L., Benothman, J. (2022). Service discovery and selection in IoT: A survey and a taxonomy. Journal of Network and Computer Applications, 200(1), 103331. DOI 10.1016/j.jnca.2021.103331. [Google Scholar] [CrossRef]
8. Ramírez, P., Taha, M., Lloret, J., Tomás, J. (2020). An intelligent algorithm for resource sharing and self-management of wireless-IoT-gateway. IEEE Access, 8, 3159–3170. DOI 10.1109/ACCESS.2019.2960508. [Google Scholar] [CrossRef]
9. Kamienski, C., Borelli, F., Biondi, G., Pinheiro, I., Zyrianoff, I. et al. (2018). Context design and tracking for IoT-based energy management in smart cities. IEEE Internet of Things Journal, 5(2), 687–695. DOI 10.1109/JIOT.2017.2748037. [Google Scholar] [CrossRef]
10. Novo, O. (2019). Scalable access management in IoT using blockchain: A performance evaluation. IEEE Internet of Things Journal, 6(3), 4694–4701. DOI 10.1109/JIOT.2018.2879679. [Google Scholar] [CrossRef]
11. Wu, D., Nie, X., Asmare, E., Arkhipov, D., Qin, Z. et al. (2020). Towards distributed SDN: Mobility management and flow scheduling in software defined urban IoT. IEEE Transactions on Parallel and Distributed Systems, 31(6), 1400–1418. DOI 10.1109/TPDS.2018.2883438. [Google Scholar] [CrossRef]
12. Chen, I., Guo, J., Wang, D., Tsai, J., Al-Hamadi, H. et al. (2019). Trust-based service management for mobile cloud IoT systems. IEEE Transactions on Network and Service Management, 16(1), 246–263. DOI 10.1109/TNSM.2018.2886379. [Google Scholar] [CrossRef]
13. Manogaran, G., Alazab, M., Saravanan, V., Rawal, B., Shakeel, P. et al. (2021). Machine learning assisted information management scheme in service concentrated IoT. IEEE Transactions on Industrial Informatics, 17(4), 2871–2879. DOI 10.1109/TII.2020.3012759. [Google Scholar] [CrossRef]
14. Bashir, M., Gill, A., Beydoun, G., Mccusker, B. (2020). Big data management and analytics metamodel for IoT-enabled smart buildings. IEEE Access, 8, 169740–169758. DOI 10.1109/ACCESS.2020.3024066. [Google Scholar] [CrossRef]
15. Zhang, X. Y., Wang, D, L., Zhang, Y. M., Karthik, B. M., Benny, A. A. (2021). IoT driven framework based efficient green energy management in smart cities using multi-objective distributed dispatching algorithm. Environmental Impact Assessment Review, 88(9), 106567. DOI 10.1016/j.eiar.2021.106567. [Google Scholar] [CrossRef]
16. Murugesan, S., Ramalingam, S., Kanimozhi, P. (2021). Theoretical modelling and fabrication of smart waste management system for clean environment using WSN and IOT. Materials Today: Proceedings, 45(2), 1908–1913. DOI 10.1016/j.matpr.2020.09.190. [Google Scholar] [CrossRef]
17. Narang, N., Kar, S. (2021). A hybrid trust management framework for a multi-service social IoT network. Computer Communications, 171(11), 61–79. DOI 10.1016/j.comcom.2021.02.015. [Google Scholar] [CrossRef]
18. Rahman, M. (2020). Intelligent waste management system using deep learning with IoT. Journal of King Saud University-Computer and Information Sciences, 35(3), 2072–2087. DOI 10.1016/j.jksuci.2020.08.016. [Google Scholar] [CrossRef]
19. Eghbali, Z., Lighvan, M. (2021). A hierarchical approach for accelerating IoT data management process based on SDN principles. Journal of Network and Computer Applications, 181(4), 103027. DOI 10.1016/j.jnca.2021.103027. [Google Scholar] [CrossRef]
20. Kim, M., Jaseemuddin, M., Anpalagan, A. (2021). Deep reinforcement learning based active queue management for IoT networks. Journal of Network and Systems Management, 29, 34. DOI 10.1007/s10922-021-09603-x. [Google Scholar] [CrossRef]
21. Shayesteh, B., Hakami, V., Akbari, A. (2020). A trust management scheme for IoT-enabled environmental health/accessibility monitoring services. International Journal of Information Security, 19(1), 93–110. DOI 10.1007/s10207-019-00446-x. [Google Scholar] [CrossRef]
22. Alelaiwi, A. (2017). A collaborative resource management for big IoT data processing in cloud. Cluster Computing Journal of Networks Software Tools and Applications, 20(2), 1791–1799. DOI 10.1007/s10586-017-0839-y. [Google Scholar] [CrossRef]
23. Alshehri, M., Hussain, K. (2019). A fuzzy security protocol for trust management in the Internet of Things (Fuzzy-IoT). Computing, 101(7), 791–818. DOI 10.1007/s00607-018-0685-7. [Google Scholar] [CrossRef]
24. Jeong, Y., Kim, D., Shin, S. (2021). Efficient data management techniques based on hierarchical IoT privacy using block chains in cloud environments. The Journal of Supercomputing, 77, 9810–9826. DOI 10.1007/s11227-021-03653-3. [Google Scholar] [CrossRef]
25. Antunes, J., Denés, I., Castro, T., Macedo, D., Santos, A. (2018). TI-ManIoT: A 2-tier management platform for heterogeneous IoT devices and applications. International Journal of Network Management, 28(5), e2034. DOI 10.1002/nem.2034. [Google Scholar] [CrossRef]
26. Taneja, M., Jalodia, N., Byabazaire, J., Davy, A., Olariu, C. (2019). SmartHerd management: A microservices-based fog computing-assisted IoT platform towards data-driven smart dairy farming. Software: Practice and Experience, 49(7), 1055–1078. DOI 10.1002/spe.2704. [Google Scholar] [CrossRef]
27. Sugawara, T., Murakami, K., Goto, S. (2001). A multi-agent monitoring and diagnostic system for TCP/IP-based network and its coordination. Knowledge-Based Systems, 14(7), 367–383. DOI 10.1016/S0950-7051(01)00150-2. [Google Scholar] [CrossRef]
28. Rocha, V., Alves, A., Brandão, F. (2019). A scalable multiagent architecture for monitoring IoT devices. Journal of Network and Computer Applications, 139(15), 1–14. DOI 10.1016/j.jnca.2019.04.017. [Google Scholar] [CrossRef]
29. Said, O., Tolba, A. (2018). Design and performance evaluation of mixed multicast architecture for internet of things environment. Journal of Supercomputing, 74(7), 3295–3328. DOI 10.1007/s11227-018-2386-6. [Google Scholar] [CrossRef]
30. Said, O., Tolba, A. (2021). Accurate performance prediction of IoT communication systems for smart cities: An efficient deep learning based solution. Sustainable Cities and Society, 69(6), 102830. DOI 10.1016/j.scs.2021.102830. [Google Scholar] [CrossRef]
31. Abbasi, M., Shahraki, A., Taherkordi, A. (2021). Deep learning for network traffic monitoring and analysis (NTMAA survey. Computer Communications, 170(3), 19–41. DOI 10.1016/j.comcom.2021.01.021. [Google Scholar] [CrossRef]
32. Gao, H., Xu, Y., Yin, Y., Zhang, W., Li, R. et al. (2020). Context-aware QoS prediction with neural collaborative filtering for Internet-of-Things services. IEEE Internet of Things Journal, 7(5), 4532–4542. DOI 10.1109/JIoT.6488907. [Google Scholar] [CrossRef]
33. Alonso, J., Personal, E., Parejo, A., García, S., Martín, A. et al. (2019). Increasing the efficiency of rule-based expert systems applied on heterogeneous data sources. UK: Intechopen Press. DOI 10.5772/intechopen.90743. [Google Scholar] [CrossRef]
34. Kök, İ., Özdemir, S. (2021). DeepMDP: A novel deep-learning-based missing data prediction protocol for IoT. IEEE Internet of Things Journal, 8(1), 232–243. DOI 10.1109/JIOT.2020.3003922. [Google Scholar] [CrossRef]
35. Network Simulator 3 (NS3) (2022). https://www.nsnam.org/. [Google Scholar]
36. Pappalardo, M., Tanganelli, G., Mingozzi, E. (2020). Enhanced support of LWM2M in low power and lossy networks. IEEE International Conference on Smart Computing (SMARTCOMP), pp. 344–349. Italy. DOI 10.1109/SMARTCOMP50058.2020.00075. [Google Scholar] [CrossRef]
37. Slabicki, M., Grochla, K. (2016). Performance evaluation of CoAP, SNMP and NETCONF protocols in fog computing architecture. NOMS 2016-IEEE/IFIP Network Operations and Management Symposium, pp. 1315–1319. DOI 10.1109/NOMS.2016.7503010. [Google Scholar] [CrossRef]
38. Choi, H., Kim, N., Cha, H. (2009). 6LoWPAN-SNMP: Simple network management protocol for 6LoWPAN. 11th IEEE International Conference on High Performance Computing and Communications, pp. 305–313. Seoul, Korea. [Google Scholar]
39. Said, O., Tolba, A. (2021). Design and evaluation of large-scale IoT-enabled healthcare architecture. Applied Sciences, 11(8), 3623. DOI 10.3390/app11083623. [Google Scholar] [CrossRef]
40. Said, O., Tolba, A. (2016). Performance evaluation of a dual coverage system for Internet of Things environments. Mobile Information Systems, 2016(1), 1–20. DOI 10.1155/2016/3464392. [Google Scholar] [CrossRef]
 | This work is licensed under a Creative Commons Attribution 4.0 International License, which permits unrestricted use, distribution, and reproduction in any medium, provided the original work is properly cited. |