| Computer Modeling in Engineering & Sciences |
DOI: 10.32604/cmes.2022.019782
ARTICLE
Reducing the Range of Cancer Risk on BI-RADS 4 Subcategories via Mathematical Modelling
1Near East University, Faculty of Arts and Sciences, Nicosia, 99138, North Cyprus
2Near East University, Mathematics Research Center, Nicosia, 99138, North Cyprus
3Near East University, Faculty of Medicine, Nicosia, 99138, North Cyprus
*Corresponding Author: Evren Hincal. Email: evren.hincal@neu.edu.tr
Received: 14 October 2021; Accepted: 07 February 2022
Abstract: Breast Imaging Reporting and Data System, also known as BI-RADS is a universal system used by radiologists and doctors. It constructs a comprehensive language for the diagnosis of breast cancer. BI-RADS 4 category has a wide range of cancer risk since it is divided into 3 categories. Mathematical models play an important role in the diagnosis and treatment of cancer. In this study, data of 42 BI-RADS 4 patients taken from the Center for Breast Health, Near East University Hospital is utilized. Regarding the analysis, a mathematical model is constructed by dividing the population into 4 compartments. Sensitivity analysis is applied to the parameters with the desired outcome of a reduced range of cancer risk. Numerical simulations of the parameters are demonstrated. The results of the model have revealed that an increase in the lactation rate and early menopause have a negative correlation with the chance of being diagnosed with BI-RADS 4 whereas a positive correlation increase in age, the palpable mass, and family history is distinctive. Furthermore, the negative effects of smoking and late menopause on BI-RADS 4C diagnosis are vehemently outlined. Consequently, the model showed that the percentages of parameters play an important role in the diagnosis of BI-RADS 4 subcategories. All things considered, with the assistance of the most effective parameters, the range of cancer risks in BI-RADS 4 subcategories will decrease.
Keywords: Mathematical model; breast cancer; BI-RADS 4; sensitivity analysis; reducing cancer risk; suspicious malignancy; ordinary differential equations
Cancer is a serious disease that occurs as a result of an uncontrolled proliferation and growth of cells in any organ or tissue of the body. There is a requirement of building new cells in the event of cell death or damage. When the order of this formation process fails, damaged or abnormal cells can grow. The growth or proliferation of these kind of cells may result in tumors (which are sometimes called as lumps of tissues) [1,2]. Tumors can be benign or malignant. Malignant tumors are known as cancerous tumors and they have the capability to proliferate, invade the surrounding structures and make metastatic-colonies. Benign tumors do not possess these kind of properties [3].
According to the World Health Organization (WHO), cancer is a persuasive cause of death, vehemently prevalent in the world. In 2020, approximately 10 million people passed away because of cancer [4].
Cancer may begin in almost any part of the body and it is named dependent on the tissue in which it occurs. There are more than 200 types of identified cancers. The most common and mortal types of cancer include lung, stomach, liver, colon, and breast cancer. Female breast cancer is the most common cancer type with an estimated 2,3 million new cases (11.7%) around the globe [5]. It has the highest mortality rate in contrast to the other types of cancer for women [6,7] and the statistics of W.H.O. revealed that 685000 people out of 2,3 million diagnoses passed away in 2020 [8]. In fact, breast cancer is the primary cause of mortality; especially in post-menopausal women accounting 23% of all cancer related deaths [6].
Breast cancer generally originates from the epithelial cells of the breast ducts and glands. The most common clinical presentation is a newly formed breast lump. However, bloody nipple discharge, skin dimpling or ulceration, abnormal change in the breast size, redness or skin edema may be a sign or symptom of breast cancer. In spite of this fact, sometimes there may be a radiological abnormality during the screening but no clinical finding [9,10].
There are risk factors associated with breast cancer. To illustrate, these include age, female gender, genetic mutations, family history with ovarian or breast cancer, obesity, personal history with other types of cancer, etc. Dense breast on mammography is also a risk factor and, in this case, the diagnostic capability of mammography is relatively insufficient [9,10].
Breastfeeding, late first menstrual period and premature menopause are some of the factors that may reduce the risk of breast cancer [11,12]. As in other diseases, early diagnosis is the inevitable key factor for the treatment of breast cancer. After the age of 40, a screening mammography in every 1–2 year is recommended while after 50 s, screening mammography should be performed once a year.
In asymptomatic women, a screening mammography should be performed in order to increase the chance of successful treatment. On the other hand, in symptomatic women, the frequency of diagnostic mammography performed is higher due to the abnormality in the breast. Diagnostic mammography enables doctors to determine the exact size, location, and the shape of the lump or other pathological finding, exactly [13].
American College of Radiology (ACR) developed a categorization to reduce and group the variation of radiologists’ findings and descriptions for the diagnosis. Breast Imaging Reporting and Data System is given to the name of this categorization, which is also referred as BI-RADS, with initials of the name. BI-RADS system has 7 categories, starting from 0 till 6. The categorization of the BI-RADS is determined according to the obtained data from the patient’s ultrasound, mammography, etc. In the case of Category 0, further examinations are necessary in order to identify the obtained lump [14]. BI-RADS 1 is the category defined as negative findings and Category 2 is read as benign structures with 100%. In other words, in Category 2, some instances of evaluated harmless lumps are demonstrated. Category 3 is considered as benign with 98%, another control is generally suggested after 6 months. Biopsy is recommended for Category 4 since the lesions are suspicious with an enormous range, 2% to 95%. Category 5 has the probability of 95% malignancy and Category 6 is the class of proven malignancy, i.e., the patient is 100% breast cancer [15].
BI-RADS 4 category has a wide range of cancer probability which may portend contradictions for the doctors while diagnosis. Due to this reason, it is divided into 3 subcategories as BI-RADS 4A, BI-RADS 4B, and BI-RADS 4C. Category 4A has a relatively lower (2%–10%) malignancy rate; malignancy of Category 4B is moderate with 10%–50% and Category 4C has high suspicion of malignancy with 50%–95%. The categorization of findings may arise controversies between radiologists since their interpretations can be different [15].
Mathematical modelling has been widely used in the diagnosis or treatment of diseases for many years. Preventing the spread or occurrence of the tumor/cancer cells via control structures is one of the leading aims of mathematical modelling in health sciences. After identifying the problem, the population that is going to be examined should be separated into sensible number of compartments. Subsequently, with the help of parameters and variables, relationship between the compartments is constructed by means of differential equations [16]. The kind of differential equations (ODE, PDE, FDE, etc.) may differ and it depends on the type or structure of the disease and field of mathematicians.
For the effect of any disease, obtaining the basic reproduction number, denoted by
In [18], a mathematical model is constructed for tumor growth while [19] modelled growth of tumor with single irradiation. Fractional mathematical modelling is used in [20] for the breast cancer and in [21] for the system of cardiac conduction. Jajarmi et al. [22] represents a fractional system about the dynamics of immunogenic tumors. Treatments like drug intervention, chemotherapy and immunotherapy are modelled in the studies [23–25].
In this paper, BI-RADS subcategories in breast radiological analyses is studied. The study includes 42 patients of Near East University Hospital, Center for Breast Health. Patients are diagnosed with BI-RADS 4 and divided into subcategories according to the findings. The principal focus of the study is to determine the effect of introduced parameters on the BI-RADS 4 subcategories and to narrow the range of cancer risk in the subcategories of BI-RADS 4.
The paper is organized as follows: First of all, the information about the used data and methods are demonstrated in Section 2. Then, the constructed model and its analyses are examined in Section 3. Afterwards, numerical simulations of the constructed model are presented in Section 4. Lastly, in Section 5, the conclusions and discussions that are obtained are evaluated.
In this section, data and methods that are used during the study are explained precisely.
In this study, the data of 42 patients that are obtained in the Center for Breast Health, Near East University Hospital are used. The parameters are determined according to the obtained data.
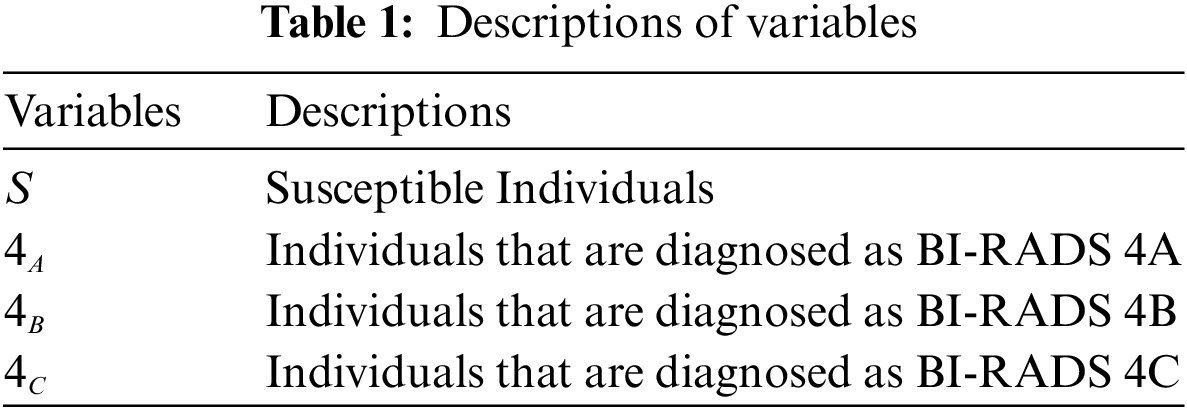
With the help of collected data, the population is divided into 4 compartments; susceptible individuals
In this model,
3 Construction and Analysis of the Model
In this section, the constructed model is given and the existence of the solution is proved. Afterwards, its analysis is given.
3.1 Mathematical Model Formulation
The population, denoted by
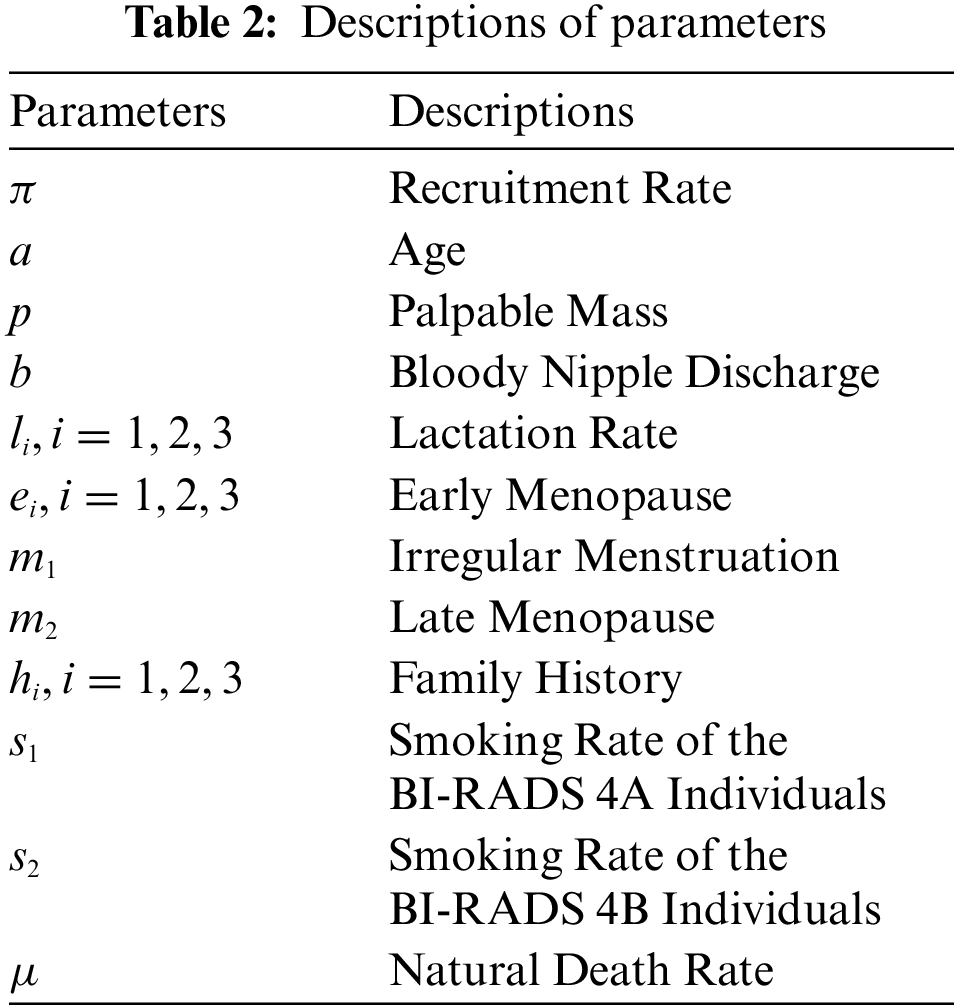
The description of variables and parameters are given in Tables 1 and 2. In the construction of the model, it is assumed that transition between the subcategories process step by step. That is, a member of BI-RADS 4A cannot be a member of BI-RADS 4C directly; it should be a member of BI-RADS 4B. Also, it is assumed that increase in smoking causes any patient to be diagnosed as BI-RADS 4B and BI-RADS 4C because of the idea that smoking may increase the breast cancer risk in long term [27]. In the study, an early menopause is considered as going through menopause before the age of 40 while a late menopause means going through menopause after the age of 55.
Theorem 3.1. Let
is positive, invariant, and all of the solutions in
Proof. Addition of all of the terms that are on the right side of the system gives
From the equality, it is clear that
for some arbitrary constant
3.2 Equilibrium Points and
The Disease Free Equilibrium Point, denoted by
It is obvious that
In this model, 3 different
Dominant eigenvalues of the matrix multiplication
and
are the
Theorem 3.2.1. Disease Free Equilibrium,
Proof. Consider the Lyapunov function
where
Since
It is obvious that
Similarly,
In this part, sensitivity analysis of the parameters is made to see their effects on
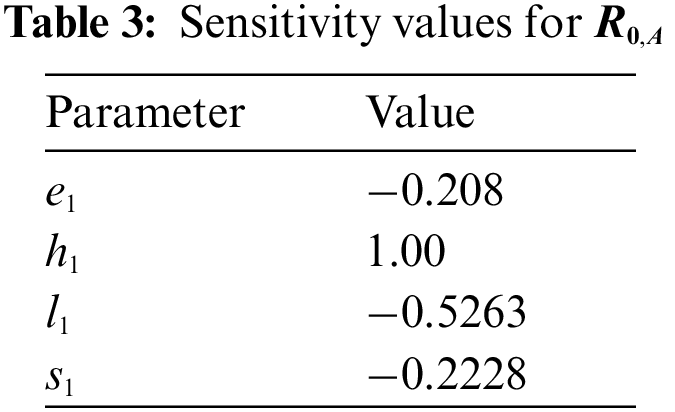
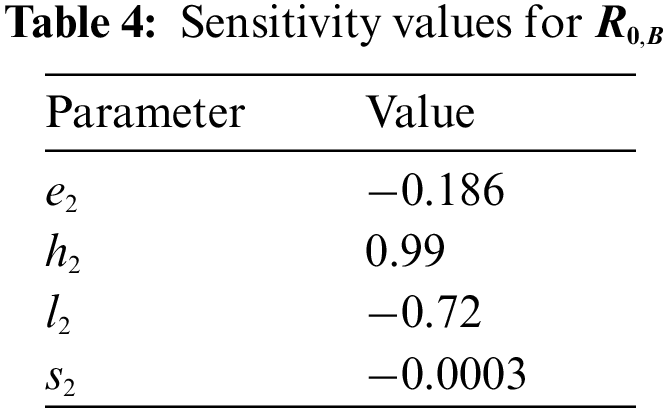
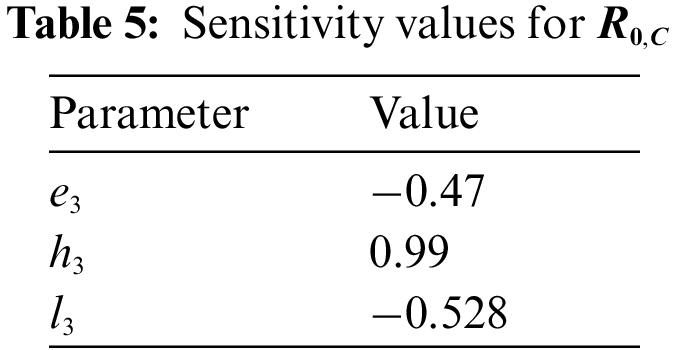
Table 3 shows the importance of high lactation rate and early menopause for the BI-RADS 4A categorization. On the other hand, increase in the smoking rate causes the patients of BI-RADS 4A to be diagnosed as BI-RADS 4B or even higher category. The most effective parameter is the family history. Increase in the members of family history causes increase in
According to the Table 4, likewise BI-RADS 4A, increase in the rate of family history causes an increase in
In Table 5, as in BI-RADS 4A and BI-RADS 4B, increase in the number of members diagnosed as breast cancer before in family causes a serious increase in
4 Results of Numerical Simulations of the Model and Sensitivity Analysis
In this section, numerical simulations for the distribution of BI-RADS 4 subcategories and sensitivity analysis are shown.
Fig. 1 shows that in time, BI-RADS 4A category is expected to extinct and hence BI-RADS 4 category is going to be separated into 2 categories. This may lead a decrease in the range of cancer probability for BI-RADS 4.
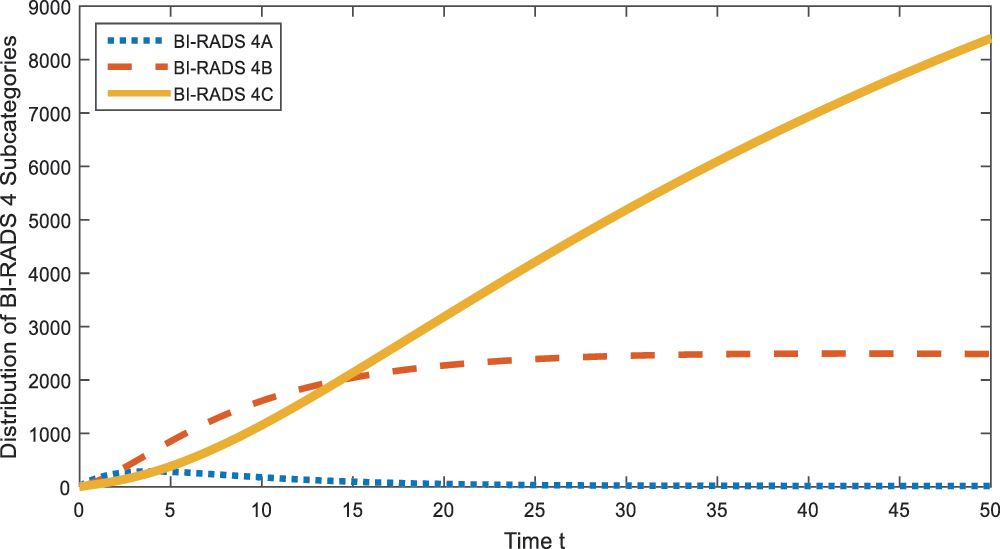
Figure 1: Distribution of BI-RADS 4 subcategories
Here the idea of sensitivity analysis is to increase the values of parameters (from the obtained data) by 10% and see the trend of BI-RADS 4A, BI-RADS 4B, and BI-RADS 4C at time
Figs. 2–4 show the effect of parameter

Figure 2: Sensitivity analysis of the parameter
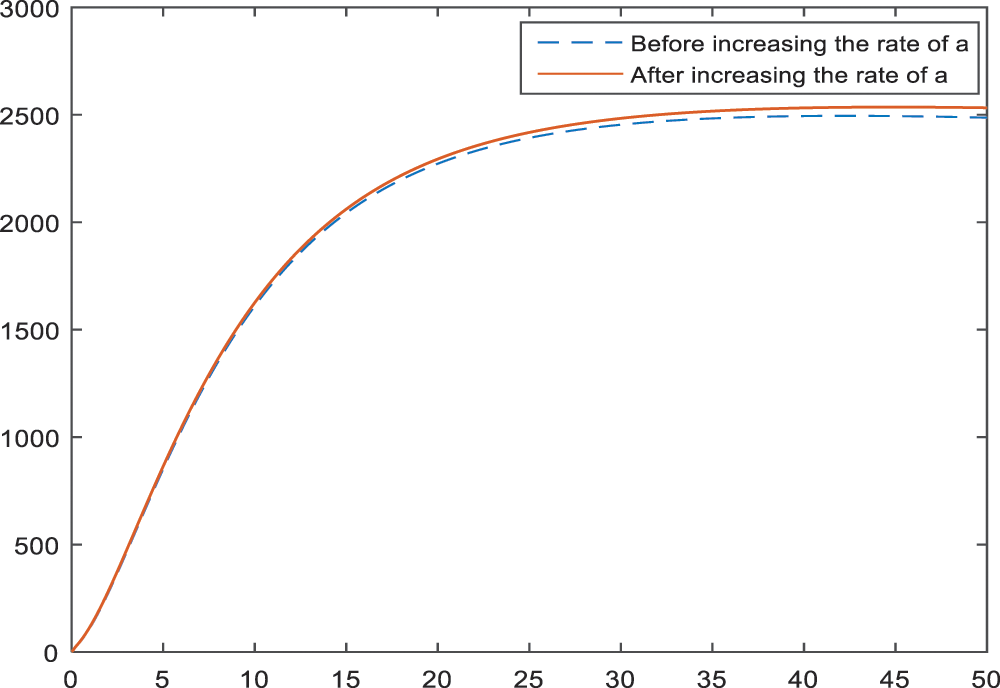
Figure 3: Sensitivity analysis of the parameter
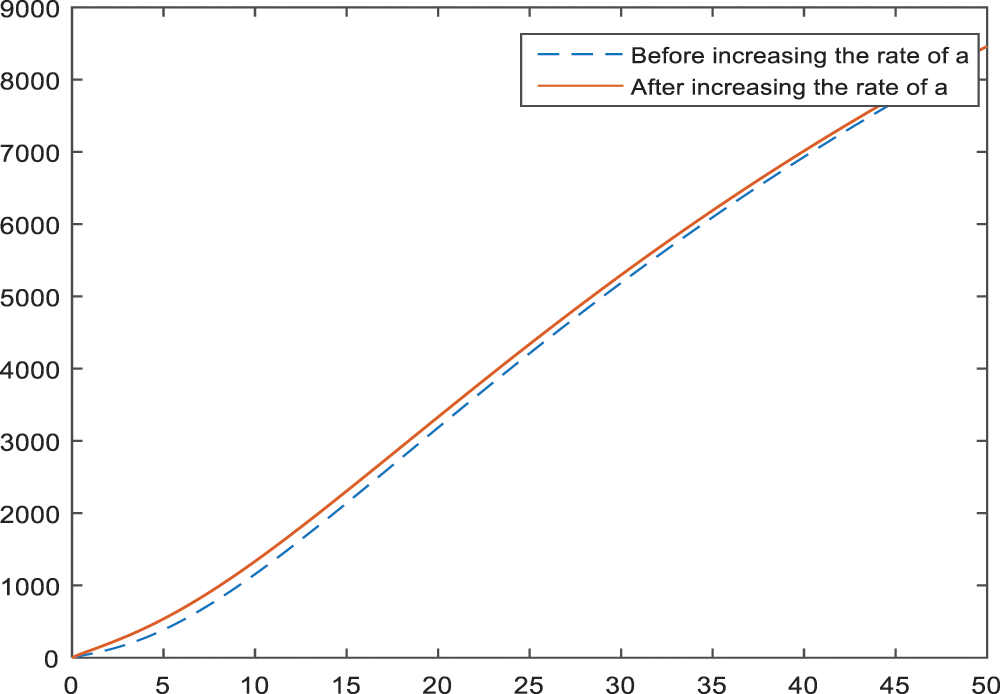
Figure 4: Sensitivity analysis of the parameter
Figs. 5–7 present the effect of parameter
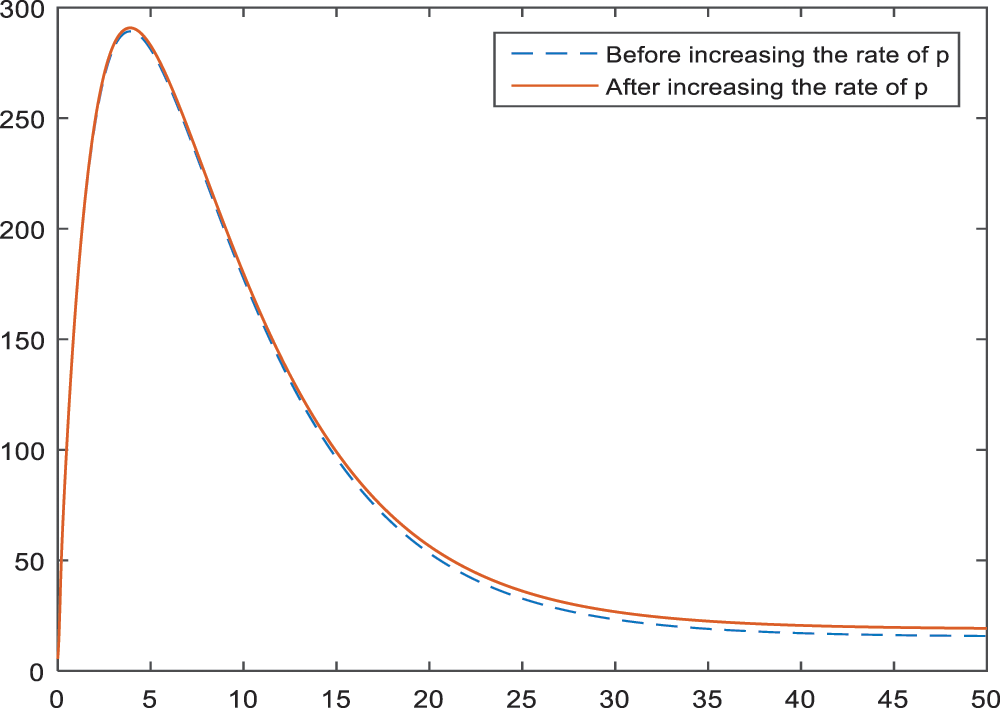
Figure 5: Sensitivity analysis of the parameter
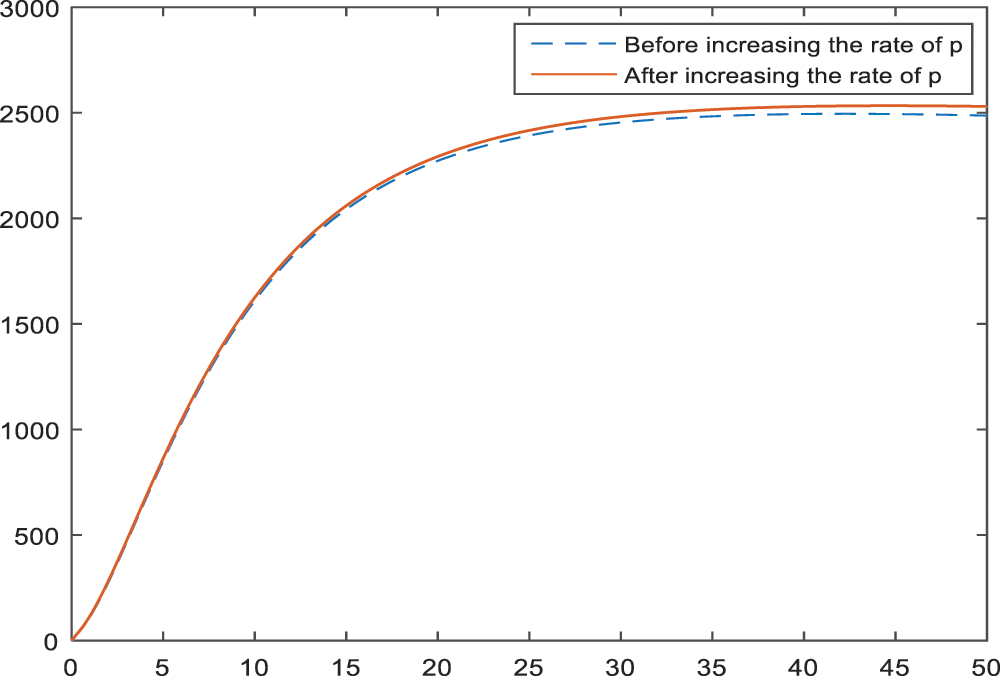
Figure 6: Sensitivity analysis of the parameter
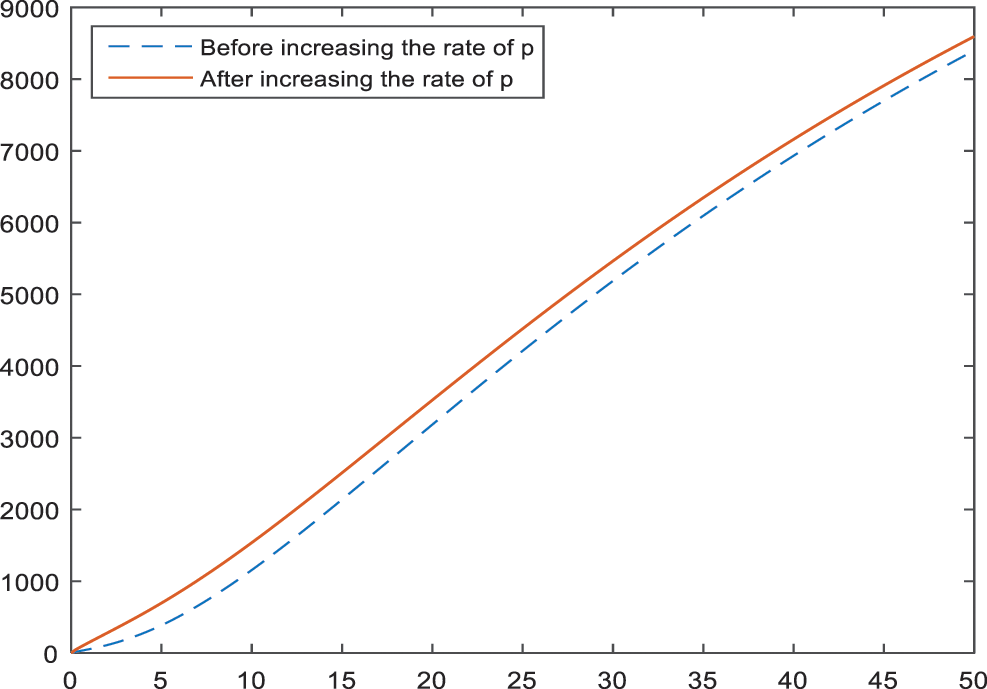
Figure 7: Sensitivity analysis of the parameter
In Figs. 8–10, the effect and hence the importance of parameters
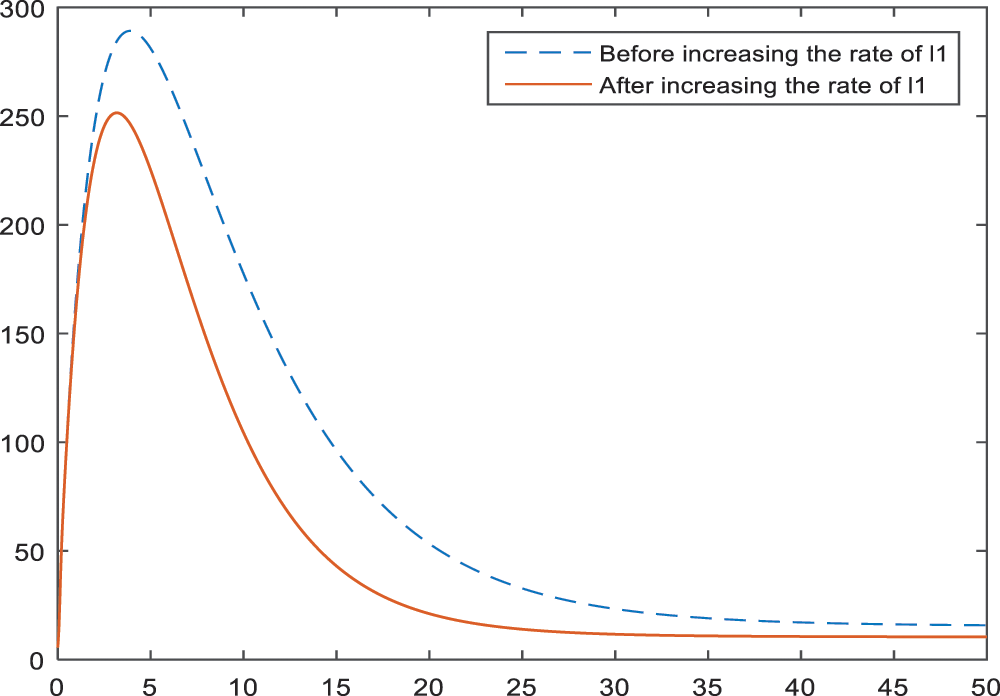
Figure 8: Sensitivity analysis of the parameter
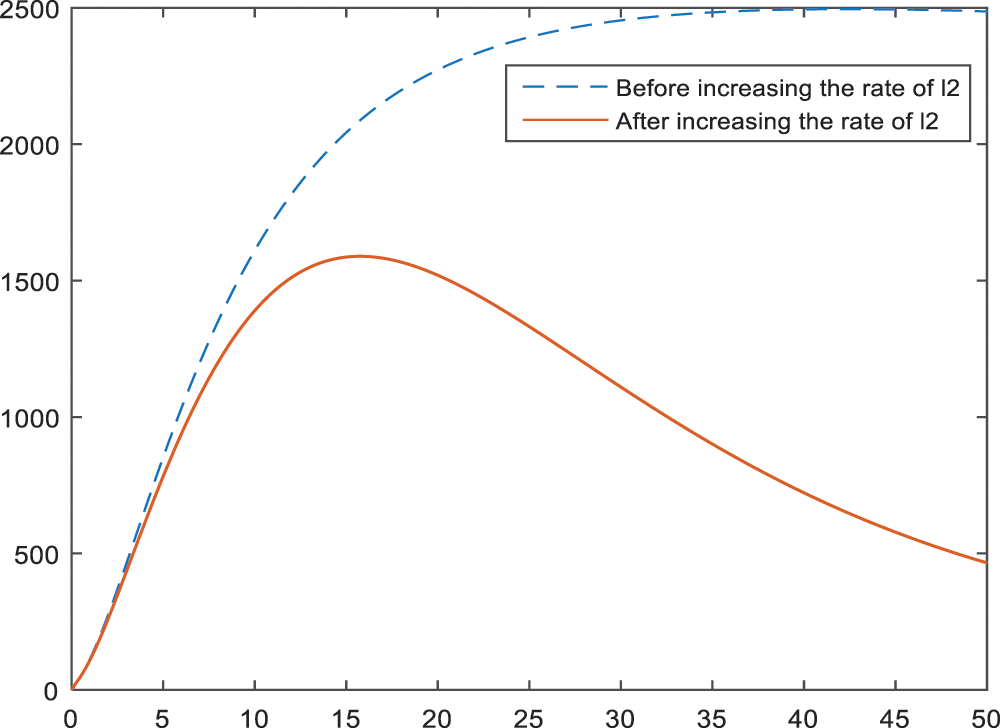
Figure 9: Sensitivity analysis of the parameter
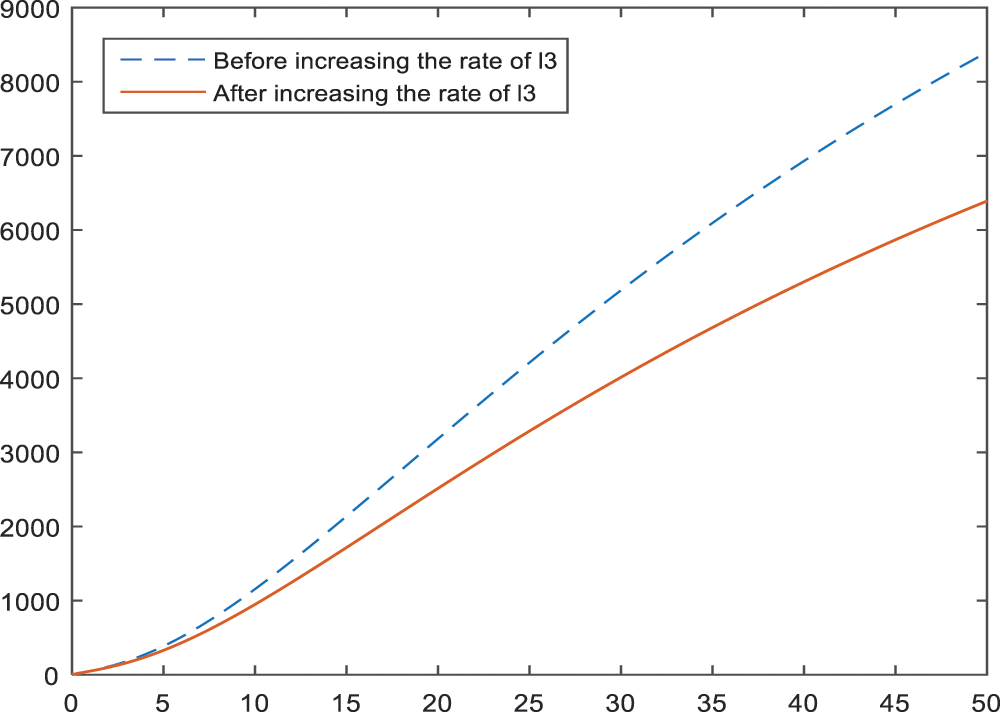
Figure 10: Sensitivity analysis of the parameter
In the Figs. 11–13, the effect of parameters
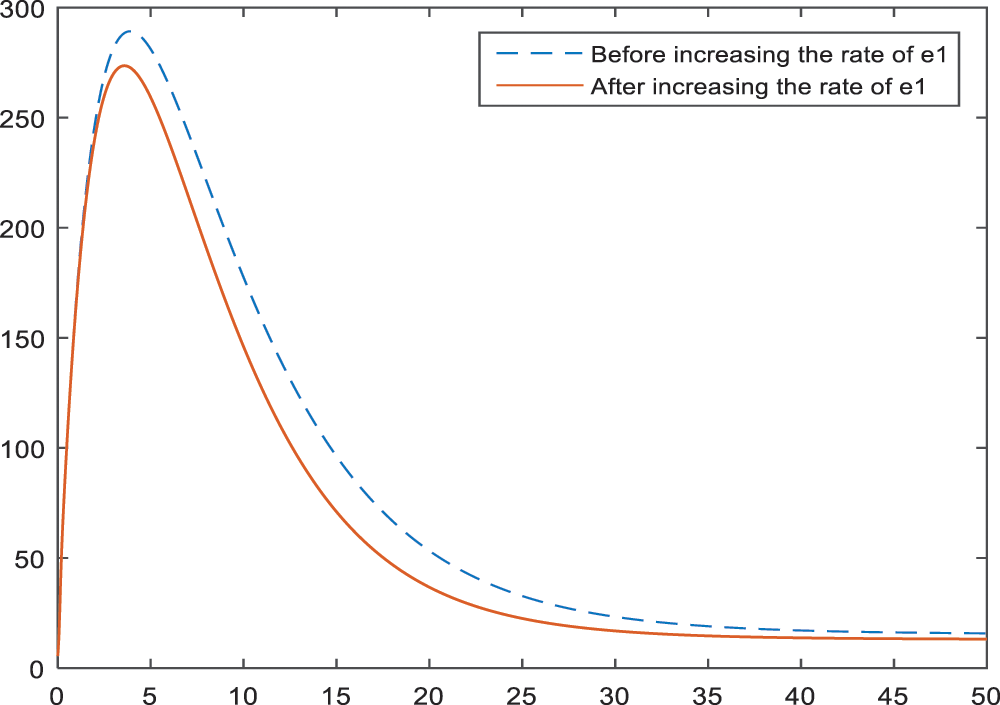
Figure 11: Sensitivity analysis of the parameter
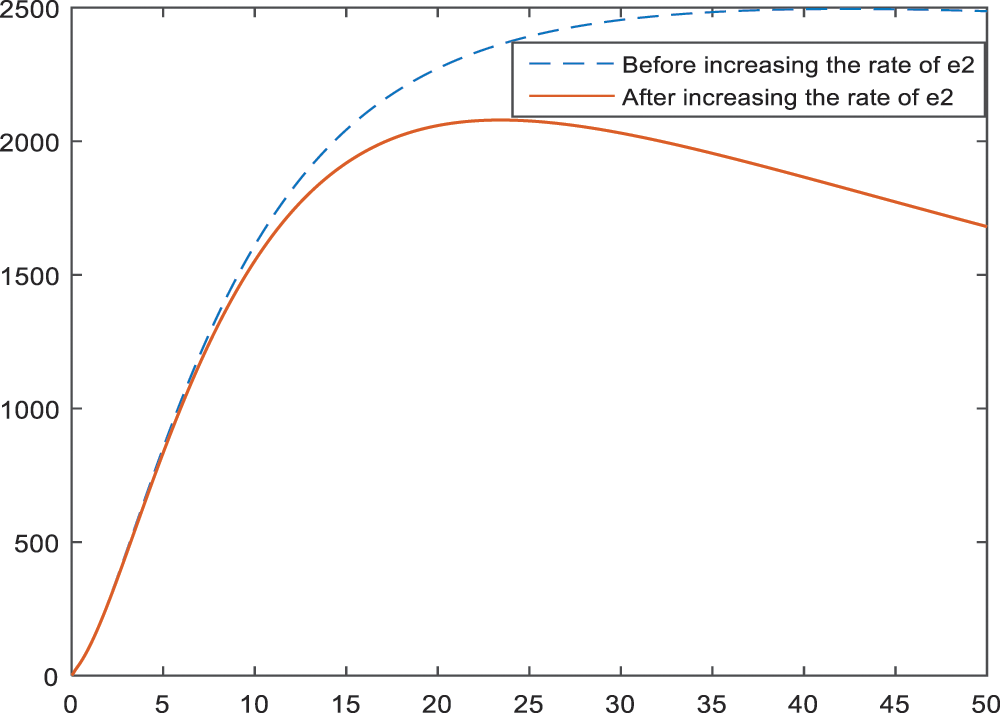
Figure 12: Sensitivity analysis of the parameter
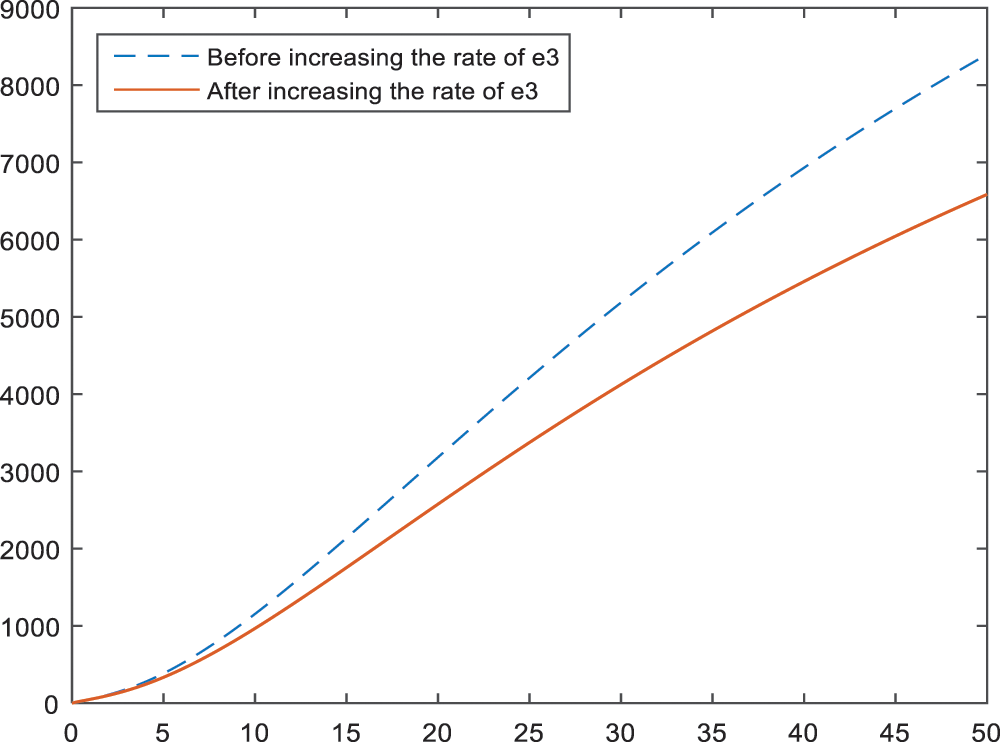
Figure 13: Sensitivity analysis of the parameter
Effect of the parameters
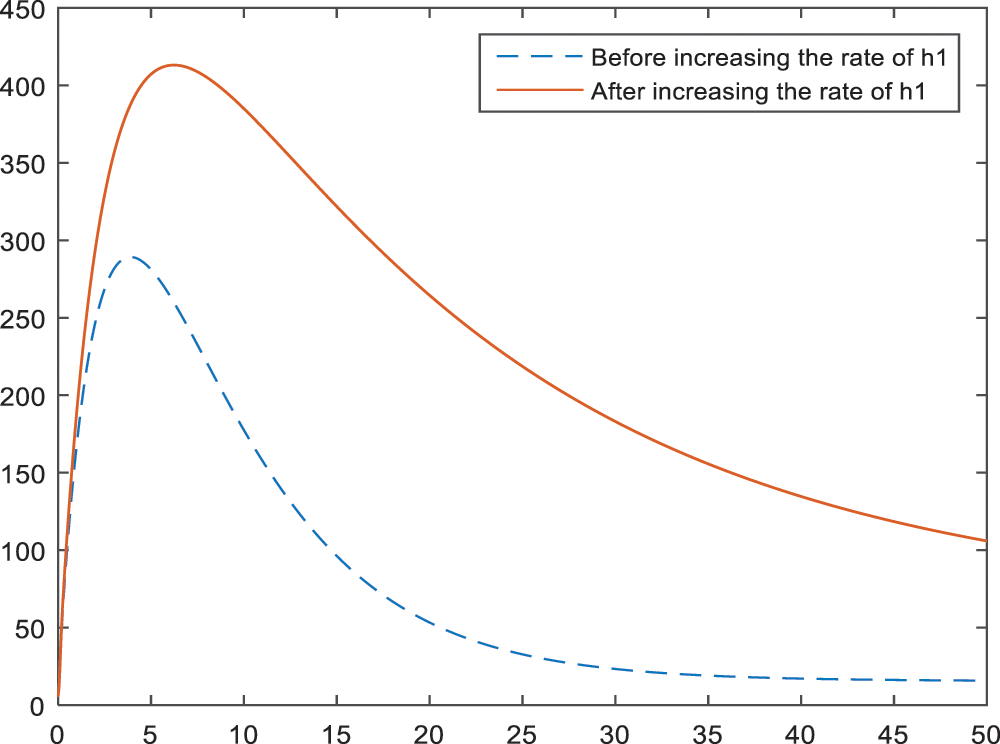
Figure 14: Sensitivity analysis of the parameter
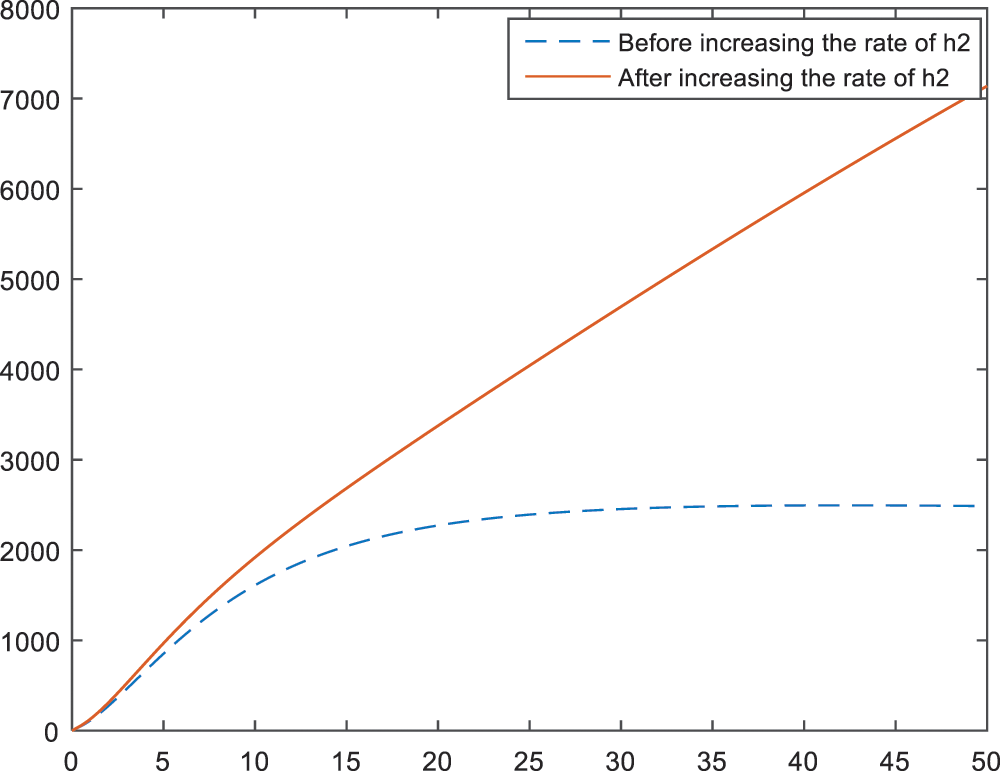
Figure 15: Sensitivity analysis of the parameter
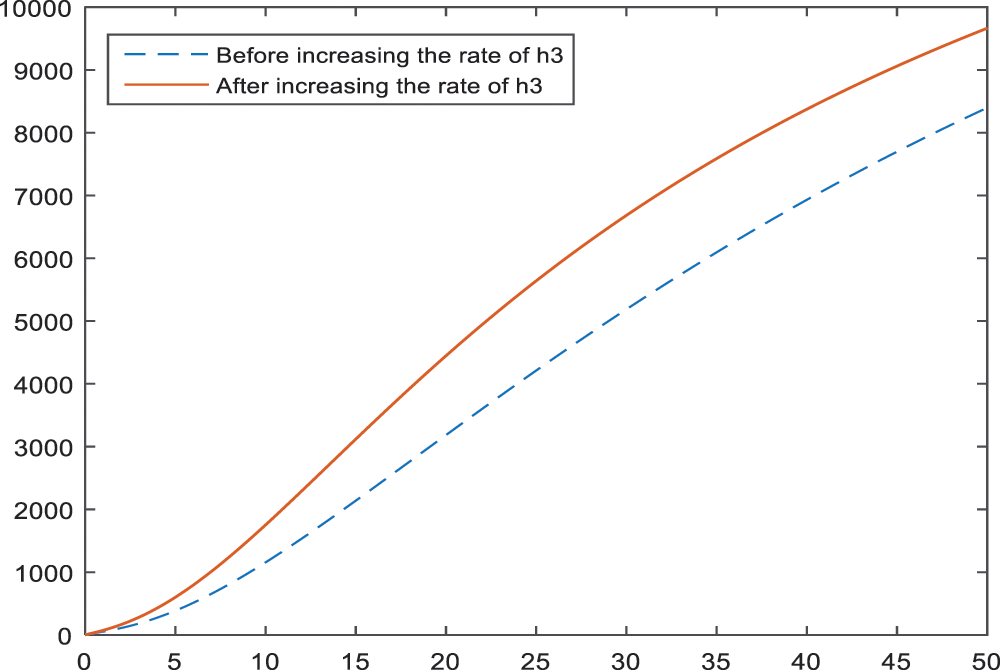
Figure 16: Sensitivity analysis of the parameter
Fig. 17 is obtained to see and show the effect of smoking on the subcategory BI-RADS 4C. Increase in the smoking rate leads an increase in the BI-RADS 4C subcategory, which is expected to happen.
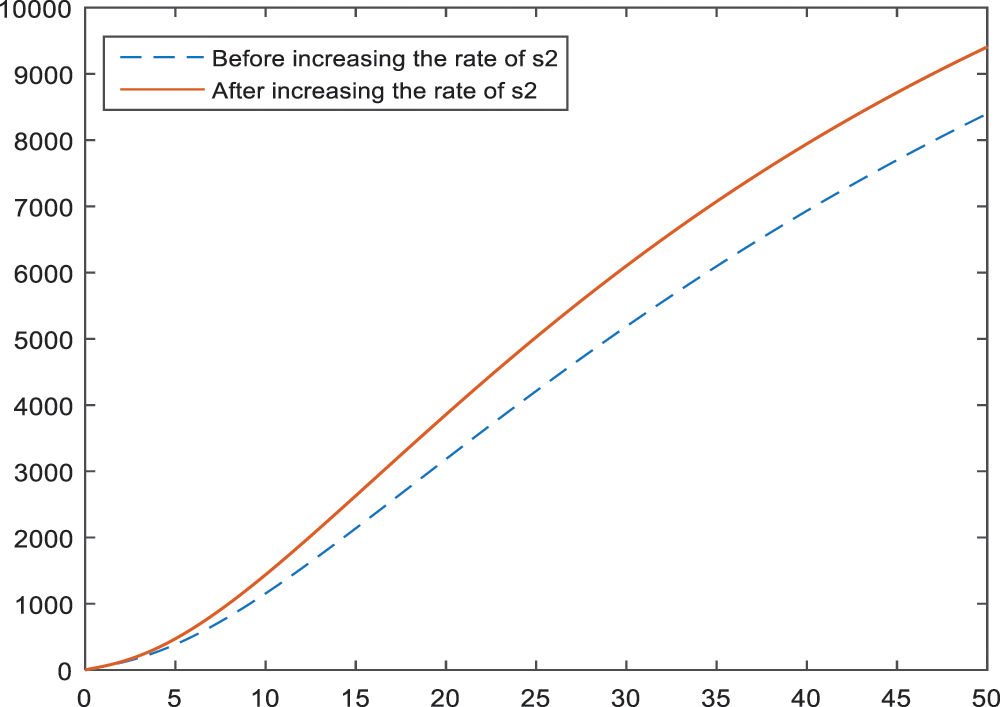
Figure 17: Sensitivity analysis of the parameter
In the Fig. 18, the negative effect of late menopause on BI-RADS 4C is presented. According to the Fig. 18, late menopause and BI-RADS 4C have a considerably relationship.
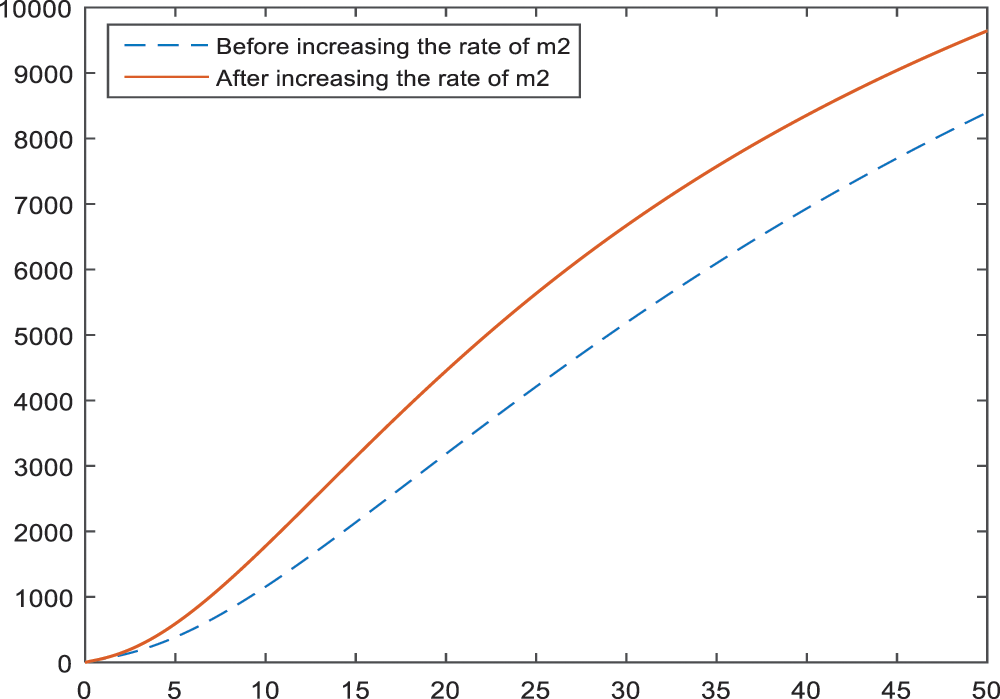
Figure 18: Sensitivity analysis of the parameter
The study is constructed with the aim of reducing the huge range of cancer risk for BI-RADS 4 subcategories. In the analysis of the model, disease-free equilibrium
Simulation of the BI-RADS 4 subcategories, given in Fig. 1, shows that Category of BI-RADS 4 will be divided into 2 categories in the coming years. Hence, it is expected to have more significant properties for the categories so that the diagnosis of patients can be divided into 2 categories which may lead convenience for the radiologists and doctors.
Sensitivity analysis applied to the parameters of the model in Subsection 3 aims to identify the effects of parameters on the BI-RADS 4 subcategories. According to the Figs. 2–4, age has a negative effect on all of the BI-RADS 4 subcategories since it causes an increase in patients. That is, increase in age increases the chance of diagnosing as BI-RADS 4 for people. As it is expected, increase in the palpable mass leads to an increase for each BI-RADS 4 subcategories. The results and the pattern of diagnosis with the increase are obtained and shown in Figs. 5–7 for each BI-RADS 4 subcategory, separately.
An increase in the lactation rate has a positive effect on all BI-RADS 4 subcategories, because it causes an expressive decrease in diagnosis. The results of an increase in the percentage of lactation rate are given in Figs. 8–10 for BI-RADS 4 subcategories, respectively. Especially in the subcategories BI-RADS 4B and BI-RADS 4C, the lactation rate can be one of the most important parameters. This can be interpreted as giving birth decreases the risk of being breast cancer, substantially.
Early menopause is also an important parameter so that women have fewer chance to be diagnosed as BI-RADS 4 (especially BI-RADS 4B and BI-RADS 4C) if they go through menopause earlier. The graph of this result is given in Figs. 11–13.
The numerical results of the model showed that family history is another important parameter for the BI-RADS 4. An increase in the members with cancer history develops an inclination towards BI-RADS 4 diagnosis. This result is shown in Figs. 14–16 for each subcategory, individually. Thus, it can be interpreted as; regular health controls are important and necessary for a person with family history. That is, the breast cancer screenings should be more frequent and maybe detailed or alternative screening modalities like breast magnetic resonance imaging should be used.
In Fig. 17, the effect of increase in smoking in BI-RADS 4C is given. According to the results, smoking plays more important role than some parameters like age or palpable mass in BI-RADS 4C. It causes an increase in BI-RADS 4C which may result in the possession of a tendency towards breast cancer. The option of being a non-smoker is the mere precaution that can be taken against cancer.
The negative effects of late menopause on BI-RADS 4C is shown in Fig. 18. Going through menopause in old ages increases the risk of BI-RADS 4C diagnosis according to the obtained results.
In conclusion, the results showed that being non-smoker, increasing the lactation rate and regular controls (especially for the people with family history) are some of the significant parameters that can be controlled by people themselves. With this way and with the use of screening methods, people can reduce the risk of being cancer since they enable early diagnosis and so treatment.
In addition, the model revealed that BI-RADS 4 subcategories will be divided into 2 compartments in time. This may lead to a meaningful decrease in the range of cancer risk in future with the control of studied parameters. For further studies, a non-standard finite difference scheme can be introduced into systems as in [31] and [32].
Funding Statement: The authors received no specific funding for this study.
Conflicts of Interest: The authors declare that they have no conflicts of interest to report regarding the present study.
References
1. Oke, S. I., Matadi, M. B., Xulu, S. S. (2018). Optimal control analysis of a mathematical model for breast cancer. Mathematical and Computational Applications, 23(2), 21. DOI 10.3390/mca23020021. [Google Scholar] [CrossRef]
2. National Cancer Institute (2021). What is cancer? https://www.cancer.gov/about-cancer/understanding/what-is-cancer. [Google Scholar]
3. Chaurasia, V., Pal, S., Tiwari, B. B. (2018). Prediction of benign and malignant breast cancer using data mining techniques. Journal of Algorithms & Computational Technology, 12(2), 119–126. DOI 10.1177/1748301818756225. [Google Scholar] [CrossRef]
4. WHO (2021). Cancer. https://www.who.int/news-room/fact-sheets/detail/cancer. [Google Scholar]
5. Sung, H., Ferlay, J., Siegel, R. L., Laversanne, M., Soerjomataram, I. et al. (2021). Global Cancer Statistics 2020: GLOBOCAN estimates of incidence and mortality worldwide for 36 cancers in 185 countries. CA: A Cancer Journal for Clinicians, 71(3), 209–249. DOI 10.3322/caac.21660. [Google Scholar] [CrossRef]
6. Akram, M., Iqbal, M., Daniyal, M., Khan, A. U. (2017). Awareness and current knowledge of breast cancer. Biological Research, 50(1), 730. DOI 10.1186/s40659-017-0140-9. [Google Scholar] [CrossRef]
7. Sun, Y. S., Zhao, Z., Yang, Z. N., Xu, F., Lu, H. J. et al. (2017). Risk factors and preventions of breast cancer. International Journal of Biological Sciences, 13(11), 1387–1397. DOI 10.7150/ijbs.21635. [Google Scholar] [CrossRef]
8. WHO (2021). Breast cancer. https://www.who.int/news-room/fact-sheets/detail/breast-cancer. [Google Scholar]
9. American Cancer Society (2019). What is breast cancer? https://www.cancer.org/cancer/breast-cancer/about/what-is-breast-cancer.html. [Google Scholar]
10. CDC (2021). What are the risk factors for breast cancer? https://www.cdc.gov/cancer/breast/basic_info/risk_factors.htm. [Google Scholar]
11. Siteman Cancer Center. [Google Scholar]
12. Jimenez, E. G., Garcia, P. A., Aguilar, M. J., Padilla, C. A., Alvarez, J. (2013). Breastfeeding and the prevention of breast cancer: A retrospective review of clinical histories. Journal of Clinical Nursing, 23(17–18), 2397–2403. DOI 10.1111/jocn.12368. [Google Scholar] [CrossRef]
13. Disha, E. D., Kerliu, S. M., Ymeri, H., Kutllovci, A. (2009). Comparative accuracy of mammography and ultrasound in women with breast symptoms according to age and breast density. Journal of the Association of Basic Medical Sciences, 9(2), 131–136. DOI 10.17305/bjbms.2009.2832. [Google Scholar] [CrossRef]
14. Castro, S. M., Tseytlin, E., Medvedeva, O., Mitchell, K., Visweswaran, S. et al. (2017). Automated annotation and classification of BI-RADS assessment from radiology reports. Journal of Biomedical Informatics, 69, 177–187. DOI 10.1016/j.jbi.2017.04.011. [Google Scholar] [CrossRef]
15. Luo, W., Huang, Q., Huang, X., Hu, H., Zeng, F. et al. (2019). Predicting breast cancer in breast imaging reporting and data system (BI-RADS) ultrasound category 4 or 5 lesions: A nomogram combining radiomics and BI-RADS. Scientific Reports, 9(1), 11921. DOI 10.1038/s41598-019-48488-4. [Google Scholar] [CrossRef]
16. Huppert, A., Katriel, G. (2013). Mathematical modelling and prediction in infectious disease epidemiology. Clinical Microbiology and Infection, 19(11), 999–1005. DOI 10.1111/1469-0691.12308. [Google Scholar] [CrossRef]
17. Yang, H. M. (2014). The basic reproduction number obtained from Jacobian and next generation matrices—A case study of dengue transmission modelling. Biosystems, 126(1), 52–75. DOI 10.1016/j.biosystems.2014.10.002. [Google Scholar] [CrossRef]
18. Tabassum, S., Rosli, N. B., Mazalan, M. S. A. B. (2019). Mathematical modeling of cancer growth process: A review. Journal of Physics: Conference Series, 1366(1), 012018. DOI 10.1088/1742-6596/1366/1/012018. [Google Scholar] [CrossRef]
19. Watanabe, Y., Dahlman, E. L., Leder, K. Z., Hui, S. K. (2016). A mathematical model of tumor growth and its response to single irradiation. Theoretical Biology and Medical Modelling, 13(1), 34. DOI 10.1186/s12976-016-0032-7. [Google Scholar] [CrossRef]
20. Solis-Perez, J. E., Gomez-Aguilar, J. F., Atangana, A. (2019). A fractional mathematical model of breast cancer competition model. Chaos, Solitons & Fractals, 127(1), 38–54. DOI 10.1016/j.chaos.2019.06.027. [Google Scholar] [CrossRef]
21. Baleanu, D., Sajjadi, S. S., Asad, J. H., Jajarmi, A., Estiri, E. (2021). Hyperchaotic behaviors, optimal control, and synchronization of a nonautonomous cardiac conduction system. Advances in Difference Equations, 2021(1), 77. DOI 10.1186/s13662-021-03320-0. [Google Scholar] [CrossRef]
22. Jajarmi, A., Baleanu, D., Vahid, K. Z., Mobayen, S. (2021). A general fractional formulation and tracking control for immunogenic tumor dynamics. Mathematical Methods in the Applied Sciences, 45(2), 667–680. DOI 10.1002/mma.7804. [Google Scholar] [CrossRef]
23. Michor, F., Beal, K. (2015). Improving cancer treatment via mathematical modeling: Surmounting the challenges is worth the effort. Cell, 163(5), 1059–1063. DOI 10.1016/j.cell.2015.11.002. [Google Scholar] [CrossRef]
24. Yousef, A., Bozkurt, F., Abdeljawad, T. (2020). Mathematical modeling of the immune-chemotherapeutic treatment of breast cancer under some control parameters. Advances in Difference Equations, 2020(1), 1305. DOI 10.1186/s13662-020-03151-5. [Google Scholar] [CrossRef]
25. Unni, P., Seshaiyer, P. (2019). Mathematical modeling, analysis, and simulation of tumor dynamics with drug interventions. Computational and Mathematical Methods in Medicine, 2019(1), 1–13. DOI 10.1155/2019/4079298. [Google Scholar] [CrossRef]
26. Castillo-Garsow, C. W., Castillo-Chavez, C. (2020). A tour of the basic reproductive number and the next generation of researchers. In: An Introduction to undergraduate research in computational and mathematical biology, pp. 87–124. Switzerland: Birkhäuser, Cham. [Google Scholar]
27. Momenimovahed, Z., Salehiniya, H. (2019). Epidemiological characteristics of and risk factors for breast cancer in the world. Breast Cancer: Targets and Therapy, 11, 151–164. DOI 10.2147/BCTT. [Google Scholar] [CrossRef]
28. Savasan, A., Kaymakamzade, B., Gokbulut, N., Hincal, E., Yoldascan, E. (2022). Sensitivity analysis of COVID-19 in Mediterranean Island. Computer Modeling in Engineering & Sciences, 130(1), 133–148. DOI 10.32604/cmes.2022.017815. [Google Scholar] [CrossRef]
29. Kamgang, J. C., Sallet, G. (2008). Computation of threshold conditions for epidemiological models and global stability of the disease-free equilibrium (DFE). Mathematical Biosciences, 213(1), 1–12. DOI 10.1016/j.mbs.2008.02.005. [Google Scholar] [CrossRef]
30. Kaymakamzade, B., Sanlidag, T., Hincal, E., Sayan, M., Saad, F. T. et al. (2018). Role of awareness in controlling HIV/AIDS: A mathematical model. Quality & Quantity, 52(1), 625–637. DOI 10.1007/s11135-017-0640-2. [Google Scholar] [CrossRef]
31. Baleanu, D., Zibaei, S., Namjoo, M., Jajarmi, A. (2021). A nonstandard finite difference scheme for the modeling and nonidentical synchronization of a novel fractional chaotic system. Advances in Continuous and Discrete Models, 2021(308), 1–19. DOI 10.1186/s13662-021-03454-1. [Google Scholar] [CrossRef]
32. Ashyralyev, A., Hincal, E., Kaymakamzade, B. (2021). Crank-Nicholson difference scheme for the system of nonlinear parabolic equations observing epidemic models with general nonlinear incidence rate. Mathematical Biosciences and Engineering, 18(6), 8883–8904. DOI 10.3934/mbe.2021438. [Google Scholar] [CrossRef]
 | This work is licensed under a Creative Commons Attribution 4.0 International License, which permits unrestricted use, distribution, and reproduction in any medium, provided the original work is properly cited. |