| Computer Modeling in Engineering & Sciences |
DOI: 10.32604/cmes.2022.020541
ARTICLE
Handling Uncertainty in Human Cognitive Reliability Method for Safety Assessment Based on DSET
1State Key Laboratory of Nuclear Power Safety Monitoring Technology and Equipment, Shenzhen, 518172, China
2School of Automation Engineering, Shanghai University of Electric Power, Shanghai, 200090, China
*Corresponding Author: Xiaoyan Su. Email: suxiaoyan@shiep.edu.cn
Received: 29 November 2021 Accepted: 20 December 2021
Abstract: Human Reliability Analysis (HRA) is an important part in safety assessment of a large complex system. Human Cognitive Reliability (HCR) model is a method of evaluating the probability that operators fail to complete during diagnostic decision making within a limited time, which is widely used in HRA. In the application of this method, cognitive patterns of humans are required to be considered and classified, and this process often relies on the evaluation opinions of experts which is highly subjective and uncertain. How to effectively express and process this uncertain and subjective information plays a critical role in improving the accuracy and applicability of HCR. In this paper, a new model was proposed to deal with the uncertain information which exists in the processes of cognitive pattern classification in HCR. First, an evaluation panel was constructed based on expert opinions and processing including setting corresponding anchor points and qualitative indicators of different cognitive patterns, and mapping them to fuzzy numbers and unit intervals. Second, based on the evaluation panel, different analysts judge the cognitive pattern types of actual specific events and provide the level of confidence he or she has in the judgments. Finally, the evaluation opinions of multiple analysts were expressed and fused based on the Dempster-Shafer Evidence Theory (DSET), and the fused results were applied to the HCR model to obtain the Human Error Probability (HEP). A case study was used to demonstrate the procedure and effectiveness of the proposed method.
Keywords: Safety assessment; human reliability analysis; human cognitive reliability; human error probability; Dempster-Shafer evidence theory
Safety assessment of large complex systems like nuclear power plant, air transportation system, gas system, etc., is important and should be carried out before and during their operations [1–5]. With the development of mechanical science, material science and software system [6–10], the reliability of system and equipment has been notably improved. Human error has become the main factor that influences the safety of human-machine system in large complex systems. Considering the serious consequences of human error, HRA has received great concern and has been widely used in nuclear power plant operation [11,12], transportation [13,14], public health [15–17] and other fields. HRA is defined as the probability that a person can correctly complete the task specified by the system function within the specified time without additional behavior that degrades the system function. Its purpose is to analyze and predict the contribution of humans to the system reliability, reduce and prevent errors caused by humans and ensure the security and reliability of system operation.
Among multitudinous developed HRA methods, HCR is favored by many scholars because of its advantages in effectiveness, availability, reliability and engineering [18–20]. Based on cognitive psychology, the HCR model emphasises the study of the influence of human psychology on operational performance, exploring the mechanism of human error, and quantitatively analyzing the reliability of human behavior using computational models. This method adopts the SRK three-level behavior model as a cognitive model framework, human cognitive behavior can be divided into Skill-based (S), Rule-based (R), Knowledge-based (K) [21]. Skill-based behavior refers to the instinctive response of the operator to the familiar stimulus. Rule-based behavior means that the operator must perform some actions step by step according to the procedure. Knowledge-based behavior means the situation is unfamiliar, even has never been encountered, the operator must make decisions depending on experience and knowledge [21]. Furthermore, in this method, the non-response probability that the operator does not respond to during the accident symptom within the specified task time follows a three-parameter Weibull distribution in which the parameters depend on the type of cognitive behavior. However, there is subjectivity and uncertainty in the classification process because the specific classification mainly depends on the experts evaluation opinion. Moreover, the boundary between the three cognitive patterns is intangible, therefore, the traditional HCR cannot reasonably express and deal with the uncertain opinions of experts, which limits the application of HCR in practice.
Various methods were established to handle uncertain information [22–26]. Compared with the traditional probability theory, DSET [27,28] introduces the power sets of the propositions of interest, and assigns basic belief to those power sets [29]. DSET can not only express random uncertainty effectively, but also express incomplete information and subjective uncertain information. Several approaches were investigated to measure the ability of DSET in handling uncertain information [30–33]. Because of its powerful ability of to process uncertain information, DSET has been a major concern to researchers in the fields of safety assessment, reliability analysis, decision making, pattern classification [34–37]. This paper proposes a new method based on D-S evidence theory to deal with uncertainty in HCR method, aiming to express more effectively the uncertainty in cognitive pattern classification process and reduce subjectivity.
This paper is organized as follows: In Section 2, basic concepts of classical HCR and DSET are introduced. In Section 3, the detailed process of improved HCR model is introduced. In Section 4, a case study proves the effectiveness of the improved HCR model. Section 5 concludes the paper.
2.1 Overview of HCR Method [38]
HCR method is mainly used to deal with human reliability in the process of operator diagnosis after accident. The main purpose of HCR is to quantify the cognitive diagnosis process of operators that is closely related to time, obtain the non-response probability of operators in association with task performance within a specific time, and to describe their relationship with normalized time by using different non-response probability curves for three different behavioral conditions.
2.1.1 Behavior Patterns of HCR Model
In the HCR model, types of human behavior in the system are divided into three categories according to the characteristics of task execution. The model of three-level behavior (SRK) of human is described as follows.
1. Skill-based: Skill-based behaviors are unconscious and do not depend on the complexity of the task. This type of mistake is mainly caused by negligence and do not require decision-making process, and operators respond immediately after stress.
2. Rule-based: Rule-based behaviors refer to those human behaviors that are controlled and dominated by a group of procedures or protocols, and operators deal with this information after stress and select the correct procedures or protocols for implementation.
3. Knowledge-based: Knowkedge-based refers to when a new situation is encountered and there is no readily available procedure, the operator has to rely on their own knowledge and experience to diagnose and deal with it.
The basic flow chart of HCR model is shown in Fig. 1.

Figure 1: Flow chart of HCR
Step 1: Determine the allowable time TA. Before the use of the HCR model in quantifying human behavior, it was assumed that the behavior was time-related. If the correct response time T used by an operator was greater than the allowable time TA, the operator’s non-response error event will occur. The correct response time is the time that the operator takes from fault recognition to correct the response.
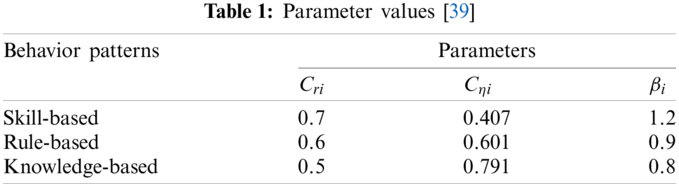
Step 2: Determine the behavior pattern and related parameters. Relevant parameters of HCR were obtained from experiments, and the parameters were different for different experimental subjects. Experimental data of the International Atomic Energy Agency (IAEA) were adopted in this paper, which is shown in Table 1.
Step 3: Determine the nominal performing time
Step 4: Determine correction factor. The HCR method also considers the influence of the operator performance shaping factor (PSF) on the performing time. The nominal performing time
Step 5: Quantify error probability. A three-parameter Weibull distribution (see Eq. (2)) was selected to quantify the operator’s non-response probability
where, T1 / 2 is the corrected median performing time to complete a certain diagnosis decision and response.
2.2 Dempster-Shafer Evidence Theory [27,28]
Definition 2.1 (Frame of Discernment). In this theory, the questions to be decided are formed into a set, which is called the frame of discernment, denoted as
where, proposition A is an element of
Definition 2.2 (Basic Belief Assignment, BBA). If the mapping from the power set
then m is defined as the BBA function on
Definition 2.3 Assume that m is a BBA on
then
Definition 2.4 [Dempster’s rule of combination] The classic Dempster combination rule is used to integrate the effects of multiple BBAs, its essence is the orthogonal sum of evidence.
Assume that X and Y are bodies of evidence and the new evidence C after fusion of X and Y can be calculated as follows:
where K is called conflict coefficient.
Definition 2.5 (Pignistic probability function). Let m be a BBA of
where
The overall flow chart of the improved HCR model is shown in Fig. 2. The main contribution of the new method is reflected in the process of Step 2, and the other steps are basically consistent with the classical HCR method. In classical HCR, the type of behavior is given directly by the experts and each behavior corresponds to only one type. Different from classical HCR, this method does not directly determine the type of behavior. The proportion of each type of behavior (probability distribution) was obtained by integrating the evaluation opinions of multiple experts through uncertainty processing, based on D-S evidence theory. The flow method of the improved Step 2 is described below, and the detailed Steps are as follows.

Figure 2: Flow chart of the improved HCR model
Step 2.1: Construct the judging panel. This step requires related field experts to build a fuzzy judgment panel (see Fig. 3) based on their knowledge and experience, which should contain fuzzy membership function, anchor points and linguistic judgment, so as to guide analysts to make judgments. Since the Rule-based behavior contains most operational behaviors, the membership function corresponding to the Rule-based (R) takes up the largest proportion in the panel. In addition, as there is no obvious and clear boundary between S, R and K, fuzzy numbers are used in this paper for expression, and the ordinate of the intersection point of membership function between fuzzy numbers is 0.5 to facilitate further calculations.

Figure 3: Fuzzy judgment panel
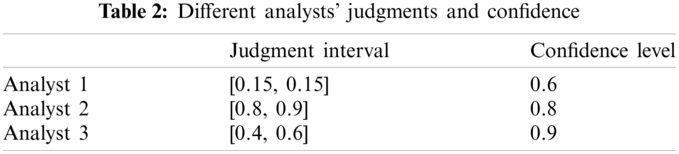
Step 2.2: The analyst makes judgment and gives confidence. In order to fully express fuzzy and uncertain information, the input contents of the analyst was divided into two parts: One is to provide classified evaluation information on the panel. The input can be either a point or an interval, and a point can be regarded as a special form of an interval as shown in Fig. 4. The second is the analyst’s confidence in his evaluation opinion. Confidence degree was used to express the analyst’s confidence in his judgment, ranging from 0 to 1, where 0 means no confidence in his judgment at all and 1 means full confidence [40].

Figure 4: Different judgments of analysts
Fig. 4 and Table 2 show the judgment inputs of different analysts under different circumstances, including evaluations of three behavior types (judgment intervals) as shown in Fig. 4 and confidence in their judgments. Analyst 1 believes that a certain behavior classification depends on the operator’s familiarity with the rules, thus, its judgment is determined at point 0.15, that is, the behavior is between the Rule-based and the Skill-based (S-R) and tends to the Skill-based. In addition, the analyst has the confidence level of 0.6. Analyst 2 suggested that a certain behavior may have abnormal conditions beyond the procedures, which means the behavior is between the Rule-based and the Knowledge-based (S-K), and is more likely to be Knowledge-based. However, the analyst is uncertain about this judgment and cannot locate it to a precise point. Therefore, the judgment interval [0.8,0.9] is given. The confidence level of judgment is 0.8 since the analyst has very high confidence in this judgement. The judgment of Analyst 3 is interval [0.4,0.6], believing that the behavior belongs to the Rule-based behavior, but he is not sure whether the procedure needs to be explained, and his confidence degree is 0.9.
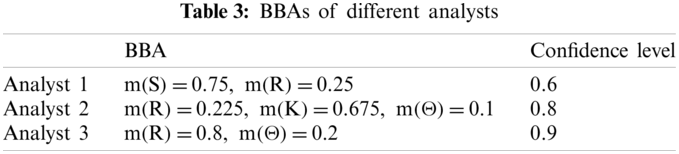
Step 2.3: The BBA is constructed from the judgment of different analysts. In this step, a new BBA generation method was proposed. Assume that the frame of discernment is
where,
The BBAs of other analysts are shown in Table 3.
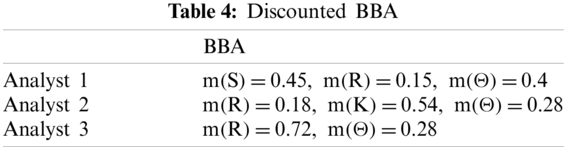
Step 2.4: Discount BBAs based on analysts’ confidence. In this step, the confidence level of the analyst in Step 2.2 is used to discount BBA through the evidence discount formula (see Eq. (5)) to further express uncertain information, i.e., the subjective uncertainty. For example, Table 2 shows that Analyst 2’s confidence in his/her judgment is
The BBAs of different analysts after discounting process are shown in Table 4.
Step 2.5: Fusion of BBA. In order to comprehensively consider the judgment of each analyst, the Dempster’s combination rule (Eq. (6)) was adopted to fuse the judgment of different analysts. The fused result is calculated as follows:
Step 2.6: Probability transformation. After obtaining the fused BBA, the next problem is how to make decisions. The existing decision-making methods are mainly divided into two types: one is to make decisions directly according to the fusion results (fused BBA); the other is to convert fused BBA into a probabilistic form for decision-making. The second decision-making method is adopted in this step, that is, BBA is converted into a probabilistic distribution for decision-making.
In order to convert BBA into probability distribution, Eq. (8) was adopted to realize probability transformation. For the fused BBA obtained in the above process, the probability distribution obtained after transformation is as follows:
Step 2.7: Determine relevant parameters. Different from traditional HCR, this method does not directly determine the behavior type, but redetermines three parameters of Weibull distribution through the probability distribution obtained in the process of probability transformation. The parameter determination method in this step is as follows:
where, X = S, R, K.
In the process of power plant operation, the reactor was shutdown automatically due to the loss of feedwater. In the case of failure of automatic reactor shutdown, according to the nuclear power plant operation procedures, the operator must achieve manual shutdown. The improved HCR model can be used to obtain the probability that the operator cannot complete manual shutdown within the allowed time. The process is shown in Fig. 2. The following is the detailed process:
Step 1: Determine the allowable time;
According to the calculation, the operator must complete the task from the occurrence of the initiating event to the reactor shutdown within 79 s. According to the cognitive process of the operator, it can be divided into three stages, which are exploration, diagnosis and response.
1. Exploration: It is assumed that the information interface on the screen of the control room is unambiguous, the crew operators can easily find the indication signal of pump trip, and the reactor sends out an alarming signal for shutdown. If the automatic shutdown system fails, it will send out an automatic shutdown fault signal. The allowable time of exploration is specified as: T1 = 10s.
2. Diagnosis: According to the information indicated by the instrument, the operator can easily diagnose the occurrence of feedwater loss and automatic shutdown failure events. Regardless of the statistical possibility of incorrect diagnosis, the required diagnosis time is T2 = 15s.
3. Response: Considering that the nuclear power plant has a good ergonomic design, manual shutdown is not prone to negligence errors. Thus, the required response action time can be assumed to be ignored, that is, T3 = 0. The allowable time TA = 79s.
Step 2: Determine related parameters;
Step 2.1: Construct the judging panel;
The judging panel in this case is the same as shown in Fig. 3.
Step 2.2: The analyst makes judgment and gives confidence;
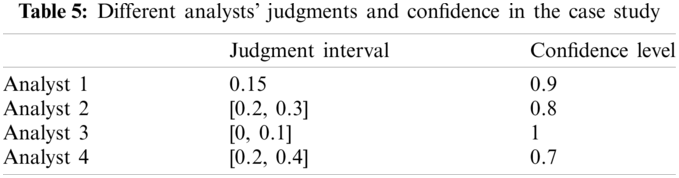
The analyst’s input judgment and confidence are shown in Table 5.
Step 2.3: The BBA is constructed from the judgment of different analysts;
In this step, the judgment of different analysts are converted into BBA, as shown in Table 6.

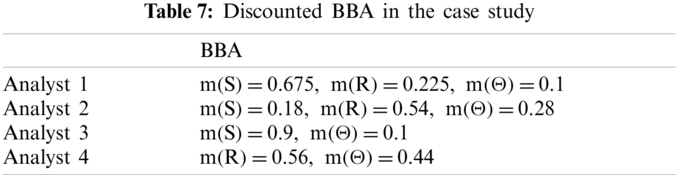
Step 2.4: Discount BBAs based on analysts’ confidence;
The BBAs discounted by Eq. (5) is shown in Table 7.
Step 2.5: Fusion of BBA;
The fused result is
Step 2.6: Probability transformation;
The fused BBA is converted into a probability distribution:
Step 2.7: Determine relevant parameters;
The final parameter is determined as
Step 3: Determine the nominal performing time
The nominal performing time can be obtained from the exploration, diagnosis, and response processes in Step 1, which is
Step 4: Determine correction factor;
PSF parameter values of manual shutdown calculated by HCR model are shown in Table 8. According to the parameters, the actual median response time after PSF correction was obtained according to Eq. (1):

Step 5: Quantify error probability;
According to the non-response probability formula of Weibull distribution (Eq. (2)), the probability that the operator cannot respond to manual shutdown operation in the case of automatic shutdown failure of reactor can be calculated as
By comparing the traditional HCR with the improved HCR, it can be seen that the traditional HCR behavior classification relies on expert experience and existing subjectivity. In addition, the traditional HCR classifies cognitive behaviors into a single cognitive pattern (S, R, K). However, some behaviors are difficult when distinguishing the boundary between skill-based and rule-based (S-R), or the boundary between rule-based and knowledge-based (R-K). Thus, it is too rough to simply categorize them into one category. Also, various evaluations that were given by different analysts may provide some real conclusions on a certain behavior. These information should be used to gain a more reasonable result. The method proposed in this paper applies a calculation model to HCR, which can not only express uncertainty effectively but also reduce subjectivity. The analysts’ judgments can be expressed in the forms of a precision value, an interval or a fuzzy number, and can indicate the confidence of the analysts. Subjectivity reduction benefits from the Dempster’s combination rule, which conforms to the agreements from different sources and reduces subjective uncertainty. Moreover, the probability distribution obtained using this model can be understood as the proportion of different types. It is more reasonable to comprehensively consider the three types of behavior to determine the final parameters.
In order to deal with subjectivity and uncertainty in the determination of cognitive behavior patterns in the traditional HCR methods, this paper proposes an uncertain information processing method based on D-S evidence theory on the basis of HCR. In the process, the analysts can give ambiguous judgments and demonstrate their confidence in the judgment so that they can effectively express the ambiguity and subjective uncertainty of the judgment. Dempster’s rule of combination applied in the process can reduce the subjective uncertainty of the analysts’ judgments. The parameters of Weibull distribution in classical HCR model are redetermined based on linear combination of SRK types. This is quite simple. The relationship of the SRK types in determining parameters in HCR can be further investigated.
Funding Statement: The work is partially supported by Shanghai Natural Science Foundation (Grant No.19ZR1420700), sponsored by Shanghai Rising-Star Program (Grant No. 21QA1403400), Shanghai Key Laboratory of Power Station Automation Technology (Grant No. 13DZ2273800).
Conflicts of Interest: The authors declare that they have no conflicts of interest to report regarding the present study.
1. Sidnyaev, N. (2019). Analytical calculation for reliability validation of nuclear power plants. Atomic Energy, 126(1), 29–33. DOI 10.1007/s10512-019-00509-1. [Google Scholar] [CrossRef]
2. Zhang, X., Mahadevan, S. (2020). Bayesian network modeling of accident investigation reports for aviation safety assessment. Reliability Engineering & System Safety, 209, 107371. DOI 10.1016/j.ress.2020.107371. [Google Scholar] [CrossRef]
3. Meng, D. B., Yang, S. Q., Zhang, Y., Zhu, S. P. (2019). Structural reliability analysis and uncertainties-based collaborative design and optimization of turbine blades using surrogate model. Fatigue & Fracture of Engineering Materials & Structures, 42(6), 1219–1227. DOI 10.1111/ffe.12906. [Google Scholar] [CrossRef]
4. Nahal, M., Khelif, R. (2021). A finite element model for estimating time-dependent reliability of a corroded pipeline elbow. International Journal of Structural Integrity, 12(2), 306–321. DOI 10.1108/IJSI-02-2020-0021. [Google Scholar] [CrossRef]
5. Yang, Y. J., Wang, G. H., Zhong, Q. Y., Zhang, H., Chen, H. J. (2021). Reliability analysis of gas pipeline with corrosion defect based on finite element method. International Journal of Structural Integrity, 12(6), 854–863. DOI 10.1108/IJSI-11-2020-0112. [Google Scholar] [CrossRef]
6. Liao, D., Zhu, S. P., Keshtegar, B., Qian, G., Wang, Q. (2020). Probabilistic framework for fatigue life assessment of notched components under size effects. International Journal of Mechanical Sciences, 181, 105685. DOI 10.1016/j.ijmecsci.2020.105685. [Google Scholar] [CrossRef]
7. He, J. C., Zhu, S. P., Liao, D., Niu, X. P. (2020). Probabilistic fatigue assessment of notched components under size effect using critical distance theory. Engineering Fracture Mechanics, 235, 107150. DOI 10.1016/j.engfracmech.2020.107150. [Google Scholar] [CrossRef]
8. Li, Y. H., Sheng, Z. Q., Zhi, P. P., Li, D. M. (2021). Multi-objective optimization design of anti-rolling torsion bar based on modified NSGA-III algorithm. International Journal of Structural Integrity, 12(1), 17–30. DOI 10.1108/IJSI-03-2019-0018. [Google Scholar] [CrossRef]
9. Zhi, P., Li, Y., Chen, B., Li, M., Liu, G. (2019). Fuzzy optimization design-based multi-level response surface of bogie frame. International Journal of Structural Integrity, 10(2), 134–148. DOI 10.1108/IJSI-10-2018-0062. [Google Scholar] [CrossRef]
10. Li, Y., Zhang, C., Yin, H., Cao, Y., Bai, X. (2021). Modification optimization-based fatigue life analysis and improvement of EMU gear. International Journal of Structural Integrity, 12(5), 760–772. DOI 10.1108/IJSI-07-2021-0072. [Google Scholar] [CrossRef]
11. Qing, T., Liu, C., Zhang, L. (2021). Application of SPAR-H method in human reliability analysis of digital nuclear power plant. Nuclear Power Engineering, 42(3), 126–131. DOI 10.13832/j.jnpe.2021.03.0126. [Google Scholar] [CrossRef]
12. Chen, S., Zhang, L., Qing, T. (2021). A human reliability analysis methodology based on an extended phoenix method for severe accidents in nuclear power plants. Reliability Engineering & System Safety, 214, 107750. DOI 10.1016/j.ress.2021.107750. [Google Scholar] [CrossRef]
13. Prilana, R. E., Bowo, L. P., Furusho, M. (2021). A hybrid methodology for human reliability assessment in maritime cargo accidents. IOP Conference Series: Materials Science and Engineering, 1052(1), 012037. DOI 10.1088/1757-899X/1052/1/012037. [Google Scholar] [CrossRef]
14. Sun, Y. (2020). Research on reliability evaluation method of high speed railway traffic dispatching system. Technical Report. China Academy of Railway Sciences. [Google Scholar]
15. Jones, M. D. (2021). Use of pediatric injectable medicines guidelines and associated medication administration errors: A human reliability analysis. Annals of Pharmacotherapy, 55(11), 1333–1340. DOI 10.1177/1060028021999647. [Google Scholar] [CrossRef]
16. Asghar, A. (2020). Determining the optimal human reliability analysis (HRA) method in healthcare systems using fuzzy ANP and fuzzy TOPSIS. Journal of Patient Safety and Risk Management, 25(3), 123–133. DOI 10.1177/2516043519900431. [Google Scholar] [CrossRef]
17. Rossella, O., Paolo, T. (2020). A methodology for dynamic human reliability analysis in robotic surgery. Applied Ergonomics China Safety Science Journal, 88, 103150. DOI 10.1016/j.apergo.2020.103150. [Google Scholar] [CrossRef]
18. Zou, S. L., Huang, B. H., Li, S. F. (2020). Human cognitive reliability model of marine floating nuclear power plants. China Safety Science Journal, 30(1), 1–6. DOI 10.16265/j.cnki.issn1003-3033.2020.01.001. [Google Scholar] [CrossRef]
19. Jiang, J. J., Wang, Y. Q., Zhang, L. (2018). A cognitive reliability model research for complex digital human-computer interface of industrial system. Safety Science, 108, 196–202. DOI 10.1016/j.ssci.2017.07.016. [Google Scholar] [CrossRef]
20. Chen, J., Zhou, D., Chuan, L., Zhu, X. (2018). A method of human reliability analysis and quantification for space missions based on a Bayesian network and the cognitive reliability and error analysis method. Annals of Nuclear Energy, 34(5), 912–927. DOI 10.1002/qre.2300. [Google Scholar] [CrossRef]
21. Rasmussen, J. (1983). Skills, rules, and knowledge; signals, signs, and symbols, and other distinctions in human performance models. IEEE Transactions on Systems, Man, and Cybernetics, SMC-13(3), 257–266. DOI 10.1109/TSMC.1983.6313160. [Google Scholar] [CrossRef]
22. Deng, J. X., Deng, Y. (2021). Information volume of fuzzy membership function. International Journal of Computers Communications & Control, 16(1), 4106. DOI 10.15837/ijccc.2021.1.4106. [Google Scholar] [CrossRef]
23. Xiao, F. Y. (2021). Caftr: A fuzzy complex event processing method. International Journal of Fuzzy Systems, 24, 1098–1111. DOI 10.1007/s40815-021-01118-6. [Google Scholar] [CrossRef]
24. Deng, Y. (2020). Uncertainty measure in evidence theory. Science China Information Sciences, 63(11), 210201. DOI 10.1007/s11432-020-3006-9. [Google Scholar] [CrossRef]
25. Gao, Q. Y., Wen, T., Deng, Y. (2021). Information volume fractal dimension. Fractals, 29(8), 2150263. DOI 10.1142/S0218348X21502637. [Google Scholar] [CrossRef]
26. Deng, X. Y., Jiang, W. (2019). D number theory based game-theoretic framework in adversarial decision making under a fuzzy environment. International Journal of Approximate Reasoning, 106, 194–213. DOI 10.1016/j.ijar.2019.01.007. [Google Scholar] [CrossRef]
27. Dempster, A. P. (1967). Upper and lower probabilities induced by a multivalued mapping. The Annals of Mathematical Statistics, 38(2), 325–339. DOI 10.1214/aoms/1177698950. [Google Scholar] [CrossRef]
28. Shafer, G. (1976). A mathematical theory of evidence. USA: Princeton University Press. [Google Scholar]
29. Song, Y. T., Deng, Y. (2021). Entropic explanation of power set. International Journal of Computers Communications & Control, 16(4), 4413. DOI 10.15837/ijccc.2021.4.4413. [Google Scholar] [CrossRef]
30. Deng, Y. (2020). Information volume of mass function. International Journal of Computers Communications & Control, 15(6), 3983. DOI 10.15837/ijccc.2020.6.3983. [Google Scholar] [CrossRef]
31. Li, Y., Deng, Y. (2018). Generalized ordered propositions fusion based on belief entropy. International Journal of Computers Communications & Control, 13(5), 792–807. DOI 10.15837/ijccc.2018.5.3244. [Google Scholar] [CrossRef]
32. Gao, X., Deng, Y. (2020). The pseudo-pascal triangle of maximum deng entropy. International Journal of Computers Communications & Control, 15(1), 1006. DOI 10.15837/ijccc.2020.1.3735. [Google Scholar] [CrossRef]
33. Deng, X., Cui, Y., Jiang, W. (2021). An ECR-PCR rule for fusion of evidences defined on a non-exclusive framework of discernment. Chinese Journal of Aeronautics. DOI 10.1016/j.cja.2021.06.004. [Google Scholar] [CrossRef]
34. Su, X. Y., Mahadevan, S., Xu, P. D., Deng, Y. (2015). Dependence assessment in human reliability analysis using evidence theory. Risk Analysis, 35(7), 296–316. DOI 10.1111/risa.12347. [Google Scholar] [CrossRef]
35. Liu, Q. (2020). Coverage reliability evaluation of wireless sensor network considering common cause failures based on D-S evidence theory. IEEE Transactions on Reliability, 70(1), 331–345. DOI 10.1109/TR.2020.2999576. [Google Scholar] [CrossRef]
36. Xiao, F. Y. (2021). CEQD: A complex mass function to predict interference effects. IEEE Transactions on Cybernetics, 1–13. DOI 10.1109/TCYB.2020.3040770. [Google Scholar] [CrossRef]
37. Liu, Z. G., Zhang, X. X., Niu, J. W., Dezert, J. (2021). Combination of classifiers with different frames of discernment based on belief functions. IEEE Transactions on Fuzzy Systems, 29(7), 1764–1774. DOI 10.1109/TFUZZ.2020.2985332. [Google Scholar] [CrossRef]
38. Wakefield, D. J. (1988). Application of the human cognitive reliability model and confusion matrix approach in a probabilistic risk assesmeent. Reliability Engineering & System Safety, 22(1), 295–312. DOI 10.1016/0951-8320(88)90080-4. [Google Scholar] [CrossRef]
39. Zhang, L., He, X., Dai, L. C., Huang, X. R. (2007). The simulator experimental study on the operator reliability of qinshan nuclear power plant. Reliability Engineering & System Safety, 92(2), 252–259. DOI 10.1016/j.ress.2005.12.005. [Google Scholar] [CrossRef]
40. Gao, X. H., Su, X. Y., Qian, H., Pan, X. L. (2021). Dependence assessment in human reliability analysis under uncertain and dynamic situations. Nuclear Engineering and Technology, 54(8), 948–958. DOI 10.1016/j.net.2021.09.045. [Google Scholar] [CrossRef]
 | This work is licensed under a Creative Commons Attribution 4.0 International License, which permits unrestricted use, distribution, and reproduction in any medium, provided the original work is properly cited. |