| Computer Modeling in Engineering & Sciences |
DOI: 10.32604/cmes.2022.017967
ARTICLE
Foundation Treatment in Urban Underground Engineering Using Big Data Analysis for Smart City Applications
1School of Civil and Transportation Engineering, Beijing University of Civil Engineering and Architecture, Beijing, 102616, China
2Beijing Advanced Innovation Center for Future Urban Design, Beijing, 102616, China
3School of Science, Beijing University of Civil Engineering and Architecture, Beijing, 102616, China
*Corresponding Author: Jian Zhang. Email: Jianzhang1452@outlook.com
Received: 19 June 2021; Accepted: 15 December 2021
Abstract: A core element of the sustainable approach to global living quality improvement can now become the intensive and organized usage of underground space. There is a growing interest in underground building and growth worldwide. The reduced consumption of electricity, effective preservation of green land, sustainable wastewater and sewage treatment, efficient reverse degradation of the urban environment, and reliable critical infrastructure management can improve the quality of life. At the same time, technological innovations such as artificial intelligence (AI), cloud computing (CC), the internet of things (IoT), and big data analytics (BDA) play a significant role in improved quality of life. Hence, this study aims to integrate the technological innovations in urban underground engineering to ensure a high quality of life. Thus, this study uses big data analytics to carry out the status quo of foundation treatment and proposes a conceptual framework named the BDA with IoT on urban underground engineering (BI0T-UUE). This framework connects hidden features with various high-level sensing sources and practical predictive model characterization to lower building costs, productive infrastructure management, preparedness for disasters, and modern community smart services. The IoT integration gives an optimum opportunity to work towards the functionality of “digital doubles” of secret infrastructure, both economical and scalable, with the increasing sophistication and tooling of the underworld. The simulation analysis ensures the highest efficiency and cost-effectiveness of the underground engineering with a value of 96.54% and 97.46%.
Keywords: Underground engineering; internet of things; big data analytics; status quo; economic and social; smart city
1 Overview of Urban Underground Engineering using Big Data Analysis for Smart City Applications
Smart cities have a strategic plan covering substantial usage of the underground [1]. Well-planned underwater infrastructure can positively affect land use and development decisions and minimize vehicle usage and related effects [2]. High-density urban centers, however, could rely on centralized services and improve sustainable development [3]. Multiple difficulties connected to expanding city-regions can be addressed with underground transport infrastructures [4]. The underground has provided shelter, supplies, foundations for surface constructions and a venue for spiritual or creative expression for thousands of years [5]. More recently, key infrastructures have been underground by the closeness to services, surface conservation, insulation and containment of climate or security, reducing construction and energy cost, improving traffic flow, and many esthetic advantages [6]. Underground space is typically unavailable in highly urbanized places for three-dimensional liberty [7]. Under cities, rivers and mountains can be constructed infrastructure systems [8]. Millions of individuals depend on these systems with little regard to comfort and convenience [9]. New underground infrastructure can promote or facilitate the redirection of urban growth towards sustainable patterns. Therefore, resilient, well-maintained and efficient subsurface infrastructure is vital in sustainable development [10].
Big data can be valuable in one area of application to enhance sustainable soil water management [11]. Groundwater well field data can be entirely digitized. More systemic techniques have been taken to design or manage urban underground and more general developments in describing and analyzing cities as systems [12]. This concept is effectively utilized in the shale gas business where operative data, written notes, and user input are assessed directly for drilling and manufacturing activities [13]. Constructing, operating and maintaining infrastructure requires managing a complex and well-functioning physical, social and environmental system [14]. The United States suffers from a lack of a government mission agency or organization to coordinate development activity across underground infrastructure development sectors [15,16]. Including experts in underground design and building, trenchless technologies, risk assessment, geo-technology visualization techniques, sustained infrastructure development, life cycle evaluation, infrastructure policy and planning, preventive fire, safety and ventilation in underground environments [17,18]. Big data analysis is a revolutionary new concept that describes the application of modern, traditionally analytical approaches to use large amounts of heterogeneous data to offer significant insights to promote optimization, development and discovery of knowledge [19]. To date, many industries have enhanced knowledge about their operational environments by the rise of data from online social media, internet activities, commercial transactions, science missions, digitalization and sensor technology, etc. [20].
BI0T-UUE presents an outlook that can be valuable for upcoming underground engineering. It begins by evaluating the present state of the art and then recommends a way ahead in improved decision-making processes about increasingly complex urban infrastructure location, strategy, building, operation and inquiry. If successfully done, our urban environment will be enhanced. The natural, physical and human/social urban environment is robust and gives the quality of life. The IoT integration provides an optimally designed possibility, with increased complexity and tools, for working towards the operation of the hidden infrastructure of digital doubles.
The main contribution of BI0T-UUE is listed below:
• In Urban underground Engineering, big data analysis (BDA) and IoT contribute to integrating technology innovation to guarantee a high quality of life.
• Determine the mathematical model to estimate the underground planning for the growth of the smart city.
• The numerical outcomes recommended BI0T-UUE enhances the development ratio, the throughput of the dataset depending on data size, system performance, propagation loss and efficiency ratio compared to other existing models.
The remainder of this paper can be arranged accordingly. In Section 2 describe the related study on the urban underground. In Section 3 summarize the proposed study that has been utilized in BI0T-UUE. The simulation outcomes and discussion are described in Section 4. Lastly, Section 5 accomplishes this paper with a detailed discussion of the observation and outcomes.
The information in this paper is based on a literature review. The analysis and extraction of vital information from major data research, big data analysis, and groundwater discipline can determine the present level of knowledge about Big Data in the urban underground. The processes that have been done provide an integral decision-making tool to analyze, choose and refine a range of solutions for the more sustainable underground infrastructure plan.
Ma et al. [21] recommended Cutting-edge sensing technologies (CEST) offer fascinating possibilities for conditions assessment and predictive maintenance. Fiber optics and other sophisticated sensing technologies are introduced, depending on the features of underground development. Such approaches have become commercially accessible and address the construction and monitoring objectives of high-resolution urban underground engineering.
Xu et al. [22] suggested that the Transit-oriented development (TOD) policies have been implemented to develop the underground urban areas in metropolitan construction zones rapidly, and urban rail transit construction has been promoted. Spatial vitality is directly tied to space efficiency as one of the key assessment characteristics for the urban underground spaces (UUS) layout.
Li et al. [23] modeled Driver-free vehicles have been created and placed in industrial production with the continuing development of the Artificial Intelligence technology (AIT) business. Transport is certainly a vital element in the entire manufacturing process for the mining sector. As mining engineers, users have presented the ideas of this integrated system in the paper and still have to work hard for the future of the underground coal mines.
Cui et al. [24] recommended city-related renovation (CRR) schemes for the rapid growth of the world's population in the 21st century with accompanying challenges in transport and ecology, leading to the construction of underground urban areas. This study examines the literature on the use of underground urban space as a means of urban renovation to better understand how subterranean urban space can contribute to urban renewal and obstacles and triumphs.
Zhu et al. [25] suggested a pseudo-static approach (PSA) for liquefiable saturated sand; underground constructions are disposed to seismic destruction. Current conception codes and recommendations advocate various simpler underground structures for PS seismic reply analysis approaches and lack of suitable liquefiable validation. In this work, four classes of simplified PSA are assessed for their performance in saturated sand. These approaches include a scroll-based technique, a power-based technique, a flexibility ratio, a racking ratio, and a thorough PSA.
BI0T-UUE methods have been proposed to develop urban underground planning to overcome the existing techniques, CEST, TOD, AIT, CRR, and PSA. BDA has recommended improving the development ratio, the throughput of the dataset depending on data size, system performance, propagation loss and efficiency ratio.
3 The Proposed BDA with IoT on Urban Underground Engineering (BI0T-UUE)
The idea of a smart city has distinct meanings from the people’s point of view vs. technology. This is evident when countries take up efforts to become smart cities because they offer specific perspectives in the smart city. Although the smart city phenomenon is prevalent over the world, its definition remains unclear. In other words, there is no agreed concept of a smart city yet, and a standard worldwide meaning has proven difficult to identify. Nevertheless, most definitions emphasize similar elements, components and traits that could indicate the views of smart buildings. Instances include improving the quality of life for a certain portion of the city by using IT hardware, software, networks and data on different municipal districts and services. It could include many city components, including natural resources, infrastructure, electricity, transport, education, health, governance and public safety [26–28].
Fig. 1 shows the proposed BDA with IoT on urban underground engineering. An intelligent platform can be developed to implement a smart city solution that coordinates smart city operations, including data collection, data processing and analysis, administration of systems, and involvement of urban stakeholders [29]. Wired and wireless technologies connect urban processes, urban infrastructure, users, and urban areas to create this system. It gathers and verifies data integrity and stores raw and processed data through these connections to the system. It has often been featured data on digital urban system digital modeling tools, such as geographic information systems and information modeling for buildings, acquired through links to such tools. It includes big data analysis, artificial intelligence, engineering, and IT to translate accurate and real-time data into operational data, enabling optimal and secure municipal services to be administrated and ensuring a comfortable environment for residents [30].

Figure 1: Proposed BDA with IoT on urban underground engineering
The design of this innovative underground solution is related to that of smart cities. Expanding and freshly developed cities alike are affected by the global trend of urbanization. Population growth increases the need for reliable infrastructure, which is now paired with a need for better energy efficiency and a greater awareness of the environment. The underground space analysis can assist cities in fulfilling these growing needs while staying compact or provide the area needed to integrate new services in an existing metropolitan environment. If all other possibilities (above ground) have been tried, underground solutions to urban issues are sometimes considered only after. Planning and evaluating underground solutions from the very beginning of a project can lead to improved performance. The platform collects information from capacity, approved sources, and social communication. The application turns such data and algorithms into operational data in optimizing and safely managing the subsurface and give high-quality services to users. The initiative recognizes the need for comprehensive, extensive and local data to assist decision-making in transboundary basin areas at the local and regional levels. The initiative examines how improved data capacity in the cross-border ground and surface water decisions might boost the robustness of data, analysis and decision making. Innovative ways to derive more value from existing surface and groundwater resources data sets in intelligent cities; Enhance the existing awareness of common groundwater resources and can help to sustainable drinking water management and supply and other profitable applications. The application programs or software can use machine learning and deep learning algorithms to process the collected data. Depending upon the application scenario, these processed data can assist the users in decision-making or alert them if any emergencies are identified. The data collected and their use in underground space life cycle management depend on the efficiency of the smart underground solution. Data regarding underground space throughout the subsurface information system are given. Project data, including urban information, sub-grounds, structural components, buildings, and installations, are collected and developed at all phases of the underground space. It is possible to make cities more habitable, resilient, and inclusive by exploiting subsurface, especially underground space. It demands that the usage of underground space be addressed as part of urban planning strategy permanently [31–33]. The critical use of chosen tools, techniques, and procedures is necessary to manage big data from collection to information provision. Astronomers must increasingly rely on improved data collecting, storage, interpretation and diffusion tools and procedures to get value from data. Field soil water data can be digitized entirely, information collected in real time from sensor-equipped monitoring devices, and other peripheral receptors can be fed through sophisticated analytics algorithms, which field managers in their decision-making situations can support [34].
The Internet of Underground Things (IoUT) has several uses in the area of remote sensing. Internet of Underwater Things (IoUT) is a submarine-objective network that provides remote supervision of the submarine environment. Submarine networks in distant places with restricted access that make them vulnerable to internet assaults are routinely installed. Signaling in acoustic waves has a fair range of signaling technologies both in fresh and in marine water. This technique regularly transmits a pinged sound with an embedded ID to a range of distant acoustic sensors. This ping is for the location and the identification of the animals. Another important use is border monitoring, in which this technology is utilized to limit and prevent infiltration. A plastic cover is utilized to isolate the hydrogel device from its watery surroundings. Hence there is no current abbreviation or ion infiltration between both the device and its fluid backdrop. Underground sensors, communication technologies, and networking protocols enable the Internet of Underground Things. As a result of the IoUT paradigm, many industries such as oil and gas, agriculture, seismic mapping, and urban planning can integrate sensing and communication into the underground environment. Information processing and analysis of underground things become necessary for these applications. A single communication method cannot convey information between the surface and underground items because of the difficult propagation environment, which comprises sand, rock, and watersheds, in the underground environment. So, for underground communication, a variety of wireless and wired communication methods have been employed. In addition, the IoUT includes landslide and pipeline monitoring. It gives easy access over the Internet to information gathered from agricultural areas. Internet of underground things has skills for in situ soil sensing and the capacity to relay information on the environment in plants and land. Complex geo analytical applications require integrating many cross-domain geo-data systems for time and space, for example, land-type applications, underwater pipelines, and traffic conditions [35,36]. In IoUT applications, precise geographical data are needed. A variety of online geographical open-source databases are available for this sort of IoUT data. These databases focus mostly on marine systems engineering, particularly a specific sort of geographic information system (GIS), essential for an effective international transport system. Fortunately, in monitoring and network protocols, almost all these GISs should easily be combined with the IoUT infrastructure to serve marine organizations. They can provide researchers with down access to multiple environments. All the techniques and strategies mentioned in this part will be analyzed and processed, including sensing and imaging sources, GIS-ready to use information in IoUT and subsurface object monitoring and geo-tagging techniques. The solutions involved sensors, video and picture data sources, maritime geographical data, location and tracking, freely accessible bases, decentralized data processing and cloud-based applications. A full area deals with machine intelligence and its maritime data processing applications [37–40]. An underground space for urban planning is a spatial resource of a given magnitude that is naturally or intentionally generated under the surface of the Earth and can be used for a certain purpose. A spatial resource is described in this way: when amenities are added to an existing space of a particular size, whether it is naturally generated or intentionally constructed. Scientific discoveries and practices in society can be advanced thanks to the rising availability of geospatial data. Geospatial data processing has to be effective and efficient, especially for urban planning through underground space. The complex geo-analytics applications thus evolved with high-performance computing, online geoprocessing, and distributed geoprocessing modules. The combination of geographic data includes combining two or more separate geographic datasets for analysis, reasoning, inquiry, and data display. Significant increases in spatial and temporal resolution of data have resulted from the development of sensor web technologies. Current data storage and processing methods are put under tremendous strain by these better-quality data. As geographical databases expand in the future, the storing and administration of geospatial data on a distributed basis are becoming increasingly important. Therefore, this study has separately collected the geographical and spatial datasets and combined them for the analysis, reasoning, inquiry, and data display.
The unique features of the signal propagation in a layered media demand a path loss based on the features of distinct communication layers. In logarithmic form, the received signal strength from the Friis equation is displayed in free space from the transmitter is shown in Eq. (1),
As shown in Eq. (1) and Fig. 2,

Figure 2: Path loss
As shown in Eq. (2),
For urban planning, shown in Fig. 3, the IoT situation is investigated using wireless devices and sensors. Computing sensor integration has opened a world of possibilities in all urban departments, from energy flow control to traffic management to real-time incident response. Smart cities strive to digitalize and interoperate their services. Cities that are remote worker-friendly can be designed using the IoT. The development of cities has always been closely tied to technological advancements. The process of strategic planning for smart cities can help the urban planners to discover resources that can be leveraged and reused, identify important gaps and needs, and prioritize development possibilities for the community’s infrastructure and technology. Smart city design in urban planning through IoT should offer inhabitants a good quality of life while creating economic growth. The usage of data provided by sensors and the aim of the analysis is different in the urban planning system with the same IoT environment generated with a single investment. For example, the sensors placed for generating smart city extracts data from heterogeneous data sources. The collected data can be applied to various purposes, including smart energy management, smart home assistance, weather monitoring, traffic management, etc. A smart city, on the other hand, can make major decisions on data in real-time. It uses historical data collected from IoT devices for the same smart city in urban planning and planning for future developments in urban planning. Some users predict the demand for the future year by analyzing the previous year’s power use and act to satisfy the need. Similarly, for disaster management, the historical data collected from the environmental sensors in a smart city can help predict the upcoming natural disasters and alert the resistants accordingly, or help in preventive measures [41,42].
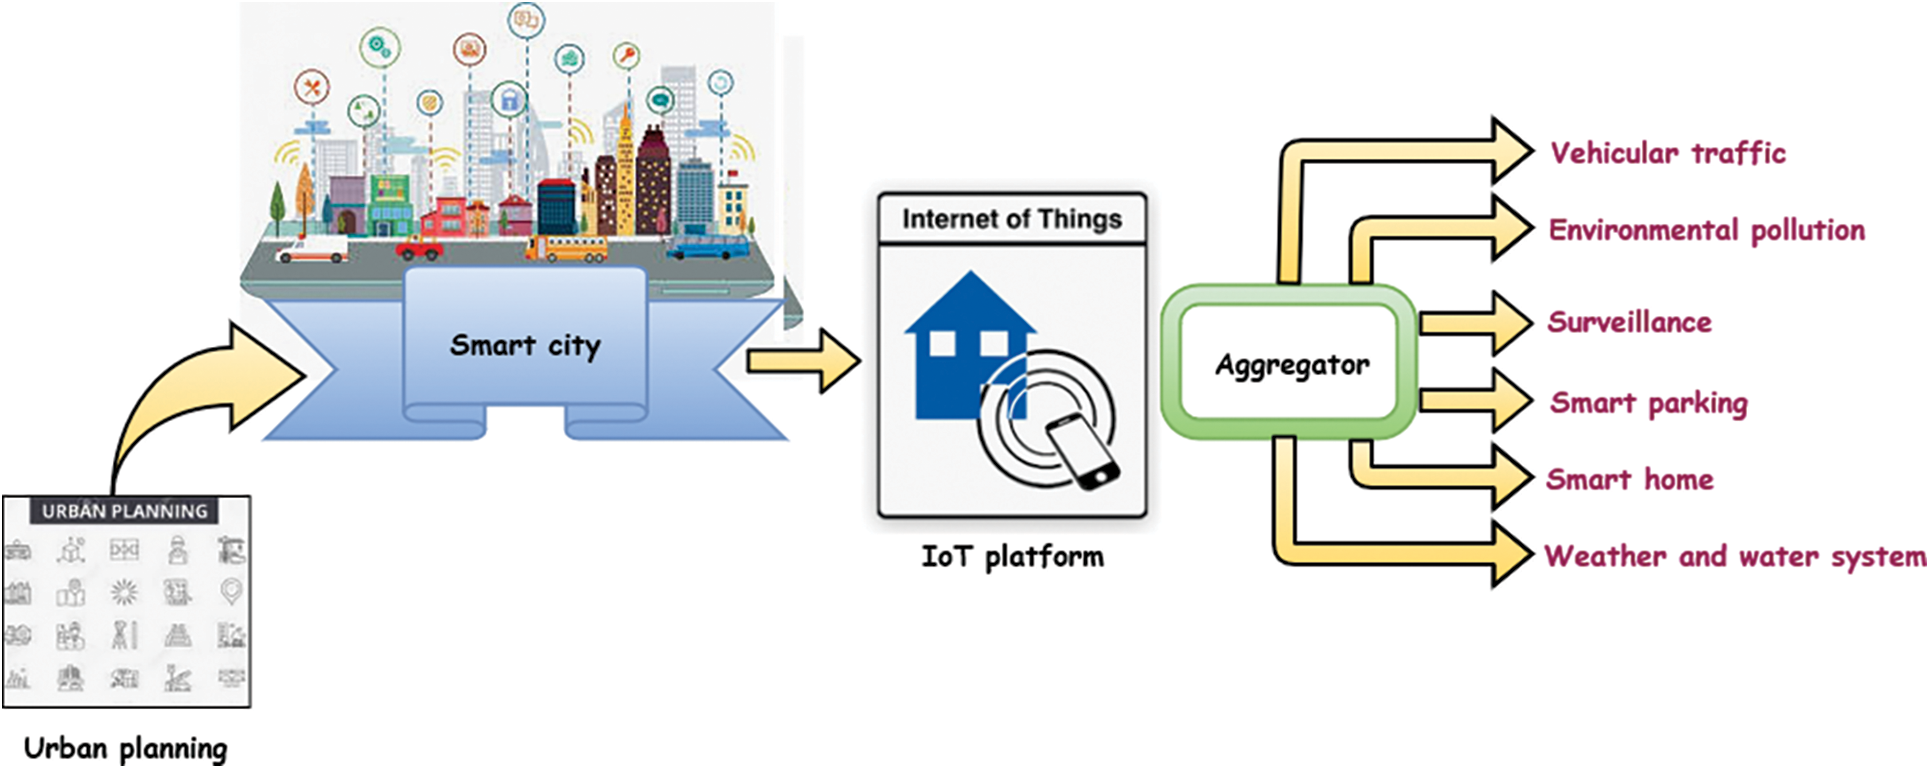
Figure 3: Smart cities based on IoT-urban planning and growth
A wide range of methodologies and technologies are used in predictive analytics, including big data mining, statistical modeling, machine learning, and other mathematical procedures. It is possible to produce future insights using predictive analytics with a high degree of precision. Advanced predictive analytics tools and models allow any company to correctly estimate future trends and behaviors milliseconds to years in advance. Price and demand ratios for smart energy management in smart cities can be forecasted over the long run. Weather, equipment failure, regulations, and other variables should be considered when determining the influence on servicing costs. The fundamental principle of the smart city is to acquire the correct information in the appropriate place and on the correct equipment to speed up civic decisions. Some basic principles in designing a smart city consist of history, demonstrating flexibility, sustainability, interactivity, scalability, interoperability, and resilience over an extended timeframe, and ensuring information from its technology systems is openly available without additional expenditure. Users have installed a range of wired and wireless sensors, monitoring cameras, emergency buttons, and other permanent systems to build smart urban planning and urban design IoT systems. A smart city system and a combination of IoT information are the key difficulties with using relay nodes, aggregate evaluations, etc. This difficulty is in addressing security challenges, intelligent decision-making with precise and accurate predictions, etc. In addition, all sensors create plentiful high-speed data called Big Data. So, effective big data handling schemes with data mining performance enhancement, storage capacity, quality assurances, etc., must be addressed in IoT-based urban planning. Big data analytics systems are used to process the IoT sensor data efficiently. In this part, the entire architecture of the deployment of the sensors and the generation of data is provided. Similarly, it offered the develop early.
In a smart home, data collected by the sensors pollution and temperature are continually monitored by transmitting. Similarly, the use of electricity and gas to properly control electricity, gas and water use for homes and various regions of the city to detect fire in reality. Similarly, pollution monitoring benefits residents’ health and alerts them to the increasing pollution beyond a specific threshold. Smart parking helps to monitor that vehicles from various parking zones arrive. In addition to the vehicles, smart car parking can be established, or new car parks can be built considering the number of automobiles in the area. The smart vehicle parking data makes the smart city easier for individuals and traders alike. Information about the nearest free parking space is easily available to the public. The citizen can obtain information on better spots for parking his car from the Smart City [43].
Information on the weather and water improves smart cities’ effectiveness by providing weather-related information on waterways, ponds, dams, and other water reservoirs such as temperatures, rain, moisture, pressure, wind speed, and water. The use of sensors in reservoirs and other open locations collects all this information. The frequent flooding globally is from the rain and the snow melting, and dam failure is comparable to few. They employ rain sensors and snow melting characteristics to anticipate the flood early [44]. The most important source of a smart city is vehicle traffic information. Using this data source, the public and the government can obtain additional advantages with effective in-time analysis. Based on the present traffic intensity and the medium speed of the vehicles, residents can receive their destination. Traffic in all cities can be different, hence reducing fuel use and pollution due to congested traffic. Government officials could obtain information on the road blockade caused by accidents or other things in real-time.
The medium loss should recognize the impact of various communications layer features for propagating on surface waves. As a result, the received signal is shown in Eq. (3),
As shown in Eq. (3),
A random forest using the training set is formed, and every base station in the random forest will be as pure as feasible. Purity, in this case, indicates that all samples are classified in Eq. (4),
As shown in Eq. (4), x is a node,
Fig. 4 shows urban underground engineering IoT for surveillance of wastewater. Urban areas have huge amounts of money in public infrastructure under the underground. Every year the local authorities spend financial resources on this underground infrastructure. Underground IoT solutions seldom benefit from connection problems and the need for thorough cabling, which increases expenditures. This enables the combining of underground wireless technology with sensor solutions, leading to several disruptive urban underground application IoTs, including real-time flux surveillance, Infiltration and Intrusion (I&I) isolation and smart manholes. Urban sewage firms use several million gallons per day to collect and treat wastewater in sewage systems. Cities have to monitor water in and out of the collection system in quantity and quality. Additional water quantities in the pipes can lead to safeguards resulting in sanitary drainage. Removal of I&I is needed to prevent the external flow of water into the pipeline [45].

Figure 4: Urban underground engineering IoT for surveillance of wastewater
Wireless underground communication technology can be used for the wastewater flow monitoring application, enabling IoT radio stations to be hidden underground. Subterranean pipeline surveillance sensors linked to radios with underground wireless software can connect the urban roadside infrastructure wirelessly at the closest transmission light pole. For several decades, underground wireless technology in farming has successfully communicated a range of 100 to 200 m. Wireless underground communication by asphalt users proposes an alternative path loss analysis for designing long-term wireless communications radios that allow adequate underground radios to be deployed to minimize cabling to underground pipes while preserving connection. Mobile device information will allow the broad diffusion of timely warnings in crises. This program can drive realistic wireless traffic to evaluate wireless underground network solutions.
A storm drain is an infrastructure that removes excess rain and water from impervious areas such as paved roadways, parking lots, pedestrian walkways, walkways and toilets. Drains from modest household dry wells to huge municipal systems vary in design. Water drains from motorways, freeways, and other busy routes and communities in high-registered regions leading to the floods and the coastal cities with regular storms are received by street rivers. The storm drain can even be connected with gutters from houses and buildings [46]. A catch basin or storm drain is a drain that gathers rainwater from the site and streets and delivers it into neighboring waterways via an underground pipe system, transport tanks and drainage tanks. In parking lots, storm drains can be found and have the same purpose. The wastewater is disposed through the water discharge.
The endpoints of the produced forest are cut progressively to minimize overfitting. The sequence for pruning is determined based on the cost of complexity is given in Eq. (5),
As shown in Eq. (5),
The Gini (GI) index is probably to misclassify a randomly picked parameter in a data collection, and the Gini parameter index is given in Eq. (6),
As shown in Eq. (6),
Fig. 5 shows the structure of geospatial urban infrastructure data engineering. The primary aim of GUIDES is to allow several individuals to explore and search for underground networks of infrastructure. To investigate the effects of interference on these systems while resolving many technical difficulties connected with achieving this vision. Providers of data and sources of data: Big data-driven decisions need to use various map-based data sources in smart city applications, which are often not standardized. For example, standardizing data sources and coordinating across data providers can improve the central data integration accuracy. While some cities strive to check the map's correctness through field inspections and sensor information in real-time, the quality of such geospatial data remains questionable.

Figure 5: Structure of geospatial urban infrastructure data engineering
Mapping and preprocessing: The mapping process deals with transferring data to a single standardized format from one or more non-status sources. Legacy data formats lack geographical data and are commonly used as a single source to store all pertinent information. Dimensions are typically presented directly, as opposed to a part of the infrastructure, on the engineering drawing. It is vital to preprocess methods that discover and resolve these problems automatically. GUIDES uses a three-step preprocessing strategy. The first phase is the domain knowledge-based guidelines for the identification of errors are identified. The second phase is the creation of additional variables to detect faults further. The third phase includes GIS functions to determine whether a point is placed inside a polygon. Geospatial data integration: There are multiple spatial and time resolutions, update frequencies and geometry kinds that can be gathered with variability across dimensions, location, scale and source. GUIDES employs two kinds of ontologies to tackle these challenges: a domain ontology and space-temporal ontology. Domain ontology includes instances in a GIS database or other relevant external data sources for a particular domain. Space-temporal ontology, by contrast, consists of spatial and temporal hierarchies and their related examples [47].
Geospatial Data Analytics & Visualization: Geostatistical models and Spatio-temporal processes are included in the analytics module, enabling precise prediction. The main purpose of this module is to identify if there is a broken pipe in a census block to determine how many low-income families in a certain area suffer a significant water break. A map-based interface is used to analyze data and to compare different geostatistical models. The query module can add, delete and edit the infrastructure pieces in a dataset for any spatial object that users are selecting. Both query and update modules confine their operations to their specific data requirements and the approved degree of access, based on the end-user category. For instance, the public should not be conscious of the sensitive information for the underground infrastructure, thereby preventing access to the data [48].
The traffic performance index (TPI) reduction rate, the volume of freight transported in the region, is indeed underground, which is given in Eq. (7),
As shown in Eq. (7),
Fig. 6 shows groundwater management methodology using big data analysis. Although many of the platforms and frameworks mentioned here are suitable for geospatial data management, different characteristics warrant the special issues of soil water management facing the development community (DC). A conceptual Big Data analysis paradigm is presented based on the conclusions of the evaluation in this paper. The framework demonstrates the characteristics needed to assist the groundwater management of the big data analysis framework. This comprises the usual characteristics of data collection, processing, storage, analysis and delivery of information. However, significant elements are groundwater management and downgrading situations. By incorporating these two characteristics, users set the framework to handle the particular issues in groundwater management in DC. The following sections examine these distinct qualities in further depth. The framework aspects are organized under the big data analysis infrastructure, which constitutes the necessary hardware and software stack to implement the framework. This framework concentrates on the Big Data sources of the groundwater, a key element in every Big Data Framework [49,50].
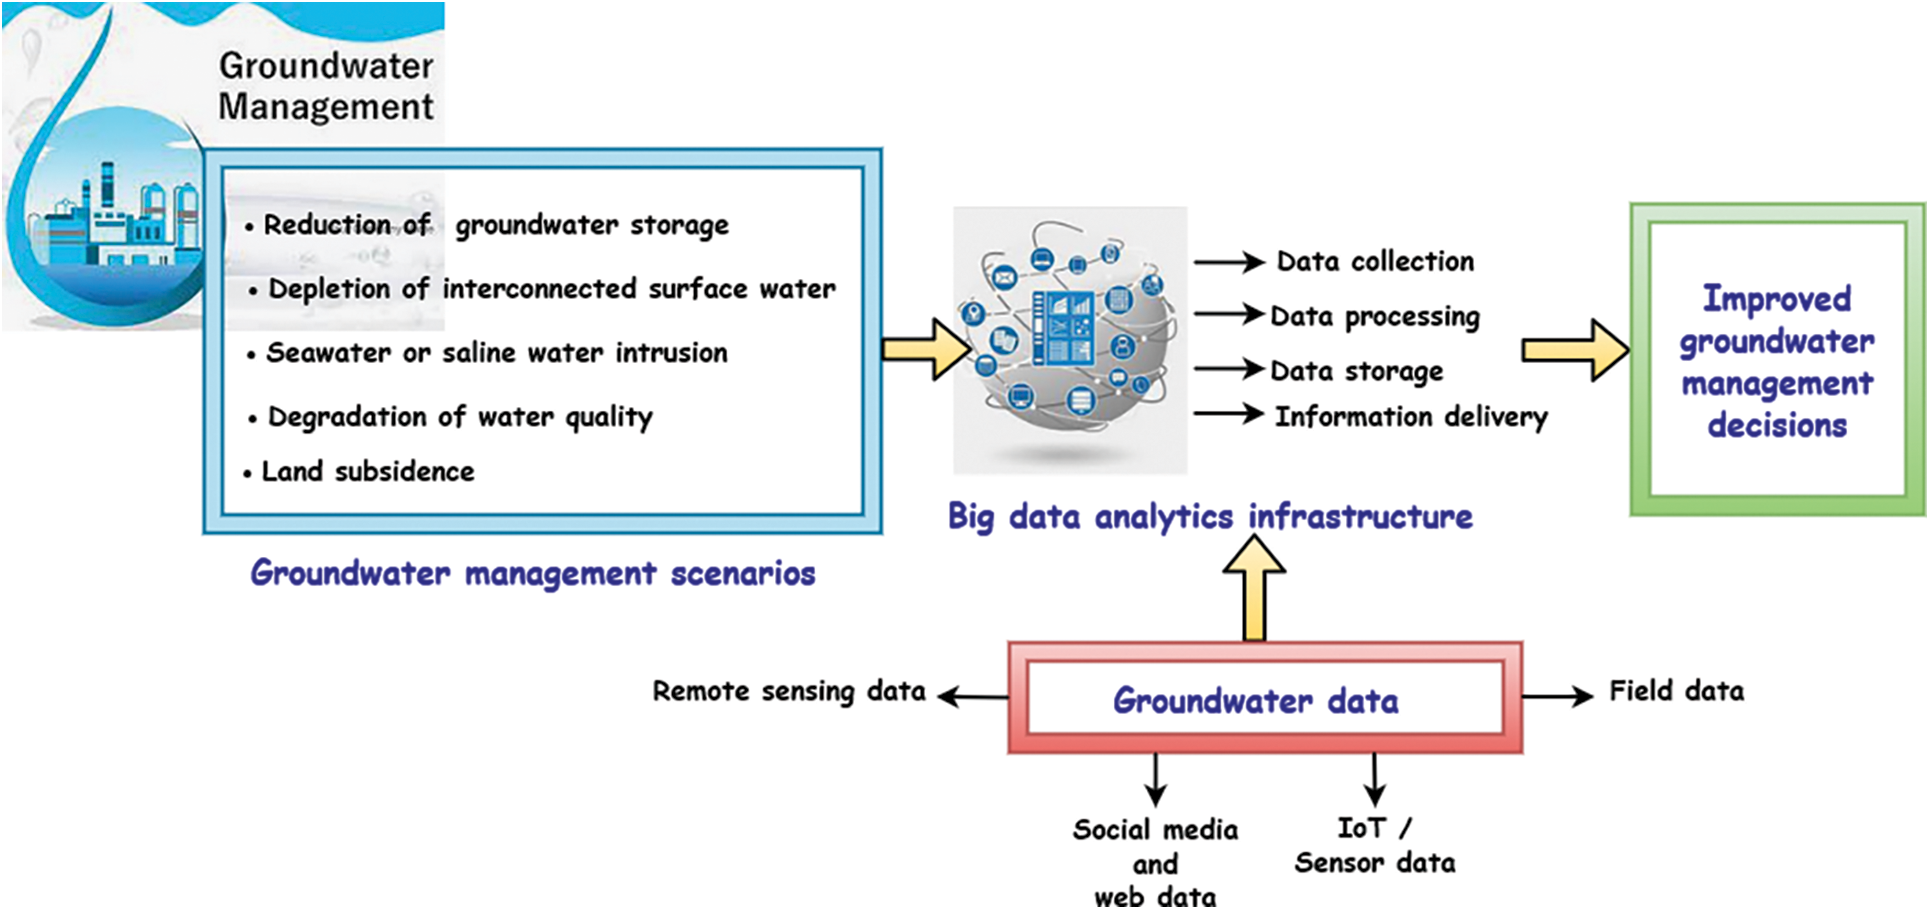
Figure 6: Groundwater management methodology using Big Data analysis
The formulation of a strong problem definition is a vital job sometimes missed during the implementation of Big Data analytics. The method is ambiguous, without a clear definition of the problem, which ultimately dictates the necessary information. A good issue definition must readily be translated into a statistically modelable feature. The framework consequently starts with the problem definition. In this situation, users identify the challenges which should be handled as different groundwater management scenarios. Ultimately, this groundwater management situation dictates the data type needed, the data size, the individual data sets needed, the necessary analytics and the data output. For example, it is vital to track groundwater storage during groundwater shortage to avoid reducing groundwater storage.
Modeling the land surface utilizes complicated mathematical equations to incorporate on-land, between the land surface and air and inside the soil column hydrological, biological and radiation-based energy exchanges procedures. These models integrate a wide range of observational data on the Earth’s surface on locations and remote-sensing. In groundwater science, social media is an unconventional new major data source. The usage of unstructured social media data in the usual senses could be difficult to visualize; however, these forms comprise most large datasets. Valuable information can be extracted from various data sources using contemporary advanced analytical techniques such as natural language processing or video analysis. For example, a framework has shown that the content of Twitter feeds can lead to real rainfall amounts.
The application of IoT technologies to groundwater science can create enormous volumes of data on the local groundwater conditions at a greater speed than conventional or manual data collecting, thereby enhancing groundwater management. The suggested BI0T-UUE enhances the development ratio, the throughput of the dataset depending on data size, system performance, propagation loss and efficiency ratio.
The proposed BI0T-UUE of the numerical result has been performed. This paper analyzed the development ratio, the throughput of the dataset depending on data size, system performance, propagation loss and efficiency ratio.
Fig. 7 shows the development ratio. Efficient urban underground space development and usage can improve the city’s ecological environment, reduce urban pollution considerably, maintain the city’s historical and cultural landscape, grow the city’s green area efficiently, and raise infrastructural capability. The Underground Space, which serves as a scientific platform for underground engineering researchers and practitioners, encourages submissions dealing with an innovative concept, methods, technology and essential applications across the life cycle of the underground. The usage of the subsurface and the underground can help improve the resilience and inclusiveness of the cities. It necessitates the utilization of subsurface space as a permanent element of urban planning strategy.
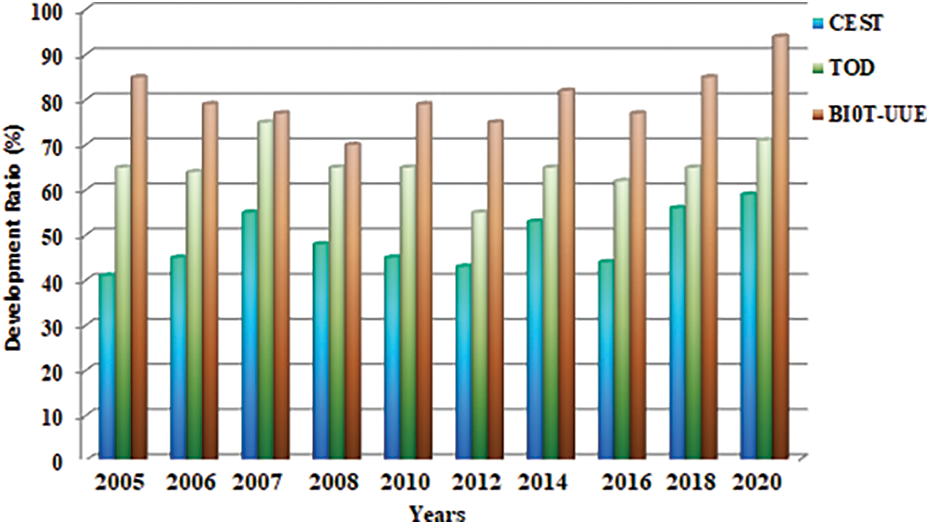
Figure 7: Development ratio
Table 1 shows the throughput of the dataset depending on data size. Big data analytics are the basis of the system, efficiency and reaction time assesses the system. The system performance can be analyzed at different sizes by evaluating the processing time and output (in milliseconds/sec Mbps). The graph illustrates that the processing time is strongly connected, both data size and time when the data size is appropriately increased. However, the processing time for this data set is only 300,000, more time than other systems, in the greater (bigger) data set, i.e., 3578 MB. In addition, if users study the data size throughput. Due to the parallel processing structure of the Web server, the throughput is indeed directly proportional to the data. This is the system's significant success that the data volume likewise increases the output.
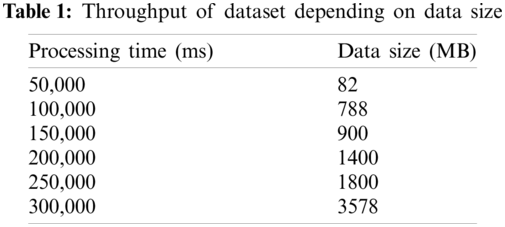
Fig. 8 shows the system performance is displayed in terms of the number of sensors. One of the key ways to maintain the safety of underground construction is through automatic monitoring. BI0T-UUE resumes on three areas of data gathering, data transmission, data processing and the mainstream new technology of the monitoring system, the present worldwide research and application state of the foundation engineering system. Users can verify the system’s performance by adding a single record number of sensors. The data size is stable, i.e., 2 GB, while the number of sensors per record has been raised. Users are indeed aware of the increase in the number of sensors and a decrease in the output. It takes a lot of time to classify and process the sensors as many comparisons due to many sensors in a given record when users increase the sensors.

Figure 8: Throughput of the system
Fig. 9 shows the propagation loss. Path loss usually involves loss of propagation resulting from the natural spread of the radio wavefront into open space and loss of absorption if the signal passes by media that are not transparent to electromagnetic waves. The loss of propagation in the soil medium has been proven with variations in the layer density. With a thickness of fewer than 2 m, the propagation losses are less than 34 dB, and the thickness is increasing. It climbs to 46 dB for the four-meter thick earth layer and 88 dB for the 12-meter thick layer.

Figure 9: Propagation loss
Furthermore, the soil media can lose much in comparison with the concrete media. The greater soil permittivity causes this compared with the road surface. The increased water content of the ground causes the soil to be more permitted than the concrete media.
Table 2 shows the efficiency ratio. In global urbanization, the construction and use of underground space are vital to solving the big population pressure, climate conservation, and constrained smart city. Innovation is a major driver in underground space development that enables strong design and planning, safe and efficient building, sustainable operation and predictable maintenance of subsurface assets. Information modeling is a methodology used to characterize subterranean area and asset’s physical and functional aspects through semanticized, intelligent models. Along with the modern virtual environment, sensing, engineering and big data analysis, underground information modeling has enormous potential in the planning, construction, operational and maintenance stages to enable accurate analyzes and rapid decision making.
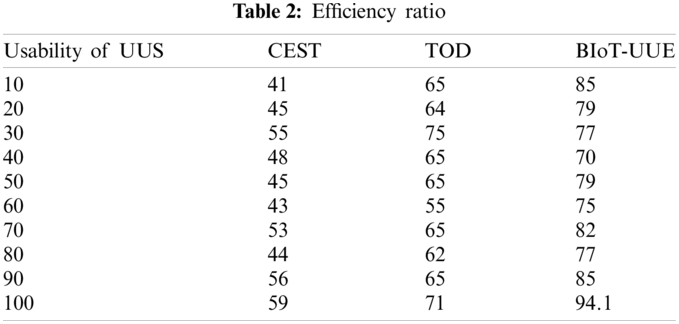
Fig. 10 demonstrates the accuracy ratio of our proposed outcome. The purpose of this article is to underline the potential role that big data analysis may play in assisting the management of soil in intelligent cities. Therefore we show the state of the art big data analytics in groundwater and how they may be utilized for groundwater resources in the smart city region. The wide range of data sources, analytical methods, and resources are difficult to manage to ensure data integration and accuracy. For this aim, specialist big data analytics frameworks facilitate the administration and implementation of large amounts of data analysis. Thus, a novel conceptual big data analytical framework is being developed based on the conclusions of the study, which is exclusively intended to meet the difficulties provided by groundwater resources in the smart city region. This study lays the basis for using large-scale data analytics in the field of groundwater, in particular for problem-solving applications in the intelligent urban environment, which paves the door for more data science work.

Figure 10: Accuracy ratio
Urban underground space is a finite resource, which is not renewable. The growing requirement for new pipelines and cables in our cities will lead us to examine alternatives to trenched systems. An optimum strategy in most circumstances is not a new approach; it would reduce the unavoidable interruption that happens anytime upgrades are made to utilities’ tunnels, including all utility systems. In selecting underground tunnels over other distribution techniques, accessibility and maintenance of public services are crucial. BI0T-UUE seeks to incorporate technological innovations into Urban Underground Engineering to ensure a high quality of life. This study employs Big Data Analytics to implement the existing quo for basic processing and presents a conceptual framework called the urban underwater Engineering BDA with IoT. This framework links hidden characteristics with multiple high-level sensing sources and characterization of the practical prediction model to minimize building costs, productive infrastructure management, catastrophe preparedness and current smart community services. The simulation analysis ensures that underground engineering is as efficient as possible at 94.1%.
Funding Statement: This research was supported by Municipal Colleges and Universities Basic Scientific Research Business Expenses Project (X18199); Beijing Municipal Education Commission Scientific Research Project Science and Technology Plan General Project (FACE PROJECT) (Z18028); School Research Fund Natural Science Project-Ad Hoc Fund (ZF17067).
Conflicts of Interest: The authors declare that they have no conflicts of interest to report regarding the present study.
1. Li, D., Yu, W. B., Shao, Z. F. (2021). Smart city based on digital twins. Computational Urban Science, 1(1), 1–11. DOI 10.1007/s43762-021-00005-y. [Google Scholar] [CrossRef]
2. Nguyen, N. T., Liu, B. H., Pham, V. T., Luo, Y. S. (2016). On maximizing the lifetime for data aggregation in wireless sensor networks using virtual data aggregation trees. Computer Networks, 105(8), 99–110. DOI 10.1016/j.comnet.2016.05.022. [Google Scholar] [CrossRef]
3. Bibri, S. E. (2021). Data-driven smart sustainable cities of the future: Urban computing and intelligence for strategic, short-term, and joined-up planning. Computational Urban Science, 1(1), 1–29. DOI 10.1007/s43762-021-00001-2. [Google Scholar] [CrossRef]
4. Nguyen, T. N., Zeadally, S., Vuduthala, A. (2021). Cyber-physical cloud manufacturing systems with digital-twins. IEEE Internet Computing, 1. DOI 10.1109/MIC.2021.3058921. [Google Scholar] [CrossRef]
5. Li, Z., Alazab, M., Garg, S., Hossain, M. S. (2021). PriParkRec: Privacy-preserving decentralized parking recommendation service. IEEE Transactions on Vehicular Technology, 70(5), 4037–4050. DOI 10.1109/TVT.2021.3074820. [Google Scholar] [CrossRef]
6. Secinaro, S., Brescia, V., Calandra, D., Biancone, P. (2021). Towards a hybrid model for the management of smart city initiatives. Cities, 116(1), 103278. DOI 10.1016/j.cities.2021.103278. [Google Scholar] [CrossRef]
7. Chen, J., Ramanathan, L., Alazab, M. (2021). Holistic big data integrated artificial intelligent modeling to improve privacy and security in data management of smart cities. Microprocessors and Microsystems, 81(3), 103722. DOI 10.1016/j.micpro.2020.103722. [Google Scholar] [CrossRef]
8. Li, X., Tan, J. X., Liu, A. F., Vijayakumar, P., Kumar, N. et al. (2020). A novel UAV-enabled data collection scheme for intelligent transportation system through UAV speed control. IEEE Transactions on Intelligent Transportation Systems, 22(4), 2100–2110. DOI 10.1109/TITS.2020.3040557. [Google Scholar] [CrossRef]
9. Hajjaji, Y., Boulila, W., Farah, I. R., Romdhani, I., Hussain, A. (2021). Big data and IoT-based applications in smart environments: A systematic review. Computer Science Review, 39(7), 100318. DOI 10.1016/j.cosrev.2020.100318. [Google Scholar] [CrossRef]
10. Abdel-Basset, M., Manogaran, G., Mohamed, M. (2018). Internet of Things (IoT) and its impact on supply chain: A framework for building smart, secure and efficient systems. Future Generation Computer Systems, 86, 614–628. DOI 10.1016/j.future.2018.04.051. [Google Scholar] [CrossRef]
11. Manogaran, G., Lopez, D. (2018). Spatial cumulative sum algorithm with big data analytics for climate change detection. Computers & Electrical Engineering, 65(2), 207–221. DOI 10.1016/j.compeleceng.2017.04.006. [Google Scholar] [CrossRef]
12. Manogaran, G., Thota, C., Kumar, M. V. (2016). Meta cloud data storage architecture for big data security in cloud computing. Procedia Computer Science, 87, 128–133. DOI 10.1016/j.procs.2016.05.138. [Google Scholar] [CrossRef]
13. Jegadeesan, S., Azees, M., Kumar, P. M., Manogaran, G., Chilamkurti, N. et al. (2019). An efficient anonymous mutual authentication technique for providing secure communication in mobile cloud computing for smart city applications. Sustainable Cities and Society, 49(2), 101522. DOI 10.1016/j.scs.2019.101522. [Google Scholar] [CrossRef]
14. Chang, J., Kadry, S. N., Krishnamoorthy, S. (2020). Review and synthesis of Big Data analytics and computing for smart sustainable cities. IET Intelligent Transport Systems, 14(1), 1363–1370. DOI 10.1049/iet-its.2020.0006. [Google Scholar] [CrossRef]
15. Gupta, O., Goyal, N., Anand, D., Kadry, S., Nam, Y. et al. (2020). Underwater networked wireless sensor data collection for computational intelligence techniques: Issues, challenges, and approaches. IEEE Access, 8, 122959–122974. DOI 10.1109/ACCESS.2020.3007502. [Google Scholar] [CrossRef]
16. Slagter, K., Hsu, C. H., Chung, Y. C., Zhang, D. (2013). An improved partitioning mechanism for optimizing massive data analysis using MapReduce. The Journal of Supercomputing, 66(1), 539–555. DOI 10.1007/s11227-013-0924-9. [Google Scholar] [CrossRef]
17. Sher, A., Khan, A., Javaid, N., Ahmed, S. H., Aalsalem, M. Y. et al. (2018). Void hole avoidance for reliable data delivery in IoT enabled underwater wireless sensor networks. Sensors, 18(10), 3271. DOI 10.3390/s18103271. [Google Scholar] [CrossRef]
18. Guo, D., Chen, Y. C., Yang, J. S., Tan, Y. H., Zhang, C. H. et al. (2021). Planning and application of underground logistics systems in new cities and districts in China. Tunnelling and Underground Space Technology, 113(3), 103947. DOI 10.1016/j.tust.2021.103947. [Google Scholar] [CrossRef]
19. Abbasi, M., Rafiee, M., Khosravi, M. R., Jolfaei, A., Menon, V. G. et al. (2020). An efficient parallel genetic algorithm solution for vehicle routing problem in cloud implementation of the intelligent transportation systems. Journal of Cloud Computing, 9(1), 6. DOI 10.1186/s13677-020-0157-4. [Google Scholar] [CrossRef]
20. Shafiq, M., Tian, Z., Bashir, A. K., Jolfaei, A., Yu, X. (2020). Data mining and machine learning methods for sustainable smart cities traffic classification: A survey. Sustainable Cities and Society, 60(1), 102177. DOI 10.1016/j.scs.2020.102177. [Google Scholar] [CrossRef]
21. Ma, E., Rafiee, M., Khosravi, M. R., Jolfaei, A., Menon, V. G. et al. (2021). Review of cutting-edge sensing technologies for urban underground construction. Measurement, 167(3), 108289. DOI 10.1016/j.measurement.2020.108289. [Google Scholar] [CrossRef]
22. Xu, Y., Chen, X. (2021). Quantitative analysis of spatial vitality and spatial characteristics of urban underground space (UUS) in metro area. Tunnelling and Underground Space Technology, 111(1), 103875. DOI 10.1016/j.tust.2021.103875. [Google Scholar] [CrossRef]
23. Li, S., Wang, G., Yu, H., Wang, X. (2021). Engineering project: The method to solve practical problems for the monitoring and control of driver-less electric transport vehicles in the underground mines. World Electric Vehicle Journal, 12(2), 64. DOI 10.3390/wevj12020064. [Google Scholar] [CrossRef]
24. Cui, J., Broere, W., Lin, D. (2021). Underground space utilisation for urban renewal. Tunnelling and Underground Space Technology, 108(3), 103726. DOI 10.1016/j.tust.2020.103726. [Google Scholar] [CrossRef]
25. Zhu, T., Wang, R., Zhang, J. M. (2021). Evaluation of various seismic response analysis methods for underground structures in saturated sand. Tunnelling and Underground Space Technology, 110(5), 103803. DOI 10.1016/j.tust.2020.103803. [Google Scholar] [CrossRef]
26. Liu, H., Shi, Z. S., Li, J. H., Meng, X., Du, Y. L. et al. (2021). Detection of road cavities in urban cities by 3D ground-penetrating radar. Geophysics, 86(3), A25–A33. DOI 10.1190/geo2020-0384.1. [Google Scholar] [CrossRef]
27. Hu, T., Wang, S. Q., She, B., Zhang, M. X., Huang, X. et al. (2021). Human mobility data in the COVID-19 pandemic: Characteristics, applications, and challenges. International Journal of Digital Earth, 14(9), 1126–1147. DOI 10.1080/17538947.2021.1952324. [Google Scholar] [CrossRef]
28. Xiang, D., Zhang, Y., Worthington, A. C. (2021). Determinants of the use of fintech finance among Chinese small and medium-sized enterprises. IEEE Transactions on Engineering Management, 68(6), 1590–1604. DOI 10.1109/TEM.2020.2989136. [Google Scholar] [CrossRef]
29. Huang, H., Huang, M., Zhang, W., Pospisil, S., Wu, T. (2020). Experimental investigation on rehabilitation of corroded RC columns with BSP and HPFL under combined loadings. Journal of Structural Engineering, 146(8), 04020157. DOI 10.1061/(ASCE)ST.1943-541X.0002725. [Google Scholar] [CrossRef]
30. Zhang, W., Tang, Z., Yang, Y., Wei, J. (2021). Mixed-mode debonding behavior between CFRP plates and concrete under fatigue loading. Journal of Structural Engineering, 147(5), 04021055. DOI 10.1061/(ASCE)ST.1943-541X.0003032. [Google Scholar] [CrossRef]
31. Zhang, W., Tang, Z. (2021). Numerical modeling of response of CFRP-concrete interfaces subjected to fatigue loading. Journal of Composites for Construction, 25(5), 04021043. DOI 10.1061/(ASCE)CC.1943-5614.0001154. [Google Scholar] [CrossRef]
32. Zhang, S. P., Ronald, Y. S. P., Zhang, J. H. (2021). Three-dimensional frequency-domain Green's functions of a finite fluid-saturated soil layer underlain by rigid bedrock to interior loadings. International Journal of Geomechanics, 22(1). DOI 10.1061/(ASCE)GM.1943-5622.0002235. [Google Scholar] [CrossRef]
33. Lu, N., Wang, H., Wang, K., Liu, Y. (2021). Maximum probabilistic and dynamic traffic load effects on short-to-medium span bridges. Computer Modeling in Engineering & Sciences, 127(1), 345–360. DOI 10.32604/cmes.2021.013792. [Google Scholar] [CrossRef]
34. Luo, Y., Zheng, H., Zhang, H., Liu, Y. (2021). Fatigue reliability evaluation of aging prestressed concrete bridge accounting for stochastic traffic loading and resistance degradation. Advances in Structural Engineering, 24(13), 3021–3029. DOI 10.1177/13694332211017995. [Google Scholar] [CrossRef]
35. Zhou, W., Yu, L., Zhou, Y., Qiu, W. W., Ting, L. et al. (2018). Local and global feature learning for blind quality evaluation of screen content and natural scene images. IEEE Transactions on Image Processing, 27(5), 2086–2095. DOI 10.1109/TIP.2018.2794207. [Google Scholar] [CrossRef]
36. Zhou, W., Lv, Y., Lei, J., Yu, L. (2021). Global and local-contrast guides content-aware fusion for RGB-D saliency prediction. IEEE Transactions on Systems Man Cybernetics: Systems, 51(6), 3641–3649. DOI 10.1109/TSMC.2019.2957386. [Google Scholar] [CrossRef]
37. Yi, H. (2021). Secure social internet of things based on post-quantum blockchain. IEEE Transactions on Network Science and Engineering. DOI 10.1109/TNSE.2021.3095192. [Google Scholar] [CrossRef]
38. Li, X., Yang, H., Zhang, J., Qian, G. P., Yu, H. et al. (2021). Time-domain analysis of tamper displacement during dynamic compaction based on automatic control. Coatings, 11(9), 1092. DOI 10.3390/coatings11091092. [Google Scholar] [CrossRef]
39. Qiao, G., Ding, L., Zhang, L., Yan, H. (2021). Accessible tourism: A bibliometric review (2008–2020). Tourism Review (Association Internationale D'experts Scientifiques Du Tourisme), Ahead-of-Print (Ahead-of-Print). 1. DOI 10.1108/TR-12-2020-0619. [Google Scholar] [CrossRef]
40. Li, B., Xiao, G., Lu, R., Deng, R., Bao, H. (2020). On feasibility and limitations of detecting false data injection attacks on power grid state estimation using D-FACTS devices. IEEE Transactions on Industrial Informatics, 16(2), 854–864. DOI 10.1109/TII.2019.2922215. [Google Scholar] [CrossRef]
41. Wu, K., Fan, Q. L. (2015). Study on bearing capacity of bucket foundation subjected to horizontal loading. Journal of Coastal Research, 73(10073), 511–515. DOI 10.2112/SI73-089.1. [Google Scholar] [CrossRef]
42. Liu, C. C., Zhang, Q. Y., Xiang, W. (2020). Development and application of micro automatic excavation device for model test of underground engineering. Geotechnical and Geological Engineering, 38(5), 4847–4862. DOI 10.1007/s10706-020-01331-4. [Google Scholar] [CrossRef]
43. Hou, H. (2020). Research on forming and controlling technology of building foundation materials in coastal cities under marine climate. Journal of Coastal Research, 115(SI), 21–23. DOI 10.2112/JCR-SI115-007.1. [Google Scholar] [CrossRef]
44. Wu, H. J., Bian, K. H., Qiu, J., Ye, X. K., Chen, C. et al. (2019). The prediction of foundation pit based on genetic back propagation neural network. Journal of Computational Methods in Sciences and Engineering, 19(3), 707–717. DOI 10.3233/JCM-190017. [Google Scholar] [CrossRef]
45. Wu, K., Fan, Q. L., Zheng, J. (2015). Effect of strength anisotropy on failure envelope of offshore shallow foundations under combined loading. Journal of Coastal Research, 73(10073), 521–526. DOI 10.2112/SI73-091.1. [Google Scholar] [CrossRef]
46. Pal, S. K., Paul, T. K., Tripathi, A. K. (2011). A study on selection of pertinent cross-sectional areas for underground supports. Journal of Mines, Metals and Fuels, 59(3–4), 116–122. [Google Scholar]
47. Wang, C. (2019). Influence of underground geotechnical operation on surface buildings through the shield method. Arabian Journal of Geosciences, 12(21), 1–6. DOI 10.1007/s12517-019-4834-x. [Google Scholar] [CrossRef]
48. Wu, S., Chen, J., Wu, M. (2020). Study on stability classification of underground engineering surrounding rock based on concept lattice-TOPSIS. Arabian Journal of Geosciences, 13(10), 346. DOI 10.1007/s12517-020-05320-y. [Google Scholar] [CrossRef]
49. Liang, Y., Liu, Q. X. (2021). Early warning and real-time control of construction safety risk of underground engineering based on building information modeling and internet of things. Neural Computing & Applications, 4(1), 2. DOI 10.1007/s00521-021-05755-8. [Google Scholar] [CrossRef]
50. Chen, W. G. (2020). Research on safety and environmental protection control methods based on underground and foundation pit engineering. Fresenius Environmental Bulletin, 29(12), 10832–10839. [Google Scholar]
 | This work is licensed under a Creative Commons Attribution 4.0 International License, which permits unrestricted use, distribution, and reproduction in any medium, provided the original work is properly cited. |