| Computer Modeling in Engineering & Sciences |
DOI: 10.32604/cmes.2022.016312
ARTICLE
Seismic Performance of Assembled Shear Wall with Defective Sleeve Connection
1School of Civil and Resource Engineering, University of Science and Technology Beijing, Beijing, 100083, China
2School of Architecture and Engineering, Langfang Normal University, Langfang, 065000, China
3Beijing International Science and Technology Cooperation Base for Earthquake Research on Mass Transit Railway Project, Beijing, 100083, China
*Corresponding Author: Bo Song. Email: songbo@ces.ustb.edu.cn
Received: 25 February 2021; Accepted: 19 October 2021
Abstract: In this paper, three kinds of shear walls with full sleeve grouting, fully defective sleeve and partially defective are designed for finite element analysis to analyze the influence of defects on the seismic performance of shear walls. The research shows that at the beginning of loading (5 s), the three models begin to appear compressive damage at the bottom of the wall in all three models. The damage of the defect-free model develops rapidly, and the damage of the fully defective model is basically the same as that of the partially defective model. With the gradual increase of displacement control (15 s), the compressive damages at the foot of the wall in the defect-free and partially defective grouting model are obvious, with plastic hinge formed in the foot of the wall, and the phenomenon of development along the pier body showing up. When the structure is damaged, the overall compressive damages of the wall in the defect-free and partially defective models are obvious, and the damage on the defective side of the partially defective model is slightly deficient. While the maximum stress of pre-stressed reinforcement in the defect-free model is concentrated at the top of the sleeve, the maximum stress of the pre-stressed steel bar in the fully defective model appears at the end of the steel bar in the sleeve. The hysteresis curve shape of the non-defect model and partially defective model are basically the same, showing a “shuttle” shape with a sound energy dissipation effect. The hysteresis curve shape of the fully defective model appears an obvious “pinch” phenomenon. The yield displacement levels of the defect-free and partially defective models are smaller than that of the fully defective model structure. The stiffness degradation curves of the three models basically overlap with one another. Before the limit displacement, the stiffness results of the non-defect model and the partially defective model are greater than that of the fully defective model. When the displacement is loaded to 20 mm, the stiffness degradation of the three models is equivalent.
Keywords: Grouting sleeve; defects; shear wall; finite element analysis; seismic performance
The prefabricated building is constructed on site with premade factory components. The components are manufactured by the standardized production and processing of the factory, and their quality is easy to guarantee. The final assemblage of the components into the overall structure is completed on the site, especially the connection of the longitudinal force reinforcement which is the key to affecting the safety of the overall structure. Sleeve grouting connection is a common form of longitudinal reinforcement connection in prefabricated concrete structures. Sleeve grouting connection is to insert ribbed steel bars in the metal sleeve and achieves force transmission by hardening the grout mixture. Therefore, the fullness of the grouting material is very important to the force transmission effect. Sleeve grouting is a hidden project. Restricted by field construction method, management and testing means, there could still be some problems regarding grouting quality, such as defects. For example, Looseness of sealing plug at the grouting mouth or an untight sealing seam of the slurry layer may cause leakage of slurry, resulting in dropping of the sleeve top and defects at the end of the sleeve.
In developed countries such as the United States and Japan, to ensure the compactness of the grouting, measures taken include improving the working skills of the workers, adopting appropriate guidance norms and effective management. However, in China, with short development time, yet-to-improve factory production factory, insufficient on-site personnel training, guidance norms as well as supervision, the phenomenon of sleeve grouting being not dense happens frequently, which leads to the failure of steel bars to play a full role in the stress which introduces further potential safety risks.
Existed research on steel sleeve grouting mainly focuses on its mechanical properties and force transmission effects, etc. Kim [1], Sayadi et al. [2], Wu et al. [3] studied the main factors affecting the performance of the grouting connection joint of the steel sleeves. Alias et al. [4] designed the mechanical properties of grouting casing connectors with or without steel spiral as transverse reinforcement under incremental tensile load. Ling et al. [5] designed and manufactured sleeve grouting connectors with different joint forms and studied their feasibility through experiments. Henin et al. [6] designed a grouting sleeve made of seamless steel pipes with thread on the inner surface of the pipe wall, and studied the bearing capacity of the sleeve grouting connector by uniaxial tensile test and numerical simulation. Moosavi et al. [7] studied the sleeve grouting connectors with internal shear keys and gave the minimum spacing of shear keys. Wu et al. [8] conducted uniaxial tensile tests on 20 MPa sleeve grouting connectors, and studied the effects of sleeve types, anchorage length and reinforcement diameter on sleeve wall strain. Zhang et al. [9], using glass fiber composite as sleeve material, designed a GFRP full grouting sleeve for numerical simulation to verify its feasibility. Wang et al. [10] used the finite element software ABAQUS to simulate the grouting sleeve connection, and compared it with the test value. The results showed that the influence of steel bar deviation on the bearing capacity of the sample was not significant. In the tensile test of the grouting sleeve, the sleeve, still in the elastic stage, did not reach the yield. Wu et al. [11] studied the effects of shear bond on the bearing capacity of reinforced sleeve grouting. Yu et al. [12] and Yu et al. [13] carried out the pull-out test of 45 ribbed steel bars anchored into the sleeve constraint grouting material, studied the change rule of sample failure mode and bond strength, and carried out the quasi-static test of precast shear wall with sleeve lap connection. The results show that sleeve can transfer steel stress well in precast concrete shear wall. Xu et al. [14] carried out experimental study on grouting connection performance of steel sleeve under high-stress repeated tension and compression. Liu et al. [15] studied the constitutive relation of semi-grouting sleeve steel bar connection in the numerical simulation analysis of fabricated structure, and the simulation results were in line with the experimental results. Kim [16], Wang [17], Lu et al. [18], Zheng [19] compared the differences between prefabricated columns and other components with cast-in-place components. Soudki et al. [20] compared the seismic performances of assembled shear walls under different connection modes, and proved that steel sleeve connection has a greater bearing capacity, and the local unbonded steel connection has the best deformation capacity. Buddika et al. [21] based on OPENSEES computing platform, carried out relevant numerical simulation analysis of prefabricated frame shear structure. Divan et al. [22] studied the fabricated frame shear wall structures with different story heights and spans by nonlinear static method. Based on SAFECAST project, Bournas et al. [23] studied a full-scale model of a three-story prefabricated frame shear wall structure through quasi-static test, studied the seismic damages of different parts, and comprehensively evaluated the seismic performance of the model structure. Few studies have been carried out on grouting defects, especially on seismic behavior of the structures. In this study, the mechanical model of the connection of the assembled shear wall with defective grouting sleeve was proposed, and its seismic performance was analyzed. In particular, the method of reserving holes to separate the reinforcement and grouting material at the defect was proposed in the defect simulation. The analysis results can better reflect the influence of defects on seismic performance of components. The results of this paper provide a comparative basis for the subsequent research on the influence of grouting defective sleeve on structure, and the results of the test research can be made more universal with the change of parameters.
1 Establishment and Verification of Finite Element Model of Shear Wall
1.1 Establishment of Finite Element Model
In order to verify the rationality of the finite element model of shear wall, this paper analyzes the finite element model of TWL in [24], and compares it with the test results in [24].
(1) Unit selection
The concrete part of the model adopts solid hexahedron element C3D8R. The reinforcement part adopts the space two node frame separation unit T3D2. The sleeve part adopts solid element.
(2) Constitutive relation of materials
In this paper, the damage plastic model of concrete is used to simulate the concrete in the shear wall, with compressive stress-strain relationship determined according to the code GB50010-2010 (2011), such as Eqs. (1)–(5).
When
When
In the formula:
n-coefficient, when the calculated n value is greater than 2.0, it is taken as 2.0.
The tensile stress–strain relationship determined by ABAQUS in-built model, the tensile and compressive elastic modulus made equal before cracking, the tensile strength calculated according to the formula in literature [25], and the uniaxial constitutive relationship after cracking adopting linear softening model. The softening modulus is calculated according to the criterion of fracture energy CEB-FIP [26]. The constitutive relation of steel bar adopts the elastic and strengthening model of double broken line, and to strengthen the model, the elastic modulus in tension is the same as that in compression. The ideal elastic-plastic model is adopted for the sleeve material, which is determined according to the code JG/T398-2019 [27]. The compressive stress-strain relationship of grouting material is selected according to the recommendation of the code JG/T408-2019 [28]. The reinforcement GB50010-2010 ([29]) of the shear wall is HRB400, the elastic modulus is 2.0 × 10⁵ Mpa, and the Poisson's ratio is 0.3. C40 concrete GB50010-2010 [29] is used for capping beam, base and shear wall with Poisson's ratio of 0.2; The sleeve material is made of steel with elastic modulus of 370 mpa and Poisson's ratio of 0.3. The sleeve grouting is made of high-strength non-shrinkage cement grouting material with Poisson's ratio of 0.2.
(3) Loading mode
When using the ABAQUS software to analyze the seismic performance of the shear wall structure, the structure is subjected to multiple cyclic reciprocating loads, resulting in nonlinear elastic-plastic deformation and failure. The horizontal displacement low-cycle reciprocating loading form is used to simulate the cyclic reciprocating periodic motion of the substructure of the wall under the action of seismic waves, and the anti-overturning ability of the assembled shear wall model is studied. Based on the above theory, two loading conditions that fit the actual wall force are drawn up.
Condition 1: Only apply the respective weight of the three models as well as the uniform load generated by the upper structure of the wall on the lower structure. In this paper, the axial compression ratio of the design model is 0.12. According to the axial compression ratio formula,
Condition 2: The structural dead weight and the upper uniform load applied in Condition 1 are transferred to Condition 2 in the form of a dead load, while a horizontal displacement is applied to the side of the loading cover beam.
(4) Boundary conditions
In the contact attribute, the penalty element is used to define the tangential attribute, with the friction coefficient set up as 1, the normal attribute adopting “hard” contact element, and the constraint execution method selected as default. Base and shear wall, loading beam and shear wall are connected through tie. The binding constraint is used to bind two regions in the model together so that there is no relative movement between them. The two contact surfaces in this connection form are equivalent to rigid connections in stiffness data transmission, and there is no relative motion and deformation in the binding area.
The steel mesh and sleeve elements are embedded into the shear wall entity element via embedded region. This model assumes that the co-working performance of steel and concrete is sound. Both the sleeve and the grouted steel do not slip with the surrounding concrete. The steel skeleton is embedded in the concrete solid unit via embedded region. The embedding constraint can specify a set of units to be embedded in a set of main units. The nodes of the embedded unit located in the main unit will be removed from translational degrees of freedom and become “embedded nodes”. The translational degrees of freedom of the embedded nodes are constrained by the difference of the corresponding degrees of freedom of the main element. The embedded unit allows rotation, but its rotation is not restricted by the embedded region.
1.2 Finite Element Model Validation
The finite element analysis of this paper is compared with the experimental results of reference [24] in terms of failure mode, bearing capacity and hysteretic energy consumption curve.
(1) Comparison of failure modes
Fig. 1 shows the comparison of the TW1 failure between the finite element simulation and the test results in reference [24]. The compression damage at the foot of the wall is obvious, with plastic hinge formed, and the damage developing fully along the wall. The failure mode of the TW1 test is basically consistent with that of the finite element analysis.
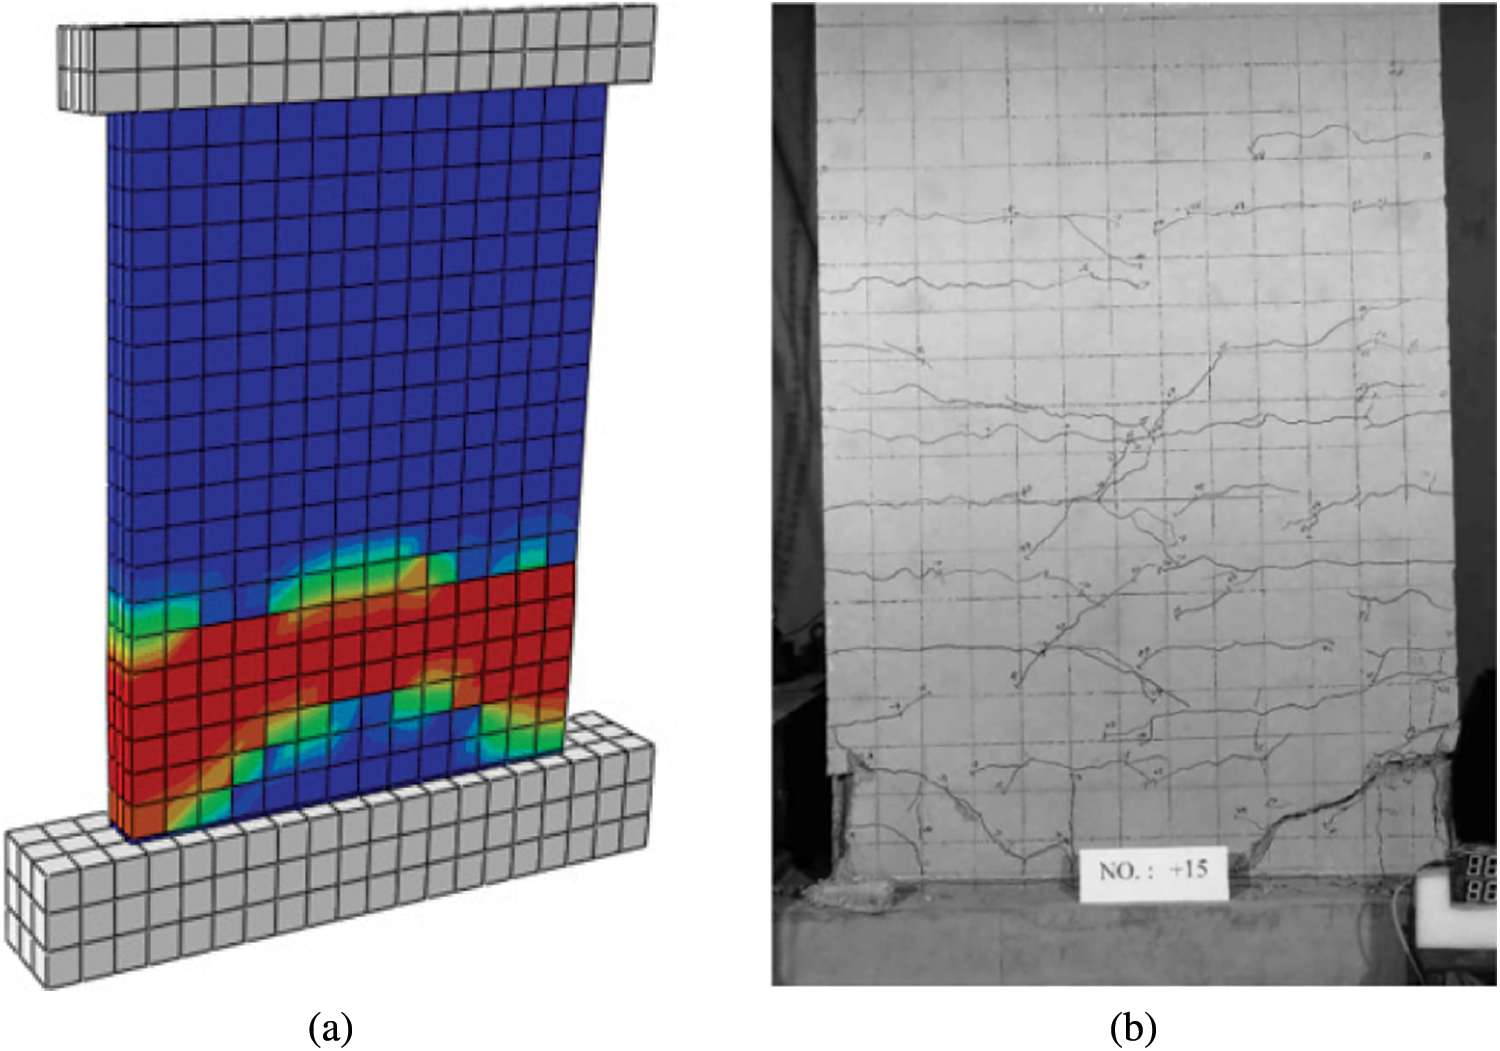
Figure 1: Failure comparison between finite element simulation and TW1 test (a) Finite element method (b) Test
(2) Comparison of bearing capacity
Fig. 2 shows the comparison of the TW1 skeleton curve of the sample between the finite element simulation and the test result in reference [24]. The two curves basically overlap. The ultimate bearing capacity of the test is 342 kN, while the ultimate bearing capacity of the finite element simulation is 375 kN, 1.10 of the former. Therefore, the finite element model can reasonably simulate the ultimate load value of the actual shear wall components.
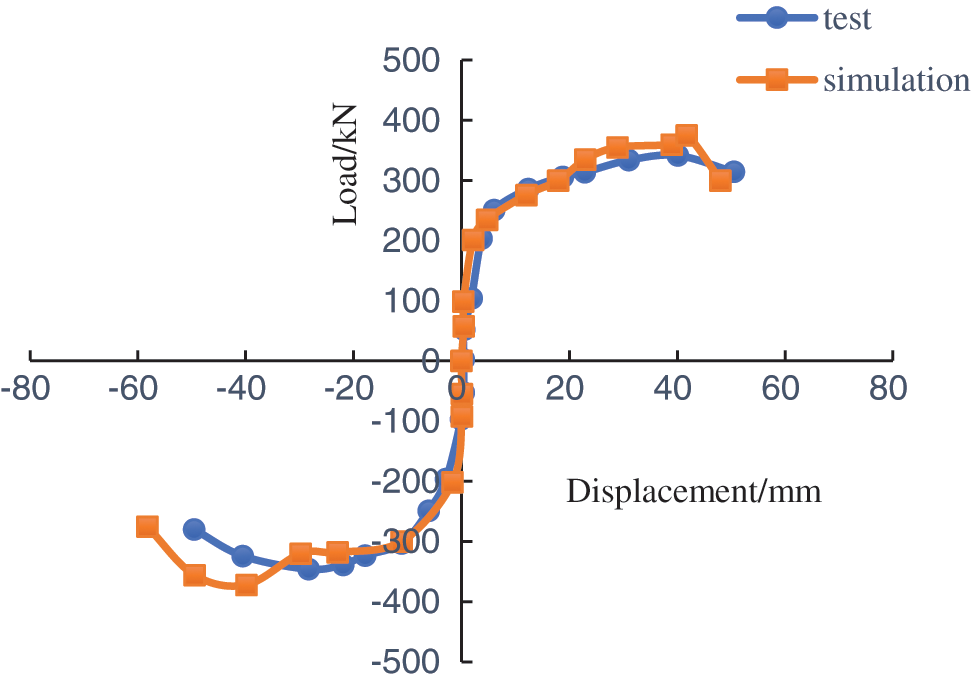
Figure 2: Comparison between finite element simulation and TW1 test skeleton curve
(3) Comparison of hysteretic energy consumption
Fig. 3 shows the comparison of the hysteretic energy consumption curves of TW1 between the finite element simulation and the test result in reference [24]. The two curves are highly overlapped, with equivalent energy consumption levels. The finite element model can reasonably simulate the energy consumption capacity of the actual shear wall components.
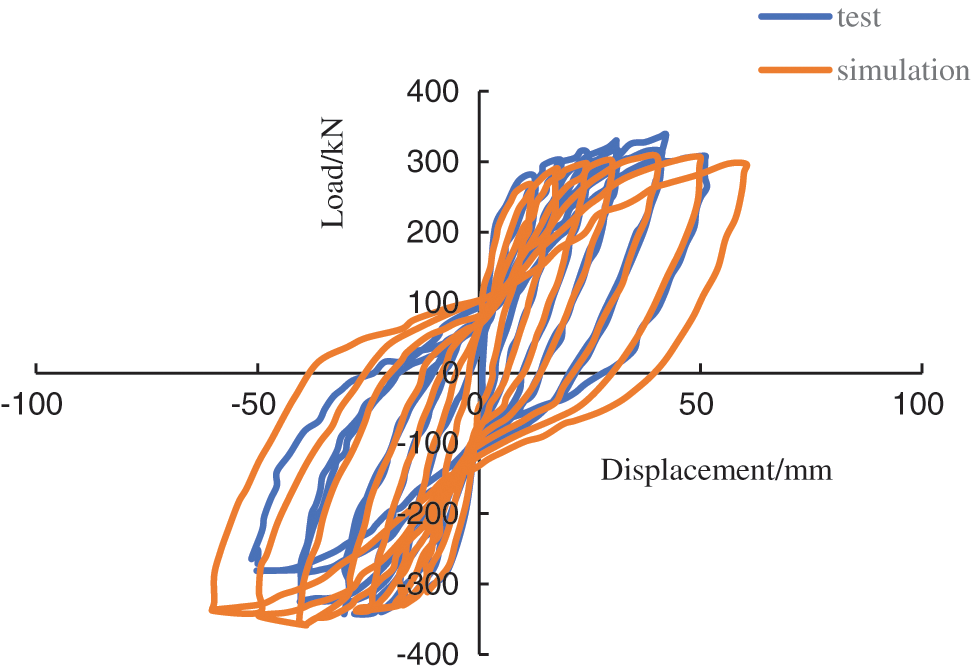
Figure 3: Comparison of hysteresis curves between finite element simulation and TW1 test
This article mainly analyzes the seismic performance of shear wall models with different level of defects. The degree to which the structure is influenced is analyzed by setting different locations and quantities of such grouting defects. The size of the shear wall is shown in Fig. 4. For simple calculation, C12 is used for longitudinal reinforcement, C14 is used for prestressed reinforcement, C8 is used for stirrup, and the base and loading beam cap are considered as rigid members.
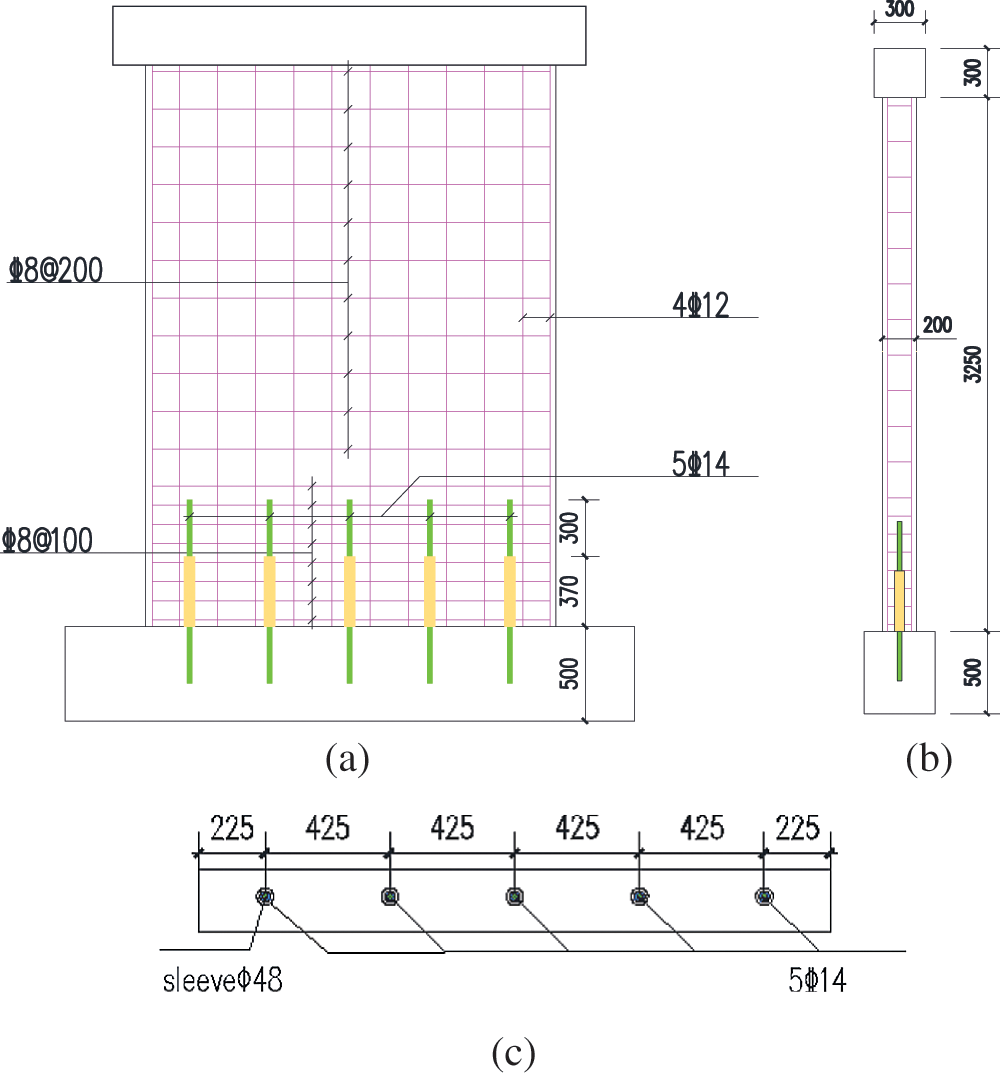
Figure 4: Model size diagram (a) front elevation (b) side elevation (c) 1–1 sectional drawing
The steel bars of the shear wall are all HRB400 grade, and according to the elastic modulus ES = 2.0 * 105 MPa, Poisson's ratio is 0.3. The loading cover beam, base, and shear wall are all made of C40 concrete with a Poisson's ratio of 0.2; the sleeve is made up of steel, with an elastic modulus of 370 MPa, and a Poisson's ratio of 0.3. The sleeve grouting material is a high-strength non-shrinkage cement grouting material, using C80 high-strength concrete constitutive, with a Poisson ratio of 0.2. The material performance parameters of the test samples are shown in Table 1. The defective conditions of the test designed as shown in Fig. 5, and the sample numbers are W-QM, W-QD, and W-BD. W means shear wall, QM means full grouting of all sleeves, QD means all sleeves are defective, BD means part of the sleeves are defective. The defect is set as an end defect, and the defect length is 4 times the diameter of the steel bar as shown in Fig. 5d.
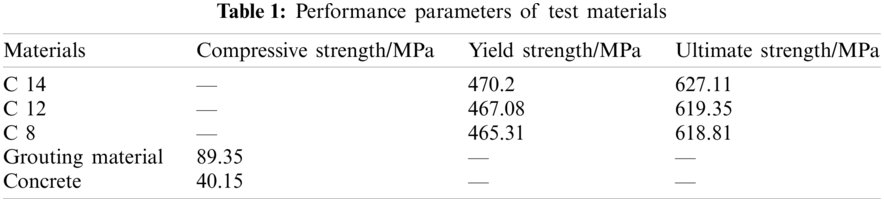
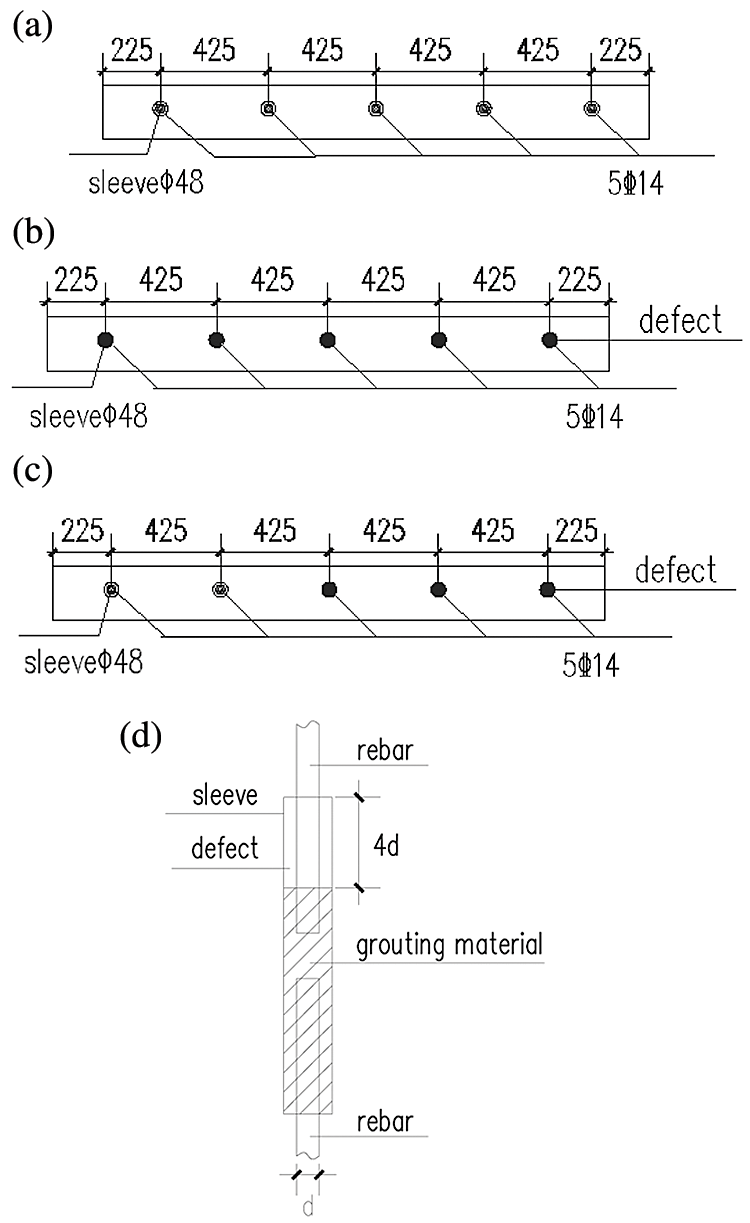
Figure 5: Design models of different working conditions (a) W-QM model (b) W-QD model (c) W-BD model (d) Schematic diagram of sleeve defects
The finite element model of the shear wall is established according to the method described in Section 1.1. As shown in Fig. 6, the axial compression ratio of the design model is 0.15, and the upper load P is 800 kN.
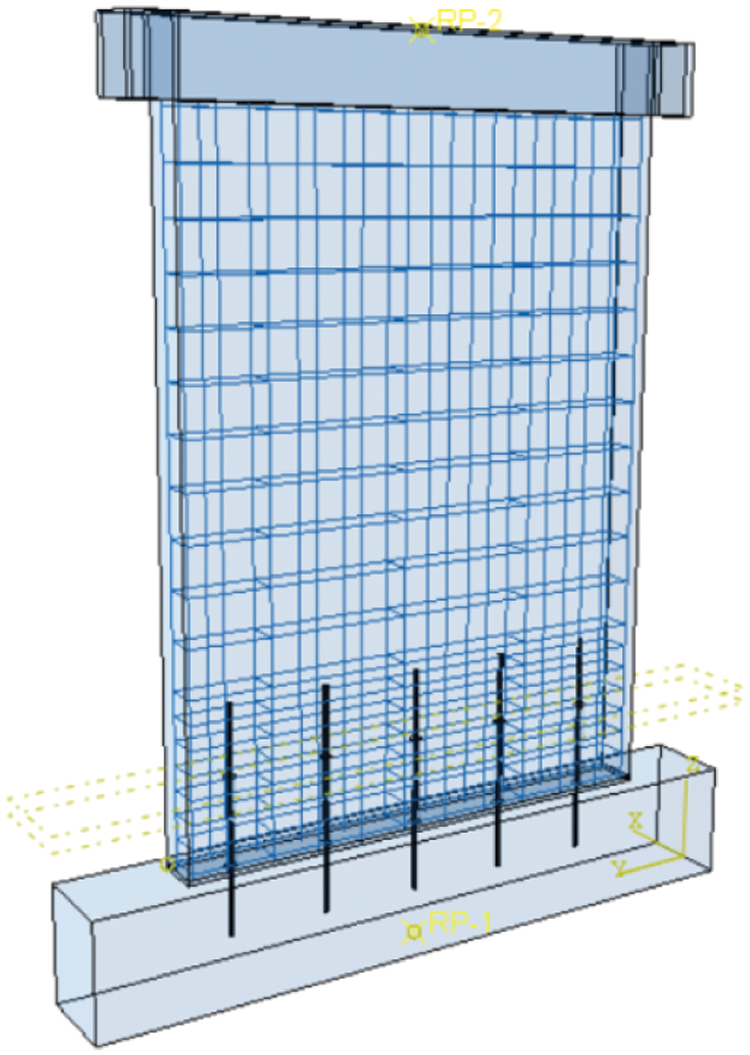
Figure 6: Finite element model
The simulation of the grouting defects in the sleeve is the key part. First, a hole should be reserved in the defective wall so that the steel bar at the defect can be separated from the grouting when the rebar is embedded in the grouting, which will cause stress concentration at the hole during analysis and so needs to be dealt with separately during grid division. The division situation is shown in Fig. 7.
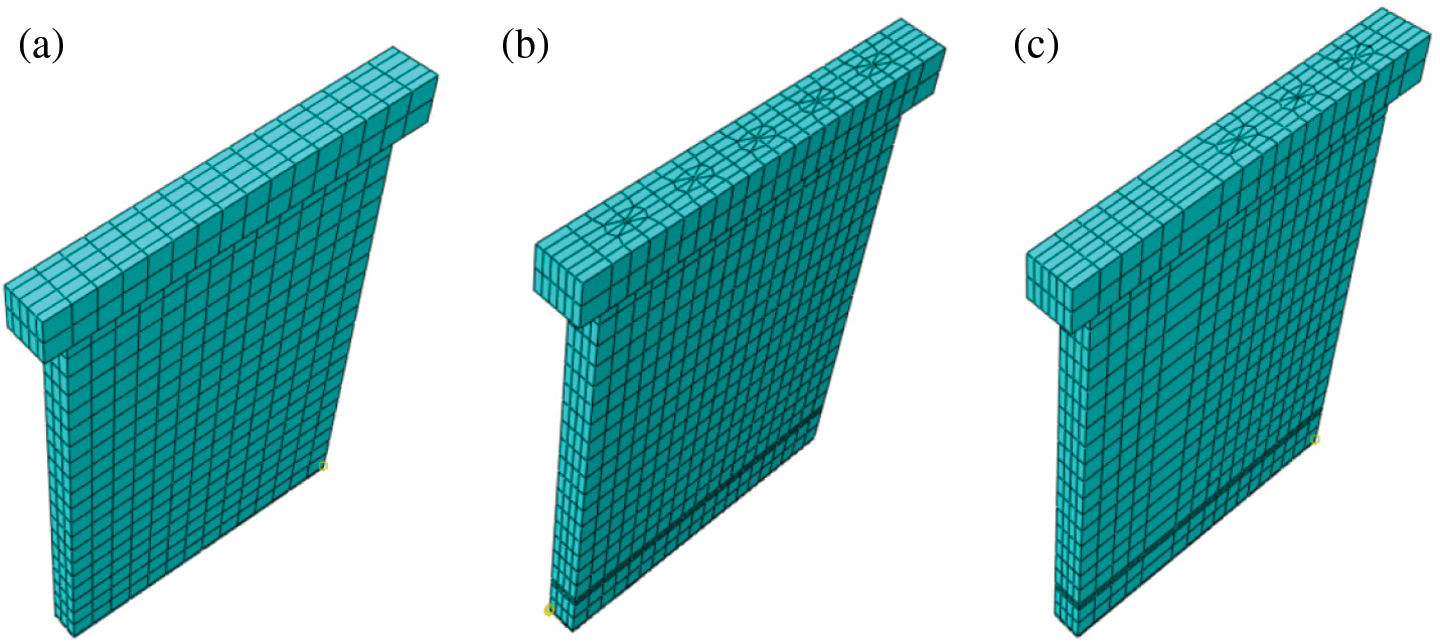
Figure 7: Grid division of different models (a) Defect-free model (b) Fully defective model (c) Partially defective model
The base plane split geometric element tool in the ABAQUS part element is used to split the defective steel bars. When the contact element steel bars are embedded in the shear wall entity, the defective parts are not embedded in the wall, as shown in Fig. 8. In this way, the defective part is separated from the wall in the analysis, and the influence of the defects on the stress of the wall is effectively simulated.
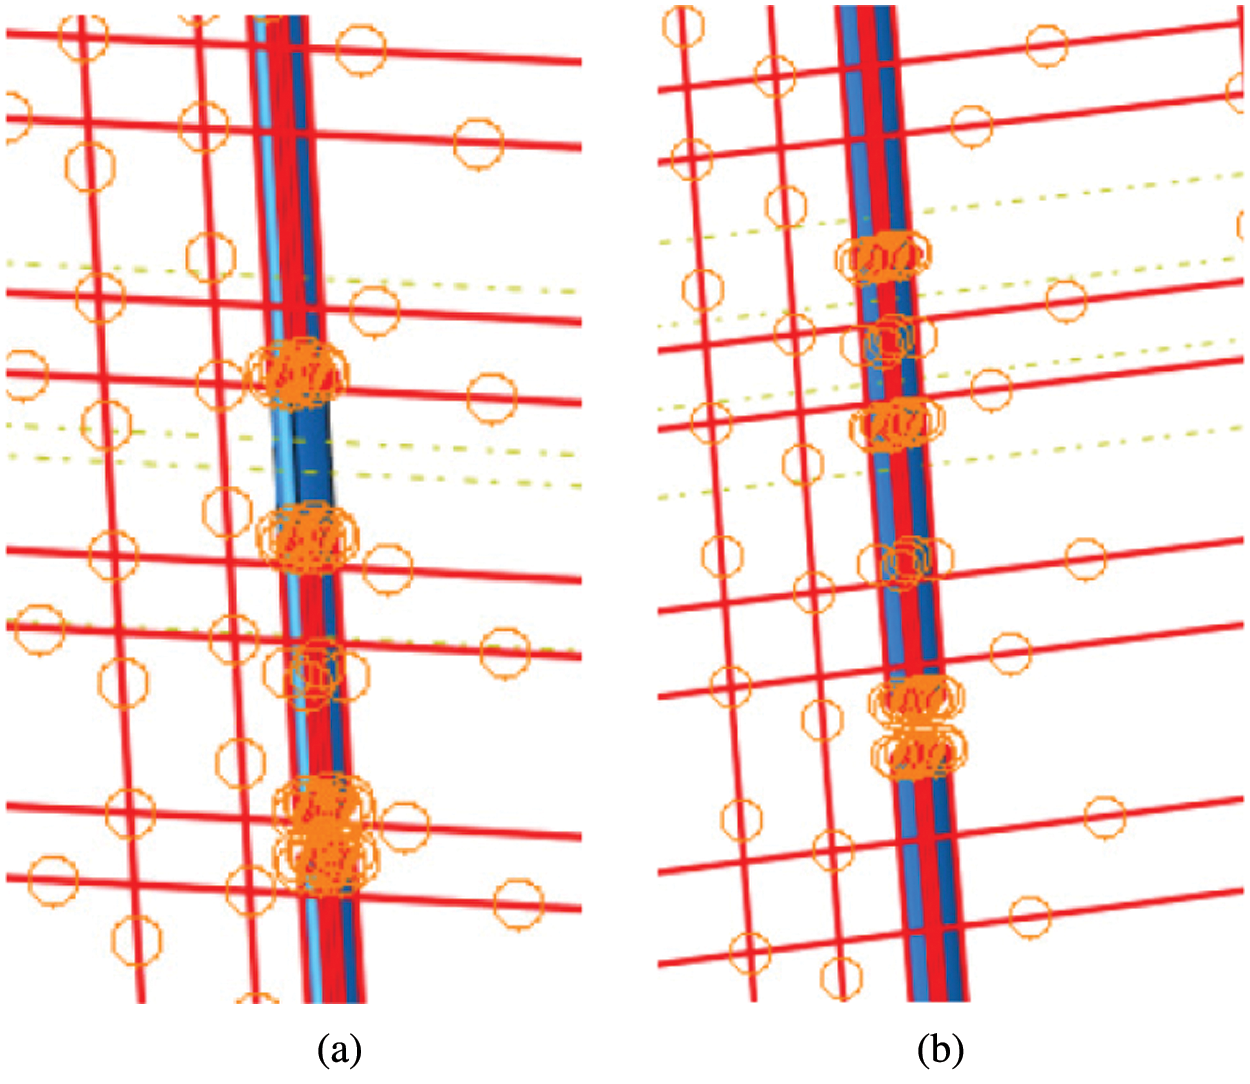
Figure 8: Simulation diagram of defective part (a) Defective model (b) Defect-free model
3 Finite Element Analysis Results
3.1 Analysis of Plastic Damage of Shear Wall Model
Shear wall is the main lateral resistance component of a building structure. Ductility is an important index to measure the seismic performance of shear wall, and its ductility is obtained by the formation and development of plastic hinge. The plastic hinge rotates under horizontal load of shear wall, so that the wall can obtain ductility. By studying the generation and variation mechanism of plastic hinges in the three models, including fabricated shear wall sleeve with full grouting (QM), sleeve with fully defective grouting (QD) and sleeve with partially defective grouting (BD), the differences of the three models in deformation and failure under reciprocating load are compared in detail. When the axial compression ratio of the shear wall is controlled to be constant, the field distribution of the damage parameter cloud of the structure under horizontal reciprocating load is shown in Fig. 9.
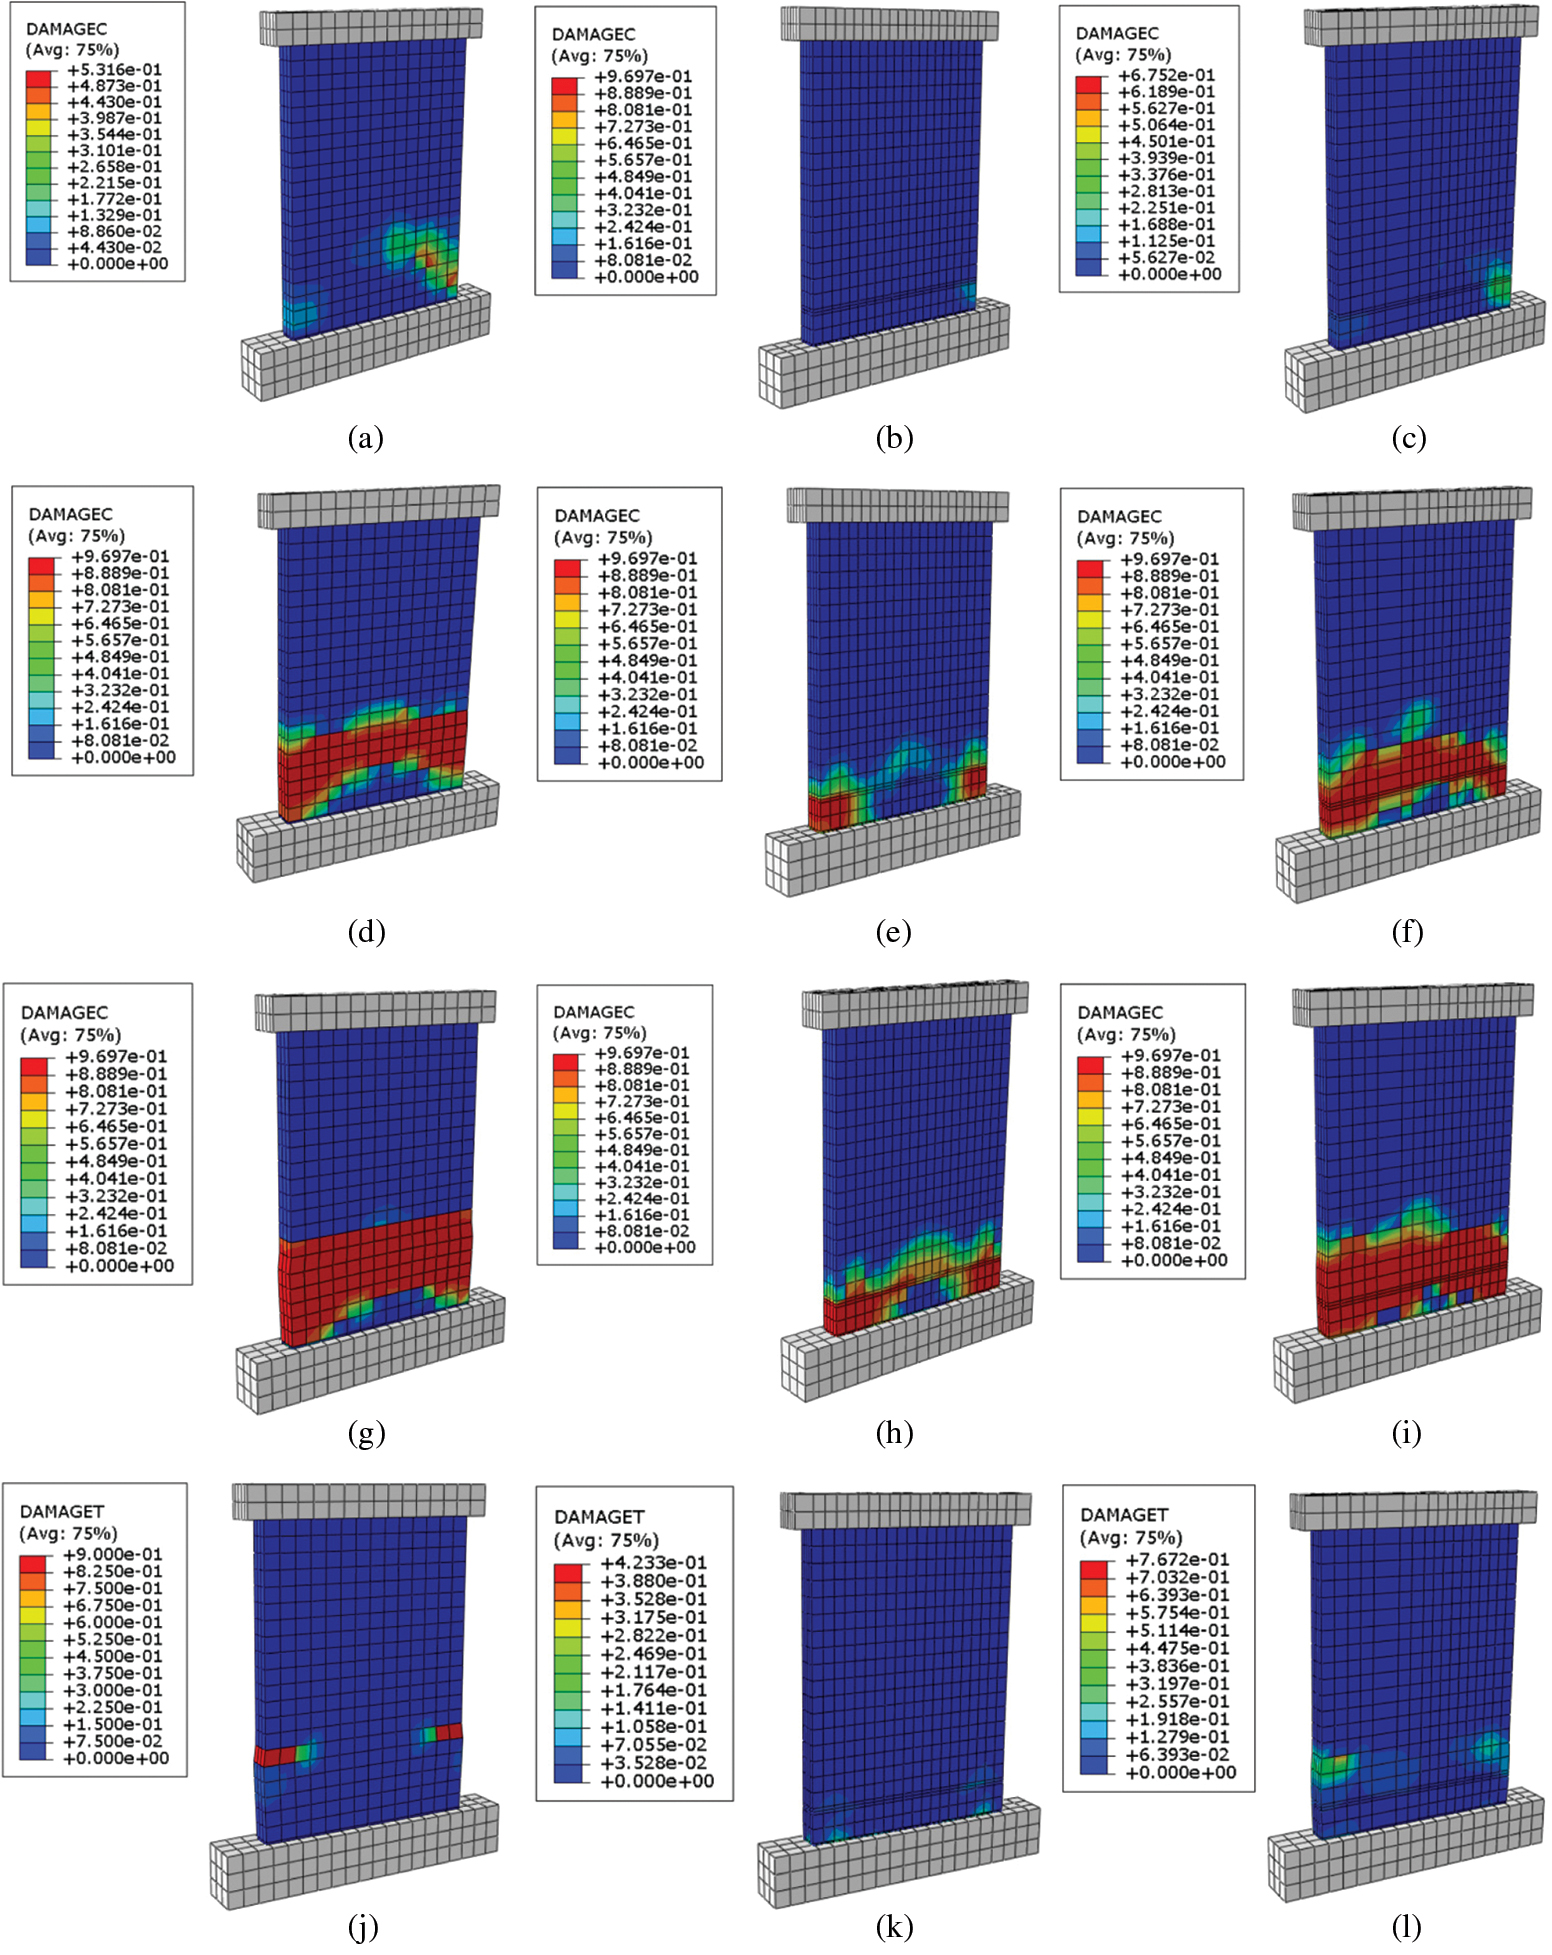
Figure 9: Plastic damage nephogram of model (a) 5-second compression damage of a defect-free shear wall (b) 5 s damage nephogram of a fully defective shear wall (c) 5 s damage nephogram of a partially defective shear wall (d) Cloud picture of 15 s compression damage of a defect-free shear wall (e) Cloud picture of 15-second compression damage of a fully defective shear wall (f) Cloud picture of 15 s compression damage of a partially defective shear wall (g) 24 s compression damage nephogram of a flawless shear wall (h) 24 s compression damage nephogram of a fully defective shear wall (i) 24 s compression damage nephogram of a partially defectiveshear wall (j) Defect-free shear wall tensile damage nephogram (k) Cloud picture of tensile damage of a fully defective shear wall (l) Cloud images of tensile damage of a partially defective shear walls
From the comparative analysis of Fig. 9 the development mechanism of the three models of plastic hinges shows that:
(1) Figs. 9a–9c show that in the three models compressive damage begin to show up at the bottom of the wall at the initial stage of loading (5 s), with the damage of the defect-free model developing rapidly. The reason is that the reinforcement in the sleeve of the defective model slips due to the insufficient grip between the defect and the grouting material, absorbs energy and reduces the damage of the wall. The damage of the fully defective model is basically the same as that of the partially defective model.
(2) From Figs. 9d–9f, it can be seen that with the gradual increase of displacement control (15 s), the compressive damages at the foot of the wall in the grouting models with no defects and partial defects develop obviously, with a plastic hinge forming and developing along the pier; The damage to the wall in the fully defective model is mainly concentrated in the range of 350 mm up the bottom of the wall. The analysis shows that this phenomenon is attributed to that the solid grouting sleeve with a length of 350 mm is set up above the bottom of the wall. With the increase of loading, the slip of steel bars increases, and the energy is further absorbed, so that the energy cannot be transmitted to the middle of the wall, producing a more serious damage. Partially defective model analysis suggests that the energy can be transferred to the middle of the wall due to the full grouting on one side.
(3) It can be seen from Figs. 9g–9i that when the structure is damaged, the overall compression damages of the wall in the defective-free and partially defective models are obvious, with damage on the defect side in the partially defective model slightly deficient, but not obvious, and on the whole, has a strong energy absorption capacity, while the damage of the fully defective model is mainly concentrated in the range of the sleeve height, with insufficient development of the wall and insufficient energy absorption capacity.
(4) It can be seen from Figs. 9j–9l that the tensile damage of the defect-free model occurs at the top of the sleeve, while the tensile damages of the partially defective model and the fully defective model are not obvious. The reason is that in the defect-free model, the sleeve is under tension. The top steel bar is the stress concentration part causing the tensile damage of the wall, which is consistent with the tensile failure force of the reinforced grouting sleeve; However, in the partially defective and fully defective models, due to the slip of the steel bar, the tensile stress is borne by the entire sliding steel bar which is small and produces a not so serious tensile damage.
3.2 Stress Analysis of Prestressed Steel Bars
It can be seen from the prestressed steel stress cloud chart Fig. 10 that the maximum stress of the prestressed steel bar in the defect-free model is concentrated at the top of the sleeve, which is consistent with the failure mode of the steel bar in the unidirectional tensile failure test of the steel grouting sleeve, indicating that the prestressed steel bar does not slip. The maximum stress of the prestressed steel bar in the fully defective model appears at the end of the steel bar in the sleeve, which is consistent with the failure mode of the steel bar in the unidirectional tensile failure test of the defective steel bar grouting sleeve, indicating that the prestressed steel bar slips in the sleeve; The failure mode of prestressed steel bars in the partially defective model is consistent with the previous two models.
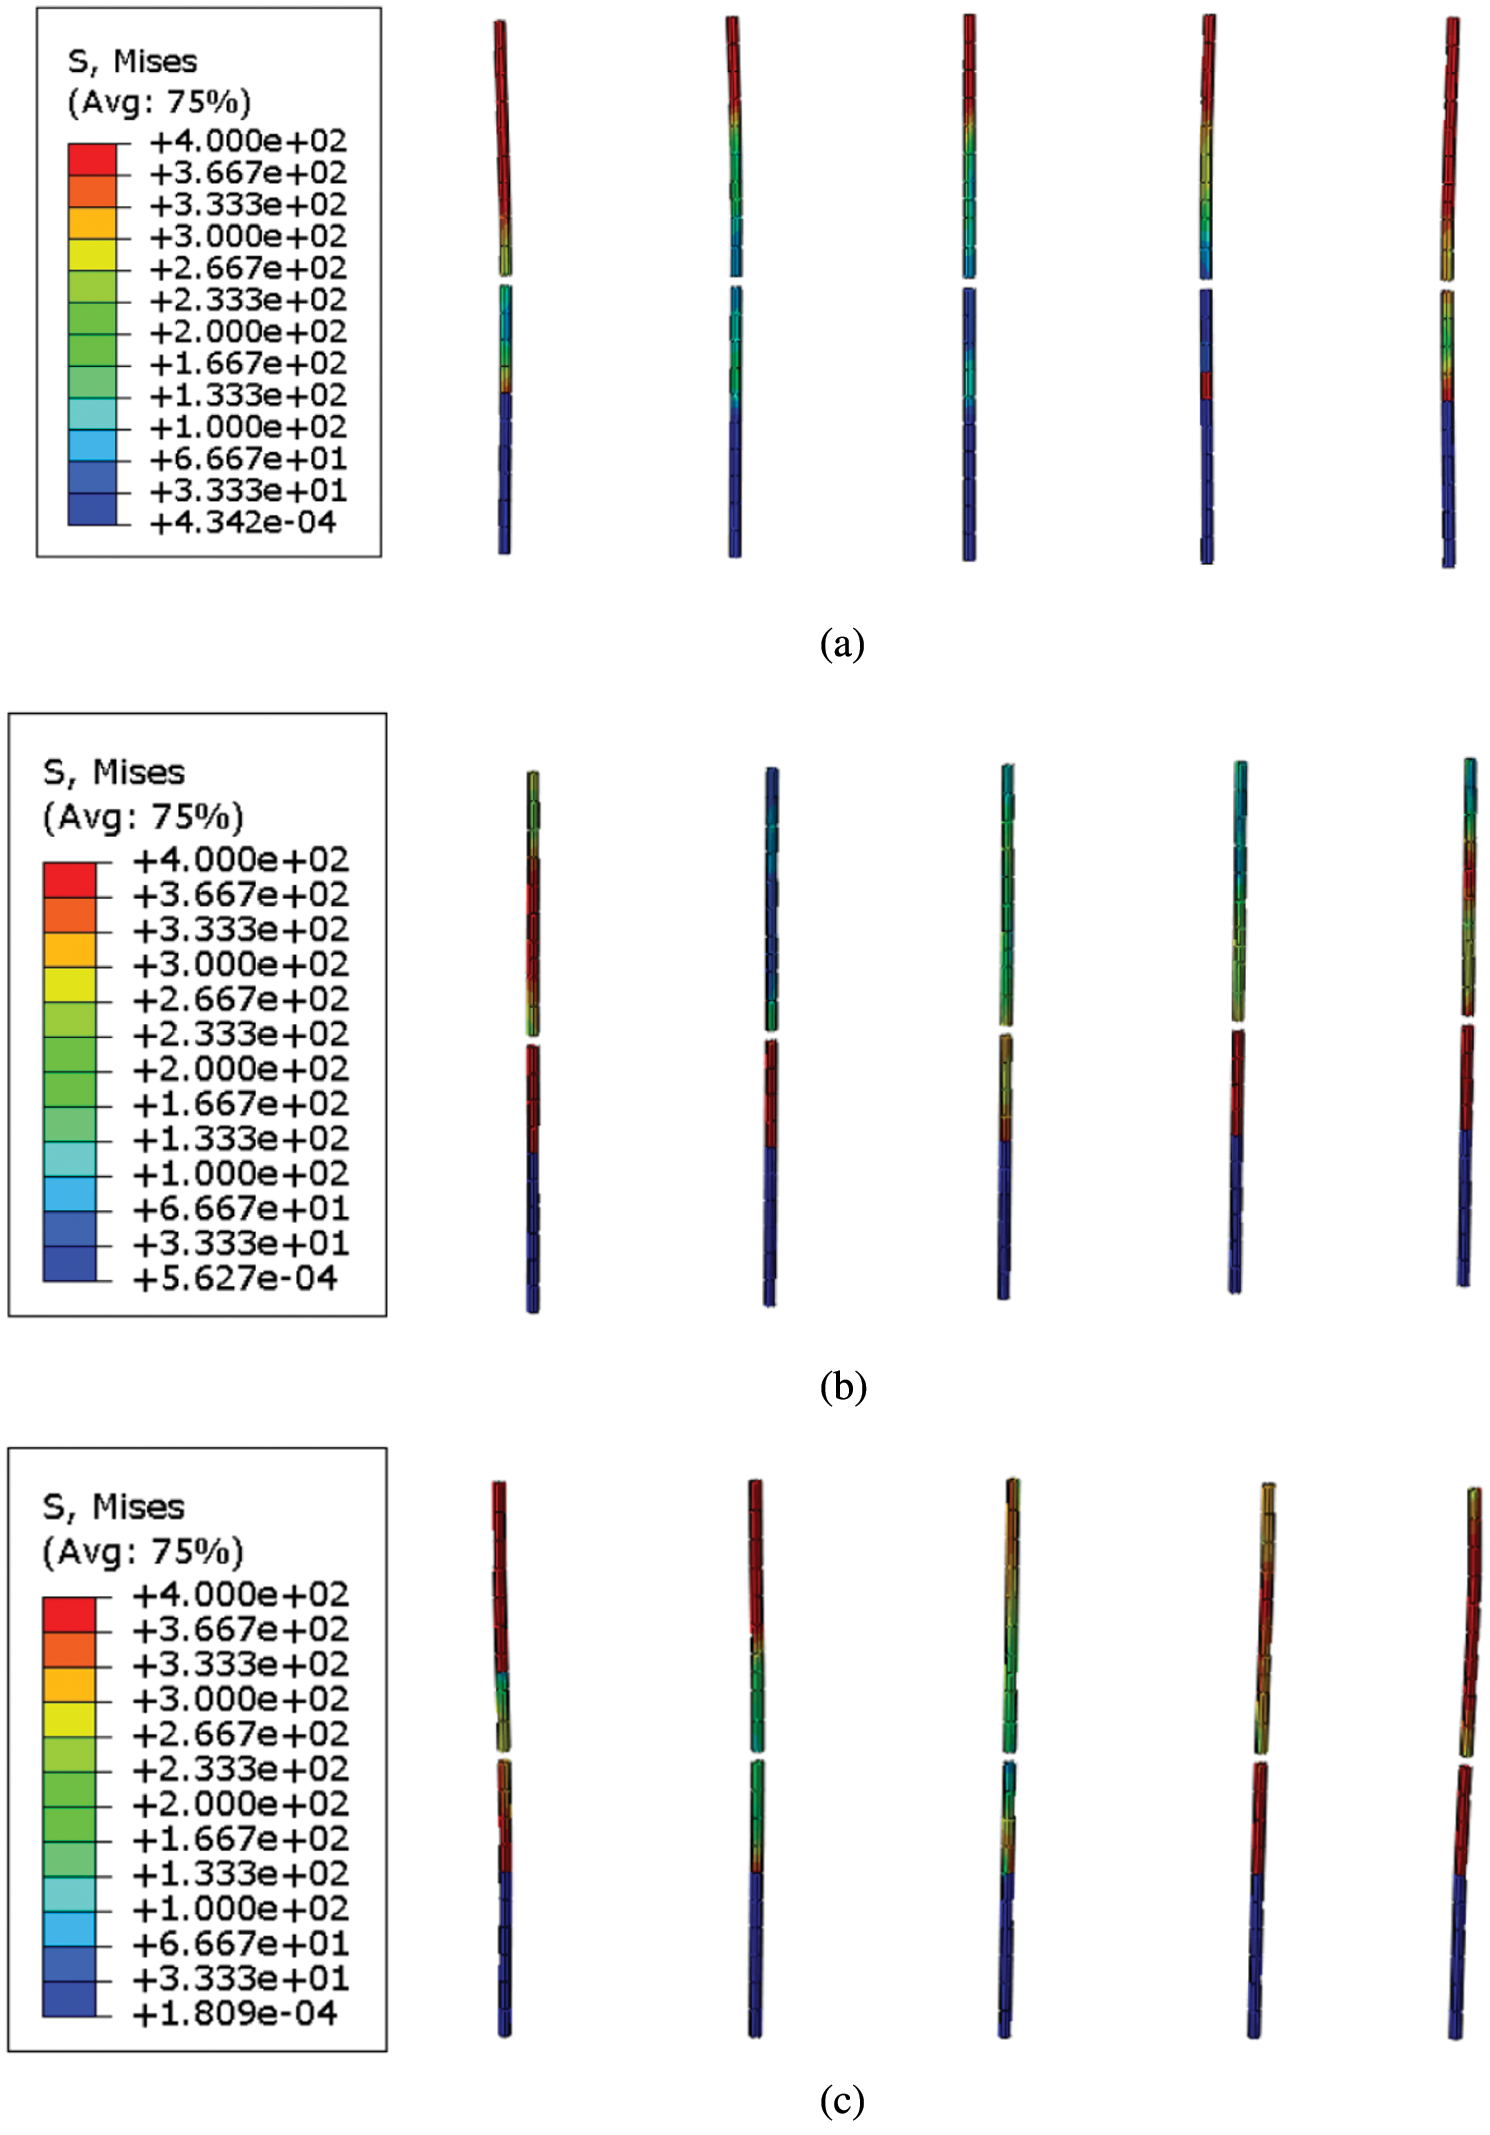
Figure 10: Stress nephogram of prestressed tendons of three models (a) Defect-free prestressed tendons (b) Fully defective prestressed tendons (c) Partially defective prestressed tendons
3.3 Analysis of Energy Consumption
The energy consumption capacity of the three working conditions can be analyzed through the hysteresis curves, as shown in Fig. 11.
(1) The hysteresis curve shape of the defect-free and partially defective models is basically the same, and both show a “shuttle” shape. Before the cracking failure of wall concrete occurs, the horizontal load and displacement show a linear relationship, and the slope of hysteresis curve remains basically unchanged with the increase of load value, indicating that the wall is in an elastic stage. It shows that when the component is in the elastic stage, the energy consumption is small, the residual displacement of the two models is not obvious after unloading, and the stiffness has no significant degradation. With the increase of load, plastic deformation occurs in the wall. The slope of the hysteresis curve decreases gradually with the increase of load, but the increasing trend gradually slows down. The stiffness of the wall degenerates with the wall gradually developing from the yield state to the failure state, showing up more obvious stiffness degradation. Some defects have little effect on the energy dissipation of the whole structure, as the defect-free prestressed reinforcement plays a key role.
(2) The hysteresis curve shape of the fully defective model has an obvious “pinching” phenomenon, mainly because the prestressed steel bar slips during the loading process due to grouting defects. With an increased energy consumption level, decreased resistance and horizontal displacement, the wall is gradually full of hysteresis.
(3) The ultimate bearing capacity of the defect-free model is the highest, that of the partially defective model is slightly reduced, and that of the fully defective model is significantly reduced, indicating that the number of defects has a significant impact on the bearing capacity of the wall.
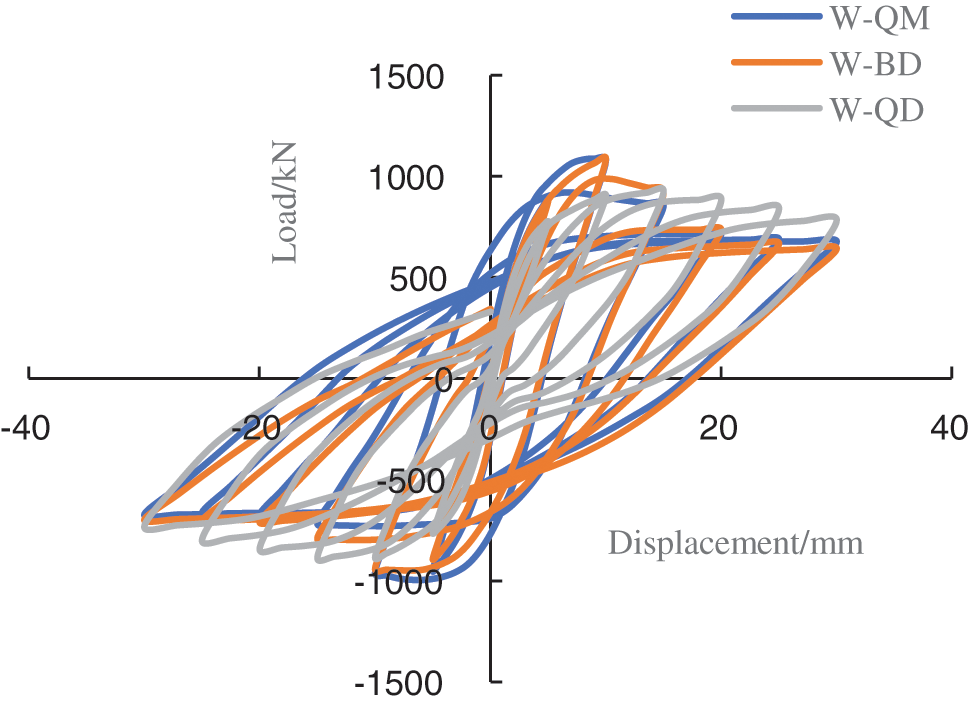
Figure 11: Hysteresis curves of models
Displacement ductility factor is calculated by
The displacement ductility coefficient is used to represent the rotation ability of the plastic hinge section to resist the reciprocating load, which is similar to the solution formula of the displacement ductility coefficient. The ratio of the ultimate displacement to the yield displacement is the displacement ductility. The larger the displacement ductility coefficient, the better the rotational performance of the plastic hinge region, and the stronger its ability to resist earthquake action. The seismic performance parameters of three shear wall models are calculated in Table 2.
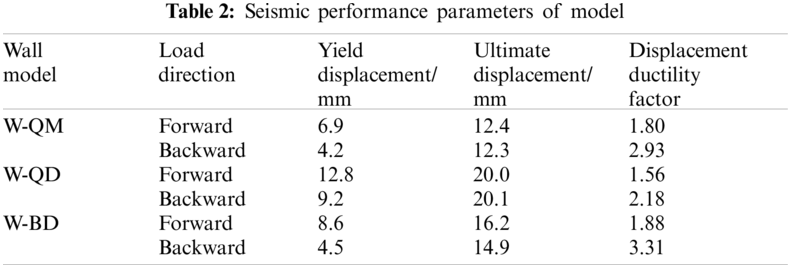
Analysis of the data in Table 2 shows that the yield displacement results of the defect-free model and partially defective model are smaller than that of the fully defective model. In the fully defective model, the steel in the sleeve slips at the beginning of loading, and the external load is used to resist the slip between the steel and the grout. Therefore, the steel bars in the plastic hinge area at the lower end of the wall in the defect-free model and partially defective model must yield before the structure of the fully defective model, resulting in a smaller yield strength; If the load strengthens, the steel slippage in the fully defective model is completed, and the steel cannot continue to bear the load, which reduces the overall rigidity of the structure, resulting in the ultimate displacement of the fully defective model being greater than that of the defect-free and partially defective model; The yield displacement and ultimate displacement of the partially defective model are larger than those of the defect-free model, which also verifies the above reasons.
3.5 Analysis of Bearing Capacity
The skeleton curves of the three models are shown in Fig. 12, and Table 3 is obtained by extracting the horizontal force corresponding to each feature point from Fig. 11. It can be seen from Table 3 that the walls of the defect-free and partially defective models cracked earlier, and the fully defective model cracked later. This is due to the slippage of the prestressed steel bars at the defective areas that absorbs energy, which is consistent with the previous wall damage cloud chart analysis results. There is little difference between the three models in terms of yield load, indicating that the steel bars have reached yield; The ultimate load of the defect-free model is the largest, followed by the partially defective model, and the fully defective model has the smallest level of ultimate load. This also verifies that the prestressed steel bar in the sleeve in the defect-free model has reached the strength limit and fractured, while in the defective areas in the partial defective model, the stress steel bar fails to reach the strength limit before slip failure occurs, and in the fully defective model, all slip failure occurs.
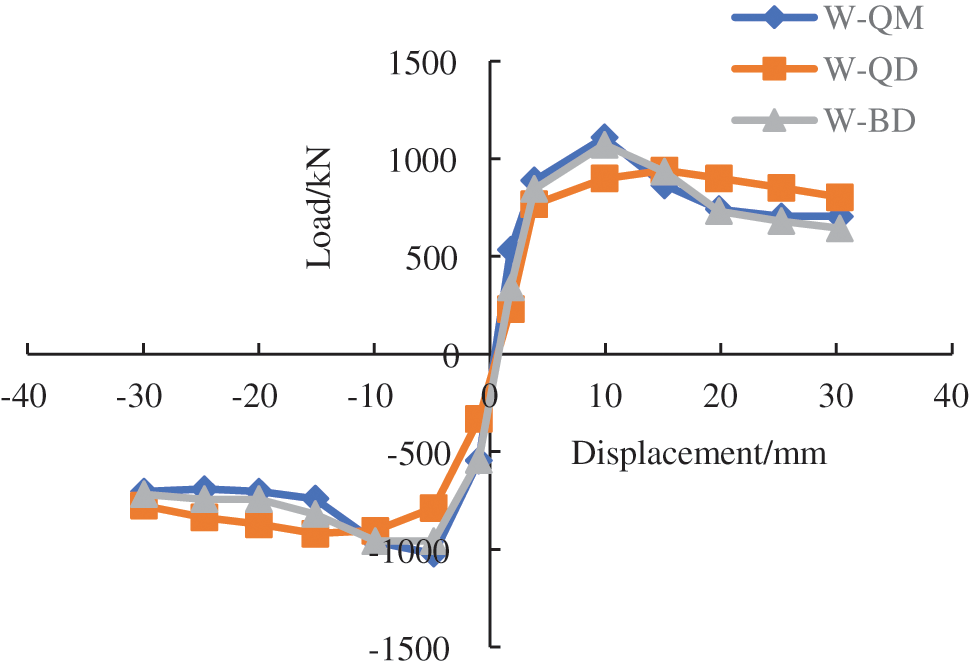
Figure 12: Model skeleton curves
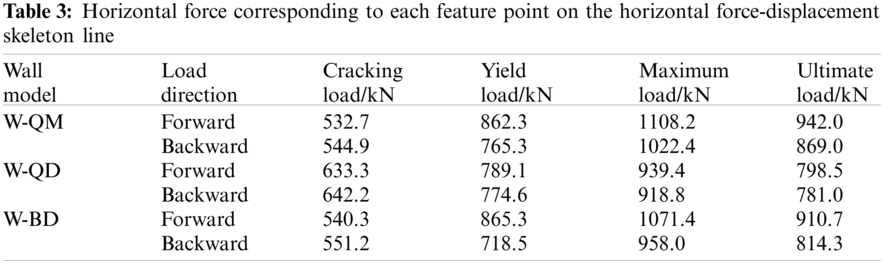
Fig. 13 shows the relationship between the secant stiffness and displacement of three kinds of sleeve-connected precast wall model samples. As the displacement increases, the secant stiffness of the samples decreases. The stiffness degradation curves of the three models are basically overlapped with one another. The stiffness of the defect-free and partially defective models before the ultimate displacement is greater than that of the fully defective model. When the displacement is loaded to 20 mm, the stiffness degradation of the three models is equivalent.
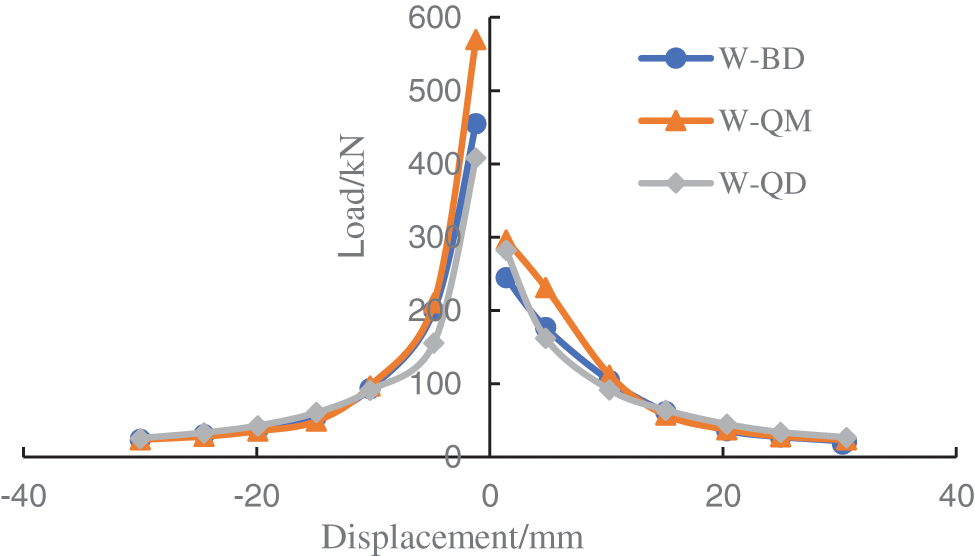
Figure 13: Model stiffness change
In this paper, three kinds of shear walls with full sleeve grouting, fully defective sleeve and partially defective sleeve are designed. The mechanical properties are analyzed by ABAQUS finite element software, and the following conclusions are obtained.
(1) At the beginning of loading (5 s), compressive damage appears at the bottom of the wall in all three models. The damage of the defect-free model develops faster, and the damage of the fully defective model is basically the same as that of the partially defective model. With the gradual increase of displacement control (15 s), the compressive damages at the foot of the wall in the defect-free and partially defective grouting model are obvious, with a plastic hinge formed in the foot of the wall, and the phenomenon of development along the pier body showing up. The wall damage of the fully defective model is mainly concentrated in the 350 mm range from the bottom of the wall where it gets most serious. When the structure is damaged, the walls in the defect-free and partially defective models are obviously damaged under pressure, and the defective side of the partially defective model is slightly damaged. The defect-free model has tensile damage at the top of the sleeve, while the tensile damage in the partially defective and fully defective model is not obvious.
(2) The maximum stress of the prestressed steel bar in the defect-free model is concentrated at the top of the sleeve, indicating that the prestressed steel bar does not slip; The maximum stress of the prestressed steel bar in the fully defective model appears at the end of the steel bar in the sleeve, indicating that the prestressed steel bar slips in the sleeve; the failure mode of the prestressed steel bar in the partially defective model is consistent with the previous two models.
(3) The hysteresis curves of the defect-free model and the partially defective model are basically the same, showing a “shuttle” shape. The energy consumption effect is sound, and some defects have little effect on the energy consumption of the overall structure. The reason is that the defect-free prestressed steel bars play a key role. The hysteresis curve shape of the fully defective model has an obvious “pinching” phenomenon, mainly because the prestressed steel bar slips during the loading process for the grouting defects, resulting in increased energy consumption and decreased resistance. As the horizontal displacement increases, the hysteresis loop of the wall gradually becomes full.
(4) The yield displacement results of the defect-free and partially defective models are smaller than that of the fully defective model. As the displacement increases, the secant stiffness of the samples decreases. The stiffness degradation curves of the three models are basically overlapped with one another. The stiffness levels of the defect-free model and partially defective model before the limit displacement is greater than that of the fully defective model. When the displacement is loaded to 20 mm, the stiffness degradation results of the three are equivalent.
Funding Statement: The authors are grateful for the financial support received from the National Natural Science Foundation of China (No. 52078038); Basic Scientific Research Business of Central University (No. FRF-MP-20-20).
Conflicts of Interest: The authors declare that they have no known competing financial interests or personal relationships that could have appeared to influence the work reported in this paper.
Reference
1. Kim, H. K. (2012). Bond strength of mortar-filled steel pipe splices reflecting confining effect. Journal of Asian Architecture & Building Engineering, 11(1), 125–132. DOI 10.3130/jaabe.11.125. [Google Scholar] [CrossRef]
2. Sayadi, A. A., Rahman, A. B. A., Jumaat, M. Z. B., Alengaram, U. J., Ahmad, S. (2014). The relationship between interlocking mechanism and bond strength in elastic and inelastic segment of splice sleeve. Construction and Building Materials, 55(31), 227–237. DOI 10.1016/j.conbuildmat.2014.01.020. [Google Scholar] [CrossRef]
3. Wu, X. B., Lin, F., Wang, T. (2013). Experimental study on the influence of age and type of steel bar on the mechanical performance of reinforced sleeve grouting connection. Building Structure, 43(14), 77–82 (in Chinese). [Google Scholar]
4. Alias, A., Zubir, M. A., Shahid, K. A., Rahman, A. B. A. (2013). Structural performance of grouted sleeve connectors with and without transverse reinforcement for precast concrete structure. Procedia Engineering, 53(7), 116–123. DOI 10.1016/j.proeng.2013.02.017. [Google Scholar] [CrossRef]
5. Ling, J. H., Rahman, A. B. A., Ibrahim, I. S., Hamid, Z. A. (2016). Tensile capacity of grouted splice sleeves. Engineering Structures, 111, 285–296. DOI 10.1016/j.engstruct.2015.12.023. [Google Scholar] [CrossRef]
6. Henin, E., Morcous, G. (2015). Non-proprietary bar splice sleeve for precast concrete construction. Engineering Structures, 83, 154–162. DOI 10.1016/j.engstruct.2014.10.045. [Google Scholar] [CrossRef]
7. Moosavi, M., Jafari, A., Khosravi, A. (2005). Bond of cement grouted reinforcing bars under constant radial pressure. Cement and Concrete Composites, 27(1), 103–109. DOI 10.1016/j.cemconcomp.2003.12.002. [Google Scholar] [CrossRef]
8. Wu, T., Wang, S., Liu, Y. B., Zhang, B. (2019). Mechanical properties of reinforced sleeve grouting connector. Journal of Building Science and Engineering, 36(2), 21–29 (in Chinese). DOI 10.3969/j.issn.1673-2049.2019.02.004. [Google Scholar] [CrossRef]
9. Zhang, Z. D., Zhao, C. F., Ding, J. H., Wang, J. F. (2019). Design and numerical analysis of GFRP grouting sleeve with prefabricated structure. Journal of Hefei University of Technology (Natural Science Edition), 42(1), 81–87 (in Chinese). DOI 10.3969/j.issn.1003-5060.2019.01.015. [Google Scholar] [CrossRef]
10. Wang, R., Chen, J. W., Wang, N. (2019). Finite element analysis of grouting connection performance of reinforcement sleeve. Journal of North China University of Science and Technology (Natural Science Edition), 41(1), 47–56 (in Chinese). [Google Scholar]
11. Wu, L. W., Su, Y. P., Zhao, J. S. (2019). Experimental study on axial tensile behavior of steel tube sleeve grouting connection. Acta Architecturae Sinica, 40(2), 169–177 (in Chinese). DOI 10.14006/j.jzjgxb.2019.02.016. [Google Scholar] [CrossRef]
12. Yu, Q., Sun, J. Q., Yuan, W. H. (2018). Experiment on bond performance of ribbed steel bar and sleeve confined grouting material. Journal of Harbin Institute of Technology, 50(12), 98–106 (in Chinese). DOI 10.11918/j.issn.0367-6234.201711108. [Google Scholar] [CrossRef]
13. Yu, Q., Sun, J. Q., Xu, X. J., Fang, Y. Q. (2018). Seismic test of precast shear wall with reinforced sleeve grouting lap joint. Journal of Tongji University (Natural Science Edition), 46(10), 1348–1359+1373 (in Chinese). [Google Scholar]
14. Xu, C. S., Liu, H. T., Du, X. L. (2018). Experimental study on the performance of reinforced sleeve grouting connection under high stress and repeated tension and compression. Journal of Architectural Structure, 39 (12), 178–184+193 (in Chinese). DOI 10.14006/j.jzjgxb.2018.12.021. [Google Scholar] [CrossRef]
15. Liu, L. P., Zheng, X. Y., Li, J. T. (2018). Study on constitutive relation of semi grouted sleeve reinforcement connection in numerical simulation analysis of prefabricated structure. Special Structure, 35(4), 1–7 (in Chinese). DOI 10.3969/j.issn.1001-3598.2018.04.001. [Google Scholar] [CrossRef]
16. Kim, Y. M. (2000). A study of pipe splice sleeves for use in precast beam-column connections. Austin: University of Texas at Austin. [Google Scholar]
17. Wang, J. (2013). Experimental study on seismic performance of reinforced concrete columns connected by sleeve grout anchors. Xi'an: Xi'an University of Architecture and Technology (in Chinese). [Google Scholar]
18. Lu, Z., Wang, Z. X., Li, J. B., Huang, B. (2017). Studies on seismic performance of precast concrete columns with grouted splice sleeve. Applied Sciences, 7(6), 571–591. DOI 10.3390/app7060571. [Google Scholar] [CrossRef]
19. Zheng, Q. L. (2017). Research on the influence of grouting defects on the performance of sleeve joints and components. Beijing: China Academy of Building Research (in Chinese). [Google Scholar]
20. Soudki, K. A., Rizkalla, S. H., Diakivv, R. W. (1995). Horizontal connections for precast concrete shear walls subjected to cyclic deformations. PCI Journal, 40(5), 78–96. DOI 10.15554/pcij. [Google Scholar] [CrossRef]
21. Buddika, H., Wijeyewickrema, A. (2016). Seismic performance evaluation of posttensioned hybrid precast wall-frame buildings and comparison with shear wall-frame buildings. ASCE Journal of Structural Engineering, 142(1), 1–14. DOI 10.1061/(ASCE)ST.1943-541X.0001466. [Google Scholar] [CrossRef]
22. Divan, M., Madhkhan, M. (2011). Determination of behavior coefficient of prefabricated concrete frame ith prefabricated shear walls. Procedia Engineering, 14(1), 3229–3236. DOI 10.1016/j.proeng.2011.07.408. [Google Scholar] [CrossRef]
23. Bournas, D., Negro, P., Molina, F., Viaccoz, B., Magonette, G. (2012). Pseudodynamic testing of the SAFECAST 3-storey precast concrete building. EU: EN Joint Research Centre-Institute for the Protection and Security of the Citizen. [Google Scholar]
24. Peng, A. Y. (2010). Experimental study on seismic behavior of precast reinforced concrete shear walls. Beijing: Tsinghua University. (in Chinese). [Google Scholar]
25. Guo, Z. H. (1999). Principle of reinforced concrete. Beijing: Tsinghua University Press (in Chinese). [Google Scholar]
26. CEB-FIP (1993). CEB-FIP model code 1990. London: T Telford. [Google Scholar]
27. JGJ/T 398-2019 (2019). Grouting sleeve for reinforcement connection. Beijing: China Standard Press (in Chinese). [Google Scholar]
28. JGJ/T 408-2019 (2019). Sleeve grouting material for reinforcement connection. Beijing: China Standard Press (in Chinese). [Google Scholar]
29. GB 50010-2010 (2011). Code for design of concrete structures. Beijing: China Construction Industry Press (in Chinese). [Google Scholar]
 | This work is licensed under a Creative Commons Attribution 4.0 International License, which permits unrestricted use, distribution, and reproduction in any medium, provided the original work is properly cited. |