| Computer Modeling in Engineering & Sciences |
DOI: 10.32604/cmes.2022.018527
ARTICLE
A Fluid-Structure Interaction Simulation of Coal and Gas Outbursts Based on the Interaction between the Gas Pressure and Deformation of a Coal-Rock Mass
1Merchants Chongqing Communications Research & Design Institute Co., Ltd., Chongqing, 400067, China
2National Engineering Laboratory for Highway Tunnel Construction Technology, Chongqing, 400067, China
3Sichuan Ya Kang Expressway Co., Ltd., Ya’an, 625000, China
4China Railway Construction Bridge Engineering Bureau Group 3rd Engineering Co., Shenyang, 110043, China
5School of Civil Engineering, Chongqing University, Chongqing, 400045, China
*Corresponding Authors: Lin Fang. Email: fanglin@cmhk.com; Chenhao He. Email: 18323003569@163.com
Received: 31 July 2021; Accepted: 10 September 2021
Abstract: Based on the theories of the gas seepage in coal seams and the deformation of the coal-rock medium, the gas seepage field in coal-rock mass is coupled with the deformation field of the coal-rock mass to establish a fluid-structure interaction model for the interaction between coal gas and coal-rock masses. The outburst process in coal-rock masses under the joint action of gas pressure and crustal stress is simulated using the material point method. The simulation results show the changes in gas pressure, velocity distribution, maximum principal stress distribution, and damage distribution during the process of the coal and gas outburst, as well as the movement and accumulation of coal-rock masses after the occurrence of the outburst. It was found that the gas pressure gradient was greatest at the working face after the occurrence of the outburst, the gas pressures and pressure gradients at each location within the coal seam gradually decreased with time, and the damage distribution was essentially the same as the minimum principal stress distribution. The simulation further revealed that the outburst first occurred in the middle of the tunnel excavation face and that the speed at which particles of coal mass were ejected was highest at the center and decreased toward the upper and lower sides. The study provides a scientific basis for enhancing our understanding of the mechanism behind coal and gas outbursts, as well as their prevention and control.
Keywords: Coal and gas outburst; fluid-structure interaction model; material point method; numerical simulation
The outburst of coal and gas is among the most serious coal mining accidents worldwide [1,2], and seriously jeopardizes the occupational safety of coal mine workers. Numerous researchers worldwide have achieved relatively rich results in the study of coal and gas outbursts[3–7], which has greatly advanced the research on gas-bearing coal rocks and their prevention and control mechanisms.
Current theories on the mechanism of coal and gas outburst mainly include the gas-driven action hypothesis, crustal-stress-driven action hypothesis, energy hypothesis, and combined action hypothesis[8–10]. In particular, the combined action hypothesis, which has gained the recognition of several researchers, posits that coal and gas outbursts result from the combined action of factors, such as the crustal stress, gas pressure contained within the coal mass, and physical and mechanical properties of coal. In recent years, on the basis of the combined action hypothesis, the fluid-structure interaction between the gas flow and coal seam deformation has gradually become a hot research topic. Based on the basic theory of solid deformation and gas seepage, Zhao[11] proposed a coupled gas-medium mathematical model and provided its numerical solution. Xu etal.[12] considered the heterogeneity in the mechanical properties of coal-rock material and the nonlinear nature of variations in gas permeability during its deformation and rupture to establish a mathematical model for the fluid-structure interaction during the outburst process in gas-bearing coal-rocks, based on the basic theory of coal-rock mass deformation and gas seepage. Guo etal.[13] derived the dynamic parameter model for porosity and permeability based on the basic principles of fluid-structure interaction, established the coupled gas-solid model for the gas-bearing coal mass, and obtained the numerical solution of the coupled model under natural unloading conditions using the finite element method. Cui etal.[14] used PFC software to construct a discrete element model for the equivalent strength of a coal mass after cracking under coupled action, analyzed the hinge relationship between the discrete particles after cracking under coupled action and its influence on the degree of caving, quantified the relationship between the amount of explosive used, water injection pressure, and extent of capability of coal mass caving, and then they validated their findings through engineering practice. Using their independently developed multi-field coupled large-scale simulation test system for coal mine dynamic disasters, Cheng etal.[15] studied the impact forces and motion characteristics of the ejected two-phase gas-solid flow during an outburst under different gas pressure conditions.
The material point method (MPM) is a numerical simulation method that leverages the strengths of both the Lagrangian and Eulerian descriptions by combining Lagrangian mass points with a Eulerian grid. This method has clear advantages in problems involving large deformation and material damage, such as impact, contact, and fluid-structure interaction[16]. In this study, the nonlinear nature of changes in permeability during the fracture of coal-rock masses was considered to establish a model based on the basic theories behind gas seepage and the deformation of coal-rock masses for the fluid-structure interaction between coal and gas during the outburst process. On this basis, the MPM was introduced to simulate the process of coal and gas outbursts and to analyze properties after the occurrence of outbursts, such as the accumulation of coal-rock masses, damage distribution, changes in gas pressure, velocity distribution, and maximum principal stresses, all of which are significant for the further understanding of the mechanism driving coal and gas outbursts, as well as the effective prevention of coal and gas outbursts.
2 Fluid-Structure Interaction Model for Gas-Bearing Coal Rocks
2.1 Equation for the Gas Seepage Field in Coal-Rock Masses
Based on the trends observed in empirical measurements of coal seam gas content, and considering the allowable error in practical engineering applications, Zhou etal.[5] first proposed a parabolic approximation for the coal seam gas content curve:
where X is the coal seam gas content (m3/t), A is the coal seam gas content coefficient
The usage of the above equation is quite convenient when studying coal seam gas flow and calculating coal seam gas content.
The flow of gas is in accordance with Darcy’s law:
where u is the gas flow rate (m/s), K is the permeability of the coal seam (m2), dp is the pressure difference over a distance of dx (Pa), dx is a certain very small distance in the direction of the gas flow (m), and
The gas equation of motion (consistent with linear permeability) for coal gas is
where q is the gas seepage velocity component (m/d),
According to the law of conservation of mass, the following equation holds for the flow field within a volume
As the flow of gas in a coal seam obeys Darcy’s law, the equation for the seepage field of gas flow in a coal rock body can be obtained by substituting Eqs.(1)–(3) into Eq.(4).
where
2.2 Equation for the Deformation Field of a Coal-Rock Mass
The equation for the deformation field of a coal-rock matrix under pore pressure consists of three parts: stress balance differential equation, geometric equation, and deformation constitutive equation.
The differential equation for the stress balance is expressed in terms of the effective stress as
where
The geometric equation is
where
For the isotropic coal-rock materials, the constitutive equation for elastic deformation can be expressed as
where G and
Combining these equations results in an equation for the deformation field of the coal-rock mass that consider the pore pressure, expressed in terms of the displacement:
2.3 Coupled Permeability-Damage Equation
When the stress state or strain state of a given mesoscopic unit in a coal-rock mass satisfies a certain pre-set damage threshold, the unit starts to become damaged, and the elastic modulus of the damaged unit is
where D is the damage variable and E and E0 are the modulus of elasticity of the damaged and undamaged unit, respectively.
The damage criterion used for the unit is the Mohr-Coulomb criterion. When the shear stress reaches the Mohr-Coulomb damage threshold, the damage variable D can be expressed as
where fcr is the uniaxial compressive residual strength and
The damage will cause a sharp increase in the permeability coefficient of the tested specimen. The change in the unit permeability coefficient can be described by the following equation:
where
When a unit of the coal-rock mass is subjected to tension, the functional relation between the permeability coefficient and the damage obeys a similar law. When the stress in the unit of coal mass reaches its tensile damage strength value, the damage variable can be expressed as follows:
The corresponding permeability coefficient of the unit is
where ftr is the tensile residual strength and
The MPM is a meshless particle method with a dual Eulerian and Lagrangian description. It discretizes the continuum body into a set of massive particles and creates a background grid in the region of matter motion. The particles contain all the information about the material, such as mass and velocity, and the momentum equations and the spatial derivatives are solved and evaluated at the nodes of the background grid. The MPM combines the advantages of both the Lagrangian and Eulerian methods, and it can prevent errors and increased computational effort that arise from mesh distortion and processing of the convective term. It is commonly used in research areas such as damage, crack propagation, and fluid-structure interaction[17–24]. The basic calculation process of the MPM is shown in Fig.1.
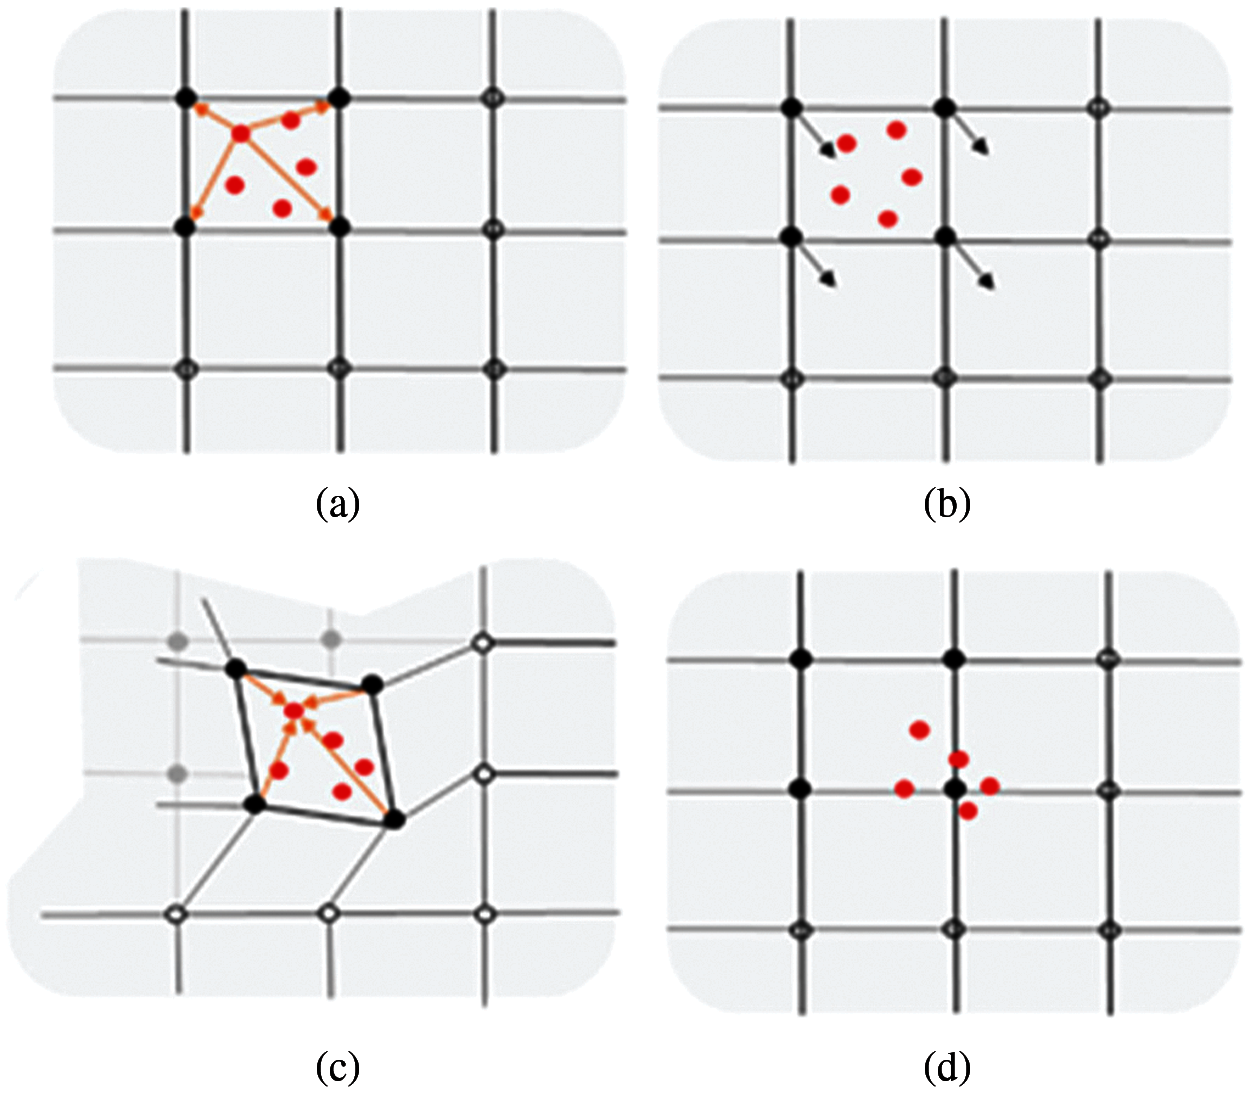
Figure 1: MPM basic calculation process. (a) Mapping material points information to grids (b) Solving the equilibrium equation (c) Map information back to particles (d) Update material points information
If heat exchange is not considered, the equations for the conservation of mass and the conservation of momentum for a continuum body in motion are as follows:
where
From this, the governing equation can be obtained as
where nj is the outward normal vector on the unit boundary,
The above momentum equation is a partial differential equation. As it is quite difficult to obtain a solution that satisfies it everywhere, the weighted residual method, for which a solution can be obtained, is applied to establish the equivalent integral weak form.
where
By discretizing the solution domain into a series of particles, with the mass of the object distributed over the particles and that of each particle concentrated at its center, the following equation can be obtained:
From this, Eq.(21) can be reduced to
where
In each time step, a Lagrangian description is used, and the particles are completely solidly connected to the grid-nodes. The information mapping between particles and grid-nodes is achieved with the help of nodal shape functions:
where a sub- or superscript g represents the variable values at each grid-node, ng is the total number of grid-nodes,
From this, Eq.(23) can be rewritten as
The matter point method explicit solution can update the stress at the beginning of the time step or at the end of the time step. In this study, the former was used as it has better energy conservation properties as follows:
(1) Map the particle information onto the grid-nodes to obtain the nodal mass mg with nodal momentum
(2) Obtain the nodal velocity
(3) Calculate the particle strain rate
(4) Update the particle stress
In the constitutive relationship of the large deformation problem, In order to ensure that the stress rate is not affected by the rotation of the rigid body, it needs to be converted into the Jaumann stress rate
Substituting Eq.(32) into Eq.(31), we can get:
(5) Update the nodal motion using Eq.(25).
(6) Map the nodal motion back onto the particle, thereby updating the particle motion.
(7) Repeat the calculation for the next time-step using the new grid.
In this study, we used the Drucker-Prager constitutive model for rock-like materials, with a specific yield function of
where I1 is the first invariant of the stress tensor and J2 is the second invariant of the deviatoric stress tensor.
The parameters
4 Validation of the Numerical Simulation
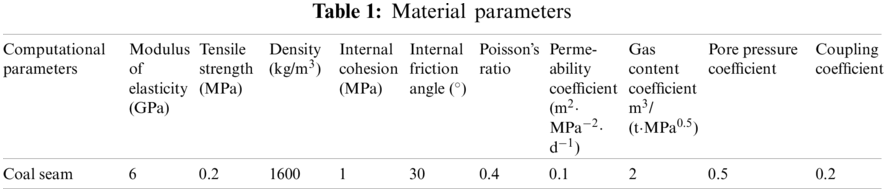
The numerical computation model is shown in Fig.1. The model is divided into two parts: the right side is the gas-bearing coal mass, while the left side is divided into three layers, with the excavated tunnel sandwiched between the hard top and bottom plates. During gas outburst, coal mass is ejected from the excavation face of the tunnel toward the tunnel. The model scale is as shown in Fig.2. To ensure the accuracy of the computation, 6000 particles and 3200 are used and a total of 1,500 steps were performed in the calculation process. The initial gas pressure in the coal seam gas is 3 MPa, and the gas pressure at the tunnel excavation face is 0.1 MPa. Gas can only be transported in the coal seam, the lower boundary is fixed, the right boundary prevents displacement in the X direction, and the crustal stress is 1.5 MPa. Other material parameters are shown in Table1.
Figure 2: Computational model
4.2 Numerical Simulation Results
Fig.3 shows the change in instantaneous pore gas pressure during coal and gas outburst. Initially, the gas pressure inside the coal seam is 3 MPa. After the outburst occurs, the pressure inside the coal seam is relieved, and the gas pressure drops at all points. Further, the atmospheric pressure inside the tunnel rises owing to the gas discharge into the tunnel. The maximum pore gas pressure inside the coal seam is distributed on the rightmost side. Fig.4 shows a plot of the pore gas pressure against the distance from the excavation working face during the coal and gas outburst process. It can be observed from the figure that, as the distance from the excavation working face decreases, the gas pressure gradually decreases; a more rapid decrease in gas pressure is observed closer to the working face; and, as time progresses, the gradient of gas pressure decline gradually decreases. This trend for the change in gas pressure is consistent with the results of Guo etal.[13].
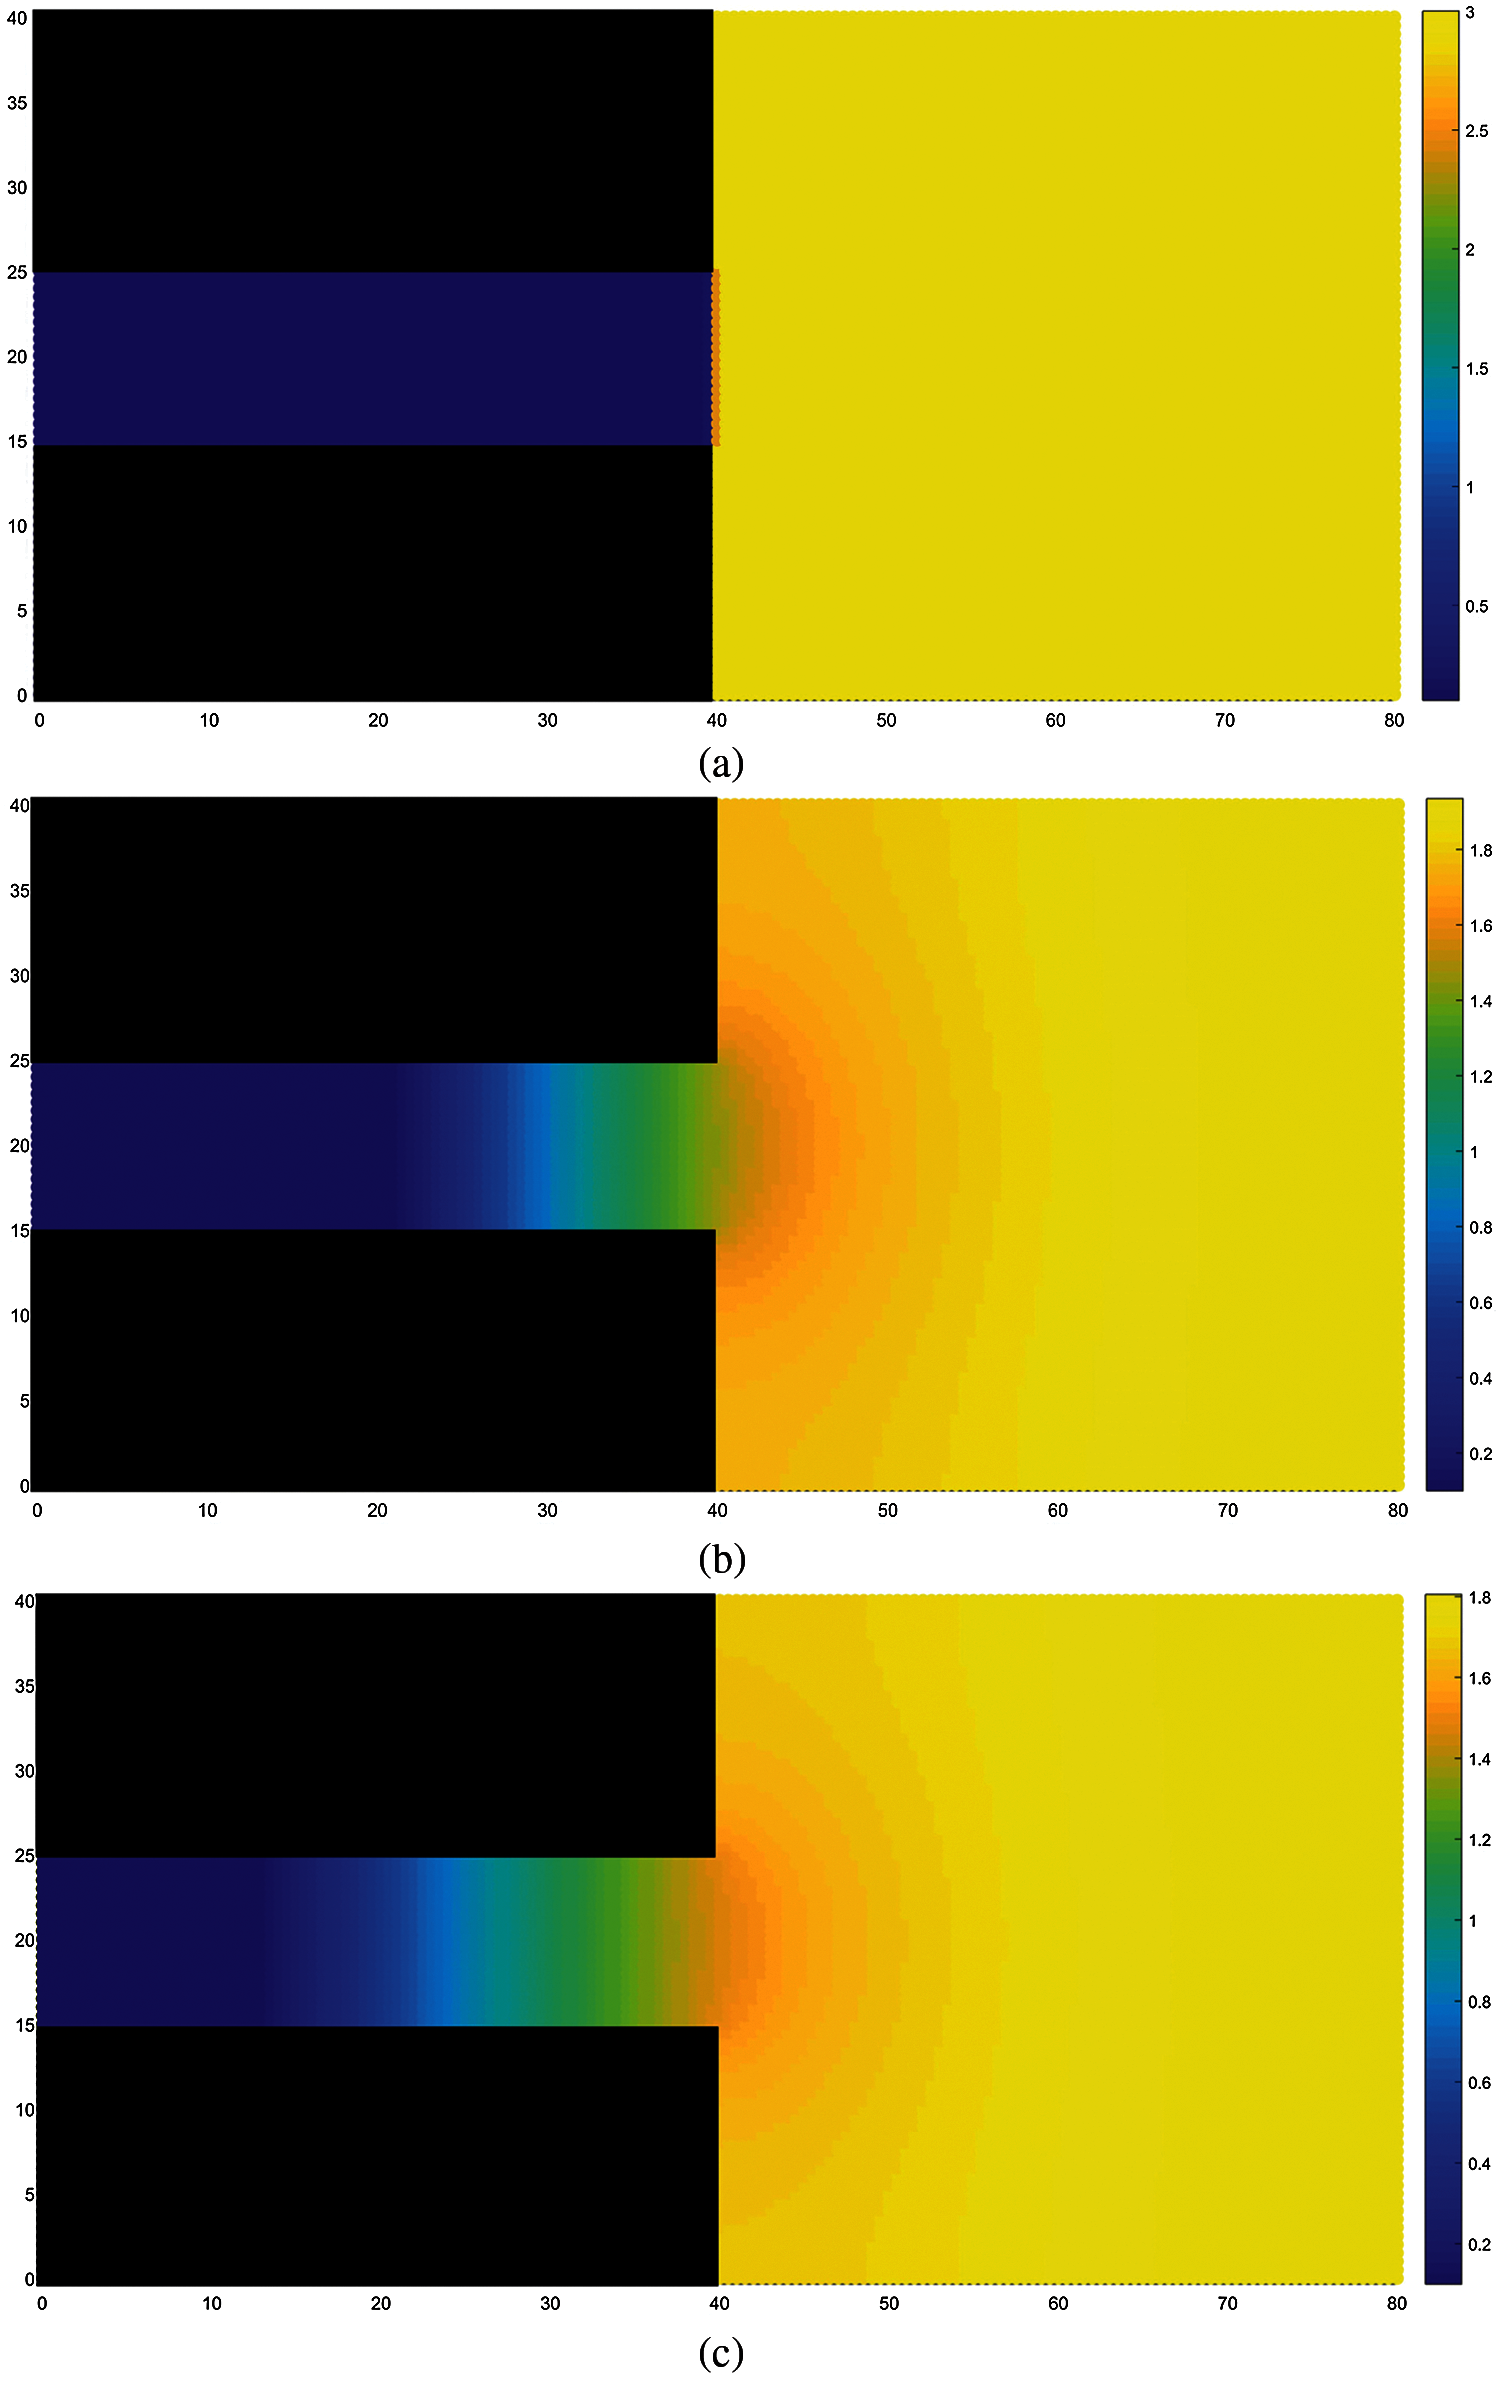
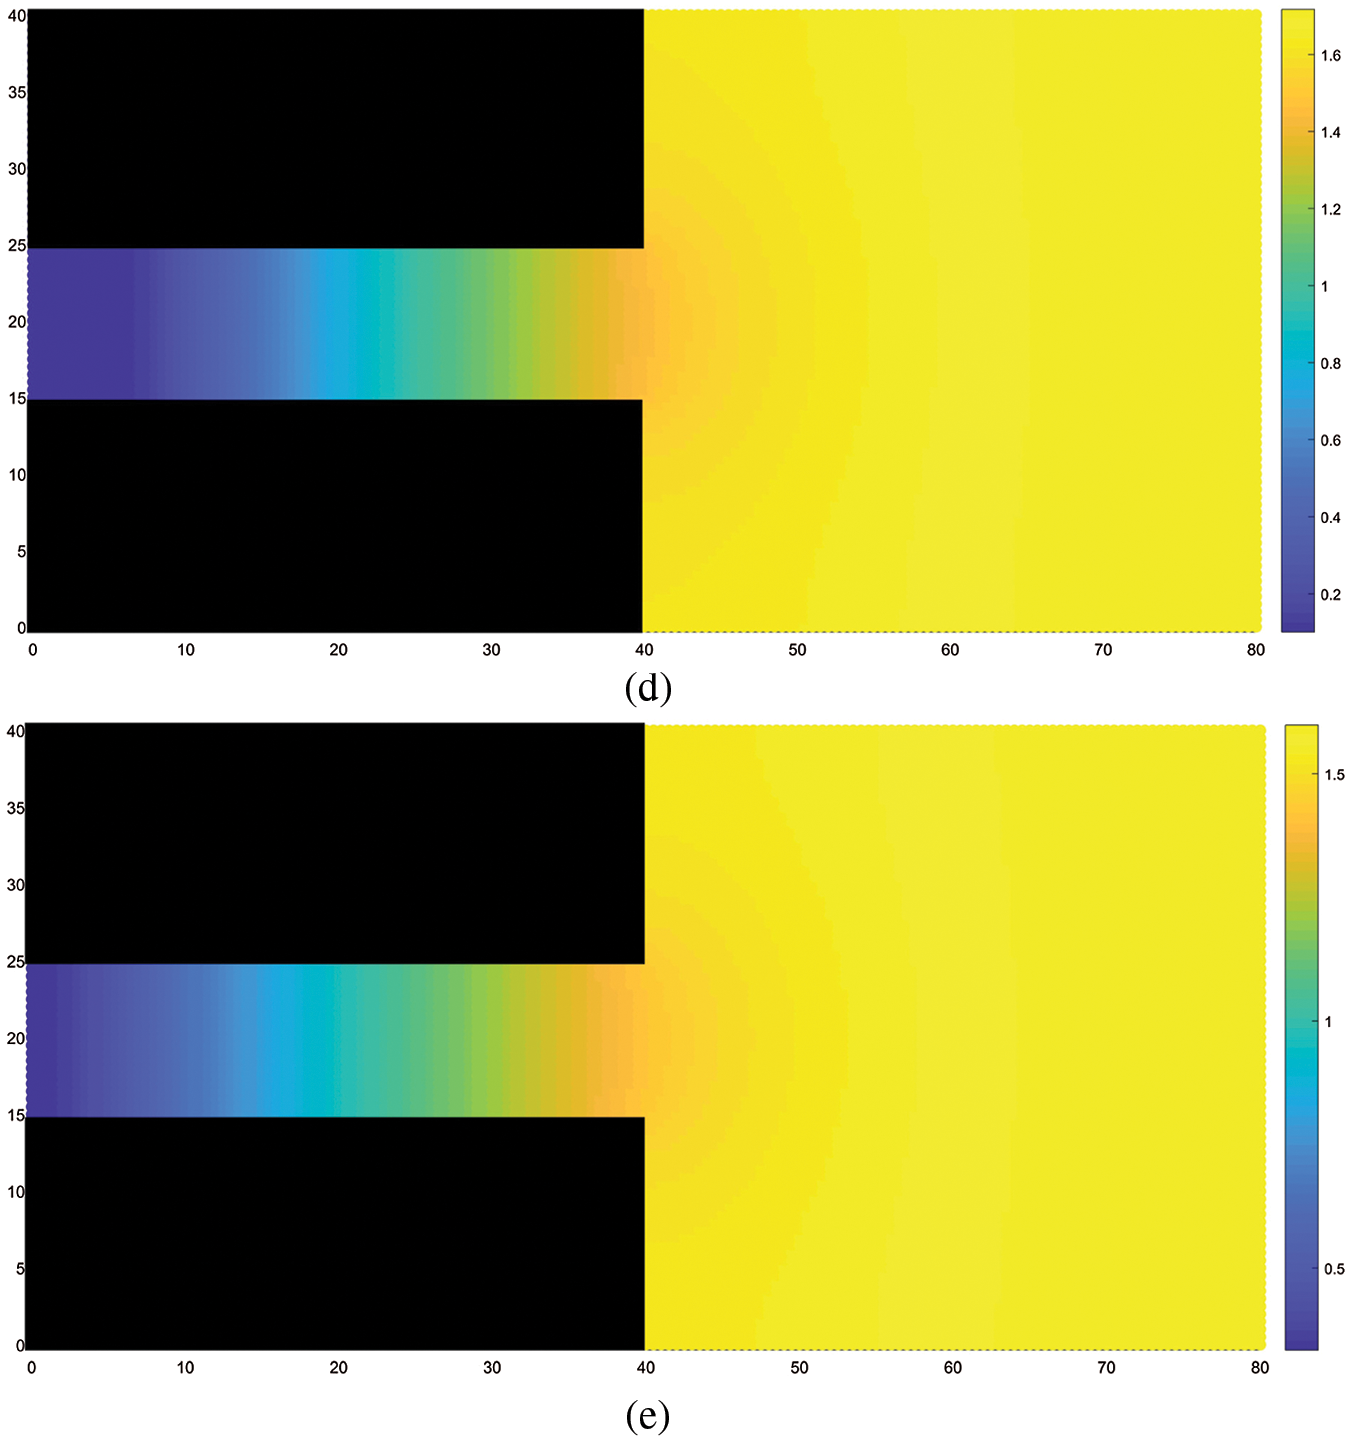
Figure 3: Variation in gas pressure, (a) STEP 1, (b) STEP 500, (c) STEP 1000, (d) STEP 1500, (e) STEP 2000
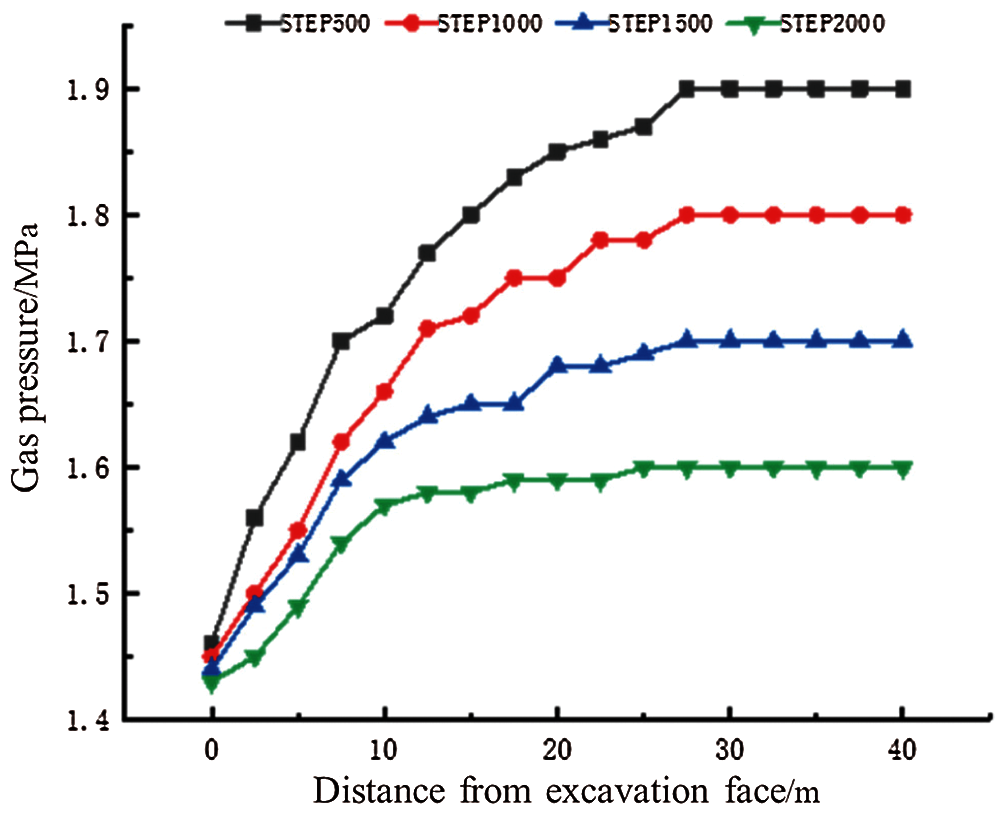
Figure 4: Plot of the variation in gas pressure
Figs.5 and 6 show the distribution of coal mass damage and the distribution of minimum principal stress during coal and gas outburst, respectively. It can be observed from the figures that the distribution of the damaged region essentially coincides with that of the region of minimum principal stress. The damage to the coal mass occurs under the combined action of external stress and gas pressure. Initially, the damage is primarily distributed around the tunnel excavation face and gradually expands in range to the interior of the coal seam as the coal and gas outburst process progresses. Evidently, when the outburst occurs, large quantities of coal particles are ejected under the action of pressure toward the excavated space and pile up in front of the excavation working face. The piling up of coal mass decreases with increasing distance from the working face, with coal particles being ejected as far as 20 m from the working face in the interior of the coal seam, owing to the large amounts of ejected coal masses, a large cavity with a small opening was formed near the excavation face. This phenomenon is consistent with the experimental results of Wang etal.[25].
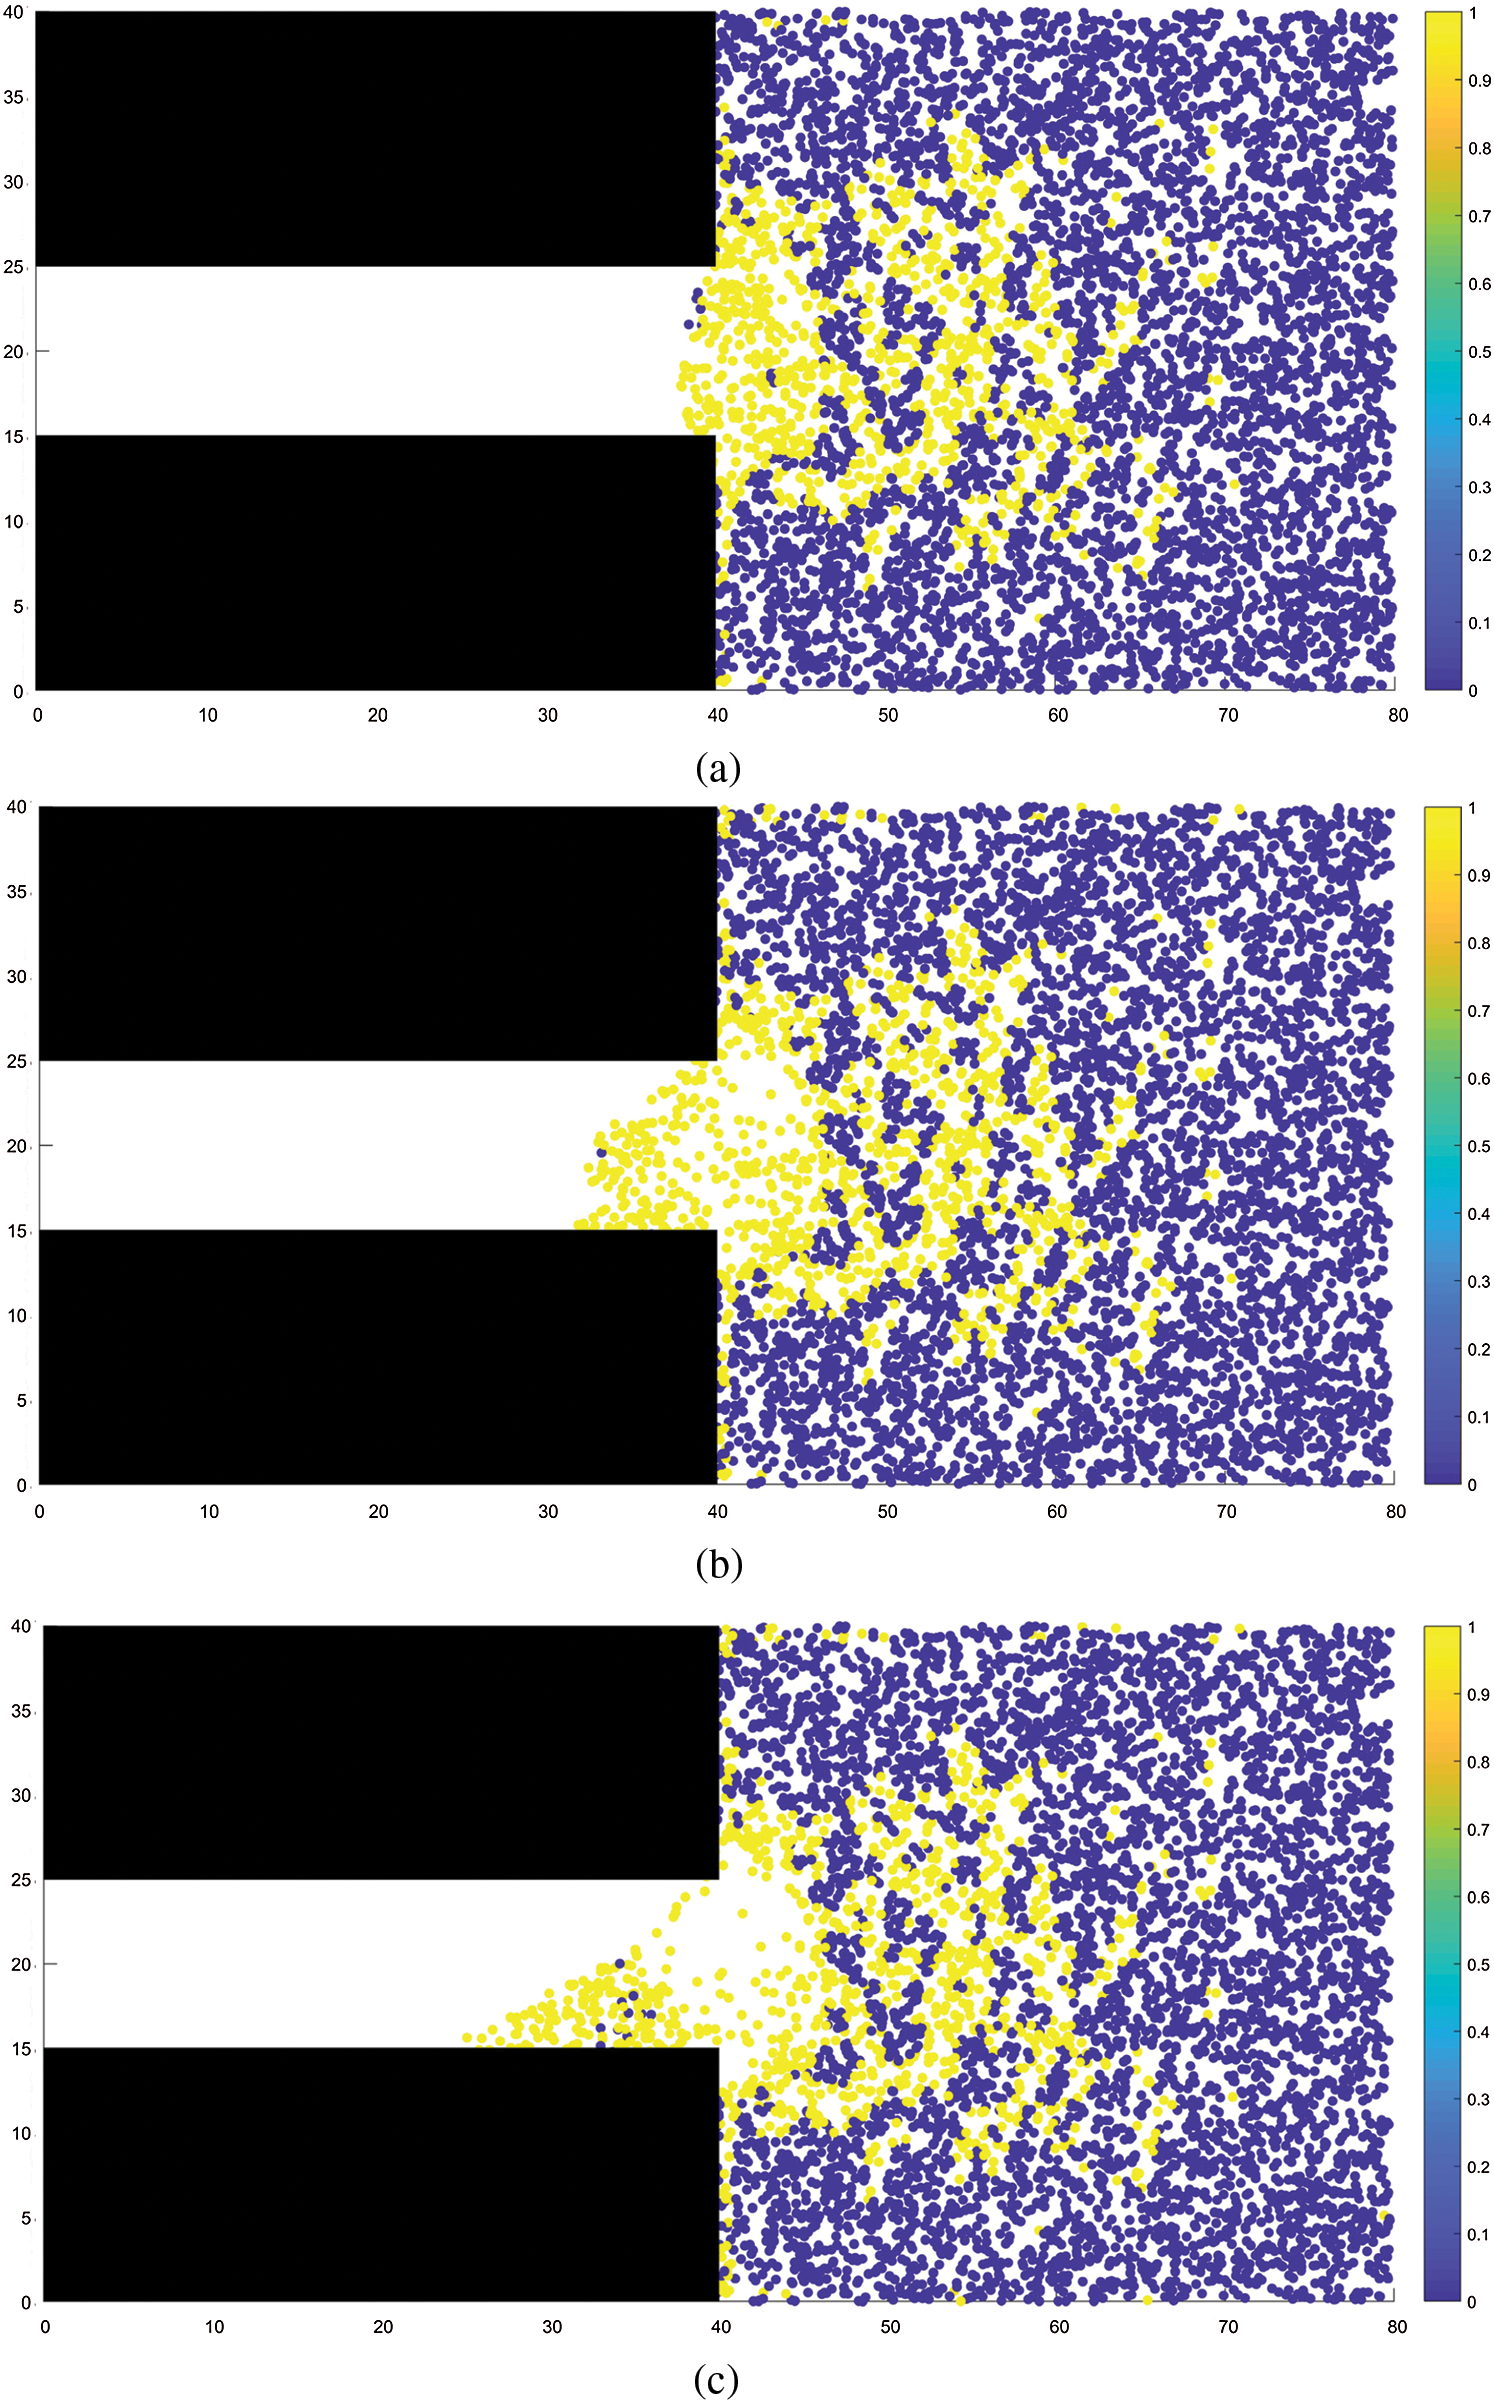
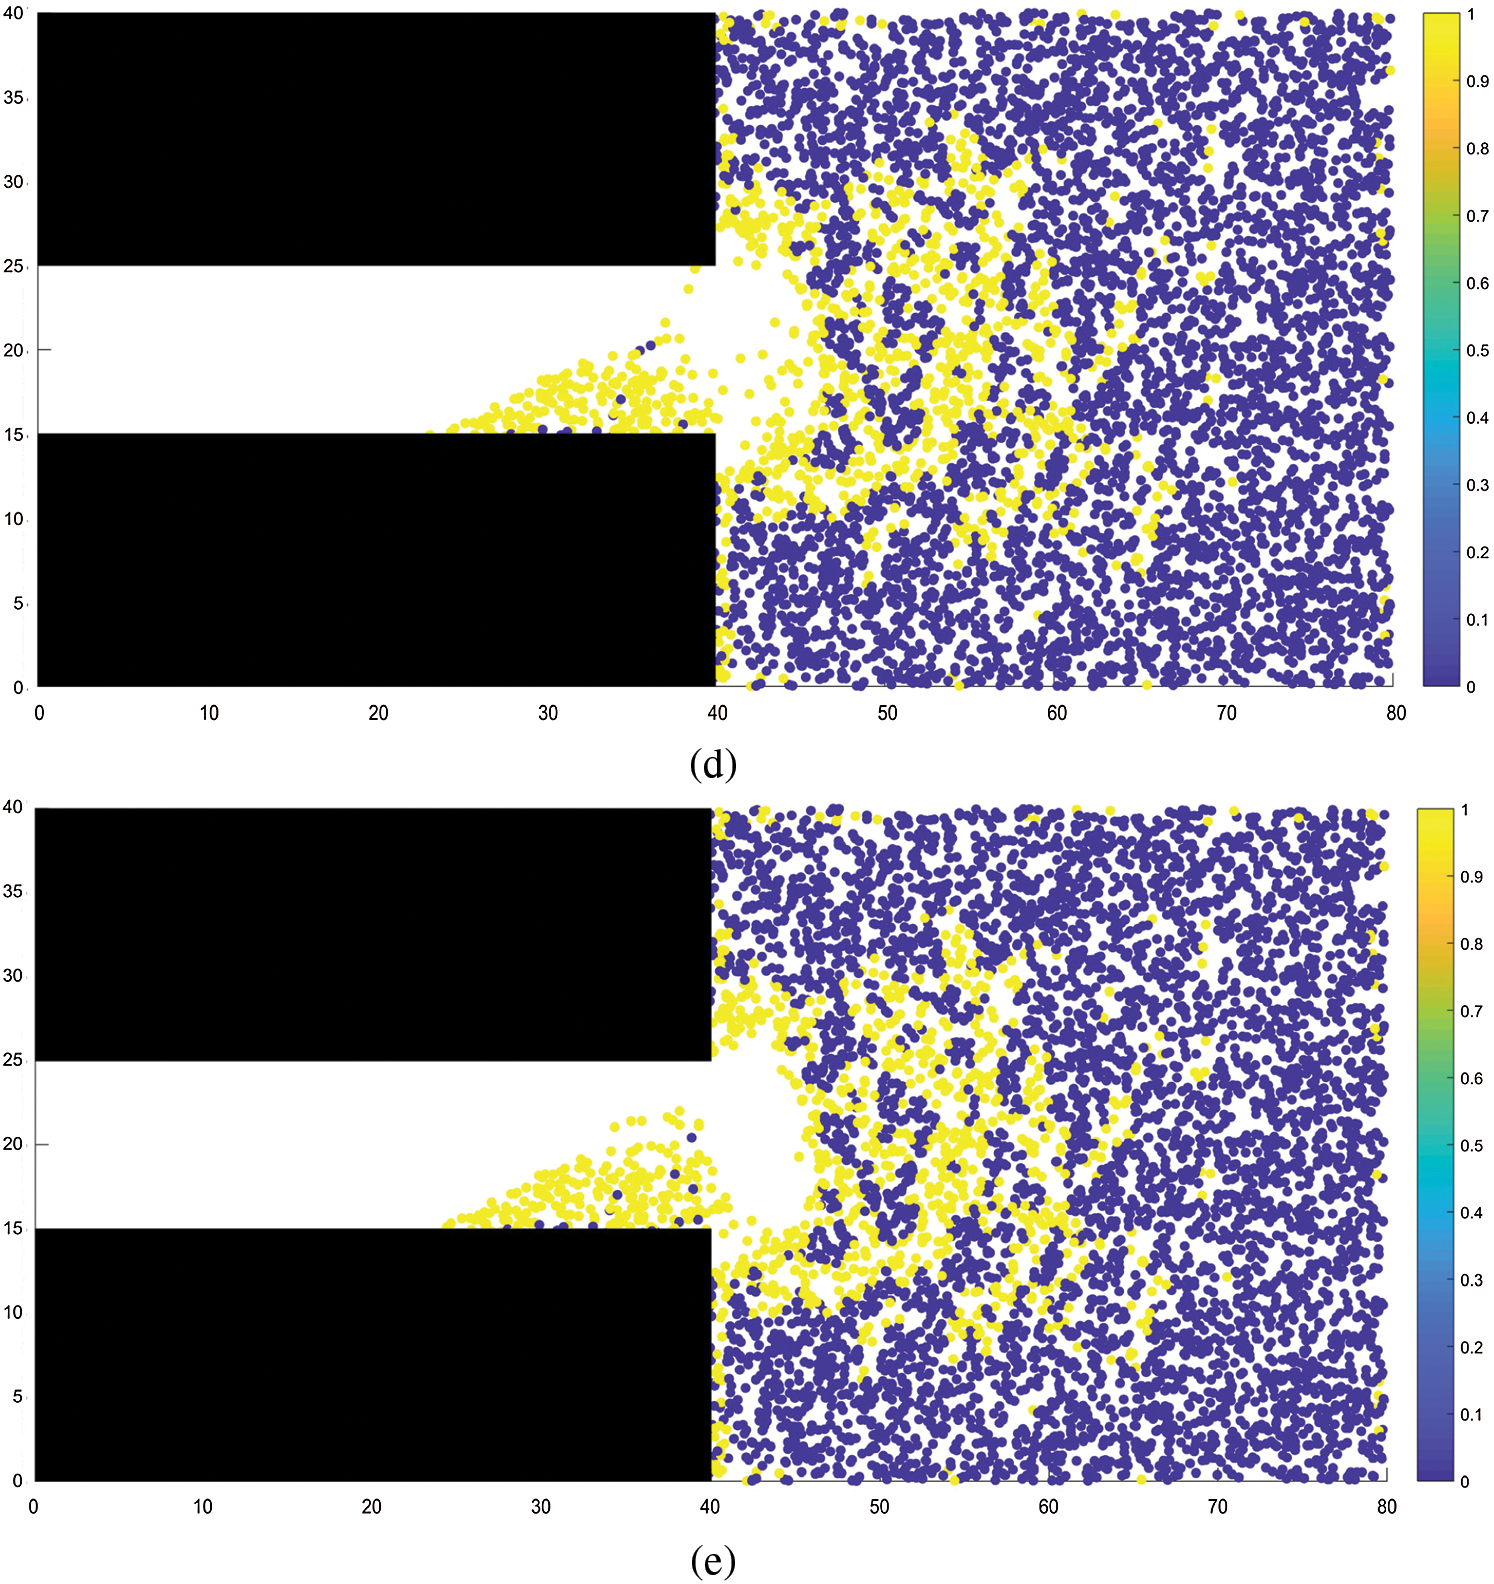
Figure 5: Distribution of damage in the coal-rock mass. (a) STEP 200, (b) STEP 400, (c) STEP 600, (d) STEP 800, (e) STEP 1500
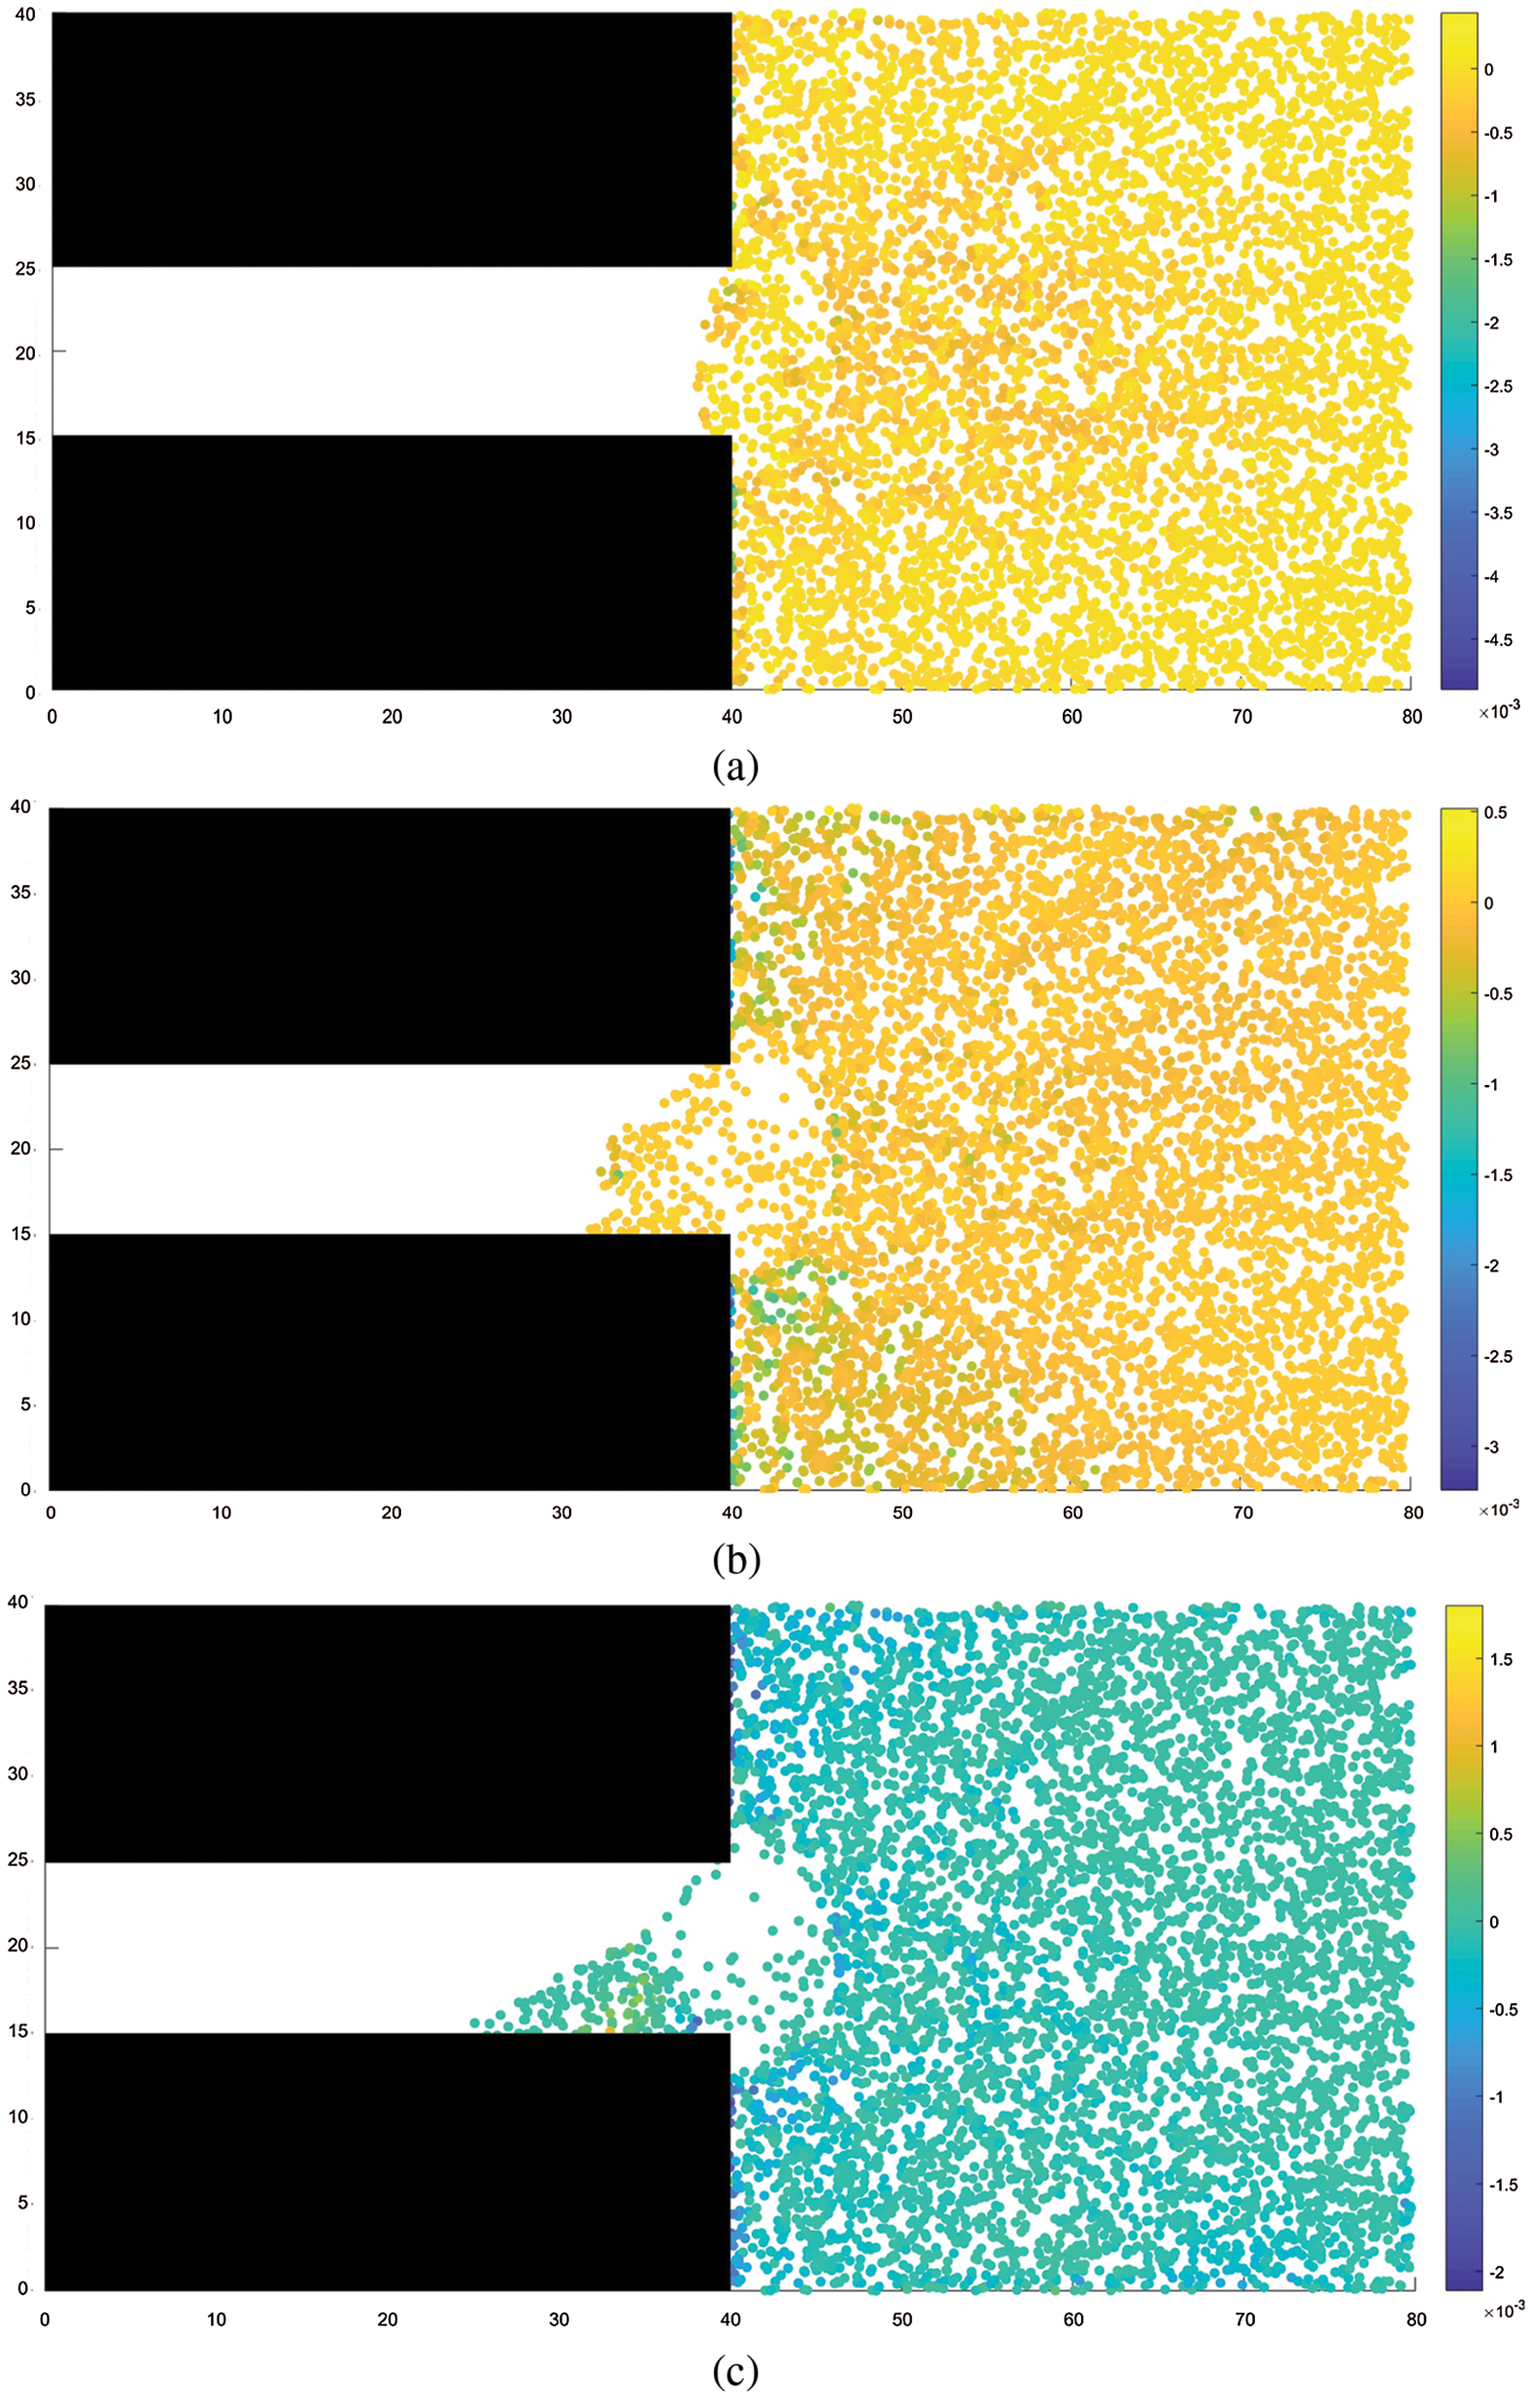
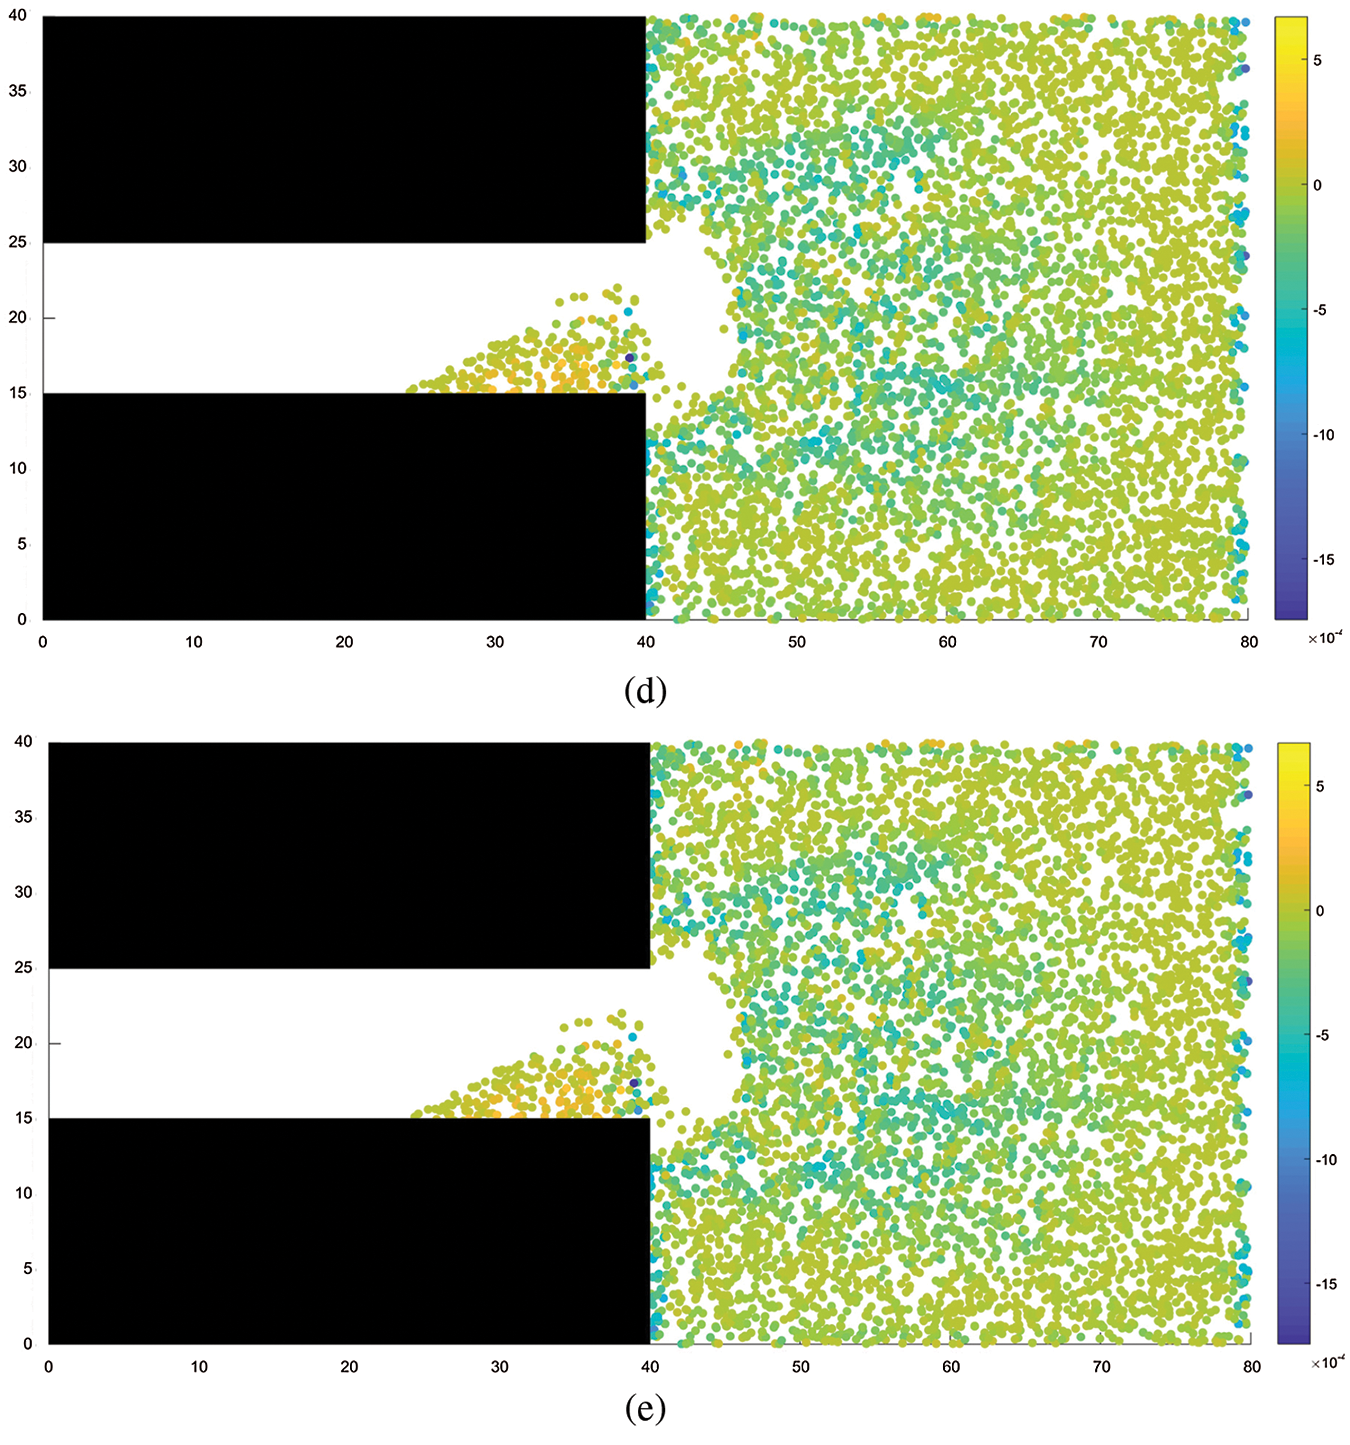
Figure 6: Minimum principal stress distribution. (a) STEP 200, (b) STEP 400, (c) STEP 600, (d) STEP 800, (e) STEP 1500
Fig.7 shows the particle velocity distribution during the coal and gas outburst process. As shown in the figure, the outburst first occurs at the center of the tunnel excavation face, where the velocity of ejected coal particles is the largest at 2.55 m/s. The velocity of the ejected coal decreases from the center toward both sides; the velocity of coal particles at the topmost portion of the excavation face is 1.94 m/s, and the velocity of coal particles at the bottommost portion is 1.95 m/s. During the outburst process, the velocity of coal particles continues to increase under the action of gas pressure up till the point when accumulation occurs, after which the velocity rapidly decreases to zero. Figs.8 and 9 show the variation in velocity and displacement with time during the ejection of different particles, respectively. In this case, Particle 1 is located in the upper part of the ejection site, Particle 2 is located in the middle part of the ejection site, and Particle3 is located in the lower part of the ejection site. From the graph, it can be observed that, when the outburst occurs, the velocity of the particles first continued to rise under the action of gas pressure, the middle and lower particles began to decelerate owing to friction after coming in contact with the bottom of the tunnel, while the upper particle continued to accelerate until it reached the ground, after which it began to decelerate. The final displacement was the farthest for the upper particle, followed by the middle particle, and finally the lower particle.
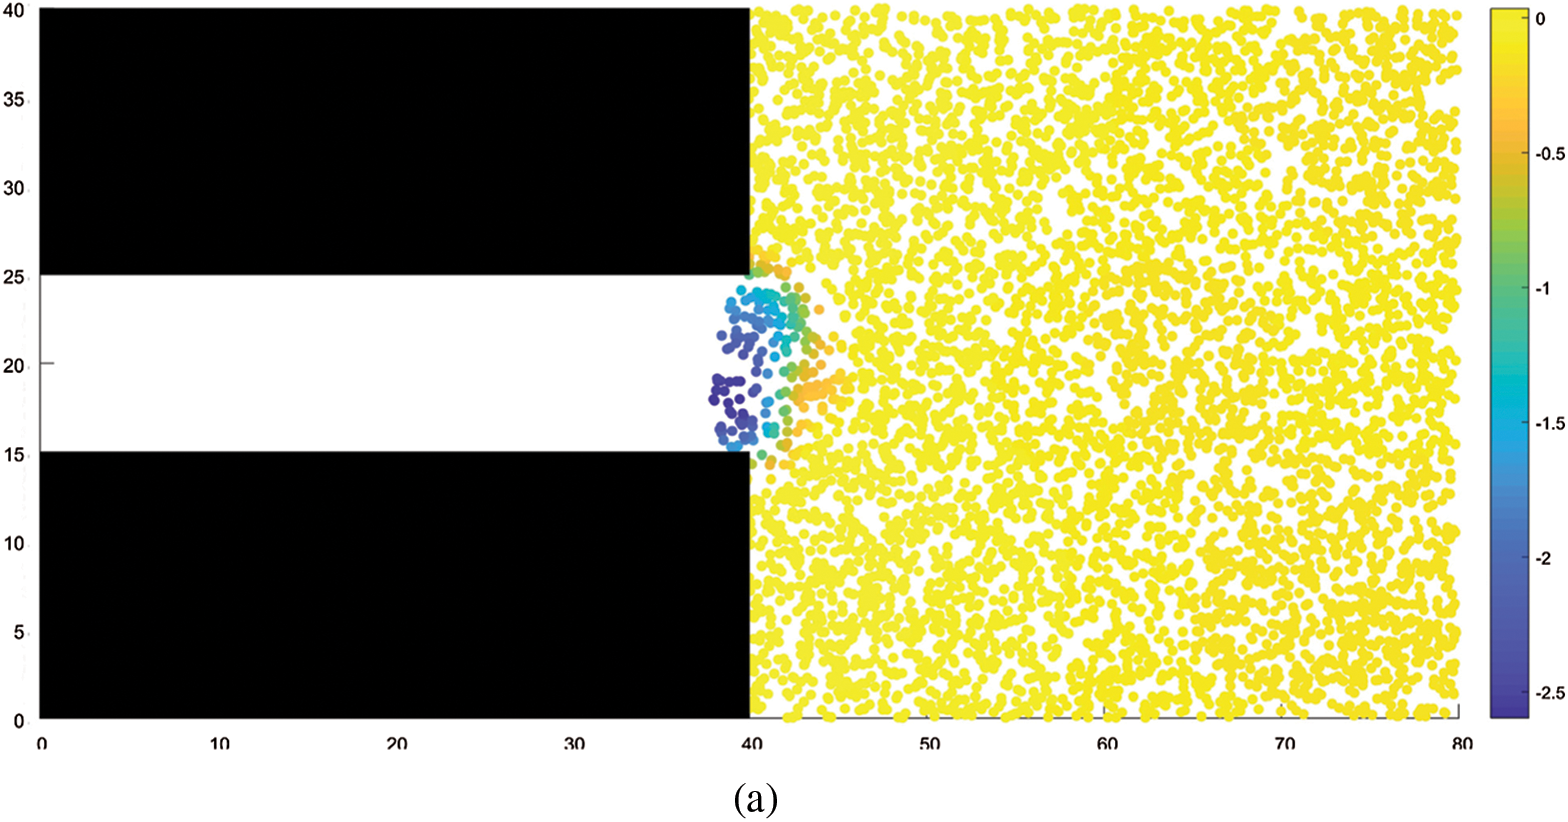
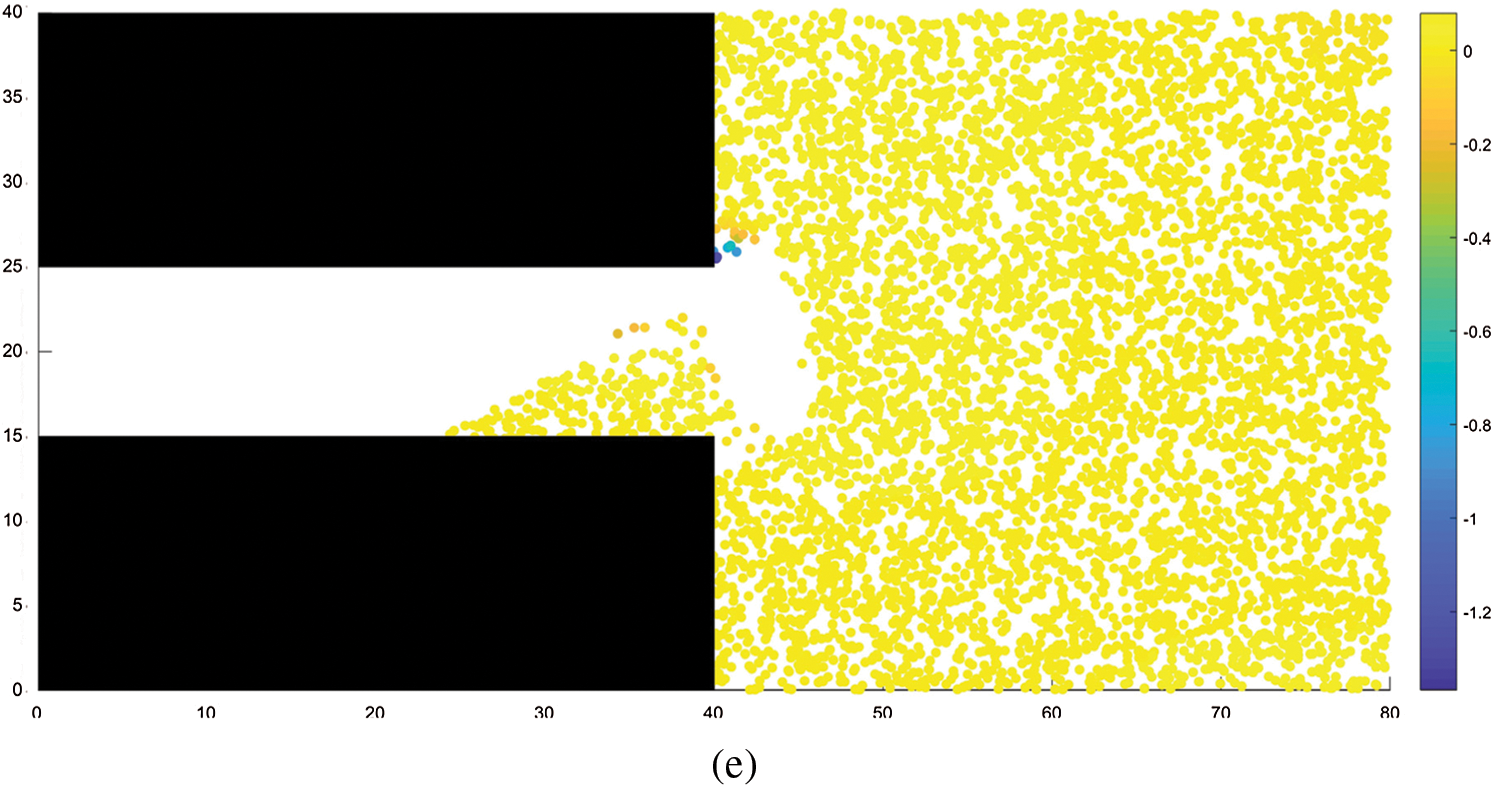
Figure 7: Velocity distribution. (a) STEP 200, (b) STEP 400, (c) STEP 600, (d) STEP 800, (e) STEP 1500

Figure 8: Plot of variation in particle velocity
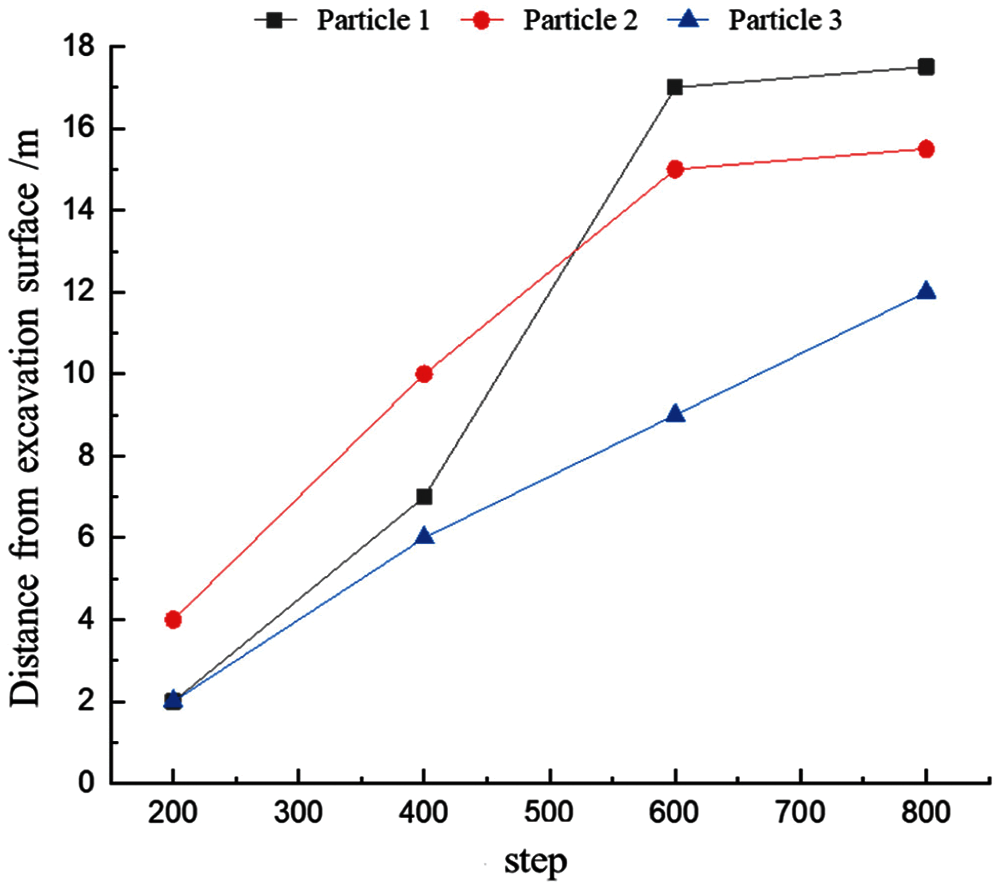
Figure 9: Plot of variation in particle displacement
The equation for the gas seepage field was established according to the basic law of gas transport in coal-rock masses. This, in combination with the deformation equation of a coal-rock mass and the coupled permeability-damage evolution equation, was used to establish the fluid-structure interaction model for the interaction between gas pressure and coal-rock mass deformation.
The MPM combines the advantages of both the Lagrangian and the Eulerian methods and has advantages in areas such as the simulation of fluid-structure interactions. It was used to simulate the coal and gas outburst process. The following is the summary of the simulation results:
(1) After the occurrence of the outburst, the gas pressure gradually decreases from the interior of the coal mass towards the excavation working face, and the gradient of the decrease in gas pressure is greater closer to the excavation face. As time proceeds, both the gradient of gas pressure decrease and the gas pressure at every point in the coal seam gradually decreases.
(2) After the occurrence of outburst, the area of the damaged region in the coal seam gradually expands, and the damaged region gradually extends from the excavation working face towards the interior of the coal seam. The distribution of the damaged region is essentially the same as that of the region of minimum principal stress.
(3) The outburst first occurs at the center of the tunnel excavation face, and the speed at which coal particles are ejected decreases from the center toward the upper and lower sides. The large amount of ejected coal mass accumulates in front of the tunnel and causes the formation of a cavity inside the coal seam.
Funding Statement: The article received China National Natural Science Found (41601574).
Conflicts of Interest: The authors declare that they have no conflicts of interest to report regarding the present study.
1. Li, X. J., Lin, B. Q. (2010). Status of research and analysis on coal and gas outburst mechanism. Coal Geology & Exploration, 38(1), 7–13. DOI 10.3969/j.issn.1001-1986.2010.01.002. [Google Scholar] [CrossRef]
2. Miao, X. X., Qianm, M. G. (2009). Research on green mining of coal resources in China: Current status and future prospects. Journal of Mining & Safety Engineering, 26(1), 1–14. DOI 10.3969/j.issn.1673-3363.2009.01.001. [Google Scholar] [CrossRef]
3. Litwiniszyn, J. (1985). A model for the initiation of coal-gas outbursts. International Journal of Rock Mechanics and Mining Sciences, 22(1), 39–46. DOI 10.1016/0148-9062(85)92592-6. [Google Scholar] [CrossRef]
4. Paterson, L. (1986). A model for outburst in coal. International Journal of Rock Mechanics and Mining Sciences, 23(4), 327–332. DOI 10.1016/0148-9062(86)90644-3. [Google Scholar] [CrossRef]
5. Ujihira, M., Higuchi, K., Nabeya, H. (1985). Scale model studies and theoretical considerations on the mechanism of coal and gas outbursts. Proceedings of the 21st International Conference of Safety in Mines Research Institutes, pp. 121–127. Sydney, Australia. [Google Scholar]
6. Paterson, L., Schlanger, H. P. (1985). Technical note–-A theoretical model for outbursting in coal mines. Bulletin of Proceedings Australasian Institute of Mining and Metallurgy, 9(7), 67–69. DOI 10.1016/0148-9062(86)90328-1. [Google Scholar] [CrossRef]
7. Fu, H., An, P., Chen, L., Cheng, G., Li, J. et al. (2021). Analysis of tunnel water inrush considering the influence of surrounding rock permeability coefficient by excavation disturbance and ground stress. Applied Sciences, 11(8), 3645. DOI 10.3390/app11083645. [Google Scholar] [CrossRef]
8. Karev, V. L. (1989). Theoretical model of gas filtration in gassy coal seams. Soviet Mining Science, 24(6), 528–536. DOI 10.1007/BF02498610. [Google Scholar] [CrossRef]
9. Li, H., Shi, S., Lin, B., Lu, J., Lu, Y. et al. (2019). A fully coupled electromagnetic, heat transfer and multiphase porous media model for microwave heating of coal. Fuel Processing Technology, 189, 49–61. DOI 10.1016/j.fuproc.2019.03.002. [Google Scholar] [CrossRef]
10. An, F., Cheng, Y. (2014). The effect of a tectonic stress field on coal and gas outbursts. Scientific World Journal, 2014(1), 1–10. DOI 10.1155/2014/813063. [Google Scholar] [CrossRef]
11. Zhao, Y. S. (1994). Coal-gas coupling mathematical model and numerical solution. Chinese Journal of Rock Mechanics and Engineering, 13(3), 229–239. DOI CNKI:SUN:YSLX.0.1994-03-004. [Google Scholar]
12. Xu, T., Tang, C. A., Song, L., Yang, H. (2005). Numerical simulation of coupled gas flow in failure process of gassy coal-rock. Chinese Journal of Rock Mechanics and Engineering, 10, 1667–1673. DOI 10.3321/j.issn:1000-6915.2005.10.006. [Google Scholar] [CrossRef]
13. Guo, P., Cao, S., Zhang, Z., Li, Y., Liu, Y. et al. (2012). Analysis of solid-gas coupling model and simulation of coal containing gas. Journal of China Coal Society, 37(S2), 330–335. DOI 10.13225/j.cnki.jccs.2012.s2.038. [Google Scholar] [CrossRef]
14. Cui, F., Lai, X. P., Cao, J., Shan, P. (2015). Intact loose medium equivalent transformation after coupled cracking and assessment of caving capability. Chinese Journal of Rock Mechanics and Engineering, 34(3), 565–571. DOI 10.13722/j.cnki.jrme.2015.03.014. [Google Scholar] [CrossRef]
15. Cheng, L., Xu, J., Zhou, B. (2020). The influence of different gas pressures on the propagation law of coal and gas outburst two-phase flow. Rock and Soil Mechanics, 8, 1–8. DOI 10.16285/j.rsm.2019.1811. [Google Scholar] [CrossRef]
16. Zhang, X. (2013). Material point method. Beijing: Tsinghua University Press. [Google Scholar]
17. Bardenhagen, S. G., Nairn, J. A., Lu, H. (2011). Simulation of dynamic fracture with the material point method using a mixed J-integral and cohesive law approach. International Journal of Fracture, 170(1), 49–66. DOI 10.1007/s10704-011-9602-1. [Google Scholar] [CrossRef]
18. Kakouris, E. G., Triantafyllou, S. P. (2018). Material point method for crack propagation in anisotropic media, a phase field approach. Archive of Applied Mechanics, 88(1–2), 287–316. DOI 10.1007/s00419-017-1272-7. [Google Scholar] [CrossRef]
19. Andersen, S., Andersen, L. (2010). Modelling of landslides with the material-point method. Computational Geosciences, 14(1), 137–147. DOI 10.1007/s10596-009-9137-y. [Google Scholar] [CrossRef]
20. York, A. R., Sulsky, D., Schreyer, H. L. (2000). Fluid-membrane interaction based on the material point method. International Journal for Numerical Methods in Engineering, 48(6), 901–924. DOI 10.1002/(ISSN)1097-0207. [Google Scholar] [CrossRef]
21. Gilmanov, A., Acharya, S. (2008). A hybrid immersed boundary and material point method for simulating 3D fluid-structure interaction problems. International Journal for Numerical Methods in Fluids, 56(12), 2151–2177. DOI 10.1002/(ISSN)1097-0363. [Google Scholar] [CrossRef]
22. Hamad, F., Wigckowski, Z., Moormann, C. (2017). Interaction of fluid-solid-geomembrane by the material point method. Computers and Geotechnics, 81(5), 112–124. DOI 10.1016/j.compgeo.2016.07.014. [Google Scholar] [CrossRef]
23. Yang, T., Yang, Y. S., Qiu, L. C. (2018). MPM based numerical simulation of large deformation process of soil flow. Journal of Engineering Geology, 26(6), 1463–1472. DOI 10.13544/j.cnki.jeg.2017-453. [Google Scholar] [CrossRef]
24. Wang, S., Li, X. C., Shi, L. (2016). Material point strength reduction method and its application slope engineering. Rock and Soil Mechanics, 37(9), 2672–2678. DOI 10.16285/j.rsm.2016.09.032. [Google Scholar] [CrossRef]
25. Wang, W. Z., Tao, Y. Q., Xu, J. (2010). Simulation of coal and gas outburst with different gas pressure. Journal of Chongqing University, 33(3), 82–86. DOI 10.11835/j.issn.1000-582X.2010.03.015. [Google Scholar] [CrossRef]
 | This work is licensed under a Creative Commons Attribution 4.0 International License, which permits unrestricted use, distribution, and reproduction in any medium, provided the original work is properly cited. |