| Computer Modeling in Engineering & Sciences |
DOI: 10.32604/cmes.2022.018507
ARTICLE
A Discrete Numerical Study of the Effect of the Thickness and the Porosity of the Sand Cushion on the Impact Response Due to the Rockfall
1Sichuan Communication Surveying & Design Institute Co., Ltd., Chengdu, 610065, China
2Key Laboratory of Deep Underground Science and Engineering (Ministry of Education), College of Architecture and Environment, Sichuan University, Chengdu, 610065, China
3Institute of New Energy and Low-Carbon Technology, Sichuan University, Chengdu, 610065, China
4Institute of Science and Technology, China Three Gorges Corporation, Beijing, 100038, China
*Corresponding Authors: Peng Zhao. Email: scu_zhaopeng@163.com; Liangpu Li. Email: llp_scu@163.com
Received: 29 July 2021; Accepted: 23 September 2021
Abstract: The prevention and the reduction of the rockfall are the common measures of the prevention and the reduction of disasters. When the rock-shed resists the impact of the rockfall, the force that acts on the structure consists of the cushion dead load and the impact-induced load, of which the dynamic process of the propagation of the impact-induced load is complex. Therefore, we conducted a numerical study to investigate the impact of the rockfall. Considering the highly discrete characteristic of the sand, we developed a numerical model on the basis of the discrete element method (DEM). The numerical model, which simulation results were validated by the results of real-scale experiments, was used to investigate the dynamic response of the impact force of the rockfall and the transmission of the impact force under the different magnitude of the falling height and the different thickness of the sand cushion. The results of our study indicated that the cushion thickness had little effect on the impact of the rockfall, and the dense sand cushion generated higher impact force than did the loose sand cushion. Although the high thickness enhanced the buffer performance of the sand cushion, the additional force induced by the dead load of sand cushion was significant. Therefore, to determine the appropriate thickness of the sand cushion, we suggested designers consider the buffer performance and the dead load of the sand cushion. The analysis presented in this paper provided a practical estimation of the impact-induced force of the thick sand cushion.
Keywords: Rockfall; impact; DEM; sand cushion; thickness; porosity; impact force; bottom force
The topographical and the geological characteristics of western China are extremely complex. In the region, the earthquake, the extreme weather, and secondary disasters occur frequently. The rockfall is a common geological hazard, which occurs unexpectedly [1]. Regardless of the scale of the rockfall, the urgent attention is required to avoid casualties and the economic loss. Rock-sheds have been widely applied as protective structures [2]. According to the survey that was conducted by the Sichuan Communication Surveying & Design Institute on the rock-sheds and the open-cut tunnels that were built after the Wenchuan Earthquake, nearly 80% of the structural damage to the rock-sheds or the tunnels was induced by the rockfall [3,4]. Therefore, the ability of rock-shed to resist the impact of the rockfall needs to be deeply explored.
To improve the structural design, researchers have conducted a series of large-scale experiments, and discussed the effect of the structural type [5–7] and construction materials [2,8] on the impact resistance of structures. In addition to the structural design, the cushion filled on the slab also plays an important role on the impact resistance of structures. The properties of the cushion, such as the porosity, the thickness, the density, and the grain size, were investigated by laboratory or prototype experiments [2,4,9–12]. On the basis of the experiments, researchers obtained some sound achievements, which may be used to guide the rock-shed design.
The purpose of the cushion is to reduce the impact force of the rockfall and to protect the structure. During the impact, the impact force is transmitted through the cushion before acting on the structure. The transmitted force is directly related to the structural design. Hence, on the basis of experimental results, researchers discussed the transmitted force. For example, by real-scale impact experiments, Calvetti et al. [9,13] suggested that the stress distribution on the plate should be computed by considering the dynamic amplification effect. Lambert et al. [10] designed small-scale experiments and investigated the effect of the grain gradation and the boundary condition on the transmitted force. On the basis of a series of laboratory tests, Kawahara et al. [11] found that the earth pressure at the bottom of the soil increased with the soil density and decreased with the thickness of the soil. The propagation of the impact-induced force through the cushion is a highly complex dynamic process. Unlike continuous materials, the sand is a typical granular material. Because the impact-induced force is mainly transmitted through the contact between particles, the properties of the sand cushion, such as the porosity and the stiffness, are determined by the grain shape, the size, and the density of the sand. Hence, it is difficult to clearly define the propagation of the impact-induced force through the sand cushion. Although researchers have conducted laboratory and large-scale experiments to study the impact force of the rockfall, the researchers considered the limited working condition and limited influencing factors. Some conclusions that were obtained by the researches remain unaddressed. At present, there are several calculation methods to estimate the impact force of the rockfall, such as the algorithm of the Japan Road Association, the recommendations by the ASTRA of Switzerland, and the Specifications for Design of Highway Subgrades of China [14]. Unfortunately, the calculation methods are unable to estimate the transmitted force, which is the primary concern of designers.
In recent years, supported by the development of the numerical analysis, the numerical simulation is a good technical tool to study the impact force of the rockfall. On the basis of a reliable model, several factors may be considered in the numerical simulation study, and some results have been achieved. Ouyang et al. [15] simulated the transient dynamic procedure of the impact of the rockfall and discussed the effects of various lightweight damping materials on the reduction of the impact force. Bhatti [16] developed a numerical model to study the energy dissipating capacity of the different thickness and density of expanded polystyrene cushions. Yan et al. [17] presented a numerical approach to reveal the influence of the rock shape on the impact force. More aforementioned numerical methods incorporated the finite element method (FEM). Although the maximum impact force can be approximated by the FEM, it is difficult to simulate the second wave [18]. The FEM treats the sand as a continuous material. At present, there is no suitable constitutive model to describe the sand deformation behavior under the impact load. The sand cushion is composed of discrete particles. The discrete element method (DEM) is more appropriate than the FEM to simulate the sand cushion. Recently, researchers used the DEM to discuss the impact of the rockfall and the transmitted force [19]. Calvetti et al. [13] established a linear correlation between the impact force and the stress on the plate and described the dynamic amplification effect. Shen et al. [20] found that the shape of the rock block had little influence on the peak stress distribution on the bottom floor. The researches attempted to use the DEM to discuss the transmitted force; however, the researchers rarely consider the characteristics of the cushion in the model. Moreover, the estimation of the transmitted force is scarce.
To understand the impact response of the rockfall, especially the transmitted force, we conducted systematic numerical analysis. Firstly, we developed a three-dimensional DEM model in Particle Flow Code (PFC). Secondly, we validated the results of the numerical simulation by the results of real-scale experiments. On the basis of a reliable numerical model, we discussed the impact force and the transmitted force of the rockfall. The effects of the falling height, the thickness of the sand cushion, and the sand porosity were investigated. Finally, we explored the relationship between the cushion dead load and the impact-induced load of the thick sand cushion.
2 The DEM Method and the Validation of the Model
The DEM for the simulation of granular materials was proposed by Cundall et al. [21]. The translational and rotational motions of each granular particle are described by the Newton’s second law of motion as:
where m is the particle mass; x is the position of the particle centroid; F is the resultant force acting on the particle; g is the gravity acceleration vector; Mi is the resultant moment acting on the particle;
The interactions between particles can be calculated by the force-displacement law:
where Fn and Ft is the normal and tangential contact force; kn and kt is the normal and tangential contact stiffness; un is the overlapping distance between the two particles;
Compared to the deformation of a granular assembly, the particle deformation is very small. It is not necessary to calculate the particle deformation precisely to obtain a good approximation of the mechanical behaviour. Therefore, in PFC software, the particles are allowed to overlap one another at contact points. This overlapping behaviour takes the place of the particle deformation. The interactions between the particles are considered explicitly and the contact forces are defined as a function of the overlap. It should be noted, however, that these overlaps are small in relation to the particle sizes [21,22].
In the PFC software, the explicit finite difference method is used for the cyclic iterative solution. During every calculation cycle, the Newton’s second law of motion is applied to every particle and the force-displacement law is applied to every contact. Moreover, the positions of the particles and walls are updated constantly.
When developing a DEM model, the choice of the contact model is a key step. In this study, the linear model was employed to simulate the sand cushion, the contact between the sand cushion and the rockfall, and the contact between the sand cushion and the slab. In the PFC, the linear model consists of two parallel components, namely the linear component and the dashpot component. The linear component provides the linear elastic (no-tension) frictional behavior, and the dashpot component provides the viscous behavior (Fig. 1). Both components act on a vanishingly small area, thus, only transmit a force [22]. Further information on the linear model is available in the help document of the PFC3D software.
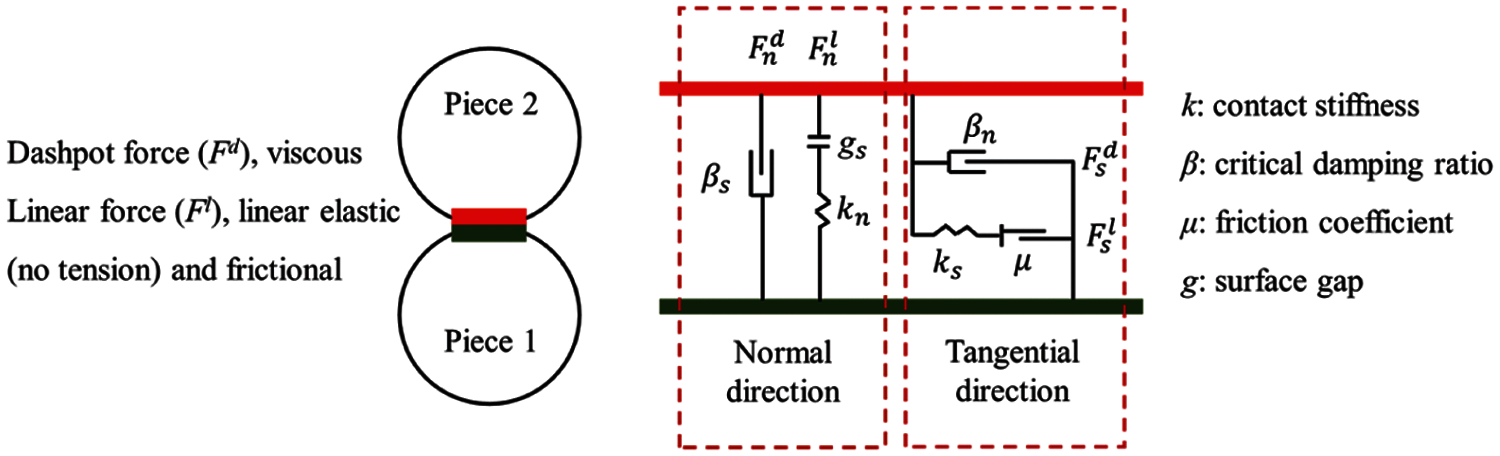
Figure 1: The behavioral and the rheological components of the linear model
Compared with continuum methods such as the FEM, the DEM simulates the actual mechanical properties of granular materials. There were three objects involved in the development of the DEM model to simulate the impact of the rockfall, namely, the rock block, the protective structure, and the sand cushion. The rock block was regarded as a rigid spherical body and was simulated by a “ball” element. The protective structure was simplified to a rigid slab and was represented by a “wall” element. The sand cushion was simulated by a large number of spherical particles. Therefore, the size of the spherical particles was a key parameter. The actual size of the sand grain was approximately 0.1 mm. However, it was unpractical to simulate the sand cushion with the particle size of 0.1 mm, especially in the actual engineering scale. Naito et al. [18] examined the effect of the particle size of the sand on the maximum impact force and defined K as the ratio of the diameter of the falling block to the maximum diameter of the sand particle. The results indicated that the larger particle size of the sand, the lower the impact force. Moreover, when the value of K was higher than 10, the value of the maximum impact force stabilized. Therefore, in the simulation of the sand cushion by the DEM model, we set the particle size of the sand to the higher value than the actual grain size of the sand.
The mechanical parameters that were used in DEM model were equally important. In continuum methods, a constitutive model is generally applied to describe the mechanical behavior of a material, and relevant parameters or curves are obtained through laboratory tests. However, the DEM model that was built in the PFC3D software was unable to directly embed macro constitutive models or mechanical parameters into the sand cushion model. Moreover, basic contact parameters (Fig. 1) are difficult to obtain from experimental results. Due to the complexity of the sand meso-structure and the limitation of the research, the researchers did not obtain a reliable mechanical theory to establish a quantitative relationship between meso parameters and macro parameters. Currently, the most common method to determine basic contact parameters is the transformation of the macroscopic mechanical properties of samples or large-scale experiments via trial-and-error approach [23].
2.2 The Validation of the Model
To ensure the reliability of the simulation method developed in this paper, we validated the DEM model and model parameters by a real-scale prototype experiment [9]. In the experiment, a spherical falling block with a diameter of 0.9 m and a mass of 850 kg was dropped on a sand stratum that covered a rigid concrete plate embedded into the ground. The sand was compacted to the thickness of 2 m. To investigate the effect of the falling height on the dynamic response of the structure, five falling heights were arranged and the impact position was maintained. After each impact test, the crater induced by the impact of the rockfall was replenished and compacted. Then, the influence of the previous impact test on the following test was neglected. The detail of the real-scale experiment is described in the relevant thesis [9].
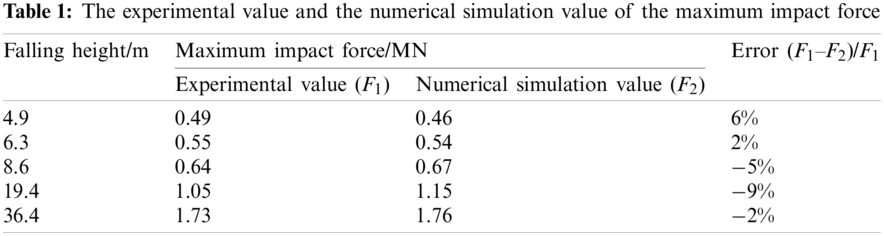
The above mentioned experiments employed the PFC3D software to simulate the impact of the rockfall. The three-dimensional numerical model is shown in Fig. 2. The radius of the particle ranged from 2–4 cm to ensure that the value of K was higher than 10. When the width of the sand cushion is four times the diameter of the falling block, the influence of lateral boundaries can be neglected [24]. In the DEM model, the width of the sand cushion was set to 5 m and the number of the element was set to 112,334. By repeatedly adjusting contact parameters (the effective modulus, the normal-to-shear stiffness ratio, and the friction coefficient) and the damp coefficient of the ball, we obtained a good agreement between simulation results and experimental results (Table 1 and Fig. 3). The simulation parameters that were used in the DEM model are listed in Table 2.
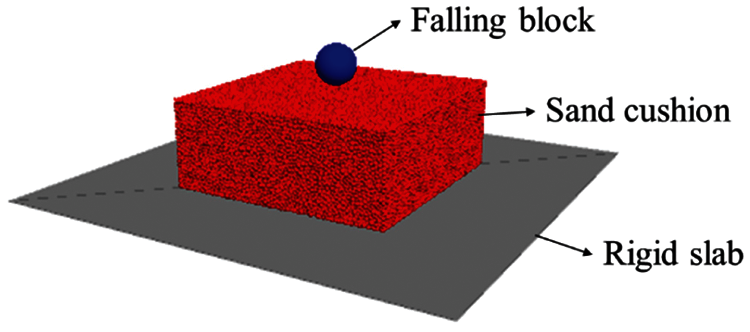
Figure 2: The numerical model of the impact of the rockfall
On the basis of the numerical simulations, we obtained the values of the maximum impact force under the five values of the falling height (Table 2). As shown in Table 2, simulation results are consistent with experimental results. The average error is 5% and the maximum error is below 10%. For example, the evolution of the impact force at the falling height of 36.4 m is shown in Fig. 3a. Herein, the impact force was defined as the force of the falling block that acted on the sand cushion. When the rigid block hits the sand cushion, the impact force quickly increases. Because the grain size of the model was higher than the actual grain size, the increase rate of the impact force that was obtained by experiments was higher than that obtained by the simulation. After the impact force reaches the maximum value, it gradually decreases to zero. At this stage, the two curves exhibit a similar characteristic. Fig. 3b shows the relationship between the penetration depth of the falling block and the falling height. In the real-scale experiment, the penetration depth was measured by the depth of the crater induced by the impact. Under the low impact energy (i.e., the low falling height), there is a small difference between the penetration depth obtained from the simulation and the experiments. When the falling height increases, the difference increases, and the maximum error was approximately 20% (by a few centimeters). The comparison of the penetration depth required a more accurate experimental measurement.
According to the above analysis, we obtained an acceptable agreement between simulation results and experimental results. Therefore, we concluded that the three-dimensional DEM model developed in this paper was reliable to simulate the impact process of the rockfall.
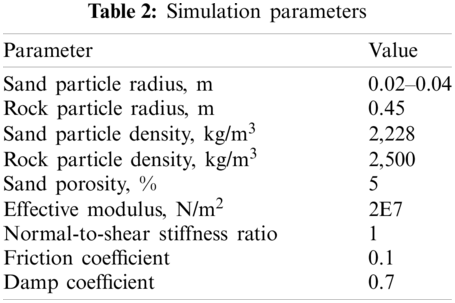
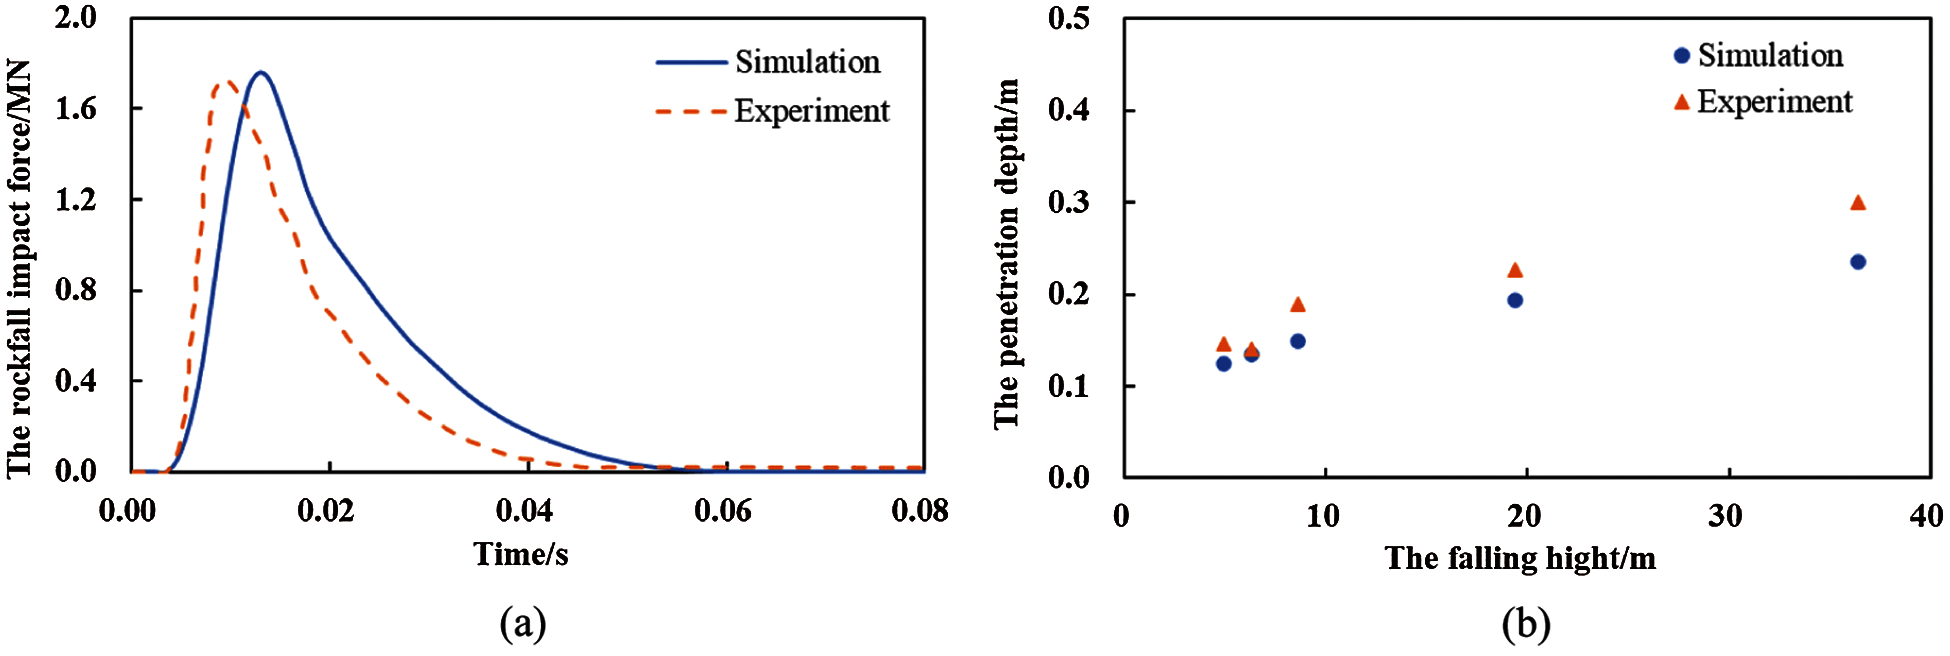
Figure 3: The numerical simulation results and the experiment results of: (a) the impact force of the rockfall at the falling height of 36.4 m; and (b) the penetration depth under the different falling height
3 Numerical Simulation Results
Analyzing numerical simulation results, we discussed the buffer performance of the sand cushion, the impact force of the rockfall, and the force that acted on the slab. The force that acted on the slab was a critical parameter for the design of the protective structure. Additionally, we discussed the effect of the properties of the sand cushion (the sand porosity and the cushion thickness) on the buffer performance of the sand cushion.
On the basis of the validation of simulation results by experimental results, we maintained the parameters related to the falling block and the sand cushion (except the thickness of the sand cushion) in the DEM model. To study the effect of the cushion thickness on the rockfall impact, we set the cushion thickness to 0.2, 0.4, 0.6, 0.8, 1.0, 1.5, 2.0 and 2.5 m, respectively. Moreover, we considered the different densities of the sand, which is described by the porosity of 0.05 (the dense sand), 0.2 (the medium sand) and 0.35 (the loose sand). The maximum and the minimum number of elements were 140,445 and 7,700, respectively. Twenty-four types of the sand cushion were simulated in this paper. The buffer performance of the sand cushion was tested under the five values of the falling height (10, 20, 30, 40 and 50 m). The analysis involved a total of 80 combinations of the operating conditions.
3.2 The Dynamic Process of the Impact of the Rockfall
Fig. 4a shows the variation in the impact force of the rockfall at the falling height of 50 m. As shown in Fig. 4a, once the falling block hits the sand cushion, the impact force increases quickly. After the impact force increases to the maximum value (Fig. 5a), the impact force gradually decreases until the two objects are separated from each other (Fig. 5b). The interval between the two stages was referred to as the impact time. The effect of the sand porosity (n) on the impact time is negligible. However, the thicker the sand cushion, the longer the impact time. In the first stage, the low sand porosity (n = 0.05) induces the increase rate of the impact force, of which the increase rate is independent of the cushion thickness. In the second stage, the impact force of the thin sand cushion is initially higher and then lower than the impact force of the thick sand cushion. The trend in variation of the impact force is exhibited by the dense and the loose sand cushion. During the impact, the force that acted on the rigid slab was defined as the cushion force, and the curves shown in Fig. 4b display the evolution of the cushion force. When the cushion thickness is similar, the sand porosity has little effect on the variation in the cushion force. Compared with the thin sand cushion, the thick sand cushion exhibits less variation in the cushion force. The maximum values of the impact force and the cushion force were the key issues that are discussed in the following sections.
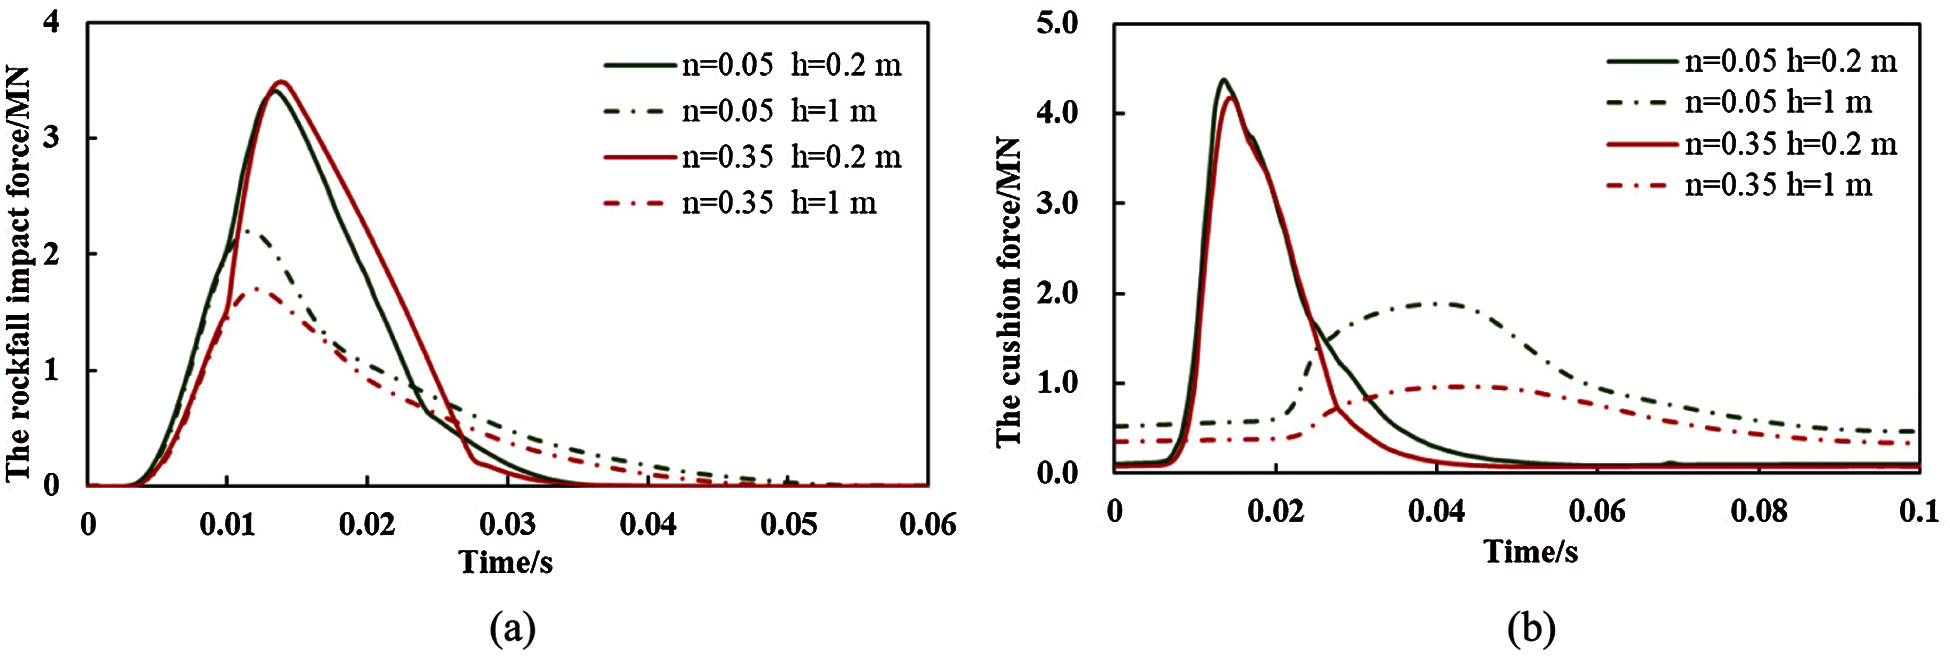
Figure 4: The evolution of (a) the impact force and (b) the cushion force
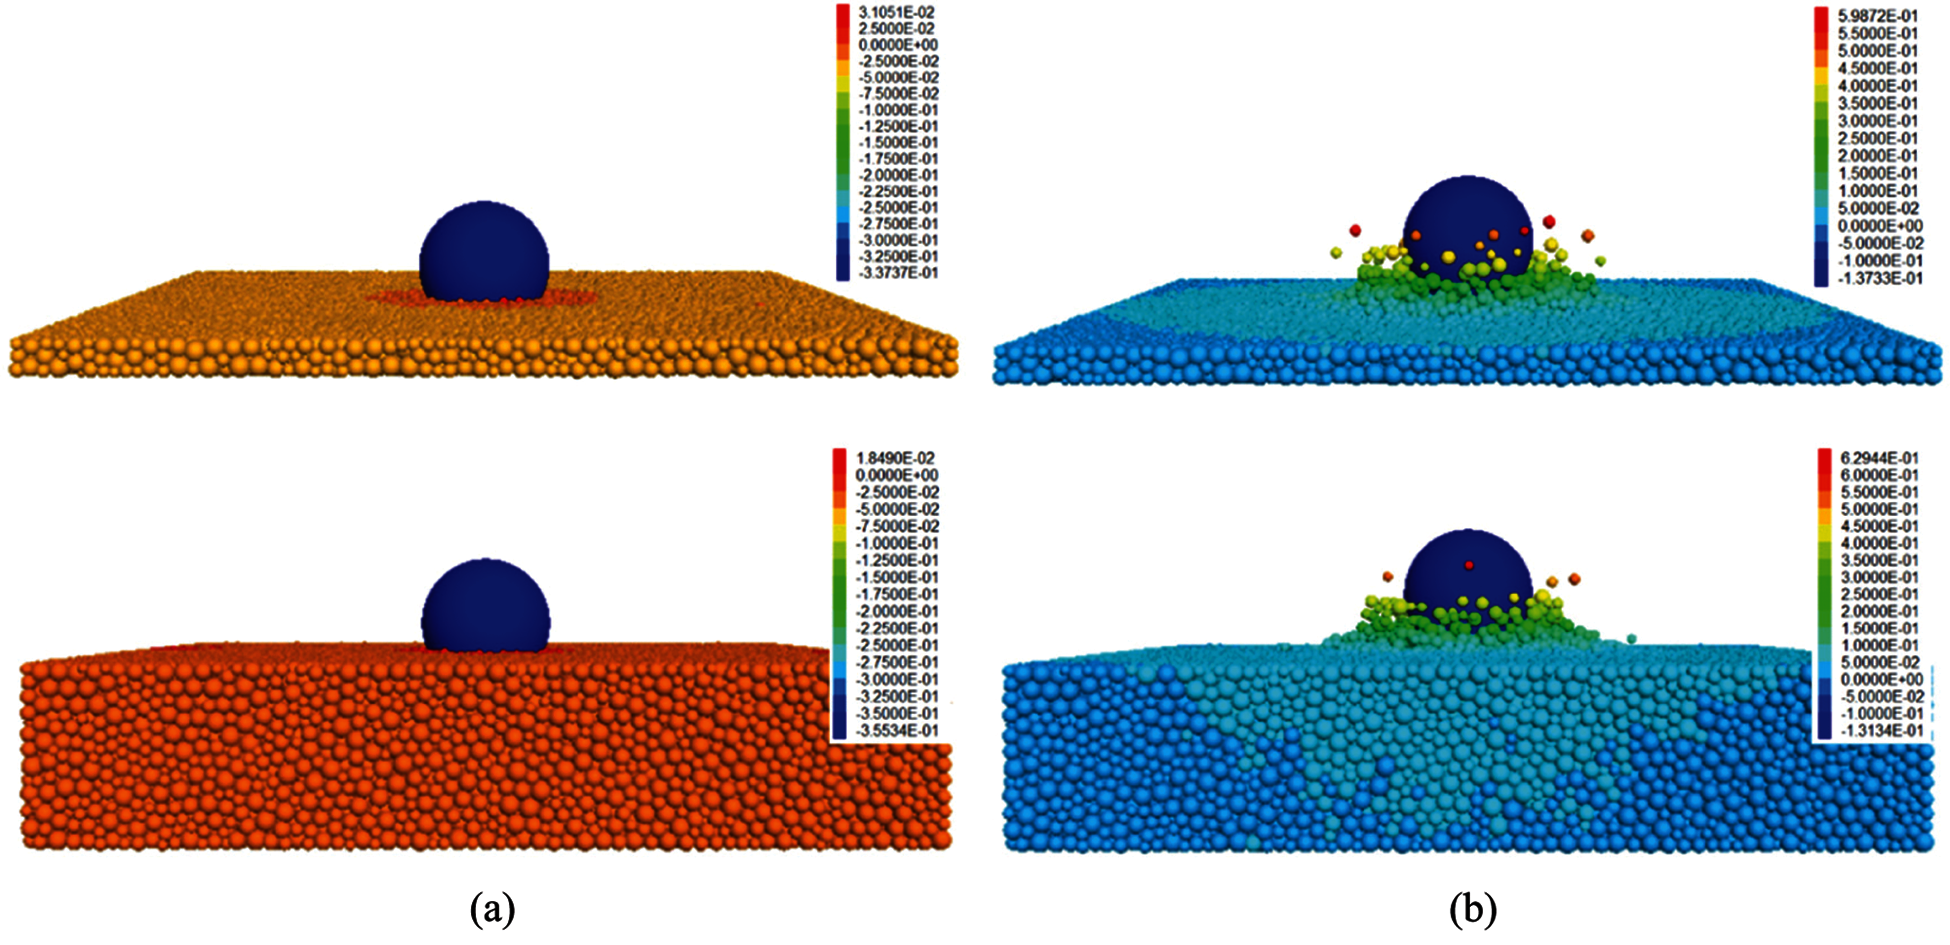
Figure 5: The dynamic impact process of (a) the decrease in the velocity of the falling block to zero and (b) the rebound of the falling block from the sand cushion. The color bars indicate the displacement of the balls
3.3 The Maximum Impact Force of the Rockfall
Fig. 6 shows the values of the maximum impact force (Fmax) under the different thickness of the sand cushion. The values of the Fmax of the sand cushion with the lowest thickness (h = 0.2 m) are very high. The increase in the cushion thickness to h = 0.4 m quickly decreases the Fmax due to increase the buffer performance of the sand cushion. However, the increase in the cushion thickness to h = 0.6 m has little effect on the Fmax of the sand cushion, especially at the range of the falling height value between 10 and 40 m. For the thick sand cushion (h > 0.6 m), the Fmax remains constant due to the negligible buffer performance of the sand cushion. Moreover, the dense sand cushion (Fig. 6a) and the loose sand cushion (Fig. 6b) express a similar trend in the variation of the Fmax. In the practical engineering, the cushion thickness is higher than 0.6 m. Thus, we considered that the Fmax was independent of the cushion thickness.
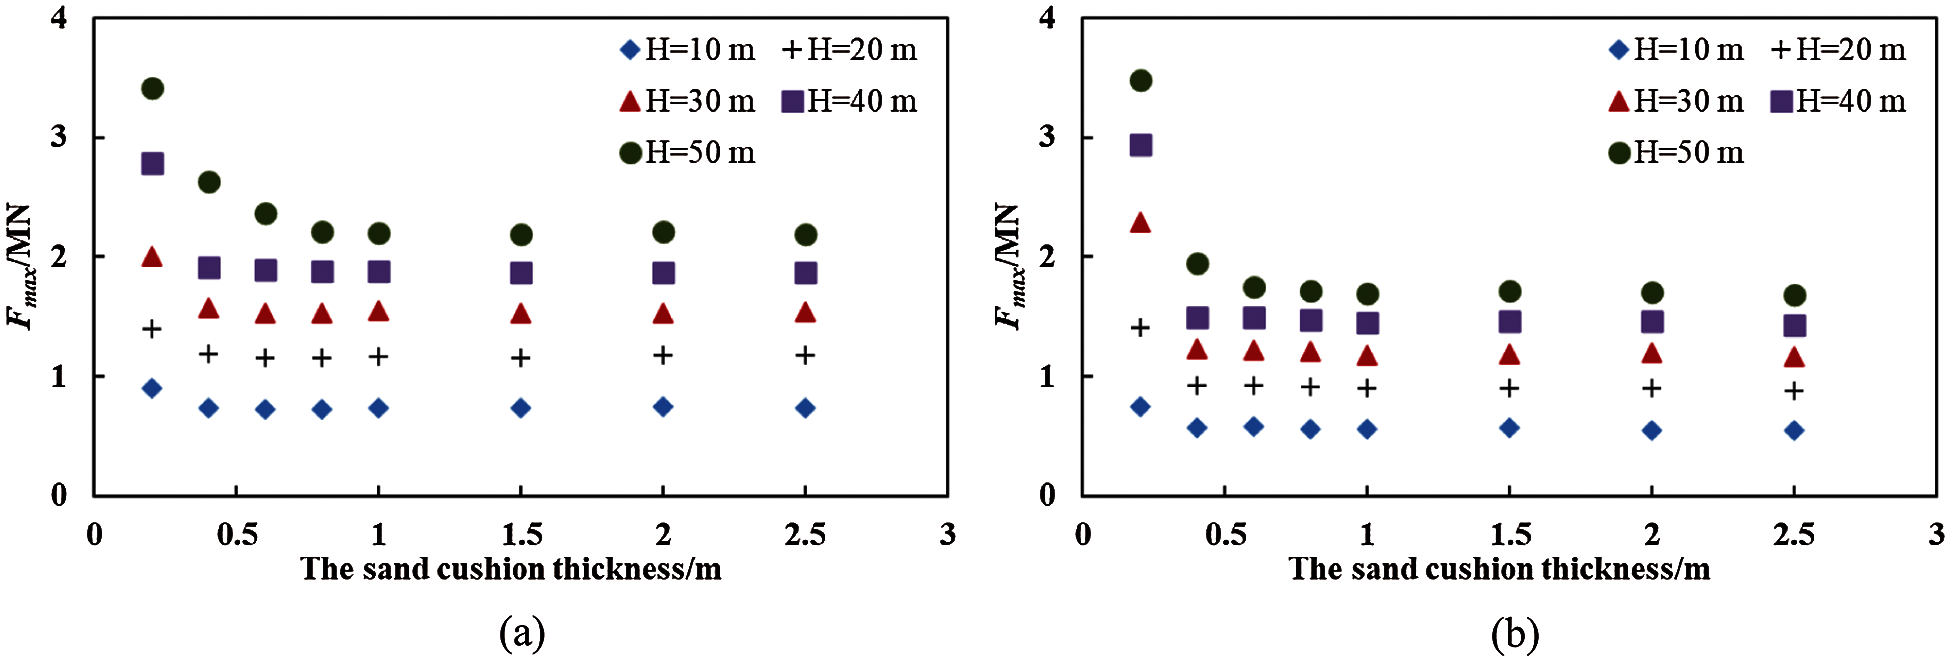
Figure 6: The Fmax of (a) the dense sand cushion (n = 0.05) and (b) the loose sand cushion (n = 0.35) under the different cushion thickness
To explore the impact of the rockfall further, we regarded the average value of the Fmax of the thick sand cushion (
The parameter
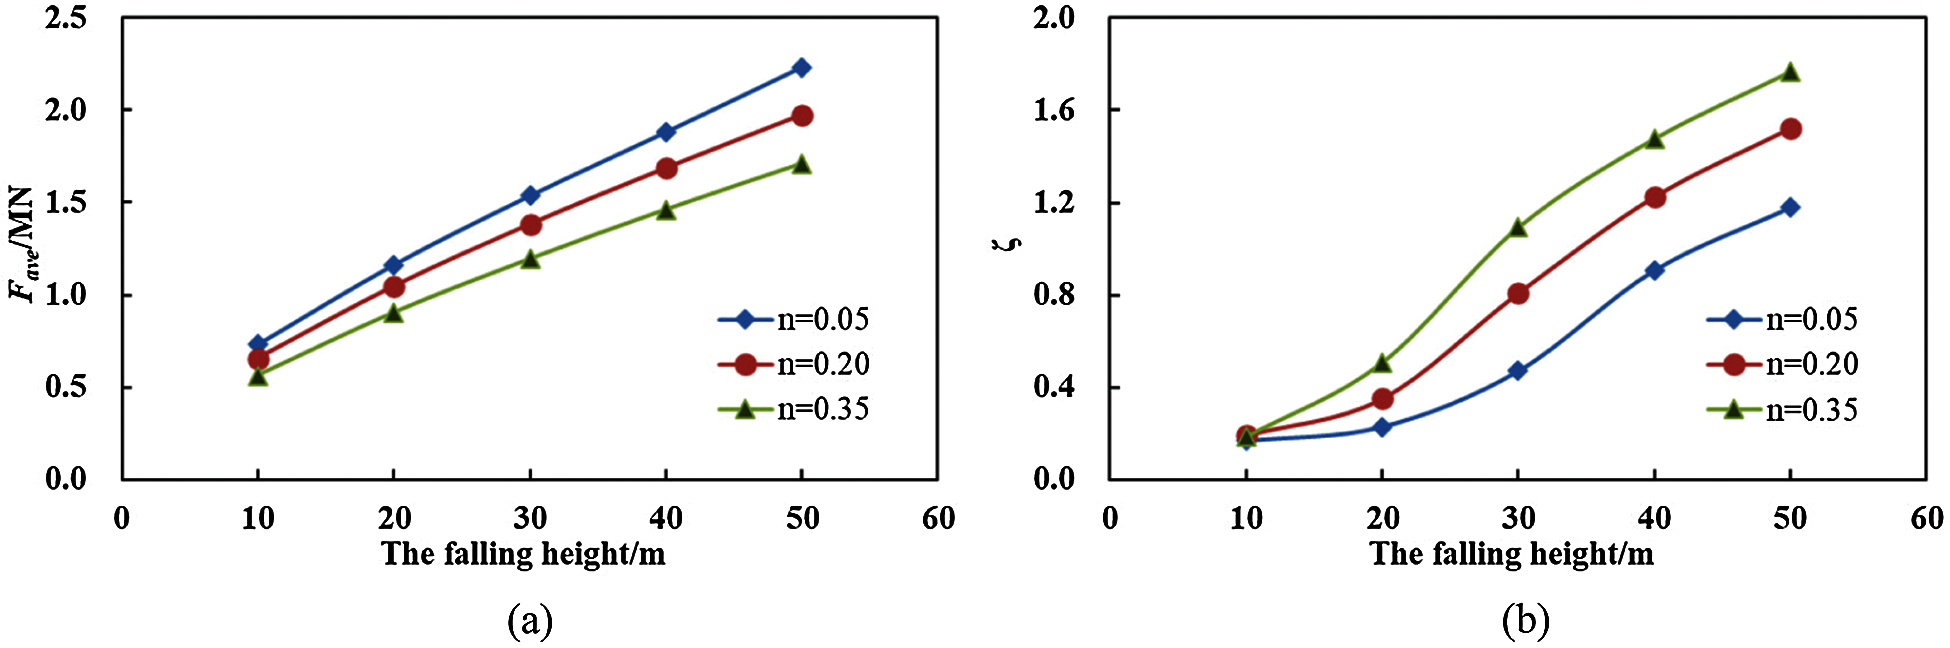
Figure 7: The effect of the sand porosity on (a) the Fave and (b) the attenuation of the Fave
When the rockfall hit the sand cushion, the impact force propagated quickly through the sand cushion and then acted as the external load on the structure. During the impact, the maximum force that acted on the rigid slab was defined as the bottom force (Fbot). The variation in the Fbot reflected the role of the sand cushion. The values of the Fbot under the different conditions are shown in Fig. 8. Unlike the variation in the Fmax with respect to the cushion thickness, the variation in the Fbot exhibits a concave shape (except H = 10 m for the dense sand cushion). The Fbot consisted of two components, namely the dead load of the sand cushion and the force induced by the impact. When the cushion thickness is 0.2 m, the values of the Fbot are very high due to the poor buffer performance of the sand cushion, especially under the high impact energy. When the thickness of the sand cushion increases (h = 0.4–1.0 m), the Fbot decreases gradually due to the quick decrease in the impact force and the improvement on the buffer performance of the sand cushion. When the cushion thickness increases to h = 1.0–2.5 m, the Fbot remains approximately constant. Although the high thickness enhanced the buffer performance of the sand cushion, the additional force induced by the dead load of the sand cushion, which exceeded the buffer effect of the sand cushion, was significant. Therefore, as shown in Fig. 8, the Fbot gradually increases with the increase in thickness of the sand cushion. The effect of the cushion thickness and the falling height on the Fbot of the dense sand cushion and the loose sand cushion is similar. When H is 10 m, the curve that is shown in Fig. 8a is different from that shown in Fig. 8b. The Fbot of the dense sand cushion increases when the thickness of the sand cushion increases. In contrast, the Fbot of the loose sand cushion exhibits a concave shape when the thickness of the sand cushion increases. In the actual engineering practice, the evaluation of the appropriate cushion thickness should consider the effect of the buffer performance and the dead load of the sand cushion. Under the simulation condition (the falling height and the sand porosity) presented in this paper, we regarded that the appropriate thickness of the sand cushion was 1.5 m.
The sand cushion dissipates the impact energy of the rockfall and reduces the load that acts on the structure. Although the impact force can be calculated by several methods, the design of the rock shed is dependent on the Fbot. Currently, there are limited formulas to evaluate the Fbot. Thus, it is very important for designers to understand the relative magnitude of the Fbot and the Fmax. Due to the dead load of the sand cushion and the complexity of the transmission of the impact force through the sand cushion, the variation in the values of the Fbot/Fmax (Fig. 9) is complex. When the thickness of the sand cushion increases, the Fbot/Fmax curves, except the Fbot/Fmax curve of the dense sand cushion at H = 10 m, exhibit three stages, namely the first rise stage, the decline stage, and the second rise stage. The minimum Fbot/Fmax value occurs at the thickness of the sand cushion of 1.5 m. In the second stage, the increase in the impact energy quickly decreases the Fbot/Fmax. However, in the third stage, the sand porosity influences the increase rate of the Fbot/Fmax. The Fbot/Fmax of the dense sand cushion is relatively stable, and under the high impact energy, the values of the Fbot/Fmax can be regarded as a constant value (Fig. 9a). On the other hand, the Fbot/Fmax of the loose sand cushion increases when the thickness of the sand cushion increases above 1.5 m (Fig. 9b).
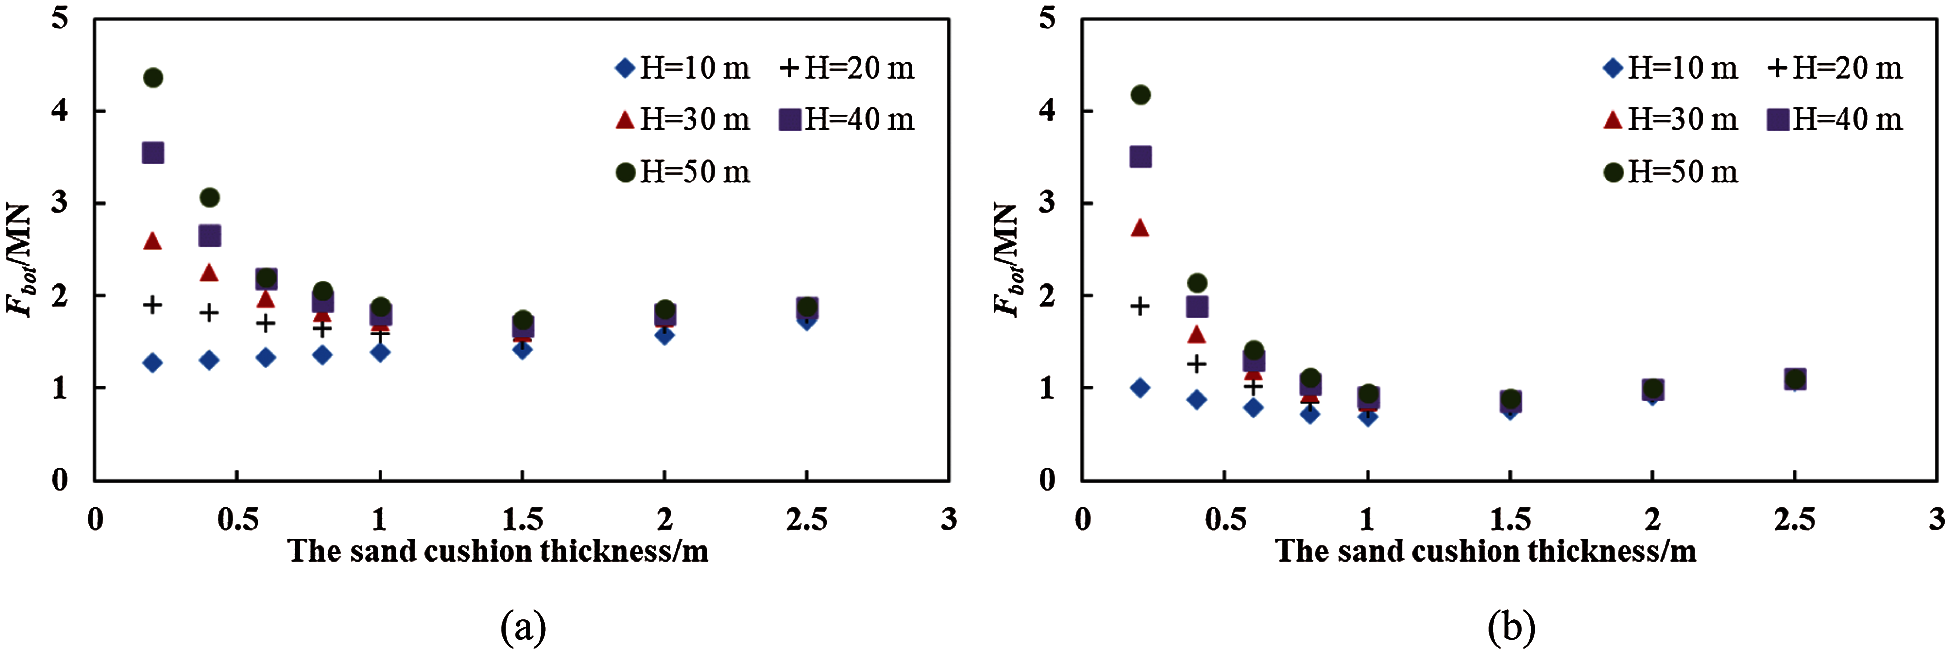
Figure 8: The Fbot of (a) the dense sand cushion (n = 0.05) and (b) the loose sand cushion (n = 0.35) under the different thickness of the sand cushion
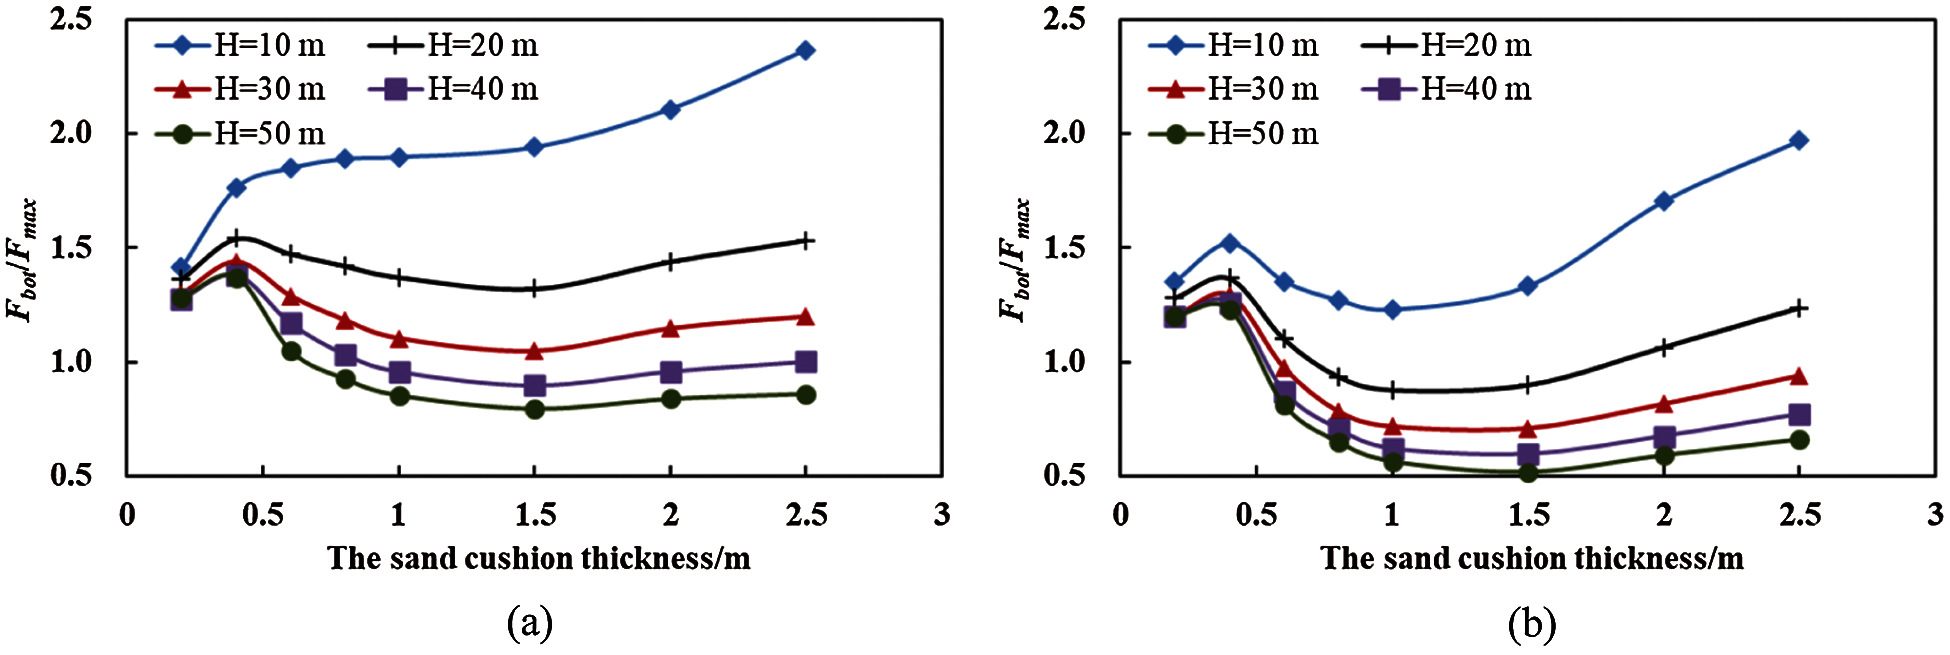
Figure 9: The Fbot/Fmax of (a) the dense sand cushion (n = 0.05) and (b) the loose sand cushion (n = 0.35) under the different thickness of the sand cushion
The relative magnitude of the Fbot/Fmax is shown in Fig. 10. As shown in Fig. 10, the effect of the falling height, the thickness of the sand cushion, and the sand porosity on the Fbot/Fmax is highly significant. When the thickness of the dense sand cushion is
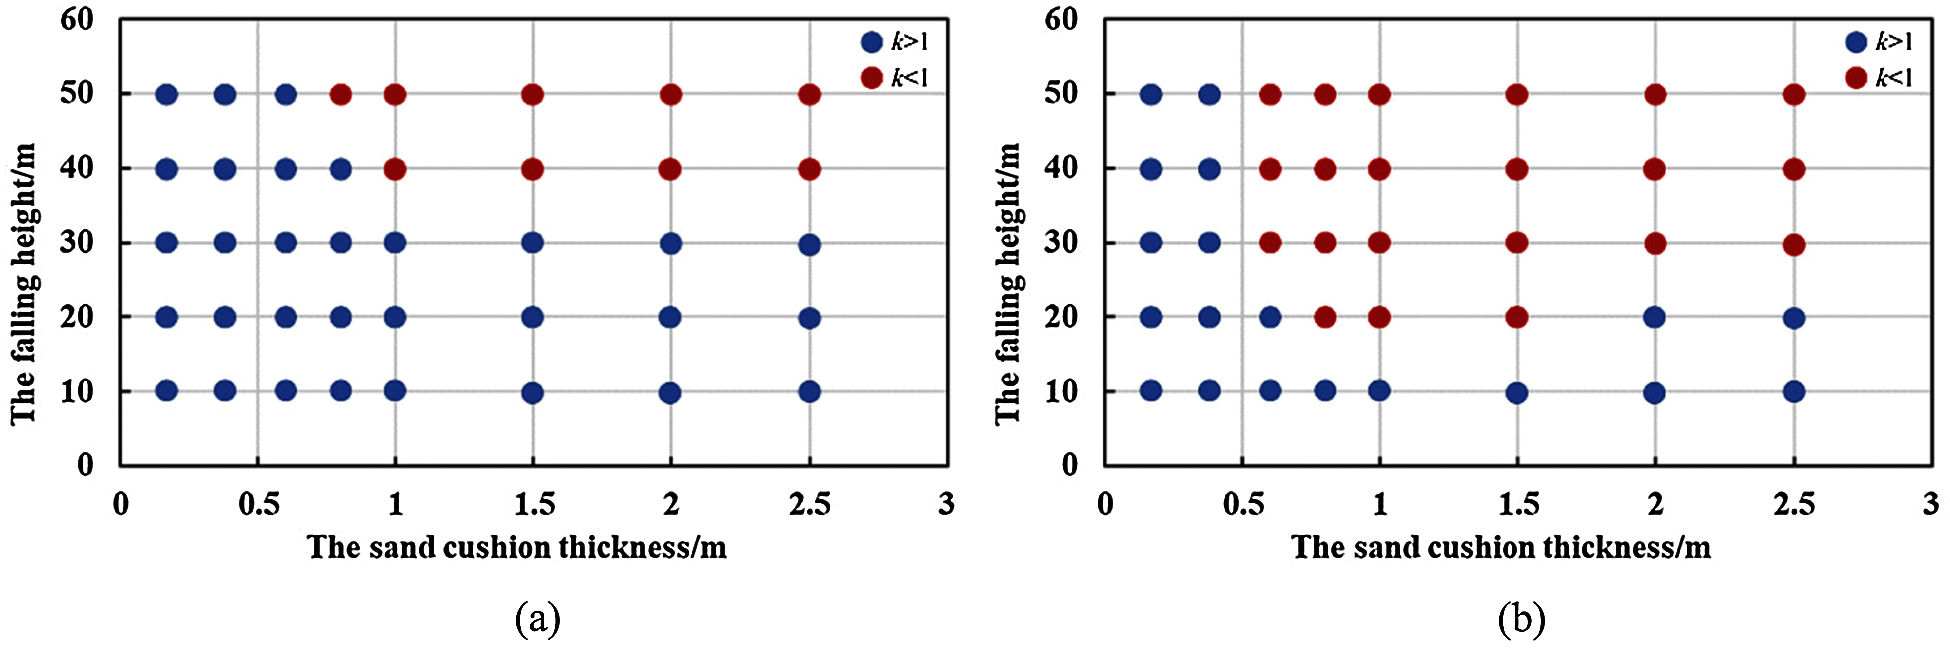
Figure 10: The ratio of the Fbot and the Fmax (k = Fbot/Fmax) of (a) the dense sand cushion (n = 0.05) and (b) the loose sand cushion (n = 0.35) under the different conditions
When designing the rock shed, designers consider the Fbot an important load. Currently, the unclear magnitude of the Fbot is a major issue of the rock shed design. For designers, there are limited reliable reference methods to estimate the Fbot. Hence, the research on the Fbot is urgently needed. Generally, the Fbot consists of the static cushion dead load (Fdead) and the dynamic Fadd induced by the impact of the rockfall. Unlike the simple calculation of the Fdead, the calculation of the Fadd involves the complex dynamic process and the sand deformation property; thus, the Fadd is difficult to estimate. In the practical engineering, a simple and practical method to evaluate the Fadd is urgently needed.
Fig. 11 shows the values of the Fadd (Fadd = Fbot – Fdead) under the different conditions. When the thickness of the sand cushion increases, the Fadd stabilizes, which indicates that the Fadd hardly contributed to the increase in the Fbot when the thickness of the sand cushion increased. For example, as shown in Fig. 12, when the thickness of the sand cushion increases from 0.2 m to 2.5 m, the Fadd/Fbot of the dense sand cushion decreases from 92% to 25% and the Fadd/Fbot of the loose sand cushion decreases from 93% to 18%. Moreover, the Fadd/Fbot is insignificantly affected by the falling height. Therefore, we concluded that when the thickness of the sand cushion was very high, the contribution of the Fadd to the increase in the Fbot could be ignored; thus, the load that acted on the structure was easily identified and the difficulty of the structural design was greatly reduced.
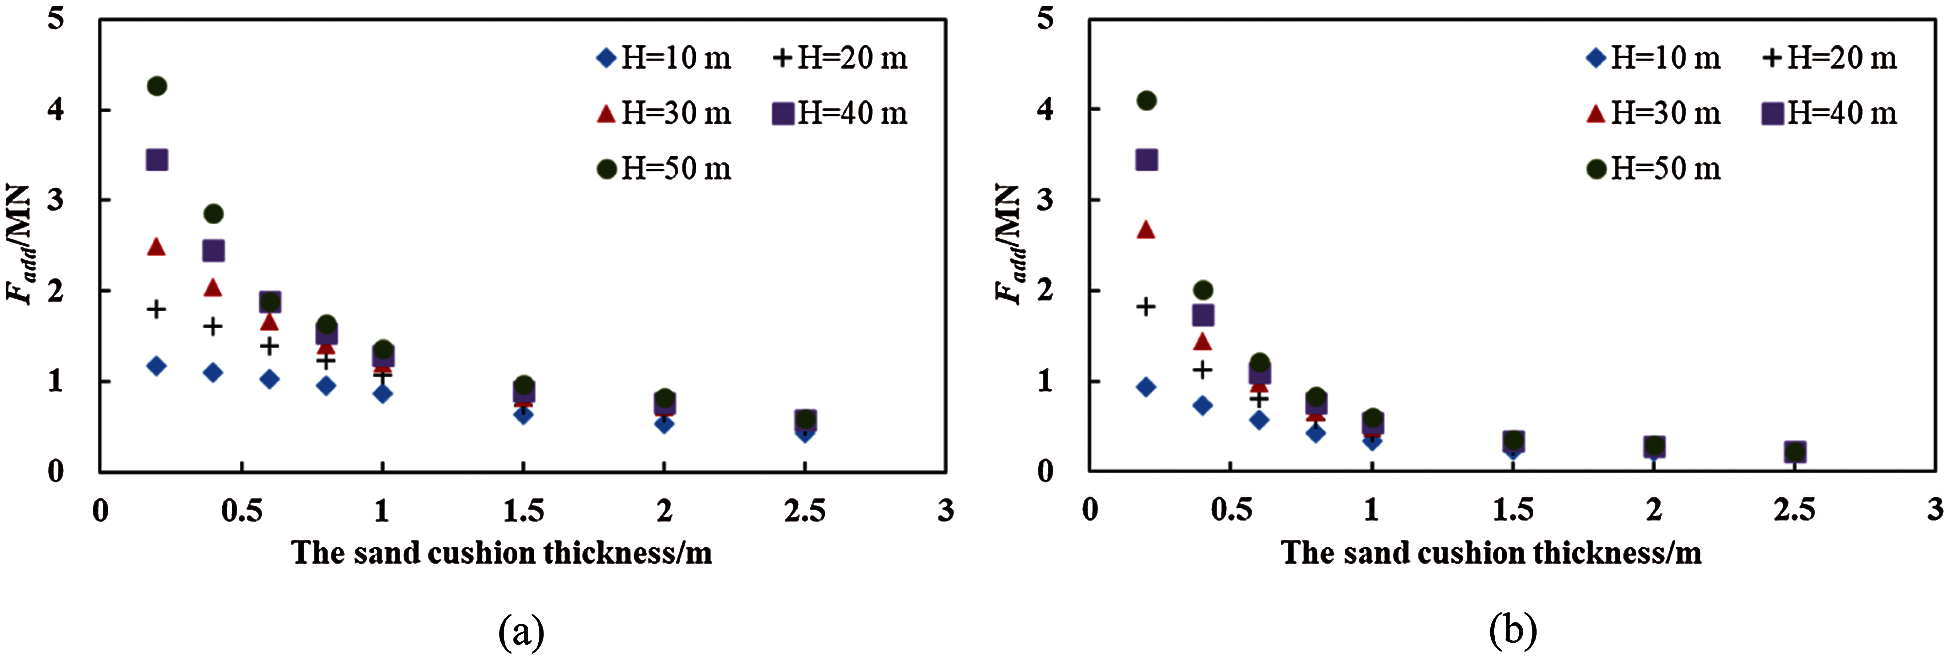
Figure 11: The Fadd of (a) the dense sand cushion (n = 0.05) and (b) the loose sand cushion (n = 0.35) under the different cushion thickness
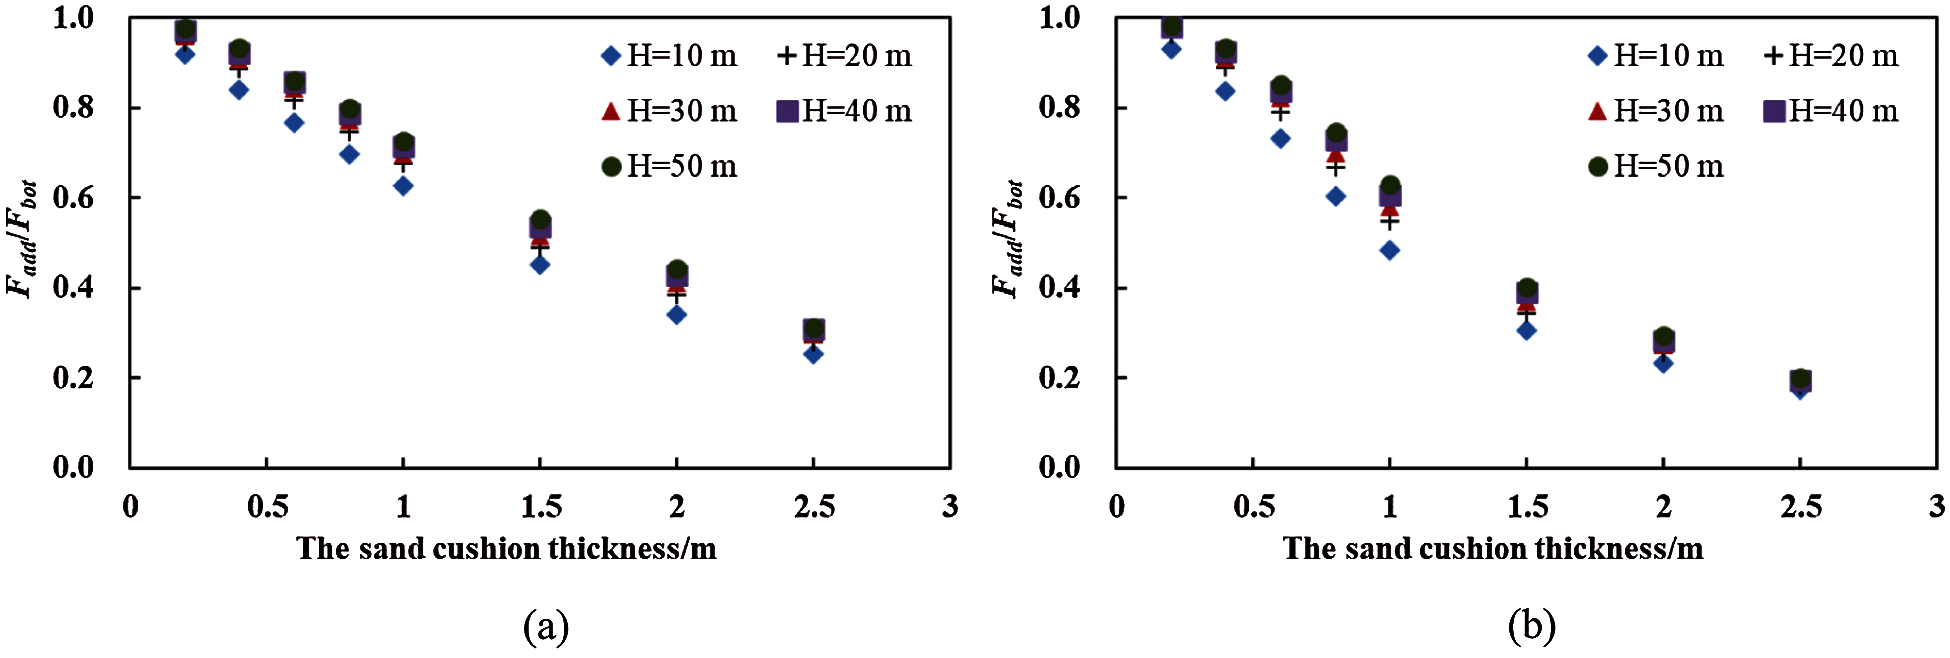
Figure 12: The Fadd/Fbot of (a) the dense sand cushion (n = 0.05) and (b) the loose sand cushion (n = 0.35) under the different cushion thickness
To improve the structural safety and the structural resistance to the extreme impact load that is greater than the design load, designers should consider the Fadd. Hence, we evaluated the relationship between the Fadd and the Fdead to simplify the estimation of the Fadd. On the basis of simulation results, we obtained the values of the Fadd/Fdead under the different thickness of the sand cushion (Fig. 13). As shown in Fig. 13, the variation in the Fadd/Fdead with respect to the variation in the cushion thickness is linear. At h = 2.5 m, the values of the Fadd/Fdead under the range of the falling height value between 10 and 50 m are comparable, which indicates that the estimation of the Fadd of the thick sand cushion was more convenient and simpler than was that of the Fadd of the thin sand cushion.
However, the actual impact of the rockfall is more complex than is the impact of the rockfall simulated by the numerical model presented in this paper. In the future work, the numerical simulation will be conducted under the higher impact energy and the multi-impact process. Moreover, the shape of the falling block and the properties of the sand cushion will be considered in the numerical model to replicate the actual engineering design.
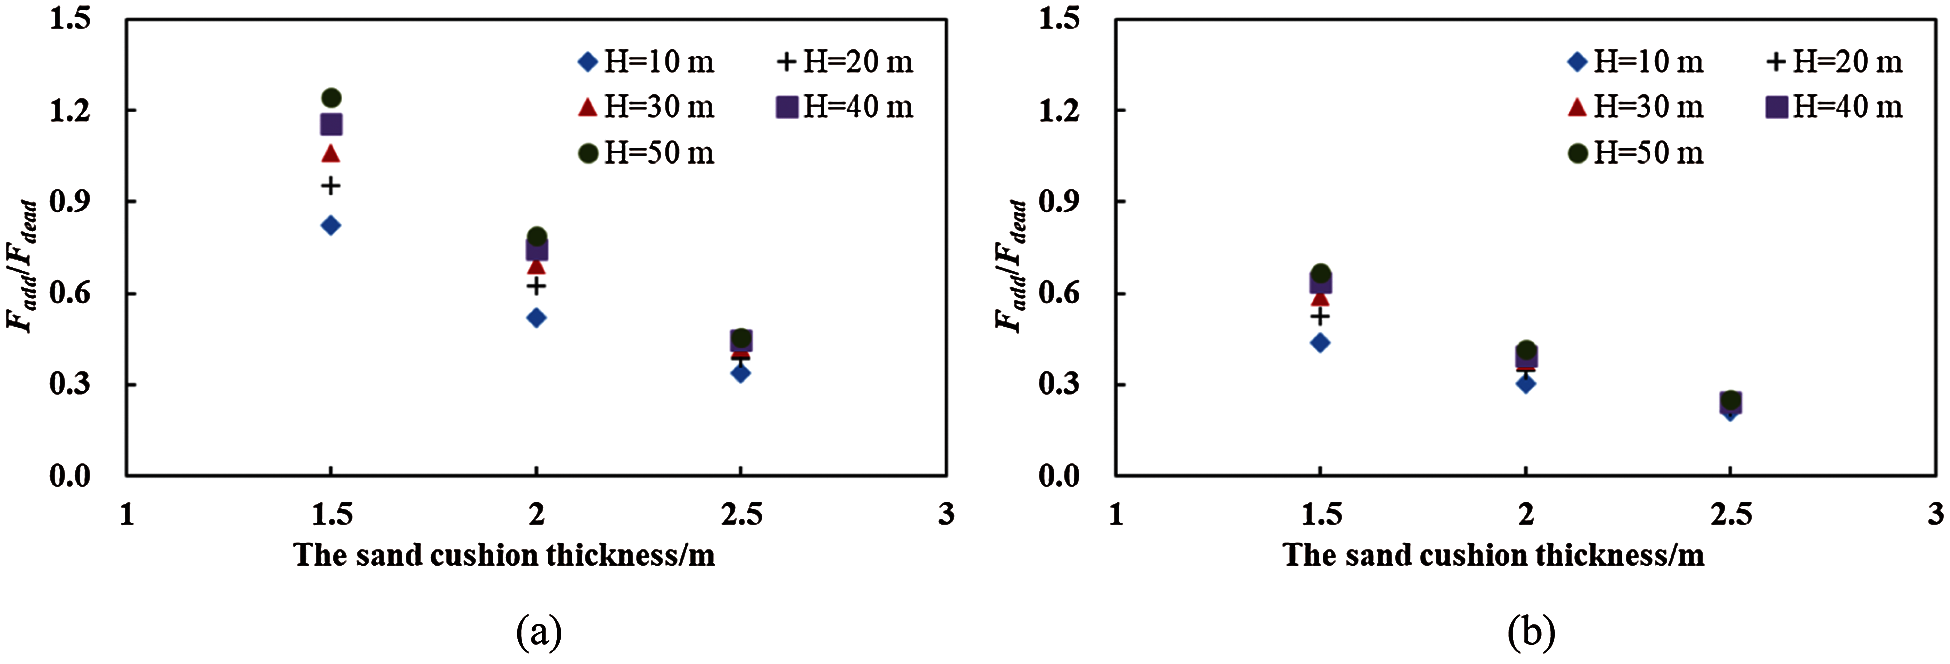
Figure 13: The Fadd/Fdead of (a) the dense sand cushion (n = 0.05) and (b) the loose sand cushion (n = 0.35) under the different cushion thickness
The numerical analysis presented in this paper focused on the dynamic response of the sand cushion to the impact of the rockfall, of which the main conclusions of the numerical analysis were:
(1) When the thickness of the sand cushion was increased above 1 m, the additional thickness had little effect on the buffer performance of the sand cushion. The dense sand cushion generated higher impact force than did the loose sand cushion. Under the high impact energy, the difference in the buffer performance of the dense and the loose sand cushion was more significant than that under the low impact energy. When the thickness of the sand cushion increased from a low value to the designed value, the impact force of the dense sand cushion decayed more quickly than did the impact force of the loose sand cushion.
(2) The variation in the bottom force with respect to the variation in the cushion thickness was depicted by a concave curve. Although the high thickness enhanced the buffer performance of the sand cushion, the additional force contributed by the dead load of the sand cushion was significant. For the dense and the loose sand cushion, the effect of the cushion thickness and the falling height on the bottom force was similar. In the practical engineering design, we suggested designers to determine the appropriate thickness of the sand cushion on the basis of the buffer performance and the dead load of the sand cushion.
(3) When the thickness of the sand cushion increased, three stages were observed on Fbot/Fmax curves, namely the first rise stage, the decline stage, and the second rise stage. Among the three stages, the second rise stage exhibited the most significant difference in the Fbot/Fmax of the dense sand cushion and the loose sand cushion. The influence of the falling height, the thickness of the sand cushion, and the sand porosity on the Fbot/Fmax was highly significant. The
(4) When the cushion thickness increased, the Fadd hardly contributed to the increase in the Fbot. The variation in the Fadd/Fdead with respect to the variation in the thickness of the sand cushion was approximately linear. When the thickness of the sand cushion was above 2 m, the values of the Fadd/Fdead under a range of the falling height value between 10 and 50 m were comparable, which indicated that the estimation of the Fadd of the sand cushion with the high thickness was more convenient and simpler than that of the sand cushion with the low thickness.
Acknowledgement: We acknowledge the financial support from Sichuan Transportation Science and Technology Project (Grant Nos. 2020-MS3-101/2020-B-01 and 2019-ZL-12 and 2018-B-03) and the Science and Technology Department of Sichuan Province (Nos. 2021YFH0048 and 2021YFH0118).
Funding Statement: Sichuan Transportation Science and Technology Project (Grant Nos. 2020-MS3-101/2020-B-01 and 2019-ZL-12 and 2018-B-03) and the Science and Technology Department of Sichuan Province (Nos. 2021YFH0048 and 2021YFH0118).
Conflicts of Interest: The authors declare that they have no conflicts of interest to report regarding the present study.
1. Volkwein, A., Schellenberg, K., Labiouse, V., Agliardi, F., Berger, F. et al. (2011). Rockfall characterisation and structural protection: A review. Natural Hazards and Earth System Sciences, 11(9), 2617–2651. DOI 10.5194/nhess-11-2617-2011. [Google Scholar] [CrossRef]
2. Zhao, P., Xie, L. Z., He, B., Zhang, Y. (2018). Experimental study of rock-sheds constructed with PE fibres and composite cushion against rockfall impacts. Engineering Structures, 177(9), 175–189. DOI 10.1016/j.engstruct.2018.09.073. [Google Scholar] [CrossRef]
3. Yuan, S., Zheng, G. Q., Zhang, S., Li, L. P. (2019). Lessons learnt from disease and treatment engineering of opencut (Shed) tunnels in 10-years after Wenchuan Earthquake. Tunnel Construction, 39(8), 1372–1379. DOI 10.3973/j.issn.2096-4498.2019.08020. [Google Scholar] [CrossRef]
4. Zhao, P., Yuan, S., Li, L. P., Ge, Q., Liu, J. et al. (2021). Experimental study on the multi-impact resistance of a composite cushion composed of sand and geofoam. Geotextiles and Geomembranes, 49(1), 45–56. DOI 10.1016/j.geotexmem.2020.09.004. [Google Scholar] [CrossRef]
5. Kishi, N., Konno, H., Ikeda, K., Matsuoka, K. G. (2002). Prototype impact tests on ultimate impact resistance of PC rock-sheds. International Journal of Impact Engineering, 27(9), 969–985. DOI 10.1016/S0734-743X(02)00019-2. [Google Scholar] [CrossRef]
6. Mougin, J. P., Perrotin, P., Mommessin, M., Tonnelo, J., Agbossou, A. (2005). Rock fall impact on reinforced concrete slab: An experimental approach. International Journal of Impact Engineering, 31(2), 169–183. DOI 10.1016/j.ijimpeng.2003.11.005. [Google Scholar] [CrossRef]
7. Delhomme, F., Mommessin, M., Mougin, J. P., Perrotin, P. (2005). Behavior of a structurally dissipating rock-shed: Experimental analysis and study of punching effects. International Journal of Solids and Structures, 42(14), 4204–4219. DOI 10.1016/j.ijsolstr.2004.12.008. [Google Scholar] [CrossRef]
8. Zineddina, M., Krauthammer, T. (2007). Dynamic response and behavior of reinforced concrete slabs under impact loading. International Journal of Impact Engineering, 34(9), 1517–1534. DOI 10.1016/j.ijimpeng.2006.10.012. [Google Scholar] [CrossRef]
9. Calvetti, F., di Prisco, C. (2012). Rockfall impacts on sheltering tunnels: Real-scale experiments. Geotechnique, 62(10), 865–876. DOI 10.1680/geot.9.P.036. [Google Scholar] [CrossRef]
10. Lambert, S., Gotteland, P., Nicot, F. (2009). Experimental study of the impact response of geocells as components of rockfall protection embankments. Natural Hazards and Earth System Sciences, 9(2), 459–467. DOI 10.5194/nhess-9-459-2009. [Google Scholar] [CrossRef]
11. Kawahara, S., Muro, T. (2006). Effects of dry density and thickness of sandy soil on impact response due to rockfall. Journal of Terramechanics, 43(3), 329–340. DOI 10.1016/j.jterra.2005.05.009. [Google Scholar] [CrossRef]
12. Zhao, P., Xie, L. Z., Li, L. P., Liu, Q., Yuan, S. (2018). Large-scale rockfall impact experiments on a RC rock-shed with a newly proposed cushion layer composed of sand and EPE. Engineering Structures, 175(14), 386–398. DOI 10.1016/j.engstruct.2018.08.046. [Google Scholar] [CrossRef]
13. Calvetti, F., di Prisco, C., Vecchiotti, M. (2005). Experimental and numerical study of rock-fall impacts on granular soils. Rivista Italiana di Geotecnica, 4(4), 95–109. [Google Scholar]
14. Zhang, G. C., Tang, H. M., Xiang, X., Karakus, K., Wu, J. P. (2015). Theoretical study of rockfall impacts based on logistic curves. International Journal of Rock Mechanics and Mining Sciences, 78(8), 133–143. DOI 10.1016/j.ijrmms.2015.06.001. [Google Scholar] [CrossRef]
15. Ouyang, C., Liu, Y., Wang, D., He, S. M. (2019). Dynamic analysis of rockfall impacts on geogrid reinforced soil and EPS absorption cushions. KSCE Journal of Civil Engineering, 23(1), 37–45. DOI 10.1007/s12205-018-0704-4. [Google Scholar] [CrossRef]
16. Bhatti, Q. A. (2018). Computational modeling of energy dissipation characteristics of expanded polystyrene (EPS) cushion of reinforce concrete (RC) bridge girder under rockfall impact. International Journal of Civil Engineering, 16(11), 1–8. DOI 10.1007/s40999-018-0304-1. [Google Scholar] [CrossRef]
17. Yan, P., Zhang, J. H., Fang, Q., Zhang, Y. D. (2018). Numerical simulation of the effects of falling rock’s shape and impact pose on impact force and response of RC slabs. Construction and Building Materials, 160(4), 497–504. DOI 10.1016/j.conbuildmat.2017.11.087. [Google Scholar] [CrossRef]
18. Naito, N., Maeda, K., Konno, H., Ushiwatari, Y., Suzuki, K. et al. (2020). Rockfall impacts on sand cushions with different soil mechanical characteristics using discrete element method. Soils and Foundations, 60(2), 384–397. DOI 10.1016/j.sandf.2020.02.008. [Google Scholar] [CrossRef]
19. Zhang, L., Lambert, S., Nicot, F. (2017). Discrete dynamic modelling of the mechanical behaviour of a granular soil. International Journal of Impact Engineering, 103(4), 76–89. DOI 10.1016/j.ijimpeng.2017.01.009. [Google Scholar] [CrossRef]
20. Shen, W., Zhao, T., Dai, F., Jiang, M., Zhou, G. D. (2018). DEM analyses of rock block shape effect on the response of rockfall impact against a soil buffering layer. Engineering Geology, 249(4), 60–70. DOI 10.1016/j.enggeo.2018.12.011. [Google Scholar] [CrossRef]
21. Cundall, P. A., Strack, O. D. L. (1979). A discrete numerical model for granular assemblies. Geotechnique, 29(1), 47–65. DOI 10.1680/geot.1979.29.1.47. [Google Scholar] [CrossRef]
22. Itasca Consulting Group Inc. (2016). PFC3D–Particle flow code in three dimensions. Version 5.0 User’s Manual. Minneapolis: ICG. [Google Scholar]
23. Zhao, P., Xie, L. Z., Fan, Z. C., Deng, L., Liu, J. (2021). Mutual interference of layer plane and natural fracture in the failure behavior of shale and the mechanism investigation. Petroleum Science, 18(2), 618–640. DOI 10.1007/s12182-020-00510-5. [Google Scholar] [CrossRef]
24. Maeda, K., Hashiba, H., Karita, K., Ushiwatari, Y., Kawase, R. (2011). Impact force propagation behaviors of rock fall into horizontal granular mat using 2D-DEM. Journal of Applied Mechanics, 67(2), 355–364. DOI 10.2208/jscejam.67.I_355. [Google Scholar] [CrossRef]
 | This work is licensed under a Creative Commons Attribution 4.0 International License, which permits unrestricted use, distribution, and reproduction in any medium, provided the original work is properly cited. |