| Computer Modeling in Engineering & Sciences |
DOI: 10.32604/cmes.2022.017958
ARTICLE
A Novel Bidirectional Interaction Model and Electric Energy Measuring Scheme of EVs for V2G with Distorted Power Loads
1School of Automation and Electrical Engineering, University of Science and Technology Beijing, Beijing, 100083, China
2Guiyang Aluminum Magnesium Design and Research Institute Co., Ltd., Guiyang, 550081, China
3Chinalco Intelligent Technology Development Co., Ltd., Hangzhou, 311199, China
*Corresponding Authors: Jiarui Cui. Email: cuijiarui@ustb.edu.cn; Qing Li. Email: liqing@ies.ustb.edu.cn
Received: 19 June 2021; Accepted: 02 September 2021
Abstract: With the increasing demand for petroleum resources and environmental issues, new energy electric vehicles are increasingly being used. However, the large number of electric vehicles connected to the grid has brought new challenges to the operation of the grid. Firstly, A novel bidirectional interaction model is established based on modulation theory with nonlinear loads. Then, the electric energy measuring scheme of EVs for V2G is derived under the conditions of distorted power loads. The scheme is composed of fundamental electric energy, fundamental-distorted electric energy, distorted-fundamental electric energy and distorted electric energy. And the characteristics of each electric energy are analyzed. Finally, the correctness of the model and energy measurement method is verified by three simulation cases: the impact signals, the fluctuating signals, and the harmonic signals.
Keywords: Electric vehicles; V2G; energy metering; bidirectional interaction model; electric energy measuring scheme
Electric vehicles (EVs) play a critical role in meeting the environmental goals of the Sustainable Development Scenario to reduce local air pollution and to address climate change [1]. With the increasing demand for petroleum resources and environmental issues, new energy electric vehicles are increasingly being put into use in the last decade. The number of electric cars on the world’s roads had swelled to 7.2 million by 2019 from only about 17000 in 2010 [2]. EVs could actively provide about 460 GWh of energy to the grid at suitable times via vehicle-to-grid services (V2G). But every coin has two sides, and there are a lot of challenges to unlock the full flexibility potential of electric vehicles, such as technologies, regulatory, market frameworks, and so on.
V2G technology has been widely concerned by experts and scholars all over the world, and has achieved a series of results which mainly focus on scheduled charging and discharging [3–6], bidirectional converter [7–9], power energy management system [10,11], battery lifecycle [12], modeling approaches [13], energy storage systems [14] and so on. It is pointed out in [15] that a large amount of energy storage needs to consider the fast-dynamic response of power demand and a modular method is given. A green V2G network is proposed in [16] for energy management which consists of three planes: management plane, control plane, and data plane. Literature [17,18] mainly studies aspects of data security and communication security. V2G technology enables electric vehicles to deliver power to the power system to provide complementary capabilities. Literature [17] established a novel and secure communication framework to meet the real-time and security of power transportation. Literature [18] proposed a member-based secure data sharing scheme in V2G networks to protect data privacy and save system resources. In [19], a battery state based scheduling algorithm is proposed to optimize the V2G charging and discharging strategy. In [20], a construction scheme based on transfer learning is proposed to update the safe charging and discharging strategy dynamically. These documents have played a pivotal role in the development of V2G technology. In [21], based on grid load time-sharing pricing, an electric vehicle scheduling model was established with the goal of reducing charging cost and network loss cost. The charging and discharging strategies of electric vehicles were obtained by real-time calculation of power flow calculation and convex optimization algorithm. Literature [22] proposes a V2G management system consisting of an ordered charging dispatch system and a V2G converter control system. The system can fully utilize the flexibility of electric vehicle load while meeting the charging needs of electric vehicles. In [23], an ordered charge and discharge control model in V2G mode is proposed, in order to reduce the charge and discharge cost of electric vehicles and the variance of grid load.
However, electric energy measuring methods for V2G have not been concerned widely, although there have been a large number of mature modeling methods [24–26], filtering algorithms [27–29], measurement techniques [30–32] and they have been successfully applied to actual systems in the field of industrial processes. Based on the idea of [33], we established the charging model and discharging model of EVs for V2G, and given the electric energy measuring formula in [34]. But they did not consider the effect of the distorted power loads that is always stayed in power grid when EVs are charging or discharging. Furthermore, the unified bidirectional model and the corresponded electric energy measuring methods did not discuss. With the widespread use of V2G technology, it will be a very effective means to increase the participation of EV owners in V2G. So, this paper proposes a bidirectional electric energy measuring scheme for V2G with distorted power loads which considered the great randomness of the charging and discharging time of EVs and the distorted power loads on the power grid.
The rest of this paper is presented as follows. Section 2 establishes the bidirectional interaction model of EVs for V2G based on electric network theory. In Section 3, a bidirectional electric energy measuring scheme is proposed for V2G with distorted power loads based on power flow analysis and energy metering theory. Section 4 gives the simulation results and analyzes the data. Finally, the conclusions are shown in Section 5.
2 A Bidirectional Interaction Model of EVs for V2G
The signals’ type is very complex because of the large number of non-linear loads in the grid. In addition to harmonic signals and inter-harmonic signals, there are many other forms of distorted signals such as impact signals and fluctuation signals which are typical in grid. They cannot be described by harmonic models. We can establish their model as follows using modulation theory:
where
If the signal is an impact signal,
If the signal is a fluctuating signal,
where the duration
Under the condition of distortion signal, the voltage at a certain measuring point in the power grid and the current flowing into the measuring point can be expressed as follows:
where
On the basis of [33] and [34], a bidirectional interaction model of EVs for V2G is established as shown in Fig. 1.
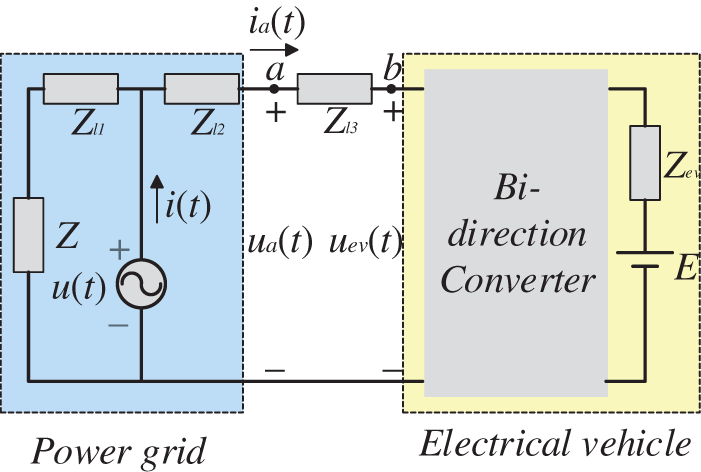
Figure 1: Bidirectional interaction model of electric vehicles in the power grid
In Fig. 1, the left side of the circuit is a simplified model of the grid, where
3 A Bidirectional Electric Energy Measuring Scheme
Assuming that the grid voltage is assumed to be as follows:
where voltage phase
Assuming the current direction shown in Fig. 1 is the positive direction, that is, the charging direction of the electric vehicle is the positive direction. According to formula (1), the current at the metering point
When the electric vehicle is discharged, the current at the measuring point
When the electric vehicle is charged in the power grid, the voltage at the measuring point
When the electric vehicle is discharged into the power grid, the voltage at the measuring point
In fact, the output voltage
Assuming that
Take the
According to formula (13), the voltage at the metering point
The fundamental voltage amplitude is as follows:
The fundamental voltage phase is as follows:
The distortion voltage at the metering point
According to Eq. (5), the current flowing into the metering point
The distortion current is as follows:
Assume that within the measurement time
Therefore, the electrical energy at point
According to the formula (21), the electrical energy at the point
Taking the discharge situation of electric vehicles as an example, this paper will analyze the four parts of electrical energy in turn.
Combining Eqs. (14) and (18), the fundamental components of the average power of point
In Eq. (26), the first part is the second harmonic component of the power, and the integral mean is zero. Additionally, there is
3.2 Power Generated by Fundamental Voltage and Distortion Current
Combining Eqs. (14) and (19), the instantaneous power generated by the fundamental voltage and distortion current at point
For the impact or fluctuating signals, the cumulative time of energy can be considered to be infinite. Therefore, the electric energy generated by the fundamental voltage and the distorted current at point
The first term in Eq. (29) is denoted by
In Eq. (30),
In Eq. (31), all parameters are positive, so there is
When
In Eq. (34), the first two terms are random variables, and the sum of multiple fluctuations will tend to zero. Similar to Eq. (31), the last term must be positive. Therefore, combining Eqs. (33) and (34), the following conclusion can be drawn:
3.3 Power Generated by Distortion Voltage and Fundamental Current
Combining Eqs. (17) and (18), the average power generated by the distortion voltage and fundamental current of point
Therefore, the following conclusion can be drawn:
Combining (17) and (19), the average distortion power at point
Therefore, the following conclusion can be drawn:
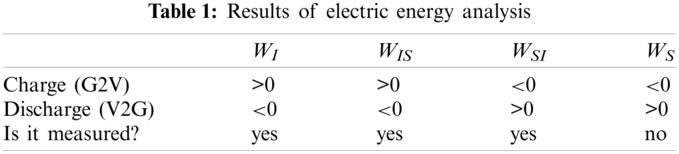
Based on the above analysis, the following conclusions can be drawn when the electric vehicle is discharged:
Energy analysis when electric vehicle charging is similar to that of discharging, and can be directly obtained by combining literature [34]. Therefore, this article will not be deduced in detail.
According to Table 1, the total electrical energy at the metering point is as follows:
However, current metering devices simply add up four types of electrical energy without taking into account the effects of distorted electrical energy on the grid and electric vehicles. Currently, the energy at metering point
Combined with Eqs. (40) and (41), a reasonable measurement formula can be described as follows:
4 Simulation and Result Verification
A reasonable measurement method for electric vehicles during charging has been verified in literature [34]. Next, this paper will verify the reasonable measurement method during discharging. The simulation was performed in the MATLAB 2015b environment. Assume the line load
During the measurement time, the number of occurrences of the distortion signal, the time of occurrence, the duration, and the amplitude are random. The amplitude of the impact signal can be several times the amplitude of the current. The duration can be several seconds or even tens of seconds. Assume that the fundamental period is
It is assumed that only the impact signal is included in the distortion current. When an impact signal is present, according to Eqs. (2) and (8), the current at the metering point
where
The voltage at point
Taking several random impact signals as an example, the current and voltage at the metering point
As can be seen from Fig. 2, the current distortion caused by impact signals can cause the voltage to drop. The simulation results of the electric vehicle discharge energy under the impact signal condition can be obtained, as shown in Table 2.
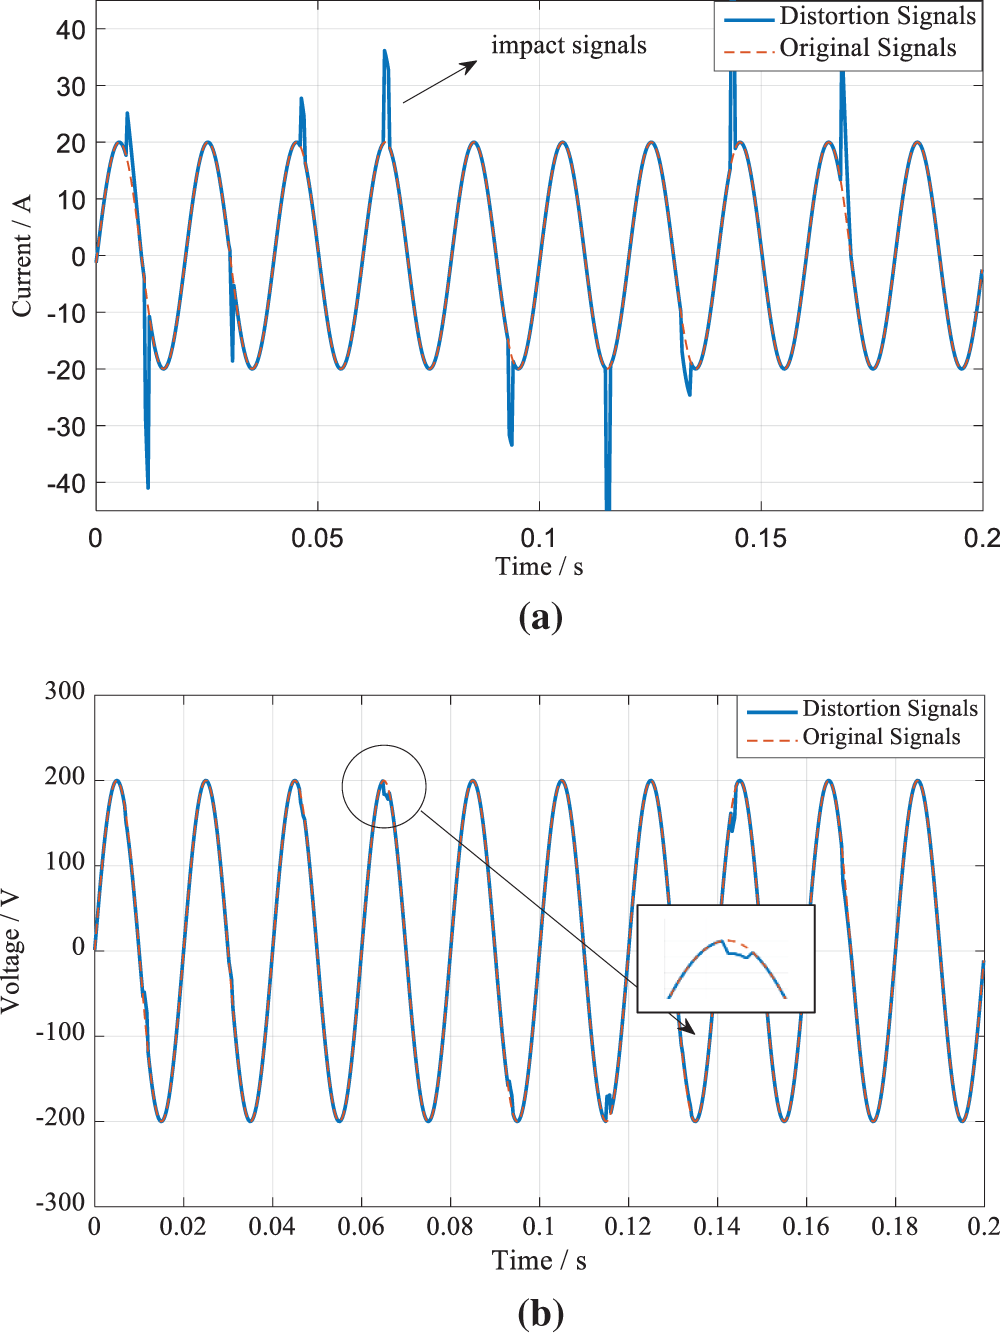
Figure 2: Discharge current and voltage under the condition of impact signals. (a) Current flowing into the metering point
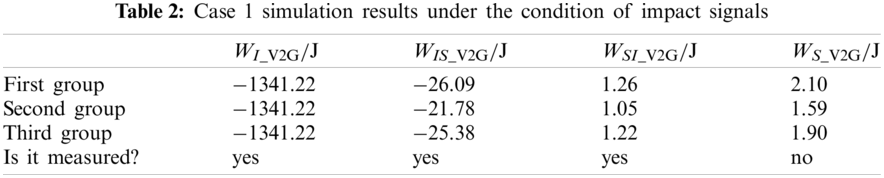
As can be seen from the data in Table 2, the simulation results of the four-part electric energy during discharge are consistent with the analysis results in Table 1, that is,
It is assumed that only the fluctuating signal is included in the distortion current. When a fluctuating signal is present, according to Eqs. (3) and (8), the current at the metering point a can be expressed as follows:
where
The voltage at point
Taking several random fluctuating signals as an example, the current and voltage at the metering point
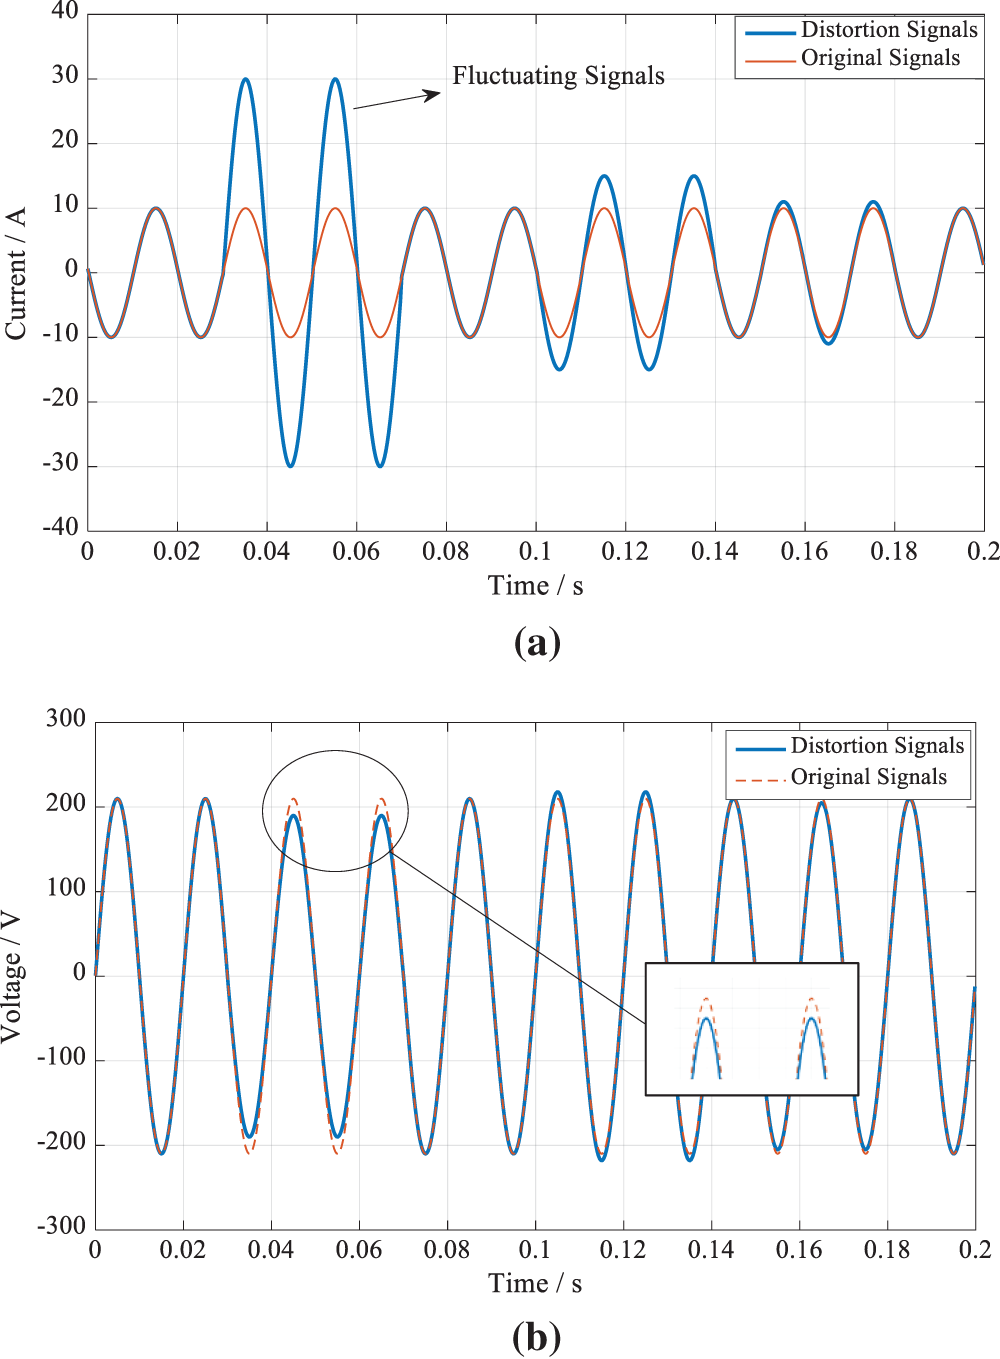
Figure 3: Discharge current and voltage under the condition of fluctuating signals. (a) Current flowing into the metering point
As can be seen from Fig. 3, the fluctuating signals can cause the metering point current to rise and the voltage to drop. Assuming that the number of occurrences of the fluctuating signal is

As can be seen from Table 3, under the fluctuating signal condition, there is
Assuming that the distortion signal does not contain the impact signal or the fluctuating signal, the distortion signal degenerates into a harmonic signal. Under the condition of harmonic signals, the current expression flowing into the metering point
The voltage at point
According to the above, the current and voltage at the metering point
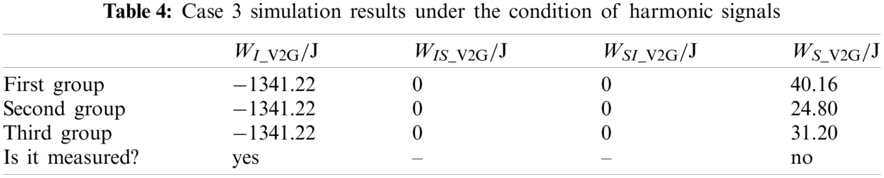
As can be seen from Table 4, under the harmonic signal condition, there is
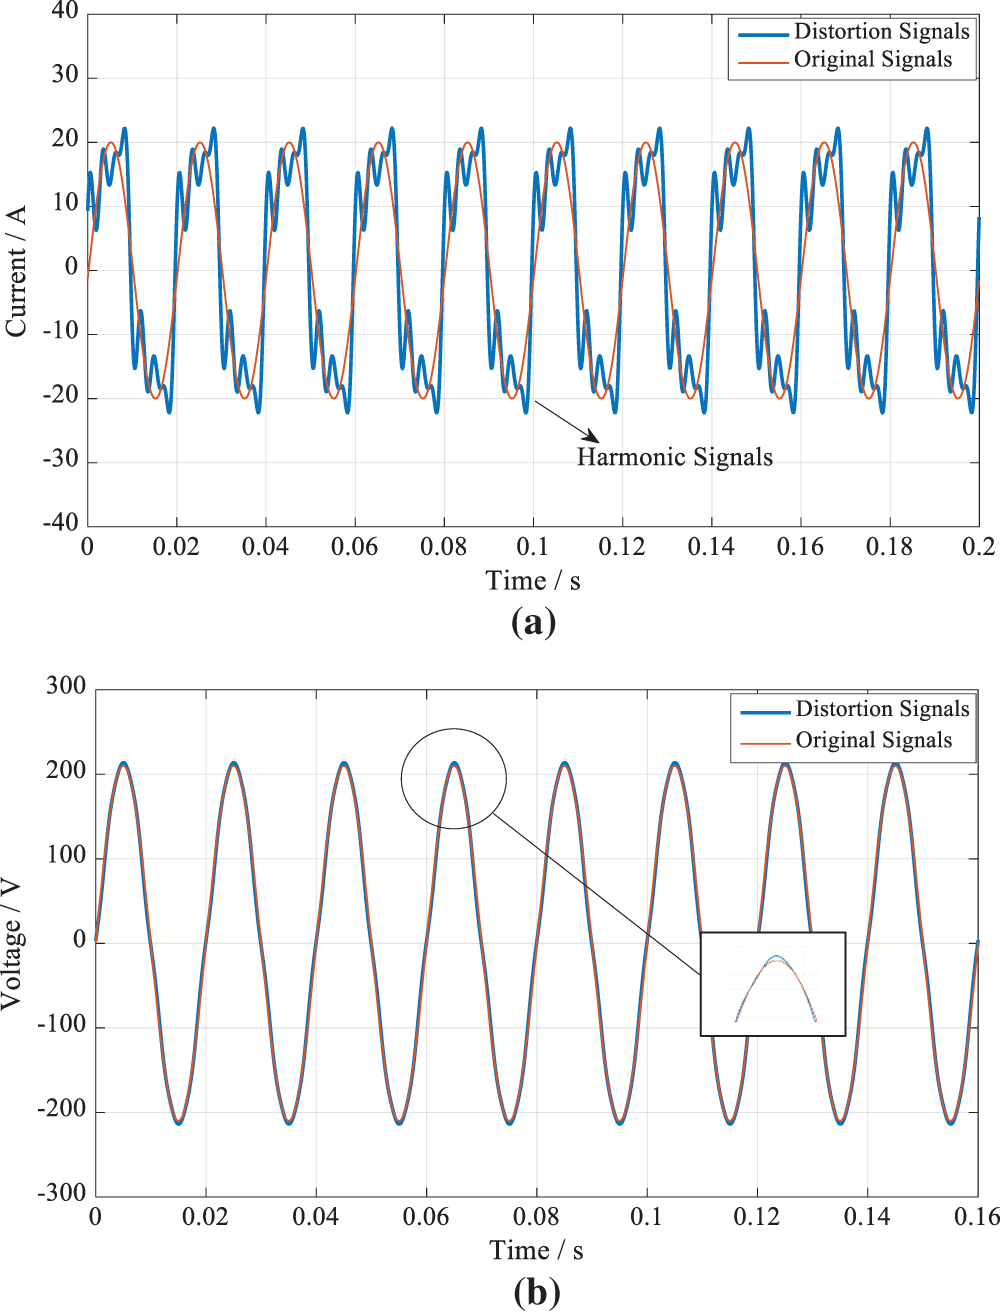
Figure 4: Discharge current and voltage under the condition of harmonic signals. (a) Current flowing into the metering point
In the V2G system, the reasonable measurement method of electric vehicle discharging energy at the metering point is as follows:
The reasonable measurement of electric vehicle charging energy has been verified in literature [34], as follows:
When the circuit contains only harmonic signals, there is:
In summary, a reasonable method of measuring electric energy is as follows:
where
First, the article points out that the traditional energy metering method in the grid under the distortion signal cannot measure correctly for V2G. Secondly, this paper establishes a load model for the bidirectional interaction of electric vehicles that can be used for energy metering. The power at the measuring point is analyzed, and a reasonable electric energy metering formula is summarized. The V2G bidirectional interaction model can express the charging and discharging process of the electric vehicle more practical and calculate the electric energy more reasonably at the metering point in a certain period.
Although a reasonable metering method is given, meeting the electric energies more accurately based on the V2G bidirectional interaction model is an important issue for engineering applications. The following issues are our future work:
1. Accurate metering methods based on modern signal processing theories, such as wavelet, time-frequency analysis, and so on.
2. Metering instruments development with real-time demands based on embedded technologies.
3. The bidirectional control scheme of EVs for V2G and G2V applications.
Funding Statement: This work is supported by China Postdoctoral Science Foundation (2021M690798), Guizhou Province Science and Technology Plan Project (No. [2021] General 085), National Natural Science Foundation of China (No. 61603034), the Fundamental Research Funds for the Central Universities (Nos. FRF-BD-19-002A, FRF-DF-20-14).
Conflicts of Interest: The authors declare that they have no conflicts of interest to report regarding the present study.
1. IEA (2020). Energy efficient buildings in Armenia: A roadmap. https://www.iea.org/reports/energy-efficient-buildings-in-armenia-a-roadmap. [Google Scholar]
2. IEA (2019). Global electric car stock, 2010–2019. https://www.iea.org/data-and-statistics/charts/global-electric-car-stock-2010-2019. [Google Scholar]
3. Habib, S., Kamran, M., Rashid, U. (2015). Impact analysis of vehicle-to-grid technology and charging strategies of electric vehicles on distribution networks–A review. Journal of Power Sources, 277(4), 205–214. DOI 10.1016/j.jpowsour.2014.12.020. [Google Scholar] [CrossRef]
4. Amin, A., Tareen, W. U. K., Usman, M. (2020). A Review of optimal charging strategy for electric vehicles under dynamic pricing schemes in the distribution charging network. Sustainability, 12(23), 10160. DOI 10.3390/su122310160. [Google Scholar] [CrossRef]
5. Ota, Y., Taniguchi, H., Nakajima, T., Liyanage, K. M., Baba, J. et al. (2012). Autonomous distributed V2G (Vehicle-to-Grid) satisfying scheduled charging. IEEE Transactions on Smart Grid, 3(1), 559–564. DOI 10.1109/TSG.2011.2167993. [Google Scholar] [CrossRef]
6. Liu, P., Wang, C. Y., Hu, J., Fu, T. T., Cheng, N. et al. (2020). Joint route selection and charging discharging scheduling of EVs in V2G energy network. IEEE Transactions on Vehicular Technology, 69(10), 10630–10641. DOI 10.1109/TVT.2020.3018114. [Google Scholar] [CrossRef]
7. Madawala, U. K., Thrimawithana, D. J. (2011). A bidirectional inductive power interface for electric vehicles in V2G systems. IEEE Transactions on Industrial Electronics, 58(10), 4789–4796. DOI 10.1109/TIE.2011.2114312. [Google Scholar] [CrossRef]
8. Das, D., Weise, N., Basu, K., Baranwal, R., Mohan, N. (2019). A bidirectional soft-switched DAB-based single-stage three-phase AC-DC converter for V2G application. IEEE Transactions on Transportation Electrification, 5(1), 186–199. DOI 10.1109/TTE.2018.2886455. [Google Scholar] [CrossRef]
9. Quilez, M. G., Abdel–Monem, M., El Baghdadi, M., Yang, Y., van Mierlo, J. (2018). Modelling, analysis and performance evaluation of power conversion unit in G2V/V2G application–A review. Energies, 11(5), 1082. DOI 10.3390/en11051082. [Google Scholar] [CrossRef]
10. Khan, S. U., Mehmood, K. K., Haider, Z. M., Bukhari, S. B. A., Lee, S. J. et al. (2018). Energy management scheme for an EV smart charger V2G/G2V application with an EV power allocation technique and voltage regulation. Applied Sciences-Basel, 8(4), 648. DOI 10.3390/app8040648. [Google Scholar] [CrossRef]
11. Battistelli, C., Baringo, L., Conejo, A. J. (2012). Optimal energy management of small electric energy systems including V2G facilities and renewable energy sources. Electric Power Systems Research, 92, 50–59. DOI 10.1016/j.epsr.2012.06.002. [Google Scholar] [CrossRef]
12. Ebrahimi, M., Rastegar, M., Mohammadi, M., Palomino, A., Parvania, M. (2020). Stochastic charging optimization of V2G-capable PEVs, A comprehensive model for battery aging and customer service quality. IEEE Transactions on Transportation Electrification, 6(3), 1026–1034. DOI 10.1109/TTE.2020.3005875. [Google Scholar] [CrossRef]
13. Richardson, D. B. (2013). Electric vehicles and the electric grid, A review of modeling approaches, impacts, and renewable energy integration. Renewable & Sustainable Energy Reviews, 19(1), 247–254. DOI 10.1016/j.rser.2012.11.042. [Google Scholar] [CrossRef]
14. Hannan, M. A., Hoque, M. M., Mohamed, A., Ayob, A. (2017). Review of energy storage systems for electric vehicle applications, issues and challenges. Renewable & Sustainable Energy Reviews, 69(7), 771–789. DOI 10.1016/j.rser.2016.11.171. [Google Scholar] [CrossRef]
15. Krueger, H., Cruden, A. (2018). Modular strategy for aggregator control and data exchange in large scale Vehicle-to-Grid (V2G) applications. Energy Procedia, 151(2), 7–11. DOI 10.1016/j.egypro.2018.09.019. [Google Scholar] [CrossRef]
16. Hu, X., Wang, K., Liu, X., Sun, Y., Li, P. et al. (2018). Energy management for EV charging in software-defined green vehicle-to-grid network. IEEE Communications Magazine, 56(5), 156–163. DOI 10.1109/MCOM.2018.1700858. [Google Scholar] [CrossRef]
17. He, D., Chan, S., Guizani, M. (2018). Privacy-friendly and efficient secure communication framework for V2G networks. IET Communications, 12(3), 304–309. DOI 10.1049/iet-com.2017.0608. [Google Scholar] [CrossRef]
18. Shen, G., Su, Y., Zhang, M. (2018). Secure and membership-based data sharing scheme in V2G networks. IEEE Access, 6, 58450–58460. DOI 10.1109/ACCESS.2018.2874622. [Google Scholar] [CrossRef]
19. Li, G., Wu, J., Li, J., Ye, T., Morello, R. (2017). Battery status sensing software-defined multicast for V2G regulation in smart grid. IEEE Sensors Journal, 17(23), 7838–7848. DOI 10.1109/JSEN.2017.2731971. [Google Scholar] [CrossRef]
20. Wang, S., Wu, J., Zhang, S., Wang, K. (2018). SSDS, a smart software-defined security mechanism for vehicle-to-grid using transfer learning. IEEE Access, 6, 63967–63975. DOI 10.1109/ACCESS.2018.2870955. [Google Scholar] [CrossRef]
21. Chen, K., Niu, Y. (2019). Real-time scheduling strategy of electric vehicle based on vehicle-to-grid application. Power System Protection and Control, 47(14), 1–9. [Google Scholar]
22. Zhang, Y., Liu, Q., Hong, C., Tang, G. (2019). Charging and discharging dispatch strategy of regional V2G based on fuzzy control. Electric Power Automation Equipment, 39(7), 147–153. DOI 10.16081/j.issn.1006-6047.2019.07.022. [Google Scholar] [CrossRef]
23. Chen, Z., Wang, C., Chen, J., Cai, J., Xue, H. (2019). Study on coordinated charging and discharging control model of electric vehicles under V2G mode. Zhejiang Electric Power, 38(8), 37–42. [Google Scholar]
24. Ge, Z. Q. (2017). Review on data-driven modeling and monitoring for plant-wide industrial processes. Chemometrics and Intellgent Laboratory Systems, 171(12), 16–25. DOI 10.1016/j.chemolab.2017.09.021. [Google Scholar] [CrossRef]
25. Yang, X., Zhang, Y., Shardt, Y., Li, X. L., Cui, J. R. et al. (2020). A KPI-based soft sensor development approach incorporating infrequent, variable time delayed measurements. IEEE Transactions on Control Systems Technology, 28(6), 2523–2531. DOI 10.1109/TCST.2019.2929478. [Google Scholar] [CrossRef]
26. Zhu, J. L., Ge, Z. Q., Song, Z. H. (2018). Review and big data perspectives on robust data mining approaches for industrial process modeling with outliers and missing data. Annual Reviews in Control, 46(12), 107–133. DOI 10.1016/j.arcontrol.2018.09.003. [Google Scholar] [CrossRef]
27. Zhao, S. Y., Huang, B., Liu, F. (2017). Linear optimal unbiased filter for time-variant systems without apriori information on initial conditions. IEEE Transactions on Automatic Control, 62(2), 882–887. DOI 10.1109/TAC.2016.2557999. [Google Scholar] [CrossRef]
28. Zhao, S. Y., Huang, B. (2020). Trial-and-error or avoiding a guess? Initialization of the Kalman filter. Automatica, 121(21), 109184. DOI 10.1016/j.automatica.2020.109184. [Google Scholar] [CrossRef]
29. Hanani, U., Shapira, B., Shoval, P. (2001). Information filtering, overview of issues, research and systems. User Modeling and User-Adapted Interaction, 11(3), 203–259. DOI 10.1023/A:1011196000674. [Google Scholar] [CrossRef]
30. Zhao, S. Y., Yuriy, S., Shmaliy, A. C., Zhao, C. H. (2020). Probabilistic monitoring of correlated sensors for nonlinear processes in state space. IEEE Transactions on Industrial Electronics, 67(3), 2294–2303. DOI 10.1109/TIE.2019.2907505. [Google Scholar] [CrossRef]
31. Yang, X., Gao, J. J., Huang, B. (2021). Data-driven design of fault detection and isolation method for distributed homogeneous systems. Journal of the Franklin Institute, 358(9), 4929–4949. DOI 10.1016/j.jfranklin.2021.04.016. [Google Scholar] [CrossRef]
32. Huang, J., Yang, X., Peng, K. X. (2021). Double layer distributed monitoring based on sequential correlation information for large-scale industrial processes in dynamic and static states. IEEE Transactions on Industrial Informatics, 17(9), 6419–6428. DOI 10.1109/TII.2020.3019499. [Google Scholar] [CrossRef]
33. Zhang, X., Li, Y., Cao, W. (2016). Method of active power measurement under condition of distortion signal. Journal of Electric Machines and Control, (6), 87–93. DOI 10.15938/j.emc.2016.06.011. [Google Scholar] [CrossRef]
34. Cui, J., Zhou, J., Xu, Z., Zhang, Z., Li, Q. (2018). Review of active power measuring methods for vehicle-to-grid (V2G), pp. 1448–1453. Xi’an, China: CAC. [Google Scholar]
 | This work is licensed under a Creative Commons Attribution 4.0 International License, which permits unrestricted use, distribution, and reproduction in any medium, provided the original work is properly cited. |