| Computer Modeling in Engineering & Sciences |
DOI: 10.32604/cmes.2022.018349
ARTICLE
Reliability Analysis for Retaining Pile in Foundation Pit Based on Bayesian Principle
Research Center of Plie-supported Structures, Xi’an University of Science and Technology, Xi’an, 710054, China
*Corresponding Author: Chengpu Peng. Email: 19204053003@stu.xust.edu.cn
Received: 18 July 2021; Accepted: 30 August 2021
Abstract: Moso bamboo has the advantages of high short-term strength and reproducibility, appropriating for temporary supporting structure of shallow foundation pit. According to the displacement of the pile top from an indoor model test, the reliability of the supporting effect of the moso bamboo pile was analyzed. First, the calculation formula of reliability index was deduced based on the mean-value first-order second-moment (MVFOSM)method and probability theory under ultimate limit state and serviceability limit state. Then, the dimensionless bias factor (the ratio of the measured value to the calculated value) was introduced to normalize the displacement. The mathematical characteristics of the displacement were estimated and optimized based on Bayesian theory. Finally, taking 2.5 as the design reliability index, the effect of safety factor, tolerable limit displacement, and the ratio of the ultimate limit displacement to the tolerable on reliability index was analyzed. The results show that the safety level of the supporting pile can be increased by 1–2 levels when the safety factor increases by 0.5. When the coefficient of variation of tolerable limit displacement is less than 0.3, the safety factor can be 2–2.5. And the ratio of the ultimate limit displacement to the tolerable has a great influence on the reliability index, when the soil conditions is well, the ratio can be 1.2–1.3.
Keywords: Moso bamboo pile; shallow foundation pit; reliability; sensitivity; Bayesian theory
In the process of urban-rural integration construction, there are lots of shallow foundation engineering in the soft soil area. The engineering was not usually supported, because of the effect of excavation length, safety awareness, and engineering cost, causing many safety accidents [1]. To solve the problem and respond to the conception of national green development conception and eco-friendly building, moso bamboo is used as the supporting material for shallow foundation pit. The supporting effect in the shallow foundation pit was verified by an indoor model test [2] and engineering application [3]. To ensure that the supporting piles can meet the requirements of engineering, the reliability analysis will be carried out.
Structural reliability is the ability to complete a specific function during the prescribed time under the prescribed conditions, using reliable degree or failure probability as evaluation indices [4]. At present, relevant scholars at home and abroad have achieved many results in the field of reliability analysis. Bayesian theory has played a certain role in determining the random field parameters and related functions of soil parameters [5]. To reasonably characterize the spatial variability of soil parameters, Yang et al. [6] combined the limit equilibrium method and finite element method to analyze the influence of soil parameters on the displacement of slope. Huang et al. [7] analyzed the influence of the grouting method and soil condition of bearing layer on reliability index according to lots of static test data of drilling piles. Aladejare et al. [8] utilized Bayesian theory to establish probability distribution function, analyzed the effect of the correlation of soil parameters on the reliability index. Soil is a three-phase material, the parameters of soil are discontinuity, so the indeces of soil are difficult to be accurately determined. Fan et al. [9,10] studied the variation of soil characteristics along the pile length. Sun et al. [11] stated that internal friction angle of soil has a great influence on reliability index based on the Monte Carlo (MC) method. Zhang et al. [12] put forward an efficient calculation method of reliability index based on the probability density function and the Bootstrap method to solve the problem of determining mathematical characteristics of geotechnical parameters. Du et al. [13] established four failure models to research the influence of soil parameters on reliability index. Saseendran et al. [14] considered the uncertainty of the system parameters of the pile-slope, used the response surface method to derive the implicit function and to conduct the reliability analysis of its system safety. Jiang et al. [15] established normal distribution random field and lognormal distribution random field and clarified the influence of parameters changes on slope reliability index. Data discretization is an extreme problem in the indoor model test. To solve the problem in processing data is important. Zheng et al. [16,17] used Bayesian theory to optimize data, solving the problem of testing and monitoring data discretization. Xu et al. [18] improved the MVFOSM method, effectively reduced the non-linear iteration process, and established a revised function to ensure the accuracy of calculated results. Xin et al. [19] introduced the Coupula function to analyze the correlation between different parameters based on the problem of data discretization. Liu et al. [20] calculated the autocorrelation distance of soil parameters based on the recursive average method, which reduced the dispersion of parameters and made the calculation more accurate. What is more, Su et al. [21] introduced Gaussian process method in the reliability analysis of a slope, the method has a good accuracy and efficiency. Zhu et al. [22] proposed a novel Gaussian process surface method, constructing random field by Karhunen-Loeve expansion and the limit equilibrium method to evaluate the stability of slopes.
Among the existing research results, Bian et al. [23] analyzed the linear relationship of βuls and βsls (reliability index of pile bearing vertical load, under ultimate limit state and serviceability limit state, respectively). Referring to the above-mentioned methods, according to the model factors and distribution type of displacement, the calculation method of reliability index, used for supporting pile of foundation pit under different limit state, was deduced. The reliability index was calculated by the MVFOSM method, the JC method and the mapping transformation method, and verified by the MC method. Combining Bayesian theory, the effect of safety factor, tolerable limit displacement, and the ratio of the ultimate limit displacement to the tolerable on reliability index was analyzed. The results can provide a reasonable evaluation basis for the design of supporting structure used in foundation pit.
2 Uncertainty Analysis of Limit State
2.1 Serviceability Limit State
According to the failure principle, the limit state of the supporting pile can be divided into ultimate limit state and serviceability limit state. Under the serviceability limit state, the displacement is up to the design value, but the soil around the foundation pit has not failed. And the supporting structure has not been functionally damaged and still has a certain bearing capacity. However, the pile top displacement increases abruptly, and the supporting structure fails in the ultimate limit state. Therefore, the performance function should be established according to the different limit states during the reliability analysis of the supporting pile.
In the design of the supporting structure used in the foundation pit, the warning limit of displacement should be set and less than the ultimate limit value. Once dm (measured displacement) exceeds the warning limit, the supporting structure should be strengthened, to prevent greater displacement. In the paper, the warning limit is defined as tolerable limit, and the limit state function is named as serviceability limit state function. In the design of the supporting structure, K (safety factor) is usually introduced, defined as the ratio of dtol (tolerable displacement) to dp (calculated displacement), shown as Eq. (1).
In the Eq. (1), μdtol and μdp are the average of the tolerable displacement and the calculated displacement.
The test data in the paper comes from many tests [24]. In the test, soil, moso bamboo pile and mass block used as experimental load are quite different. dp and dm of the supporting pile are affected by uncertain factors such as the soil, the loading conditions and the pile materials. The data cannot be compared straightly, and the data is limit under the same test conditions. To increase the sample and eliminate the error in the displacement data of bamboo piles, the collected data are normalized, and the dimensionless bias factor is introduced, defined as the ratio of dm to dp, shown as Eq. (2).
The significance of introducing the bias factor is to consider the difference of dp and dm, and make the expected results clear. Taking the bias factor as the basic parameter, analyze the influence of its mathematical characteristics on the reliability index.
According to the conception of reliability, when Z = 0, it means that the supporting pile is in a critical state. While Z < 0, dtol is less than dm, it can be judged that the normal use performance is invalid, and further measures need to be taken. The failure probability of the supporting pile can be shown as Eq. (3).
When λ, dtol, dp, dm obey lognormal distribution, according to the limit state equation and the MVFOSM method, the failure probability of supporting pile under serviceability limit state can be expressed as Eq. (4). According to the probability limit state method, the reliability index of supporting pile under serviceability limit state can be calculated, shown as Eq. (5).
In Eqs. (4) and (5), μlndtol, σlndtol represent the logarithmic mean value and logarithmic standard deviation of the tolerable displacement, respectively.
The displacement limit state equation established above takes dtol as a standard for the critical state of the support performance. The reliability analysis based on the basis belongs to the reliability design under the serviceability limit state. When dp exceeds the tolerable limit, it indicates that the supporting capacity has not reached the expected goal, but the supporting capacity has not been lost completely. The failure probability of supporting pile under ultimate limit state can be expressed as Eq. (6).
During the loading period of the indoor model test, the load was not up to the ultimate bearing capacity of the supporting pile, so the ultimate displacement of the pile top could not be obtained. However, the S-logt failure principle shows that the displacement corresponding to the stage of the steep drop at the end of the curve is the calculated limit displacement. Therefore, the load-displacement data collected from the indoor model test was processed by the p-d curve, which is expressed as Eq. (7). The reliability index of supporting pile under the ultimate limit state can be calculated, shown as Eq. (8).
In the equation, λu is the ratio between the ultimate limit displacement and the tolerable,
3 Optimization Based on Bayesian Theory
3.1 Distribution Test of Related Variables
Calculating the reliability index should consider the distribution characteristics of the index. According to dp and dm, the bias factor of the supporting pile can be calculated. Based on the K-S test method and the significance level is 0.05, the distribution characteristics of dm, dp, and λ were analyzed to check whether the variables conform to normal distribution, lognormal distribution, or the Gumbel distribution. The distribution test results are shown in Table 1.
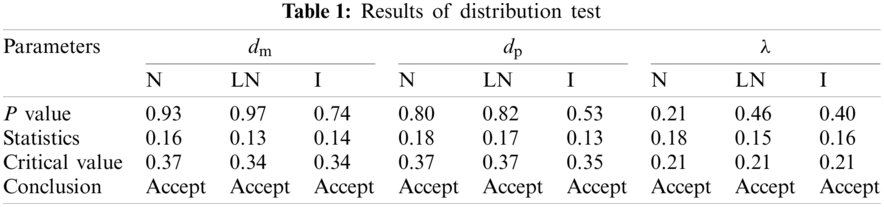
In Table 1, N, LN, I represent normal distribution, lognormal distribution, the Gumbel distribution, respectively. The results based on the K-S test show that the statistics of dm, dp, and λ are less than the critical values. Therefore, the assumptions of the distribution type of the basic variables can be accepted. In the test results, the lognormal distribution corresponds to the largest similarity, so the samples are more consistent with the lognormal distribution. Consequently, in the following analysis, the distribution of the basic variables is seemed as lognormal distribution to deduct the relative calculated formula.
3.2 Bayesian Optimization Principle
A large amount of accurate test data can effectively reduce the design error. But considering the design and cost of indoor model tests, collecting lots of test data is difficult. Based on the problem, Zheng et al. [16,17] combined mathematical statistics and the Bayesian principle, defined the relative deviation (ζ) of the model factor and proposed the Bayesian optimal estimation of the model factor. The calculation of ζ is shown in Eq. (9).
In the reference [25], according to the relative deviation, the test data can be divided into three levels: good, general and bad. After the division of test data, the general data are optimized by Bayesian optimization estimation. Because the difference between the bad data and other data is too large, the error of reliability of analysis will be caused, so it should be discarded.
The judgment basis of dividing data is as follows:
(1) Good data: ζ < 0.25
(2) General data: ζ ≤ 0.25 < 0.5
(3) bad data: ζ ≥ 0.5
According to the types of data, the good data are set as the prior distribution. When the data conform to the normal distribution, the prior density function of the variable is as Eq. (10). μ1 and σ1 are the mean value and standard deviation of the variables, respectively.
Assuming the general data are a likelihood function, the mean value and standard deviation are μ2 and σ2, respectively. So the μ2 and σ2 of the posterior distribution of variables are calculated as Eqs. (11) and (12).
On the basis of the above analysis, the model factor conforms to a lognormal distribution. Therefore, the mean value and standard deviation of the posterior distribution are needed to be transformed, calculated as Eqs. (13) and (14).
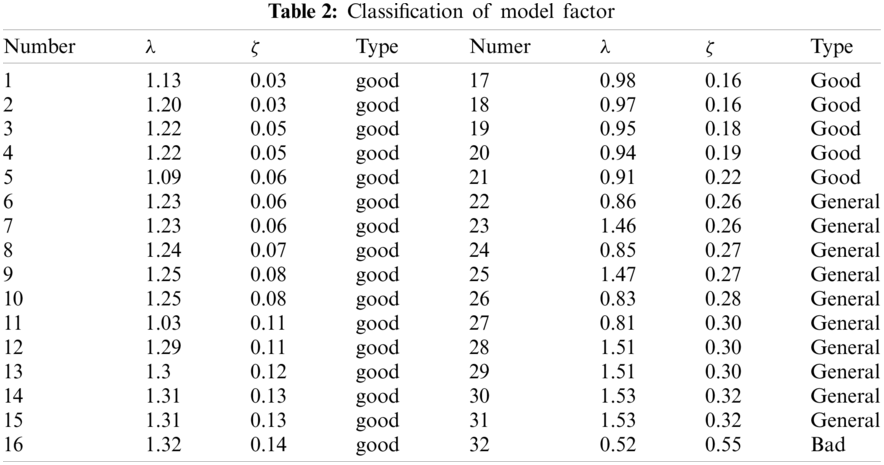
Submitting the collected test data into Eq. (8) to calculate the model factor, then calculating the relative deviation of the calculated results according to Eq. (9) and classifying the model factors according to the relative deviation. The classification results are shown in Table 2. In the Table 2, 21 sets are good, 10 sets are general, and only 1 set is bad. The model factor range of 0.91–1.32 is good data, the general data range is 0.81–0.86 and 1.46–1.53. The model factor value of bad data is 0.55.
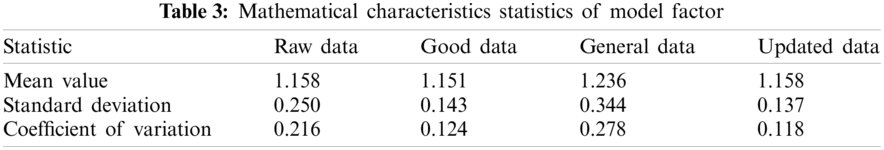
The bad data is discarded. Using Eqs. (13) and (14) to optimize the remaining data. The statistical analysis of the optimized data is shown in Table 3. The mean value of the raw data is equal to that of the updated data. But the coefficient of variation of the former is twice that of the latter. Therefore, the Bayesian optimal estimation can better solve the problem of data discretization.
In the light of the mean value, standard deviation, and coefficient of variation of the updated data, the reliability index of supporting pile under serviceability limit state was calculated based on the MVFOSM method, the JC method, the mapping transformation method, and the MC method. The calculated equation of the MVFOSM method is shown as Eq. (4). The coefficient of variation of the calculated displacement (δdp) was calculated from the test data, δdp = 0.12. The coefficient of variation of dtol and dm was the same. The performance function of the JC method and the MC method is calculated as Eq. (15). The reliability indices of each method were calculated in the MATLAB software. The calculated results are shown in Table 4.
As known in Table 4, the calculated value using the updated data is higher than the results using the raw data. The mean value of the raw data and the updated data is the same. Because the mean value of the likelihood function is small, and the coefficient of variation is large, so the coefficient of variation of the raw data is large and the calculated reliability index is small. Considering the distribution type of the data, the Bayesian optimal estimation optimizes the mean value and coefficient of variation of likelihood function based on prior distribution function, revises the bad data, and reduces its influence on reliability analysis.
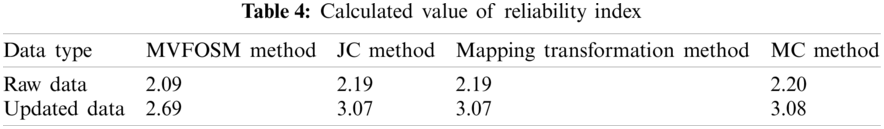
There is a difference in the calculated results between different calculation methods. The difference of using the MVFOSM method is the smallest, only 0.60. The difference between the JC method, the mapping transformation method and the MC method is equal, the value is 0.88. The results of the JC method and the mapping transformation method are higher than the results of the MVFOSM method, the smallest difference is 0.1 and the largest is 0.38. Because the calculated results of the JC method and the mapping transformation method are the same, so the next reliability analysis uses the two methods to calculate the reliability index, and use the MC method to check the calculated results.
According to the reference [25], the security level is classified by the reliability index, shown in Table 5. In the paper, the designed reliability index is 2.5. According to the Federal Highway Administration Load and Resistance Factor Design (LRFD) for Highway Bridge Substructures [26], the safety factor of designing pile structures is specified. The theoretical analysis and static load test of safety factor are 3.5 and 2.0, respectively. Moso bamboo pile is a new material of pile. Compared with the concrete pile, the actual engineering experience and theory are not complete. Therefore, the safety factor is in the range of 2.0–3.5. Using the MVFOSM method, the JC method and the MC method to calculate reliability index βsls, the results are shown in Fig. 1. The influence of safety factors on reliability was analyzed. The range of safety factors was discussed under the condition of ensuring the safety level.
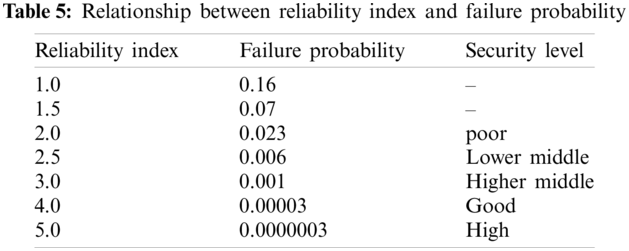
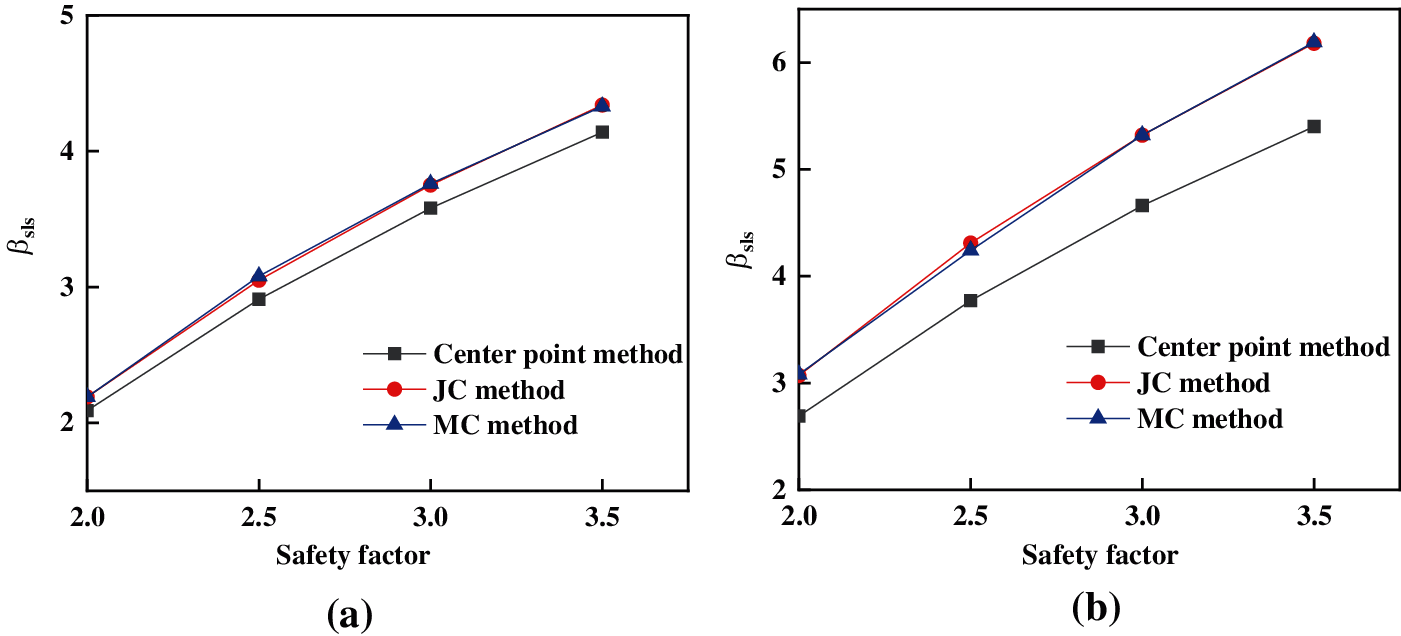
Figure 1: The influence of safety factor on the reliability index (a) Raw data (b) Updated data
The reliability index increases with the increase of the safety factor. When the safety factor is 2.5, the smallest reliability index is 3.00, the largest is 3.08. As known in Fig. 1, when the reliability index is within 2.5–3.5, the security level is medium. And according to the three methods, the failure probability of supporting pile under serviceability limit state is about 1%. According to the investigation report of the foundation pit accident, the accident probability of foundation pit without a supporting structure is about 21.8% [1]. Comparing with the two sets of data, it is obvious that the use of the Moso bamboo pile as a supporting structure can significantly improve the safety of shallow foundation pits.
As shown in Fig. 1, the calculated reliability index using the updated data is significantly higher than the calculation result based on the raw data. When the safety factor is 2.0, the reliability index of the former is close to the latter when the safety factor is 2.5. The reliability index of using the MVFOSM method is less than the value of using the JC method and the MC method, but the security level is the same and the failure probability is less than 6%. The reliability index keeps substantially increasing with the increase of safety factor. When the safety factor is 2.5, the reliability index of using the MVFOSM method is 3.99, the security level is high, and the failure probability is less than 0.03%. With the same safety factor, the reliability of using the JC method and the MC method is 4.31 and 4.24, the security level is high, and the failure probability is less than 0.0003%. When the safety factor is 3.5, the reliability index is too large, the supporting capacity is excessive, and the cost is too high to meet the economic requirements of the engineering. Therefore, the reliability corresponding to the safety factor is not considered.
Because of the influence of soil parameters, underwater and other uncertain factors, it is difficult to determine the specific limit displacement of the foundation pit. Therefore, in the process of calculating the reliability index under the ultimate limit state, the coefficient of variation of the ratio of the limit displacement to the tolerable (
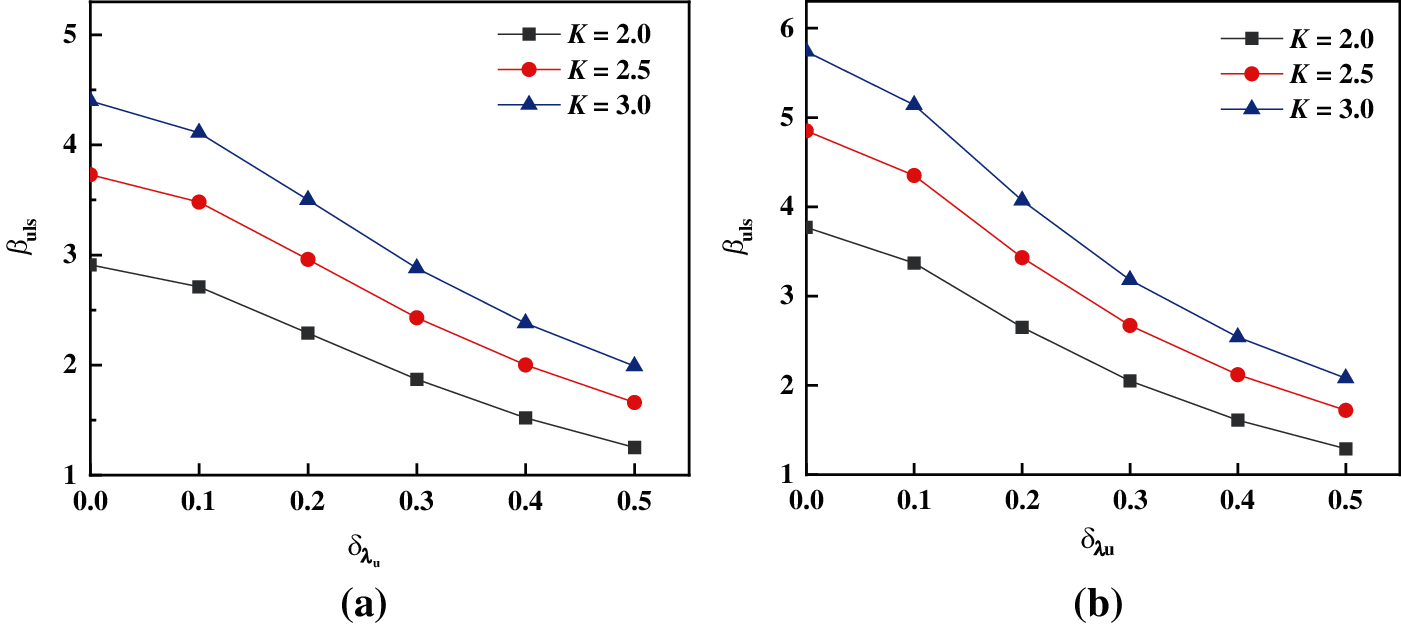
Figure 2: The influence of
As shown in Fig. 2, when the variables are the same, the reliability index of using updated data is higher than the value of using raw data, and the difference is gradually reducing with the increase of
βuls decreases with the increase of
Tolerable displacement is a basic variable of the limit state equation and a standard for judging whether the supporting structure meets the normal use. In the design of the supporting structure, the tolerable displacement should be firstly determined according to relative parameters and engineering experience. The target value is determined according to tolerable displacement and safety factor, and the target value is a key index to determine other parameters of the supporting pile. Therefore, dtol is a standard to guide dp. The deviation of dtol determines whether the designed displacement is reasonable. Taking δdtol as a basic variable, the range is 0–0.5, the influence of dtol on βsls is analyzed. The calculated results are shown in Fig. 3.
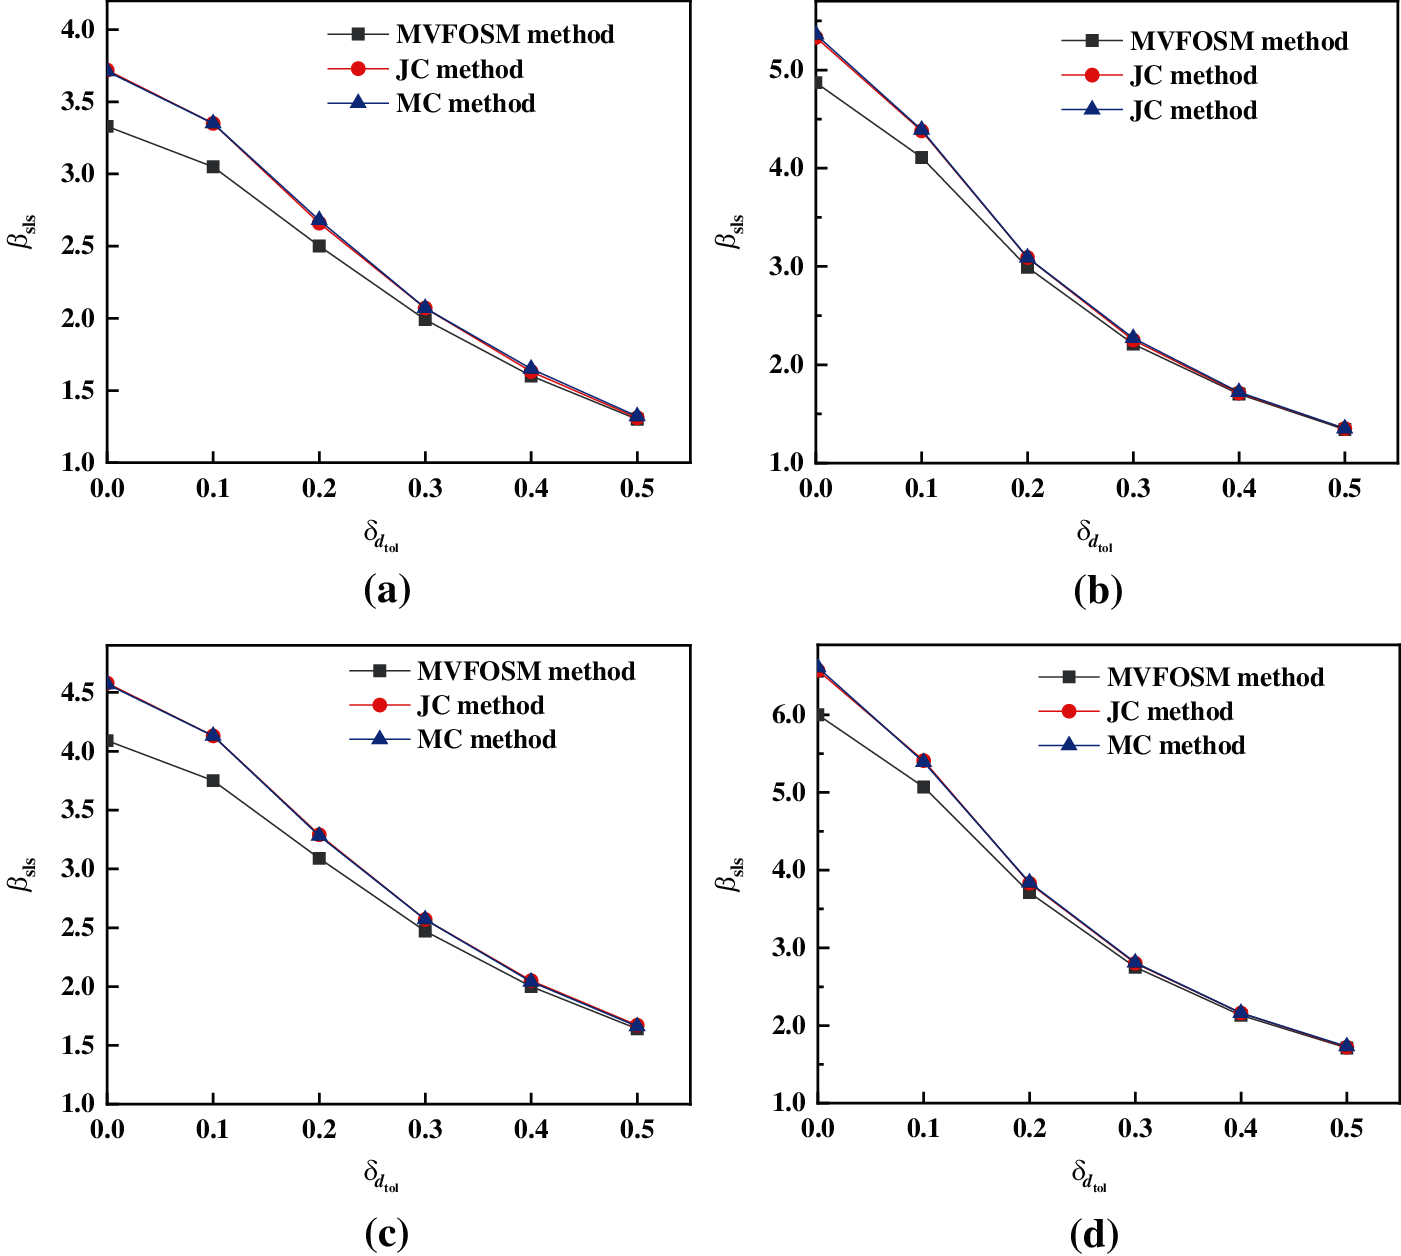
Figure 3: The influence of
When δdtol is in the range of 0–0.3, the βsls of using the updated data is significantly higher than the value of using the raw data, the largest difference is 1.91, the smallest is 0.22. the correction performance of the prior distribution function in Bayesian optimal estimation still plays an active role. Taking βsls ≥ 2.5 as the goal reliability, it means that the security level is medium and above. When δdtol = 0.2, the βsls of using the three methods are about 3.0, meeting the design requirement. If the δdtol is too large because of extreme factors, the safety factor can be increased properly.
βsls fluctuates greatly with the change of δdtol. Taking K = 2.5 as an example, δdtol varies from 0 to 0.5. The βsls based on the raw data and the updated data decreases 2.03 and 3.53, respectively. In the design of the supporting pile, if dtol varies greatly, it will affect the rationality of dp of foundation pit, indirectly reduce K, and cause the reliability index to drop. Therefore, the dtol is important to K.
βuls decreases greatly with the increase of δdtol. When δdtol = 0.4, the reliability index of using updated data is still larger than 2.5, the security level is medium and above.
4.3 Ratio of Limit Displacement to Tolerable Displacement
In the design of the supporting structure, the ratio of limit displacement to tolerable displacement (λu) is a subjective judgment based on objective factors and experience. λu is another safety factor in the reliability analysis under the ultimate limit state. Taking λu as a basic variable to calculate βuls based on the MVFOSM method, the influence of
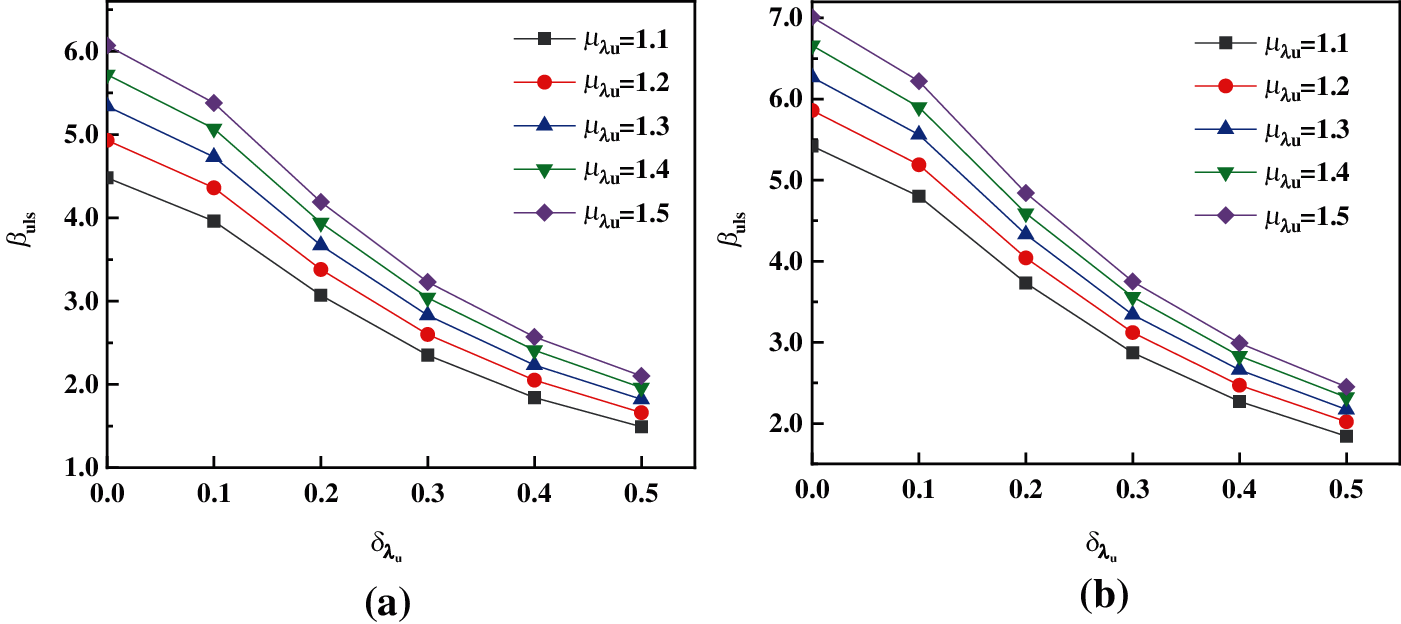
Figure 4: The influence of λu on the reliability index (a) Updated data (K = 2.5) (b) Updated data (K = 3.0)
The influence of
βuls increases gradually with the increase of
(1) Using the Bayesian principle to optimize and estimate test data, the mean value of the raw data and the updated data are the same, but the coefficient of variation of the former is two times of the latter. And the β of using the updated data is higher than that of using the raw data. The Bayesian principle can efficiently reduce the influence of test error on relative parameters, and solve the problem of data discretization.
(2) The safety factor increases by 0.5, the safety of the supporting structure can be increased by 1 to 2 levels.
(3) Taking βsls ≥ 2.5 as the goal reliability, when δdtol = 0.2, the βsls based on the updated data is about 3.0, meeting the safety requirement. If the δdtol is too large because of extreme factors, the safety factor can be increased properly to meet safety requirements.
(4) The ratio of limit displacement to tolerable displacement has a great influence on βuls. When
Data Availability: The data used to support the findings of this study are included in the article.
Funding Statement: The research described in the paper was supported by the National Natural Science Foundation of China (No. 51878554) Key projects of Shaanxi Natural Science Basic Research Program (No. 2018JZ5012).
Conflicts of Interest: The authors declare that they have no known competing financial interests or personal relationships that could have appeared to influence the work reported in this paper.
1. Li, L. Y., Li, R. Z., Lei, Z. X. (2017). Study on pattern of foundation pit accident based on statistical analysis. Modern Urban Transit, 12, 50–55. [Google Scholar]
2. Deng, Y. S., Wang, H., Yang, M. (2016). Model tests on shallow excavation support through bamboo micro-pile. Rock and Soil Mechanics, 37(S2), 294–300. DOI 10.16285/j.rsm.2016.S2.036. [Google Scholar] [CrossRef]
3. Zhen, G. X. (2014). New building foundation pit supporting technologies with low carbon environmental protection. Fujian Construction Science & Technology, 2, 1–5. [Google Scholar]
4. Zhao, G. F., Gong, J. X., Zhao, S. C. (2000). Developments of reliability research for civil engineering structure in China. Journal of Dalian University of Technology, 3, 253–258. [Google Scholar]
5. Tian, M., Li, D. Q., Cao, Z. J. (2017). Quantification of spatial variability of soil parameters using bayesian approaches. Rock and Soil Mechanics, 38(11), 3355–3362. DOI 10.16285/j.rsm.2017.11.035. [Google Scholar] [CrossRef]
6. Xue, Y., Wu, Y. P., Miao, F. S., Li, L. W. (2021). Back analysis of shear strength parameters of sliding surface by using combination method of random field and Bayes theory. Journal of Zhejiang University (Engineering Science), 55(6), 1118–1127. DOI 10.3785/j.issn.1008-973X.2021.06.012. [Google Scholar] [CrossRef]
7. Huang, S. G., Shen, J. H., Li, M. (2019). Reliability analysis of bearing capacity of post-grouted bored piles. Rock and Soil Mechanics, 40, 1977–1982. DOI 10.16285/j.rsm.2018.0332. [Google Scholar] [CrossRef]
8. Aladejare, A. E., Wang, Y. (2018). Influence of rock property correlation on reliability analysis of rock slope stability: From property characterization to reliability analysis. Geoscience Frontiers, 9(6), 1639–1648. DOI 10.1016/j.gsf.2017.10.003. [Google Scholar] [CrossRef]
9. Fan, H. J., Huang, Q. D., Liang, R. (2014). Reliability analysis of piles in spatially varying soils considering multiple failure modes. Computers and Geotechnics, 57(2), 97–104. DOI 10.1016/j.compgeo.2014.01.009. [Google Scholar] [CrossRef]
10. Fan, H. J., Liang, R. (2015). Importance sampling based algorithm for efficient reliability analysis of axially loaded piles. Computers and Geotechnics, 65(2), 278–284. DOI 10.1016/j.compgeo.2015.01.005. [Google Scholar] [CrossRef]
11. Sun, Y. D. (2017). Stability analysis of deep excavation based on reliability theory. China University of Geosicence, Beijing. [Google Scholar]
12. Zhang, L. S., Li, D. Q., Cao, Z. J., Tang, X. S. (2019). Efficient reliability analysis of excavation deformation considering statistical uncertainty using Monte Carlo simulation. Engineering Journal of Wuhan University, 52(3), 207–215. DOI 10.14188/j.1671-8844.2019-03-004. [Google Scholar] [CrossRef]
13. Du, X. L., Cao, X. X., Zhong, Z. L., Hou, B. W. (2020). Robust geotechnical design of soil-pile foundation system considering multiple failure modes. Chinese Safety Science Journal, 30(6), 23–30. DOI 10.16265/j.cnki.issn1003-3033.2020.06.004. [Google Scholar] [CrossRef]
14. Saseendran, R., Dodagoudar, G. R. (2020). Reliability analysis of slopes stabilized with piles using response surface method. Geomechanics and Engineering, 21(6), 513–525. DOI 10.12989/gae.2020.21.6.513. [Google Scholar] [CrossRef]
15. Jiang, S. H., Liu, S. H., Huang, J. S. (2020). Non-intrusive reliability analysis of unsaturated embankment slopes accounting for spatial variabilities of soil hydraulic and shear strength parameters. Engineering with Computers, 7, 1–14. DOI 10.1007/s00366-020-01108-6. [Google Scholar] [CrossRef]
16. Zheng, J. J., Xu, Z. J., Liu, Y. et al. (2012). Bayesian optimization for resistance factor of piles. Chinese Journal of Geotechnical Engineering, 34, 1716–17241. [Google Scholar]
17. Zheng, J. J., Liu, S. Q., Xun, Z. J. (2012). Bayesian estimation of design values of bearing capacity of foundation piles. Bridge Construction, 42, 41–45. [Google Scholar]
18. Xu, Z. J., Han, X., Zheng, J. J. (2020). Study on reliability optimization design method of piles under vertical loads. Journal of Huazhong University of Science and Technology (Natural Science Edition), 48, 55–60. DOI 10.13245/j.hust.200511. [Google Scholar] [CrossRef]
19. Xin, J. X., Wu, X. Z., Gao, W. (2016). Copula-based analysis of load-displacement curves of cement-fly ash-gravel pile. Rock and Soil Mechanics, 37(S1), 424–434. DOI 10.16285/j.rsm.2016.S1.055. [Google Scholar] [CrossRef]
20. Liu, C., Yuan, Y., Zuo, Z. H. (2020). Pile reliability design considering the influence of soil auto-correlation distance. Hydrogeology & Engineering Geology, 47(3), 122–127. DOI 10.16030/j.cnki.issn.1000-3665.201910004. [Google Scholar] [CrossRef]
21. Su, G. S., Xiao, Y. L. (2011). Guassian process method for slope reliability analysis. Chinese Journal of Geotechnical Engineering, 33(6), 916–920. [Google Scholar]
22. Zhu, B., Pei, H. F., Yang, Q. (2019). Gaussian process regression-based response surface method and reliability analysis of slopes. Chinese Journal of Geotechnical Engineering, 41(s1), 209–212. [Google Scholar]
23. Bian, X. Y., Zheng, J. J., Xu, Z. J. et al. (2015). Target reliability index for serviceability limit state of single piles. Journal of Central South University, 22(1), 310–316. DOI 10.1007/s11771-015-2523-9. [Google Scholar] [CrossRef]
24. Cheng, Z. H. (2020). Study on bearing characteristics of dentate bamboo pile-Soil composite support system (Master’s Thesis). Xi’an University of Science and Technology. [Google Scholar]
25. Zhen, J. J., Liu, Y., Guo, J. (2009). Probabilistic analysis and reliability assessment for acceptance rate of foundation pile testing. Chinese Journal of Geotechnical Engineering, 31, 1660–1664. [Google Scholar]
26. American Association of State Highway and Transportation Officials (AASHTO) (2007). Load and resistance factor design (LRFD) for bridge design specifications (4th ed.). Washington DC: American Association of State Highway and Transportation Officials. [Google Scholar]
 | This work is licensed under a Creative Commons Attribution 4.0 International License, which permits unrestricted use, distribution, and reproduction in any medium, provided the original work is properly cited. |