| Computer Modeling in Engineering & Sciences |
DOI: 10.32604/cmes.2022.018207
ARTICLE
The Material Deformation and Internal Structure Development of Granular Materials under Different Cyclic Loadings
1School of Mechanics and Engineering, Southwest Jiaotong University, Chengdu, 610031, China
2Department of Engineering Mechanics, Wuhan University, Wuhan, 430072, China
3School of Marine Engineering Equipment, Zhejiang Ocean University, Zhoushan, 326022 China
*Corresponding Authors: Jiao Wang. Email: wangjiao@swjtu.edu.cn; Xihua Chu. Email: chuxh@whu.edu.cn
Received: 07 July 2021; Accepted: 25 August 2021
Abstract: Common structures in engineering such as slopes, roadbeds, ballasts, etc., are closely related to granular materials. They are usually subjected to long-term cyclic loads. This study mainly focused on the mechanical behaviors of randomly arranged granular materials before they reach a stable state under different cyclic loads. The variation of the maximum axial strain and the influence of CSR (cyclic stress ratio) were analyzed. The energy consumed in each cycle under constant confining stress loading condition is significantly greater than that of the fixed wall loading condition. The internal deformation evolution of granular materials is studied in detail. The deformation mode of granular material under cyclic loading at different positions inside the material is different according to the strain variation. In addition, the strain, force chain structure and contact force magnitude are combined to explore their effects on local deformation of granular materials under cyclic loading. From the perspective of the deformation form, the material sample can be divided into several regions, and the ability to adjust particle positions determines the deformation mode of different regions. The changes of local strain with the cyclic loading also reflect the contribution of particle displacements to the evolution of microstructure. This research will provide insights into the understanding of granular materials behaviors under cyclic loading.
Keywords: Granular material; DEM; cyclic loading; mesostructured; force chain
Granular materials are widely present in nature and human activities, such as sand composed of soil particles and powder materials in chemical engineering. Numerous loading and unloading cycles may occur in granular assemblies. Under cyclic loading, materials usually show a gradually decreasing effective stress and the accumulation of limited shear deformation. Extensive researches have been conducted on granular materials under cyclic loading [1]; however, the experimental results are usually macroscopic measurements. The evolution process of the microstructure of the material and its influencing factors still need further study. Understanding the micromechanical behavior of granular media, especially the microstructure mechanism, will promote our comprehensive understanding of the mechanics of granular materials. Jiang et al. [2] and Tian et al. [3] linked the evolution of the mesostructure with the macromechanical response of granular materials, which can give us some inspiration. It will be carried out in this research considering the evolution of fabrics and complex force chain networks from a microscopic perspective.
Discrete element method (DEM) has been used to obtain microscopic or mesoscopic information which can be conveniently used to examine the evolution of the material structures and fabrics which cannot be directly observed in routine lab tests [4,5]. Sitharam et al. [6] and Phusing et al. [7] showed the ability of DEM to study the cyclic material behavior. Coordination number and sliding contact fraction were used to explain the macrobehavior in cyclic loading. The macro-micro relationship is explained using the relationship between the stress ratio and the fabric structures of all contacts, and of only the strong contacts. The granular material micromechanical properties were studied by Sazzad [8] and Rothenburg et al. [9] using DEM biaxial tests. They created a link between macro- and meso-parameters by analyzing the coordination number and contact network evolution. In order to study the influence factors of cyclic loading on soil strength under triaxial tests, Wichtmann et al. [10,11] conducted numerous undrained cyclic triaxial tests with stress or strain cycles applied to samples consolidated isotropically or anisotropically. They provided a database collected for a fine sand.
In micromechanics, “fabric” is a term with a wide meaning, usually used to describe the arrangement and orientation of particles, and the distribution of voids [12,13]. According to research conducted by Ventouras et al. [14] and Fonseca et al. [15], fabrics have a strong correlation with properties such as stiffness, peak strength, permeability and expansion rate. Many fabric-related quantities (also called fabric indices) can be used to describe the microstructure of granular materials, such as contact numbers, branch vector direction, contact normal orientation and void orientation etc. Researchers conducted many simulations and gave different definitions of fabrics to study the granular material mechanical behaviors. Li et al. [12] and Wang et al. [16] used the Voronoi tessellation to describe the internal structure of a granular material. Later, Wei et al. [17] used a weighted Voronoi tessellation to characterize the anisotropic fabric tensor. Huang et al. [18] noticed the difference between principle values of the fabric tensor, which was used to quantify the anisotropy of granular material. To study the microstructure characteristics, Wang et al. [19] analyzed the evolution of NPD (neighboring particle distance), which was defined as the average distance between the surface of a particle and its three closest neighbors.
The mesoscopic mechanism of the macro-mechanical properties of granular material can be understood from the inter-particle contacts. Based on the concept of complex networks Tordesillas et al. [20] analyzed the evolution of the contact networks. The contact network was particularly useful in describing particle interactions [21–23] which can quantify the changes in the internal structure of granular assemblies. Radjai et al. [24,25] found that the contacts carrying above- and below-average normal forces have different effects on force transmission and work dissipation. Those contact forces form strong force network and weak force network, respectively. The strong force network transmits the majority of the applied loads, whereas the weak force network stabilizes the strong force network. Distribution statistics of these two subnets are very different. Many subsequent researchers such as Guo et al. [5], Tordesillas [26], Thornton et al. [27] have adopted this method of partitioning the contact force network based on average normal force.
Although the dynamic properties of granular materials have been extensively discussed, there are still daunting challenges in linking macroscopic behaviors with mesoscopic structures. Granular assemblies will show different mechanical responses under different modes of cyclic loading. The DEM was used in this study to simulate two cyclic loading conditions: constant confining pressure mode, fixed wall mode. In general, under different cyclic loading conditions, granular materials exhibit specific macro- and meso-mechanical properties. The macroscopic characteristics of granular materials under cyclic loading were firstly analyzed. The relationship between the number of cyclic loading and the strain evolution under different conditions was obtained. Then three different time instants in the cyclic loading process were picked to study the evolution of the contact normal distribution and the force chain networks. The adjustment of the particle position is beneficial to the improvement of the topological structure. This research has guiding significance for the application of granular materials under dynamic cyclic loading.
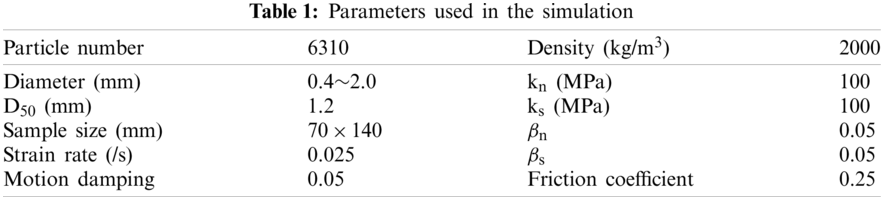
In this study, PFC2D was used for modelling granular assemblies under cyclic loading. The whole sample containing 6310 circular disks was confined by four rigid walls. Although some researchers [28] used the soft boundary closer to the experiment in the simulation, we still used the rigid wall as the loading boundary for the convenience of calculation, and set the wall stiffness to be one order of magnitude smaller than the particle stiffness. The parameters used in the simulation were show in Table 1 below. The particle size met uniform distribution, D50 refers to the average diameter. The initial size of the sample was shown in Fig. 1a. The friction coefficient between particles was set equal to 0.25, while the friction between the particles and walls was set to 0 so that the particles can slide and roll on the walls. The linear-elastic contact model was adopted. The normal contact stiffness is kn, and the shear contact stiffness is ks. The normal damping coefficient is βn, the shear damping coefficient is βt. Based on the quasi-static condition, the axial strain rate should not excess 0.08/s, for details, see [29]. In our simulation, the loading and unloading wall velocity was set to guarantee a constant axial strain rate of 0.025/s. The time step used in the simulation was set as
As shown in Figs. 1b–1c, two kinds of loading modes were adopted in the whole simulation, i.e., fixed wall condition (b), and constant confining stress condition (c). Consolidation was first performed after the particle assembly generation. The isotropic target stress was set as
The implementation of the first loading mode was quite simple. After the sample was consolidated, the positions of the vertical walls remained still and the velocities of the horizontal walls were adopted to form a cyclic loading. For the second loading mode, constant confining stress condition, the vertical walls were servo-controlled to maintain the pressure on vertical walls equal to the isotropic target stress. The control condition for loading and unloading is the stress on the horizontal wall ranging between
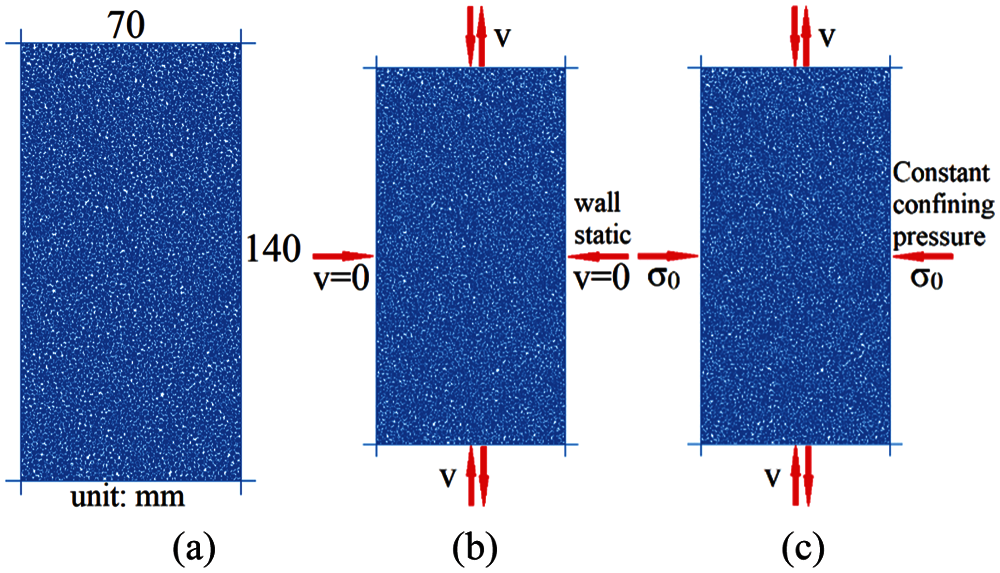
Figure 1: Particle assembly (a) and two loading modes: fixed wall (b), constant confining stress (c)
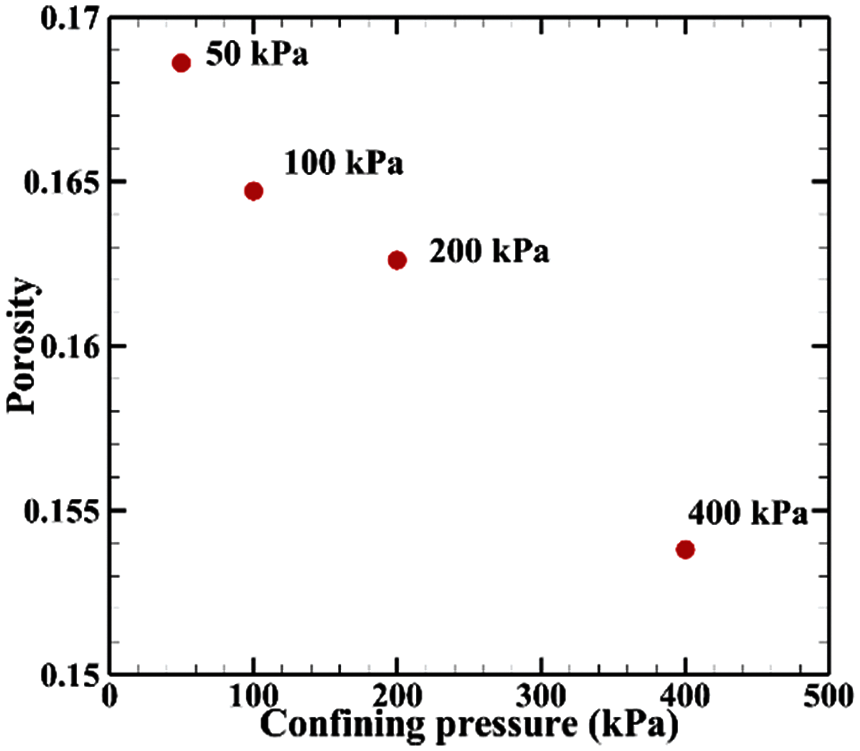
Figure 2: The relationship between consolidation pressure and porosity
In each loading and unloading cycle, record the both the contact normal and contact force values when the axial stress reaches the peak and valley values. Therefore, the mesoscopic parameters of the complex force chain network can be calculated to conduct a more detailed investigation on the evolution of the network structure.
3.1 Stress and Strain in Different Cyclic Loading
For the first loading mode, fixed wall condition, four different groups of consolidation pressures were set, and then four sets of dynamic stresses were set for each of the consolidated assemblies respectively. The maximum values of the axial strain (Eq. (1)) of the sample during the cyclic loading process for each cycle were recorded. The cyclic stress ratio was defined as the ratio of the dynamic stress to two times of the initial confining pressure, namely
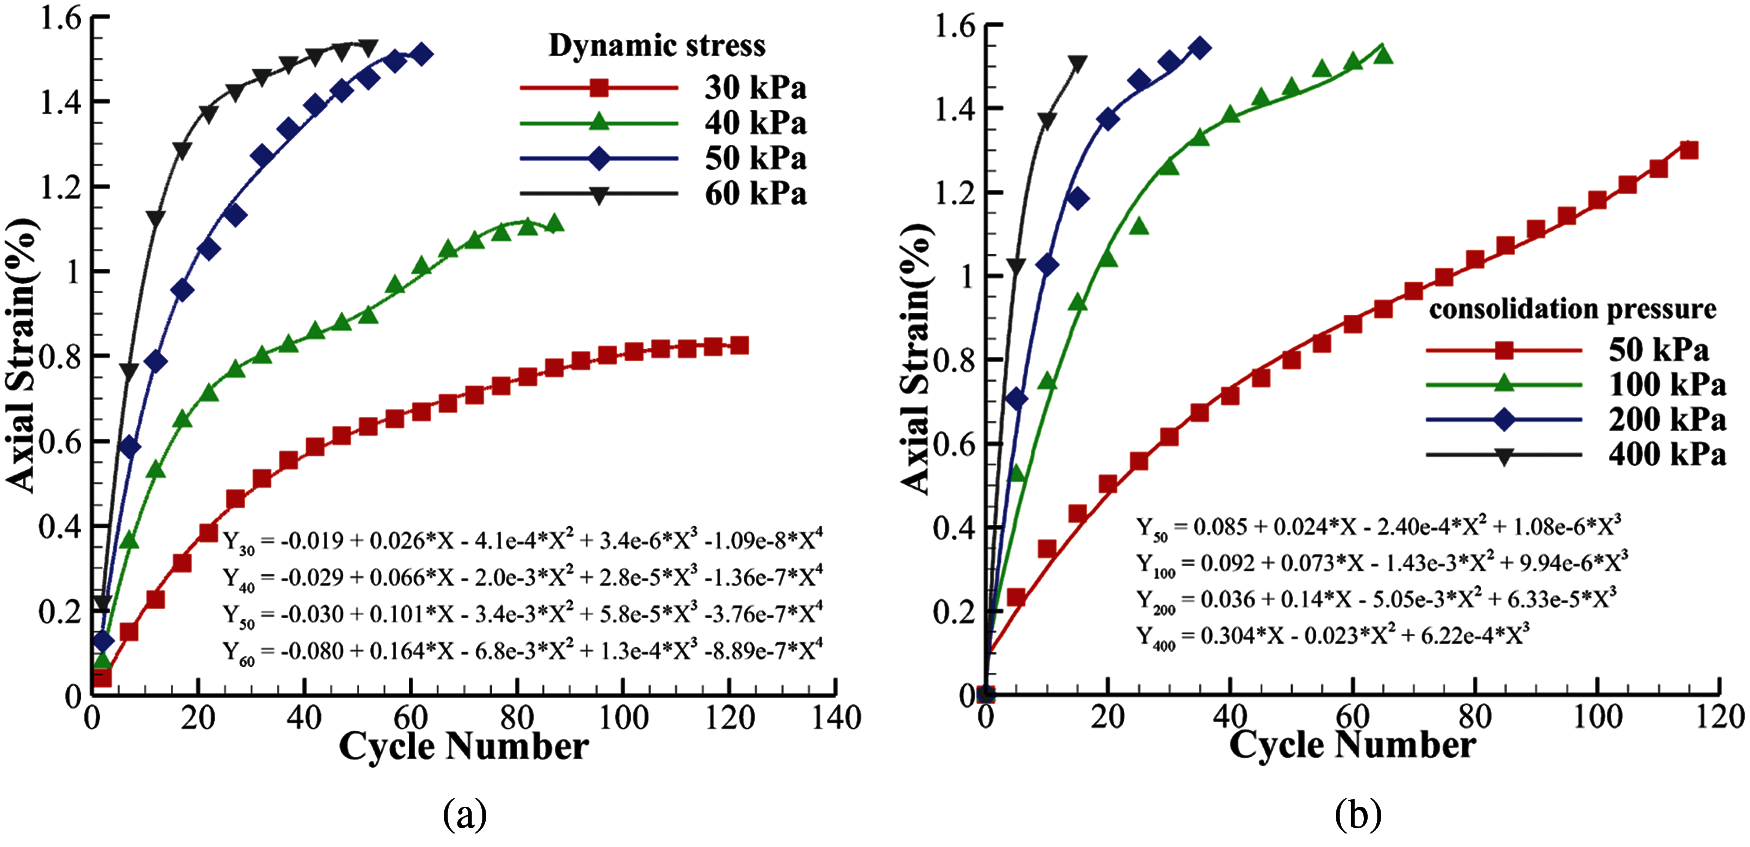
Figure 3: Variation in axial strain (%) with number of cycles. (a): consolidation pressure 100 kPa, CSR = 0.15∼0.3, (b): consolidation pressure 50∼400 kPa, CSR = 0.25
Fig. 3b shows the curve of the maximum axial strains change with the cycle number under the same CSR but different confining pressure. When the CSR is the same, the greater the initial consolidation pressure, the smaller the vertical deformation of the sample. This is mainly because under the action of high consolidation pressure, the contact between particles will be closer, and the interactions have been enhanced. In addition, curve fitting for various conditions were performed in Fig. 3. Note that the starting points of the curves do not start from zero, because the calculation of the axial strain is relative to the state after the first cycle. When the consolidation pressure is the same, the maximum axial strain changes in a quartic function relationship with the cycle number. When the CSR is the same, the maximum axial strain changes with the cycle number in a cubic function.
In the following, the axial stress-strain relationship of the sample was analyzed. Here
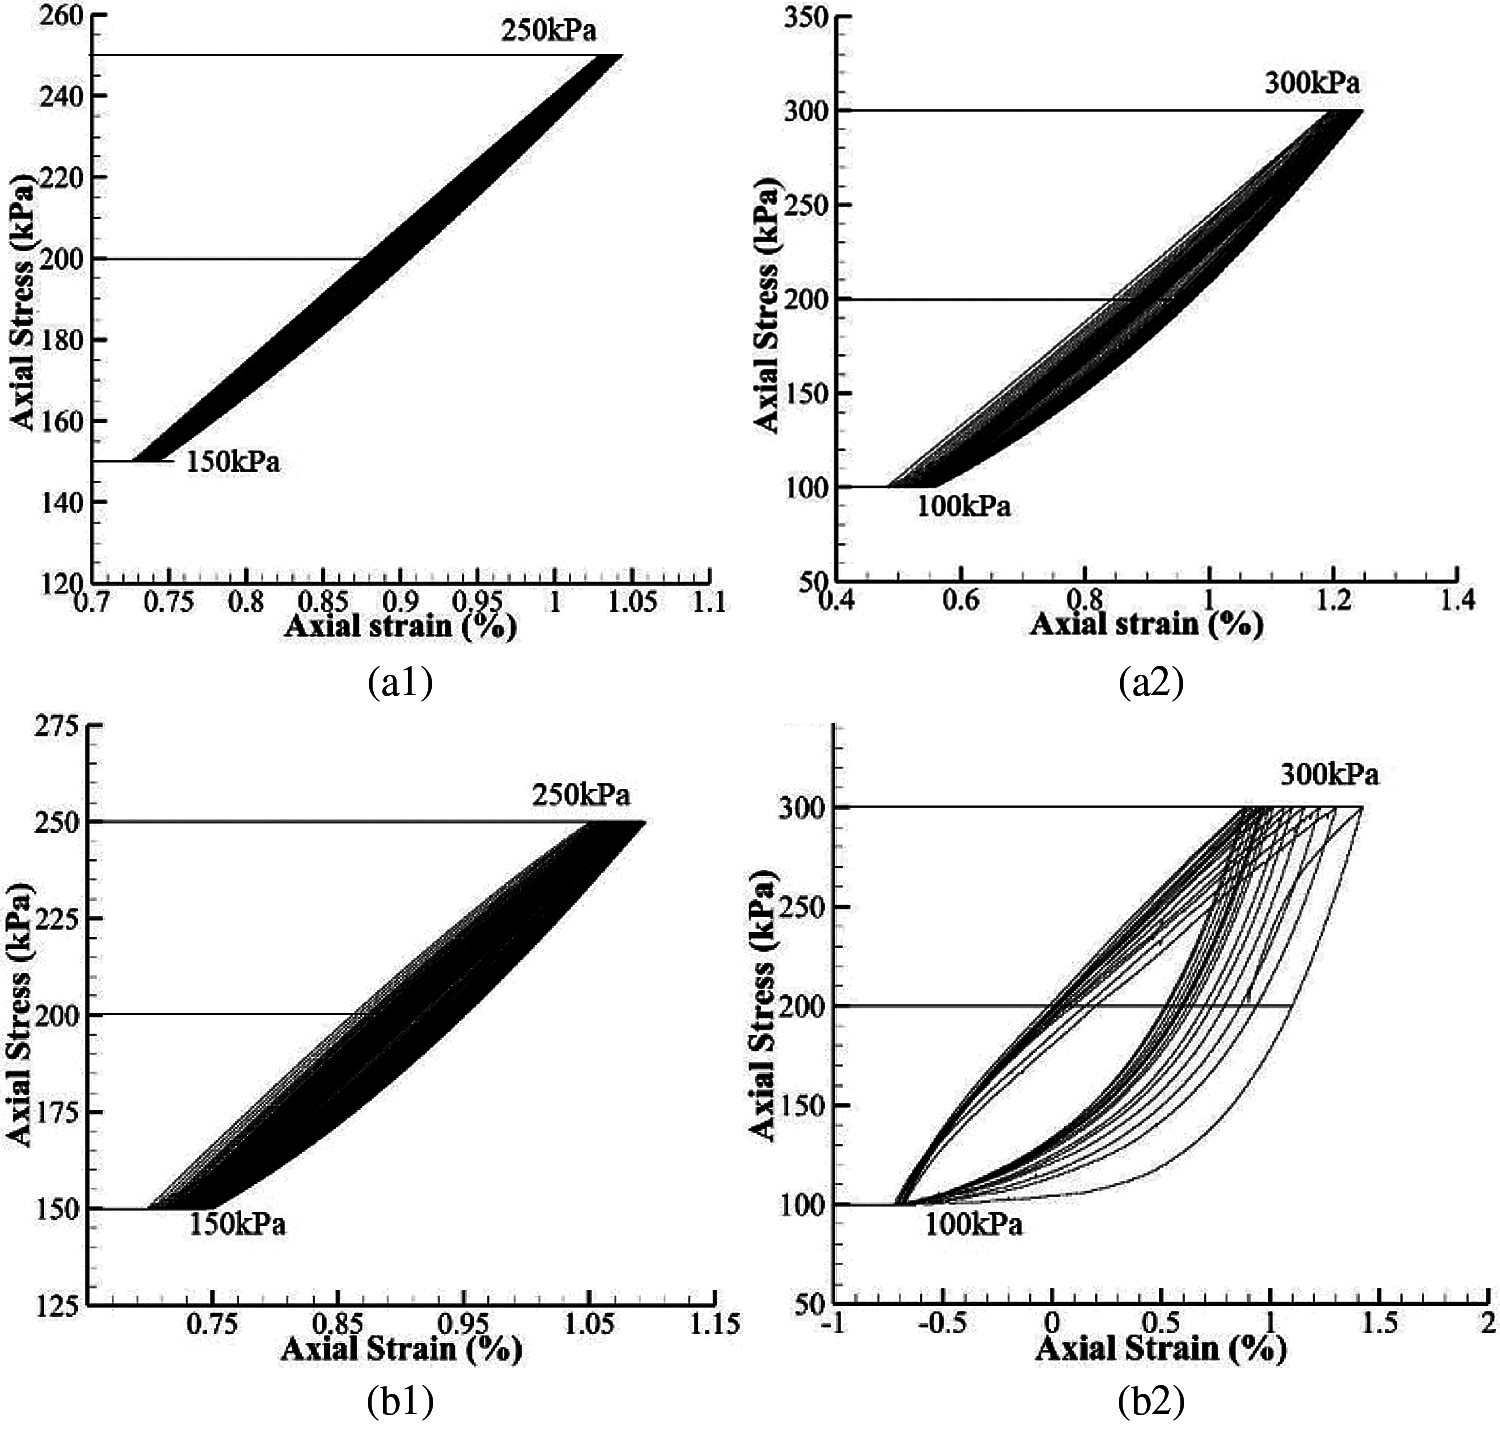
Figure 4: The relationships of axial stress and strain of samples under different loading modes. (a1, a2): Mode-1, (b1, b2): Mode-2
During the calculation process, we found that due to the large number of particles in the sample, the force chain diagram of the entire sample may not be able to show subtle changes well. So, four representative regions were analyzed in the sample separately. The relative positions of the four regions are shown in Fig. 5. Each region is square with side length equal to 1/4 of the sample width. The four regions represent the four different stress states in the sample and the influence of the boundary, which can be used to analyze different deformation mechanisms in the sample.
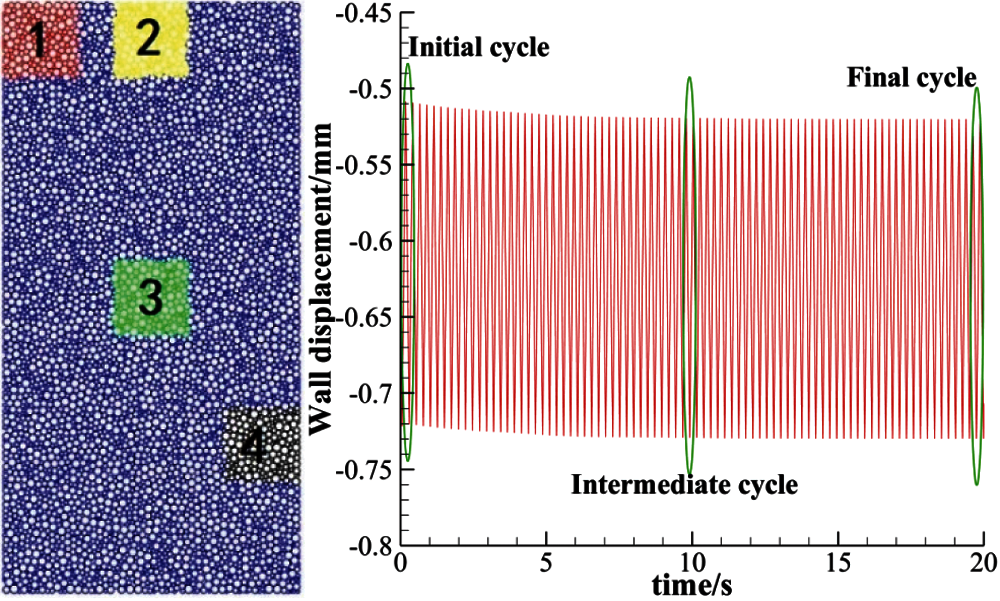
Figure 5: Schematic diagram of the relative positions of the four regions in the sample and three different time instants in the cyclic loading process
To analyze the details of a complete cycle process at different time instants during the loading process. Three representative time instants were selected, as shown in Fig. 5, i.e., initial cycle, intermediate cycle and final cycle. We know that the material strain distribution can also reflect the changes in the mesostructure of the material to a certain extent. Therefore, the strain distribution of the four regions shown in Fig. 5 at the three reference time points were analyzed in the following. The strain definition used here is the same as what used in [30,31].
Fig. 6a shows the strain distribution of the four regions under the cyclic loading of fixed wall condiontion. Fig. 6b shows those of constant confining stress condition. It can be seen that no matter what kind of loading condition has been adopted, the strain has a gradual development process. In general, the strain under the constant confining stress condition is greater because the particles are more likely to adjust their positions with each other under such loading conditions. The changes in strain of each region can be summarized as the following: I. basically remain unchanged after reaching stability, such as (a2, b2–b4), II. first increase and then decrease, such as (a1, a4), III. always increase slowly, such as (a3, b1). Comparing (a) and (b) in Fig. 6, it can be seen that even at the same loading time, the strain in the same region may show a completely different state, which is determined by the deformability of the granular material. For constant confining stress condition, more regions (b2–b4) tend to remain unchanged after reaching stability. This shows that the mesostructures of the material are more stable, which is achieved by constantly adjusting the positions between particles. The deformation ability of the material is directly affected by the constraint conditions (i.e., loading conditions).
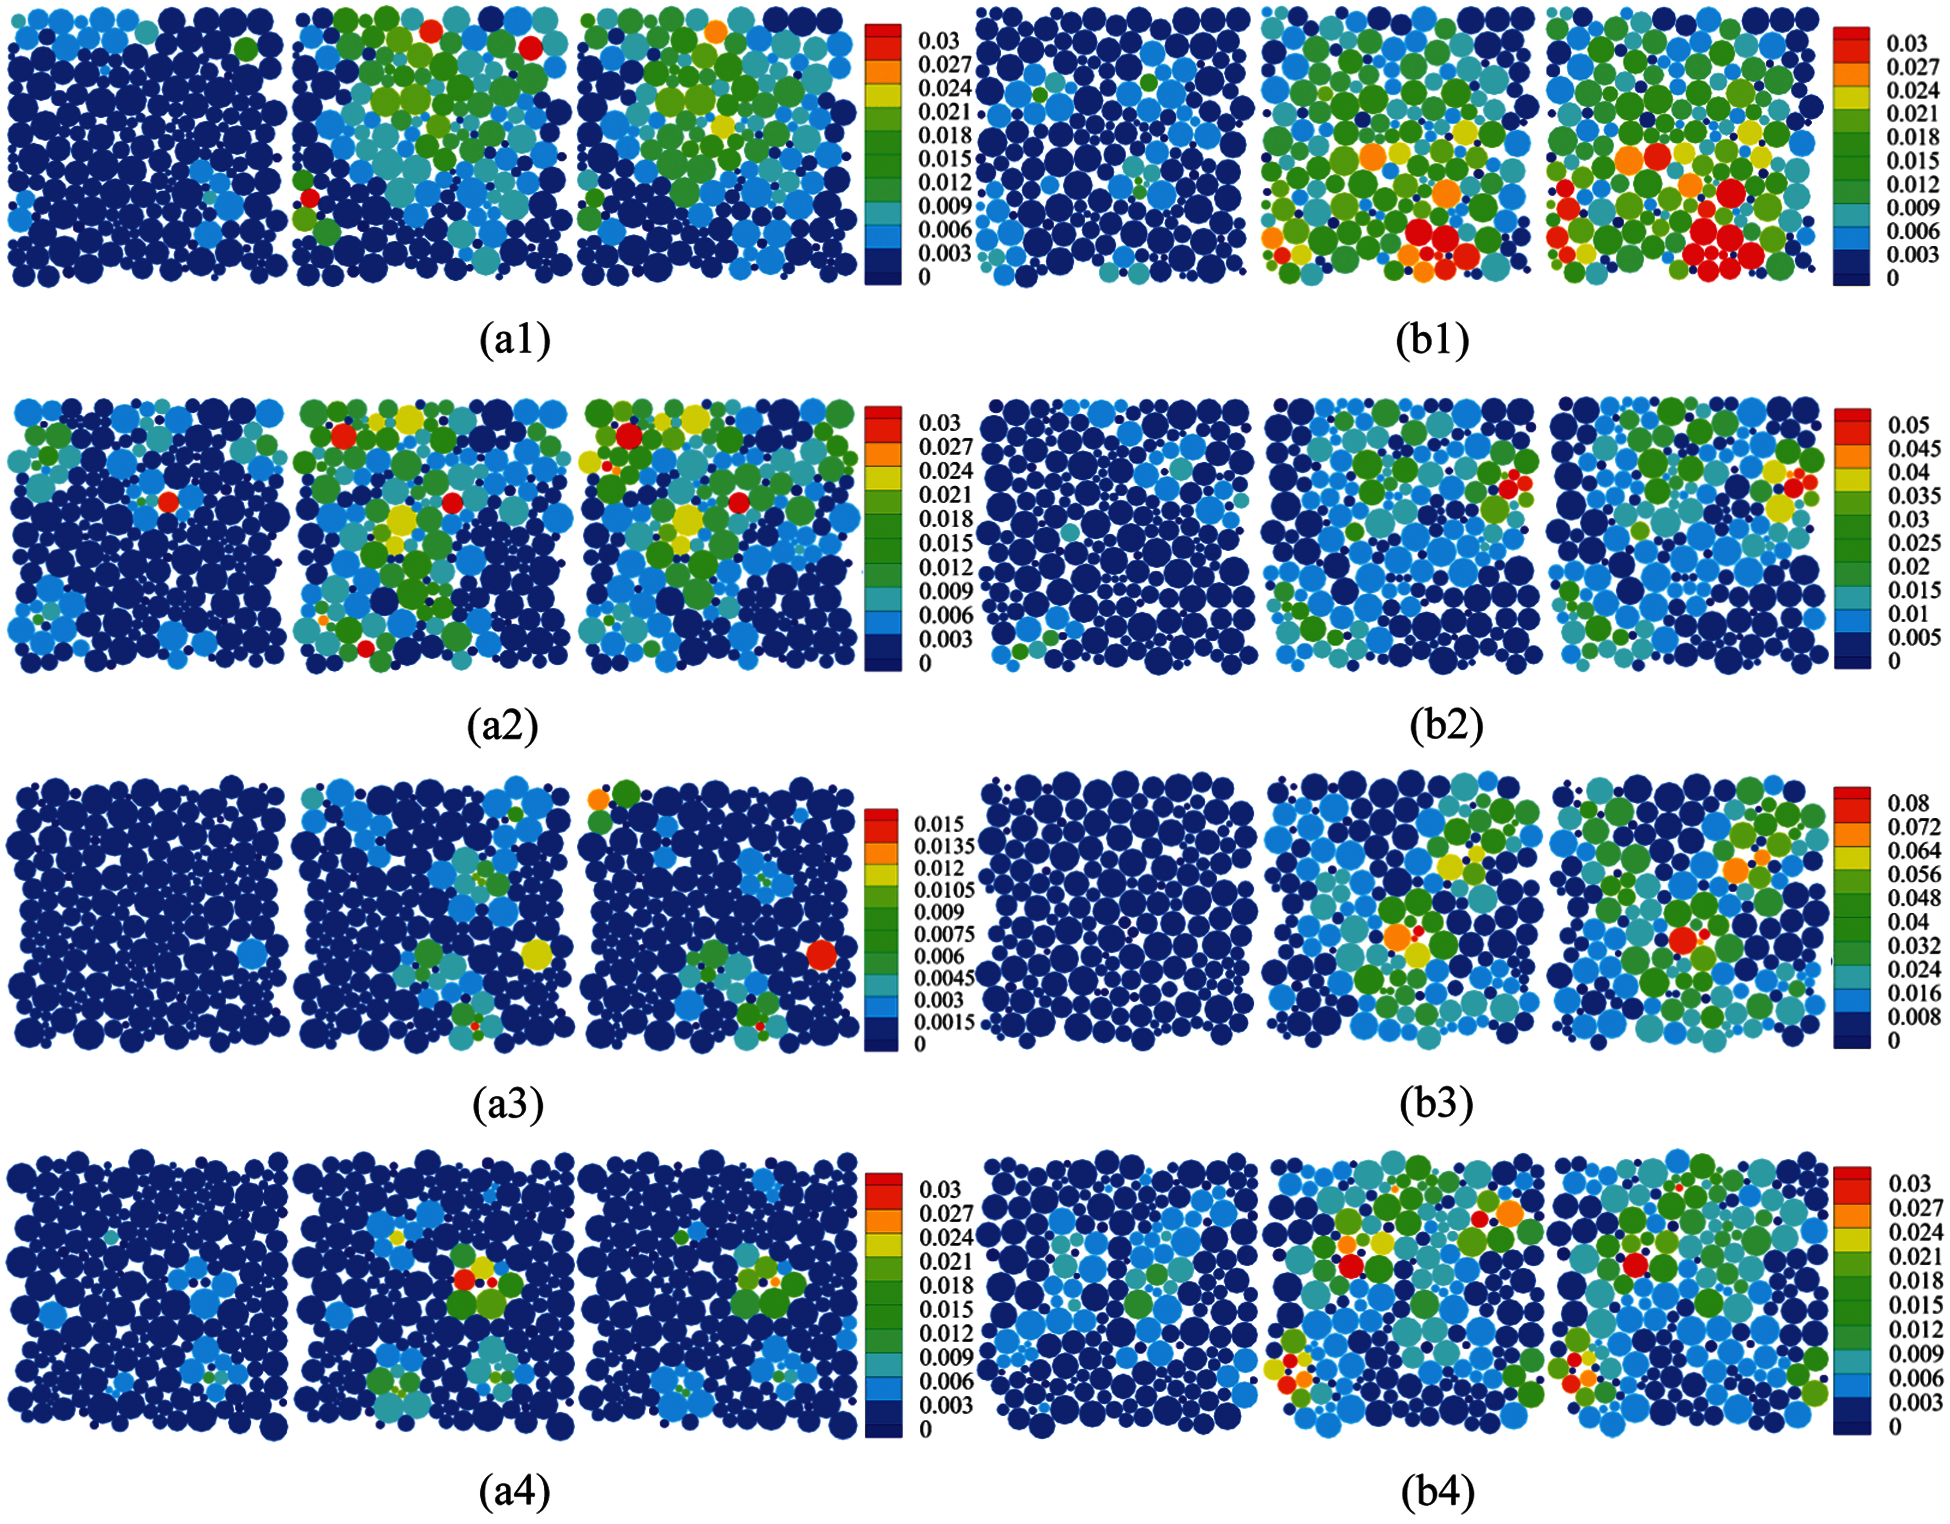
Figure 6: Variation of strain distribution in four different regions of the sample under different cyclic loading conditions. (a): fixed wall condition, (b): constant confining stress condition
3.2 Mesoscopic Parameter Evolution
Based on the fabric tensor, the characteristics and evolution of the mesostructures in granular materials during cyclic loading were mainly studied, focusing on the distribution of contact normal, the topological structure of the contact network and the evolution of complex force chains.
Fabric tensors proposed by Satake [32] define the anisotropy of an aggregation of particles in contact. The contact fabric tensor and the contact force fabric tensor are defined from local variables as:
where,
Here we took the sample with a confining pressure of 200 kPa and CRS = 0.125 as an example to analyze the variation of the internal fabric during cyclic loading, and then comparison of the fabric evolution subject to different loading modes were made to investigate the microstructure variations under cyclic loading. Fig. 7 shows the spatial distribution of the initial contact normal and initial contact force. After the consolidation, the entire sample exhibits isotropic properties. Both the contact normal and the contact force are approximately uniformly distributed in all directions.
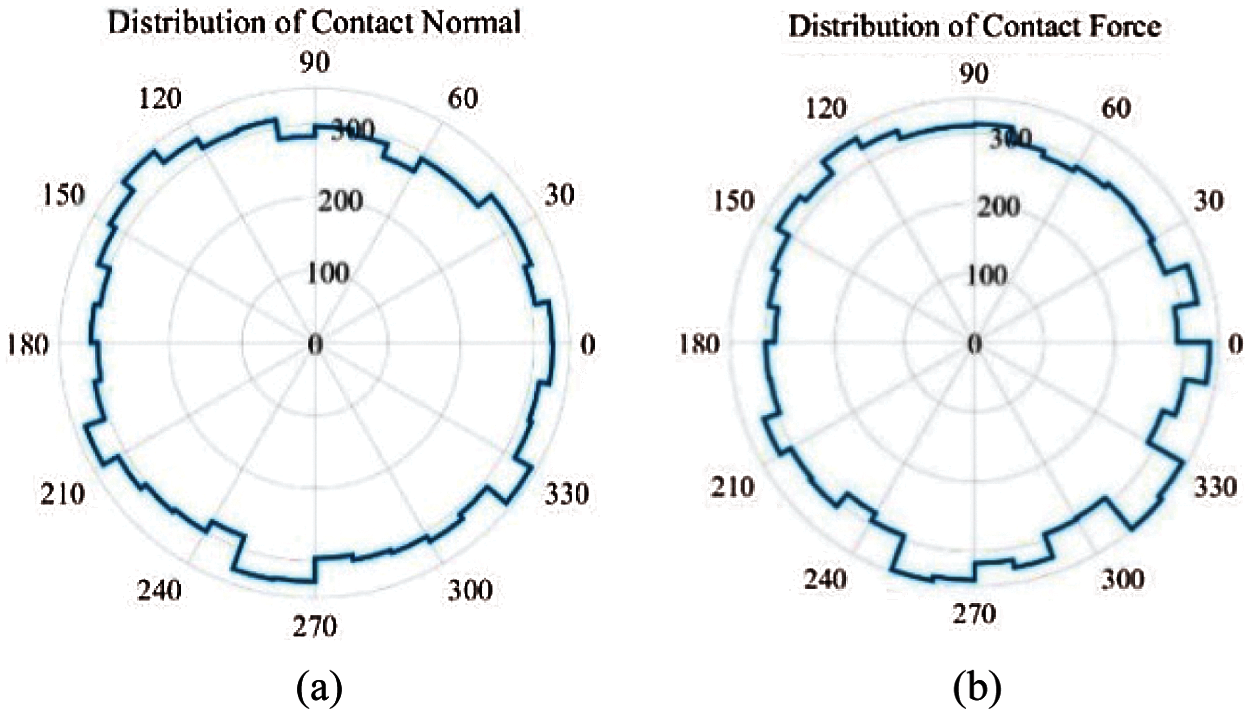
Figure 7: Distribution of contact normal (a) and contact force (b) at the initial state
Fig. 8 shows the distribution of contact normal and contact force at the three different time instants in the cyclic loading process (Fig. 5). The horizontal comparison from Figs. 8a–8d shows that both the contact normal and contact force within the sample show directional changes, which is related to the loading direction. Moreover, the directional change of the contact force is more obvious than that of the contact normal. Therefore, when studying the anisotropy of granular materials, it may be a better choice to use the contact force fabric as a research variable. Longitudinal comparison shows that there are subtle differences in the distribution of contact normal and contact force at different loading stages, but it is difficult to quantify them in Fig. 8, so we will study different regions of the sample separately to quantify this difference.
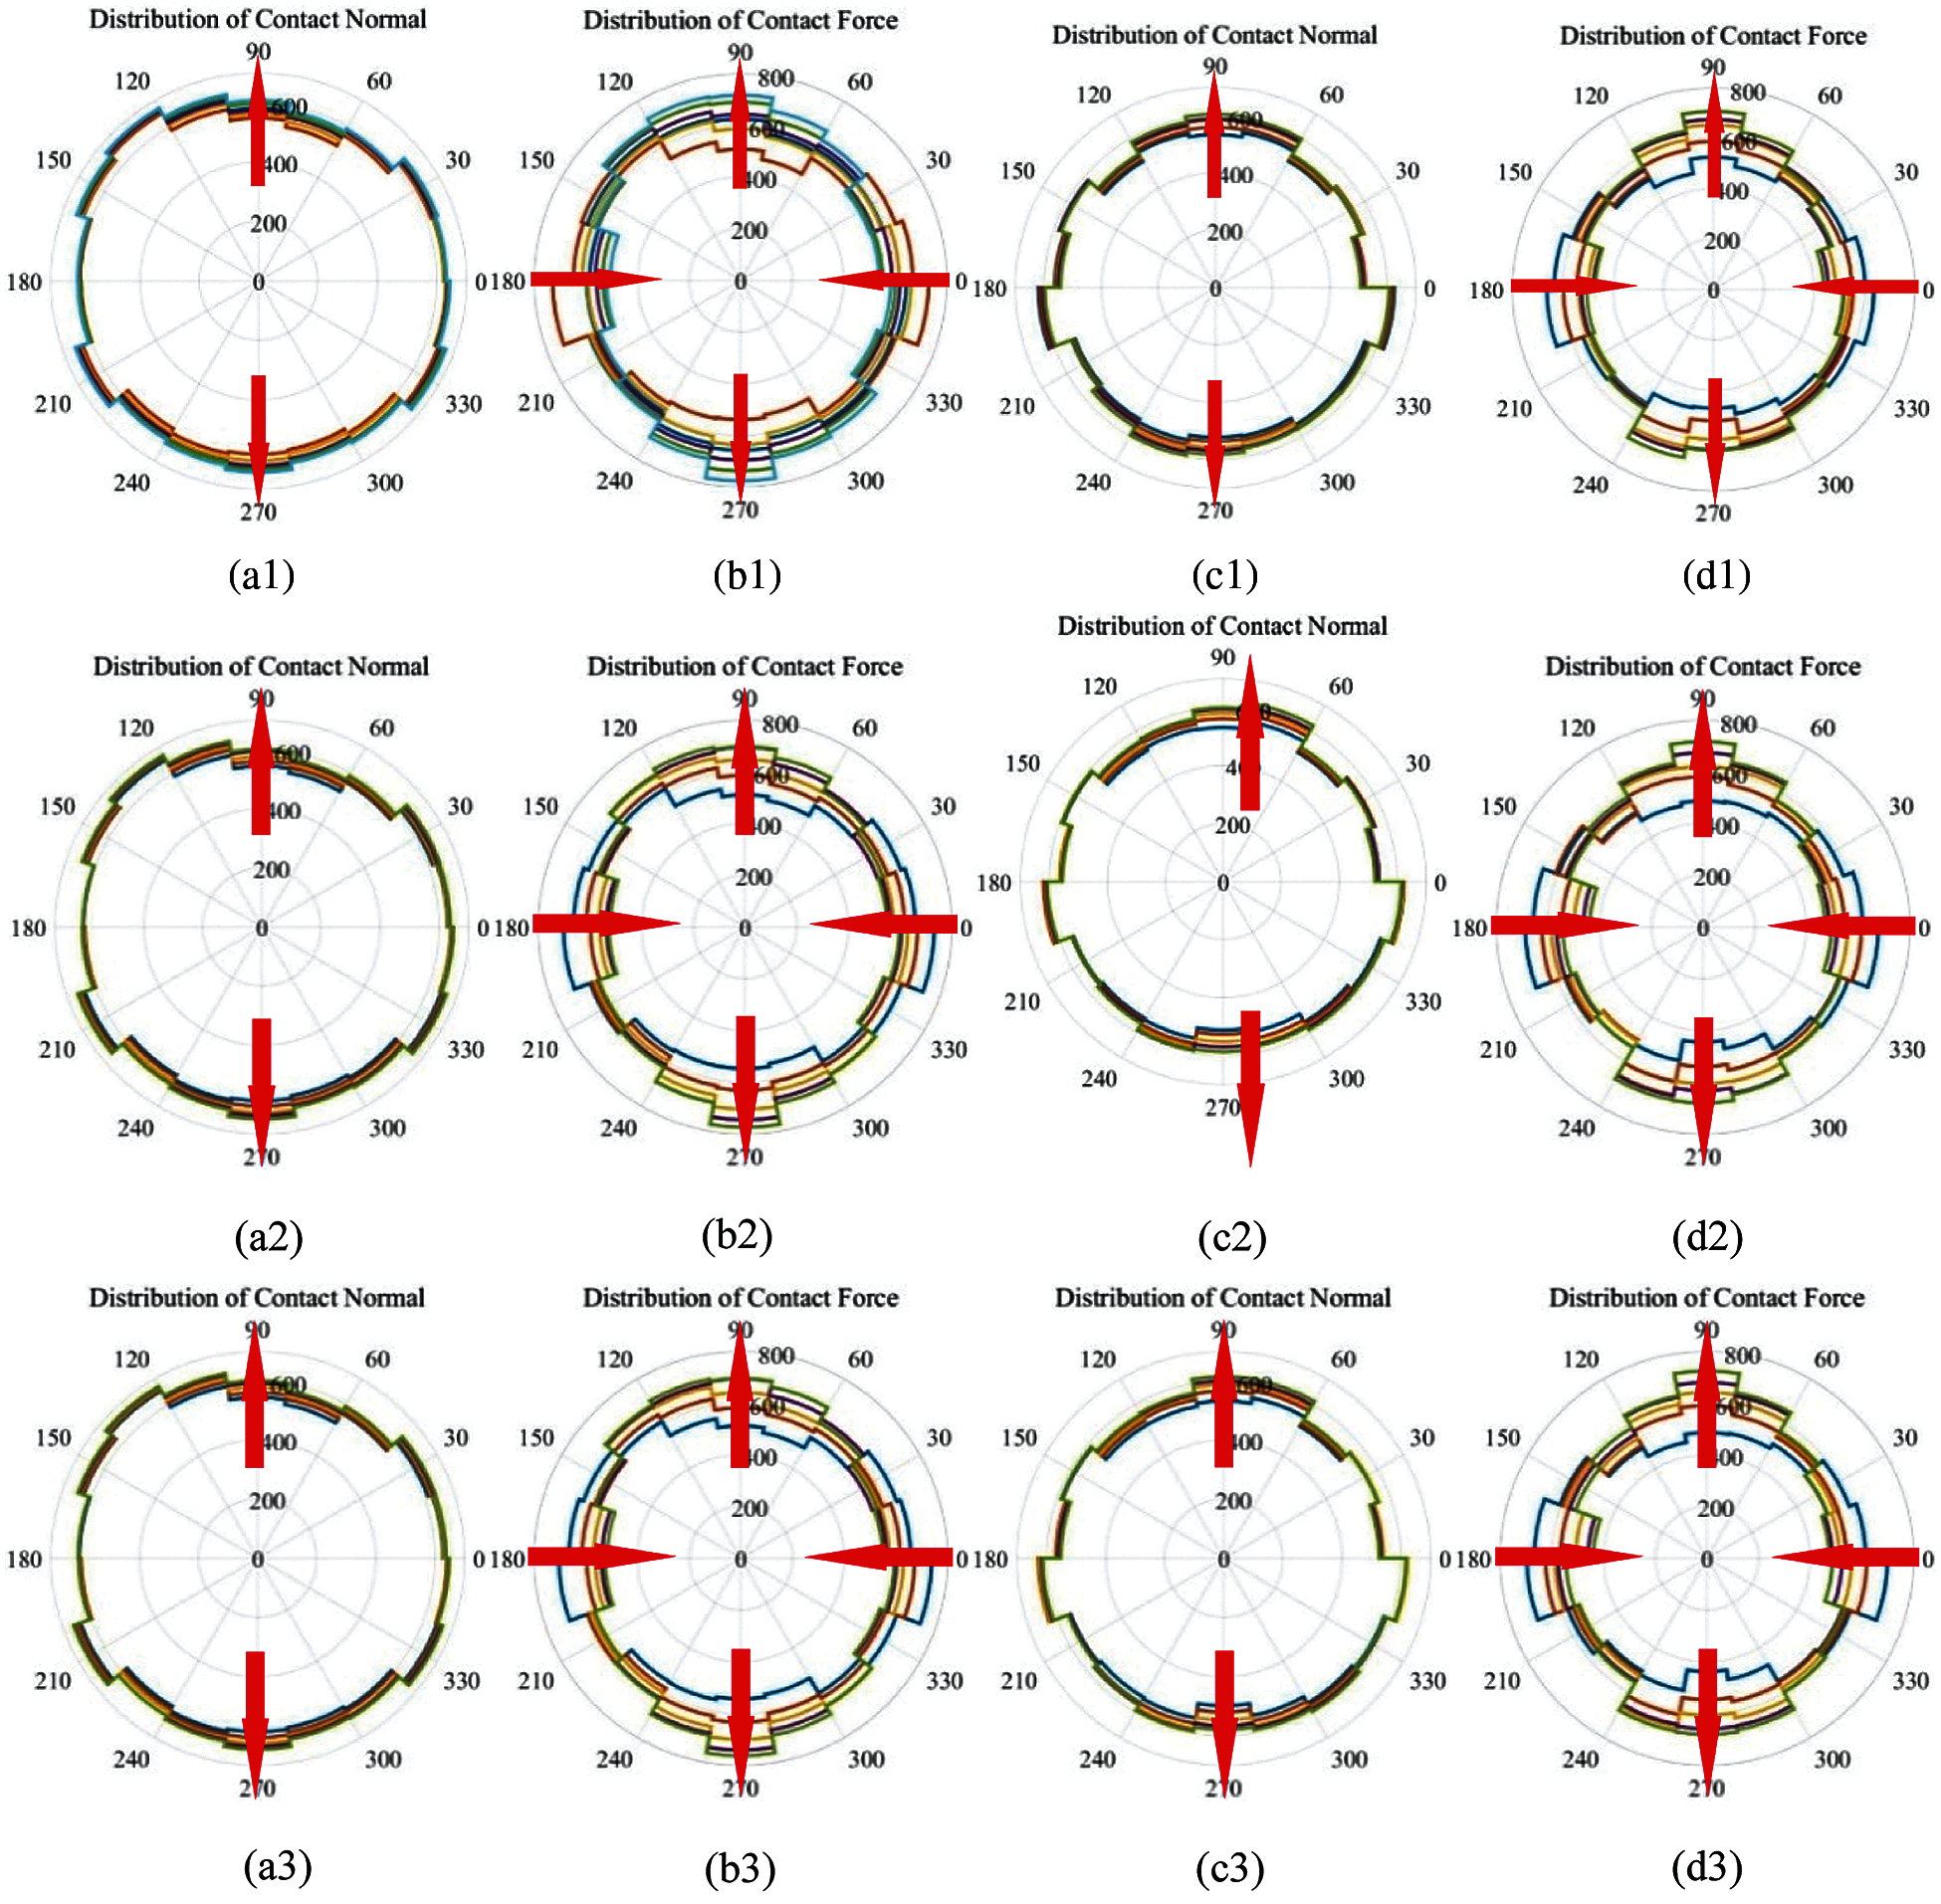
Figure 8: Distribution of contact normal and contact force. (a, b): fixed wall condition, (c, d): constant confining stress condition. (a1--d1): initial cycle, (a2--d2): intermediate cycle, (a3--d3): final cycle
5 Force Chain Network Evolution
Meso-structures such as force chains [26,33] and grain loops [34,35] have already proven to be relevant to give information on how forces and geometrical reorganization take place. The following part studied the changes of the force chain during the loading process, to understand the evolution of meso-structure in cyclic loading. The entire force chains in the sample can be divided into two parts, the strong force chains and the weak force chains. The force chains greater than the average contact force forms the strong force chain network, and the remaining constitutes the weak force chain network. It is generally believed that the strong chains play the main supporting role and have a vital influence on the bearing capacity of the material, while the weak chains play a stable role in maintaining the strong chains. The strong chains and the weak chains together constitute the strength of the material. Figs. 9 and 10 show the distribution of strong and weak contact force in the sample under two loading conditions, respectively. Regardless of the loading condition, the brown line surrounds the blue line, that is to say, the number of weak forces is greater than the number of strong forces. Both the main direction of strong force and the main direction of weak force change with the progress of cyclic loading, and the two main directions do not overlap. The main direction of strong force changes more rapidly with loading than that of the weak force. From the two figures, we can see that for the constant confining stress condition, the changes during the loading process of either the small circle (strong) or the large circle (weak) are more drastic, which reflects a stronger ability to adjust the relative position between the particles. This is consistent with the results of the previous deformation analysis.
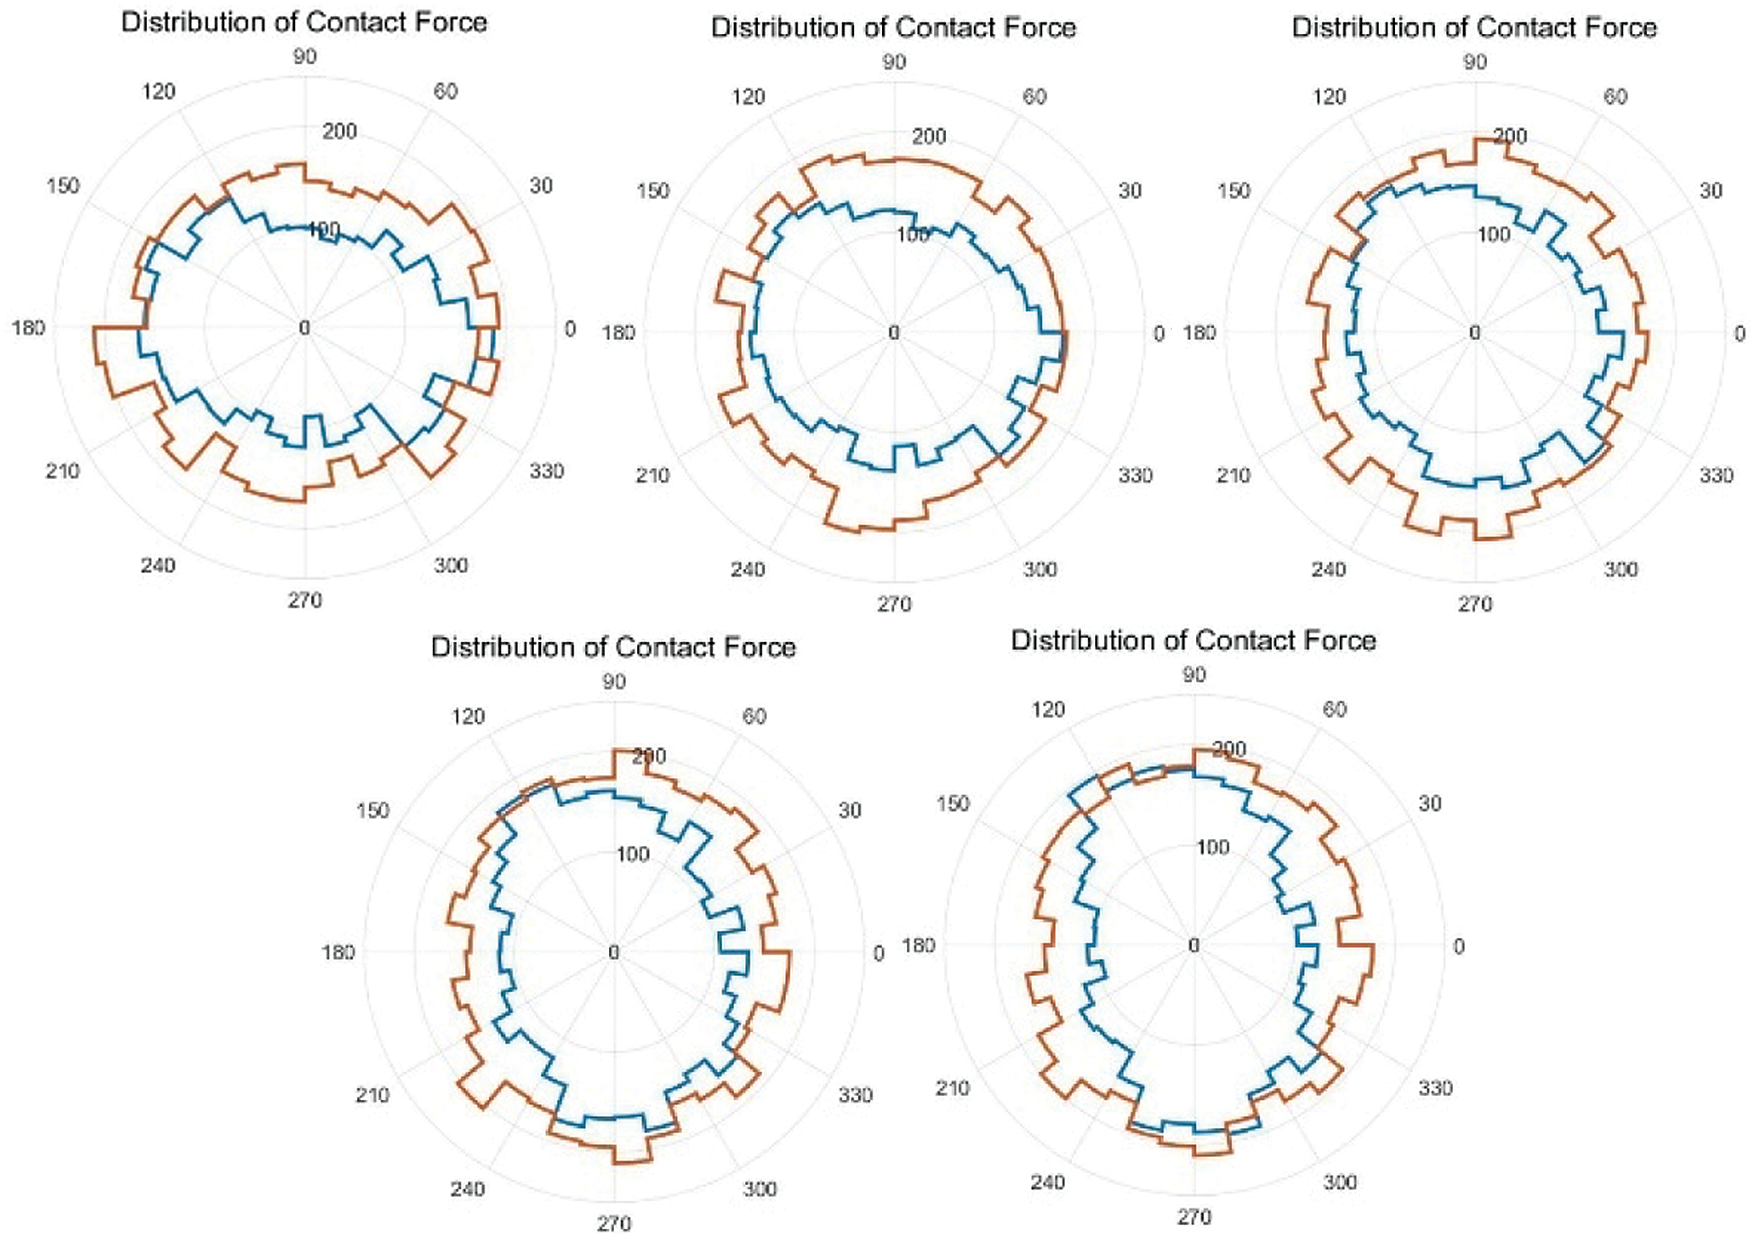
Figure 9: Distribution of strong contact force (blue) and weak contact force (brown) in a cycle for fixed wall condition
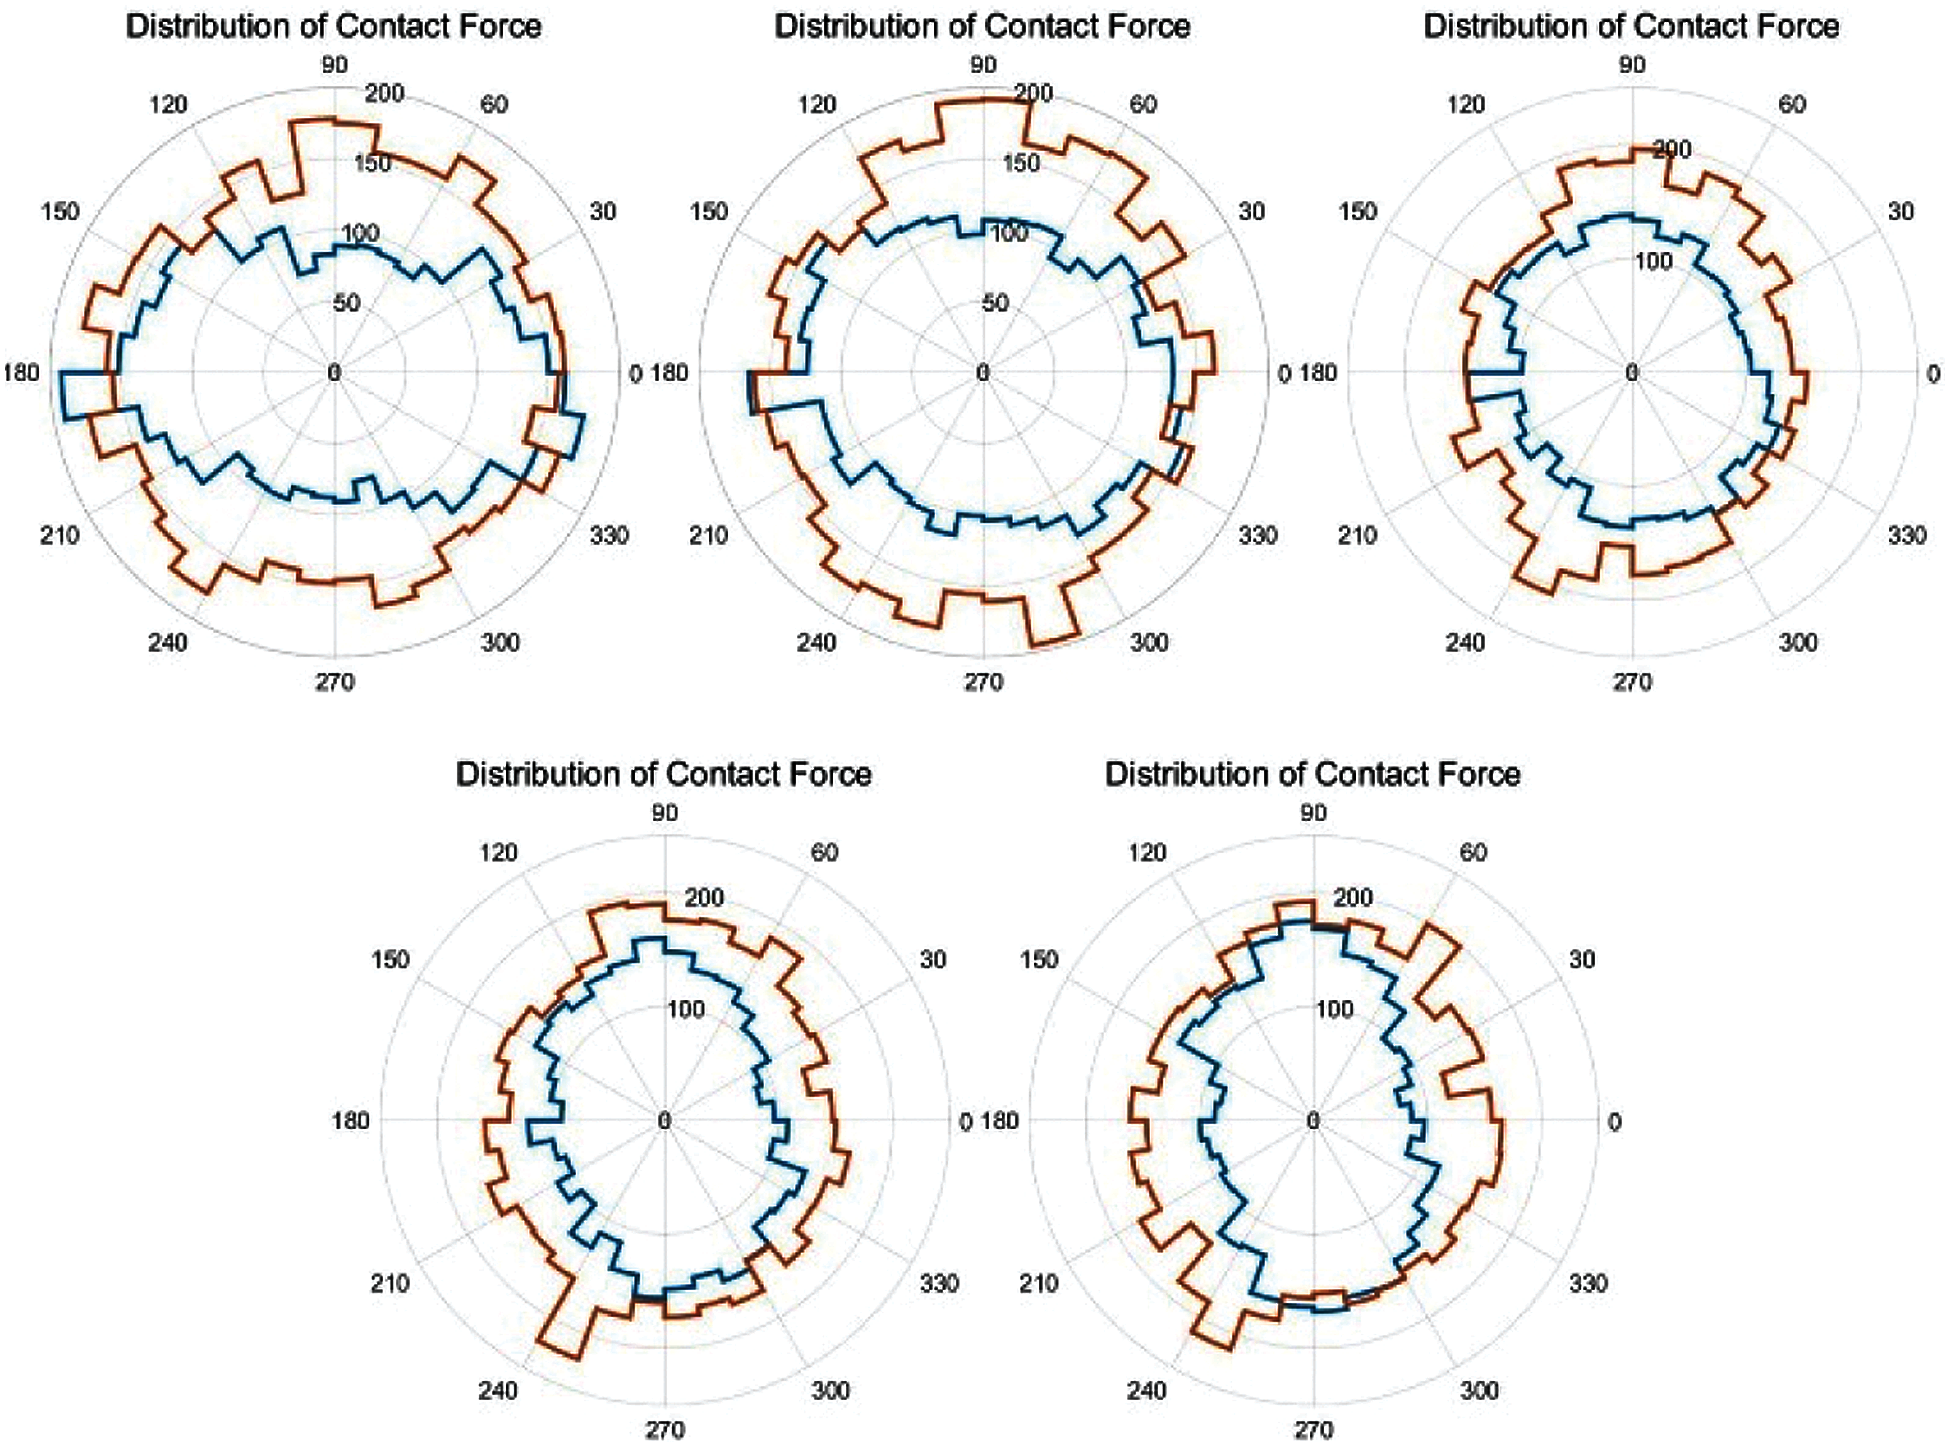
Figure 10: Distribution of strong contact force (blue) and weak contact force (brown) in a cycle for constant confining stress condition
For the fixed wall condition, the contact force at the initial moment of each cycle were recorded separately to draw the force chain networks of each region (Fig. 5), as shown in Table 2. Region 1 is located at the upper left of the sample. Except for the slight change in the direction of the force chain (not easy to see in the figure), only a small part of the force chain has changed (disconnected or connected). The main branches of the force chain remain basically unchanged. When the topology of the force chain does not change, the change of direction actually represents the overall movement of the local region. In fact, the thickness of the force chain in the figure also has a certain degree of change, which is not obvious in the figure. Region 2 is located in the upper middle of the sample, next to the upper loading plate. The force chain in Region 2 is smaller than that in Region 1. The main branches show a tendency in horizontal orientation. Region 3 is located in the center of the sample. The force chain network shows stronger uniformity than that of other locations. As the cyclic loading continues, the topology of the force chain in Region 3 did not change, while only the magnitude of the force was changed slightly. Region 4 is located in the lower right part of the sample, near the right wall. Compared with the vertical direction (loading direction), the force chains seem to be more inclined to the horizontal orientation, which may be related to the effect of the boundary wall.
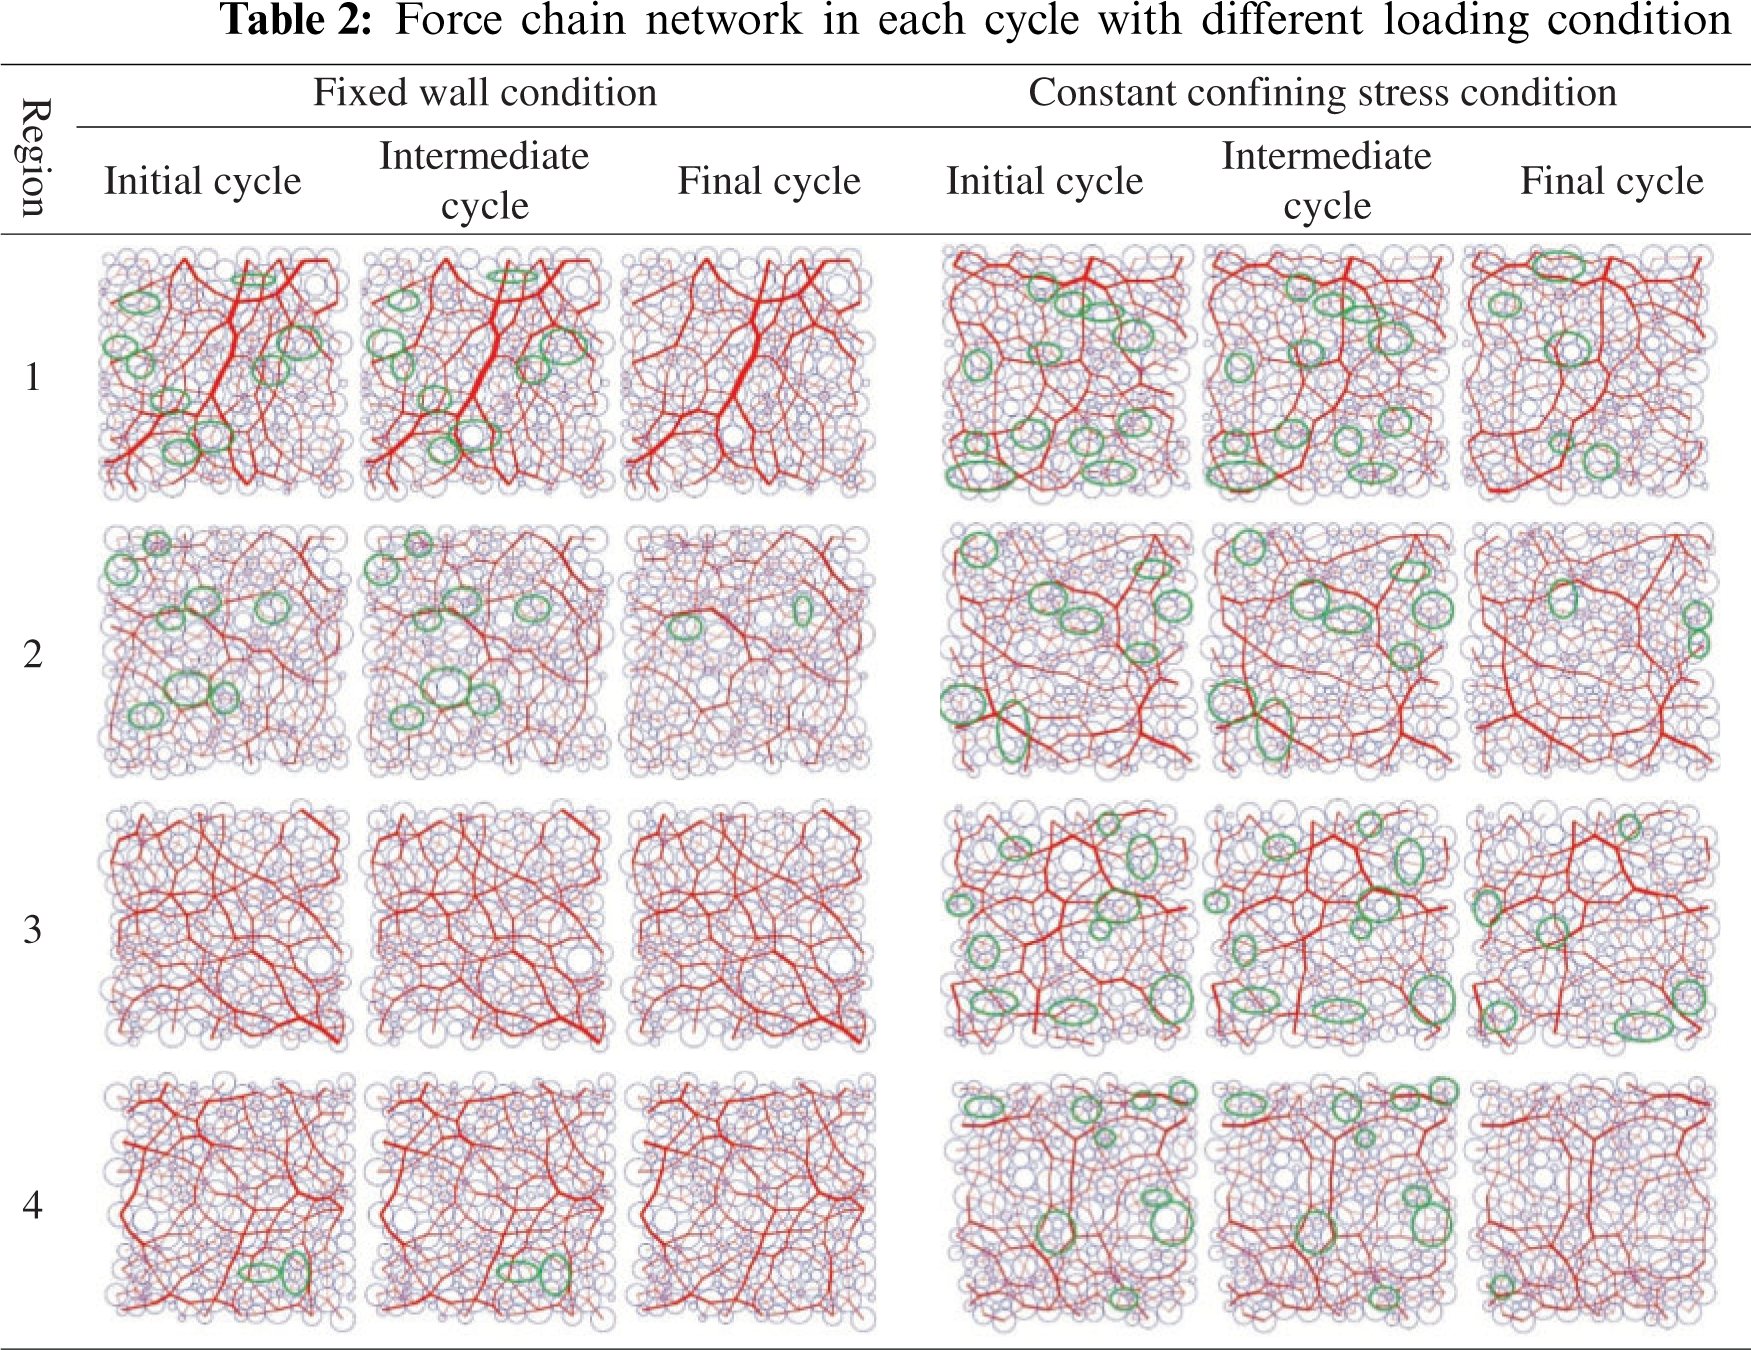
For the constant confining stress condition, the same four sets of force chain figures were also shown in Table 2. In general, compared with the above results, the force chains of constant confining stress condition were changed more drastically. It is the because of the vertical wall movement which results in a greater possibility of mutual adjustment between particles, so it is more conducive to the improvement of the force chain topology. In these figures, there are more position marks where the force chain network changes. Compared with fixed wall loading conditions, the relative movement of particles is more obvious. The topology of the force chain network is also more likely to change. The change in topology means that the number of blocks (i.e., the region-1 in the sample mentioned by Wang et al. [30]) will increase, that is, large blocks will become smaller and more fragmented.
As mentioned earlier, it is difficult to quantify the difference in fabric (here refers to the distribution of the contact force) during the loading process in Fig. 8, so the distribution of contact force in different regions are analyzed separately. Conclusions consistent with the above force chain analysis can be drawn from Figs. 11 and 12. In general, proper variability of granular materials may cause two completely different results. It may make the material form more reasonable load-bearing meso-structures, so the material becomes more stable and less prone to damage under certain loading. On the contrary, it may not be possible to form a stable meso-structure, and the material will be destroyed under a low load. Whether a reasonable and stable structure can be formed is determined by the rearrangement of particles inside the material, which has a certain degree of randomness, and this will be the research content of our future work.
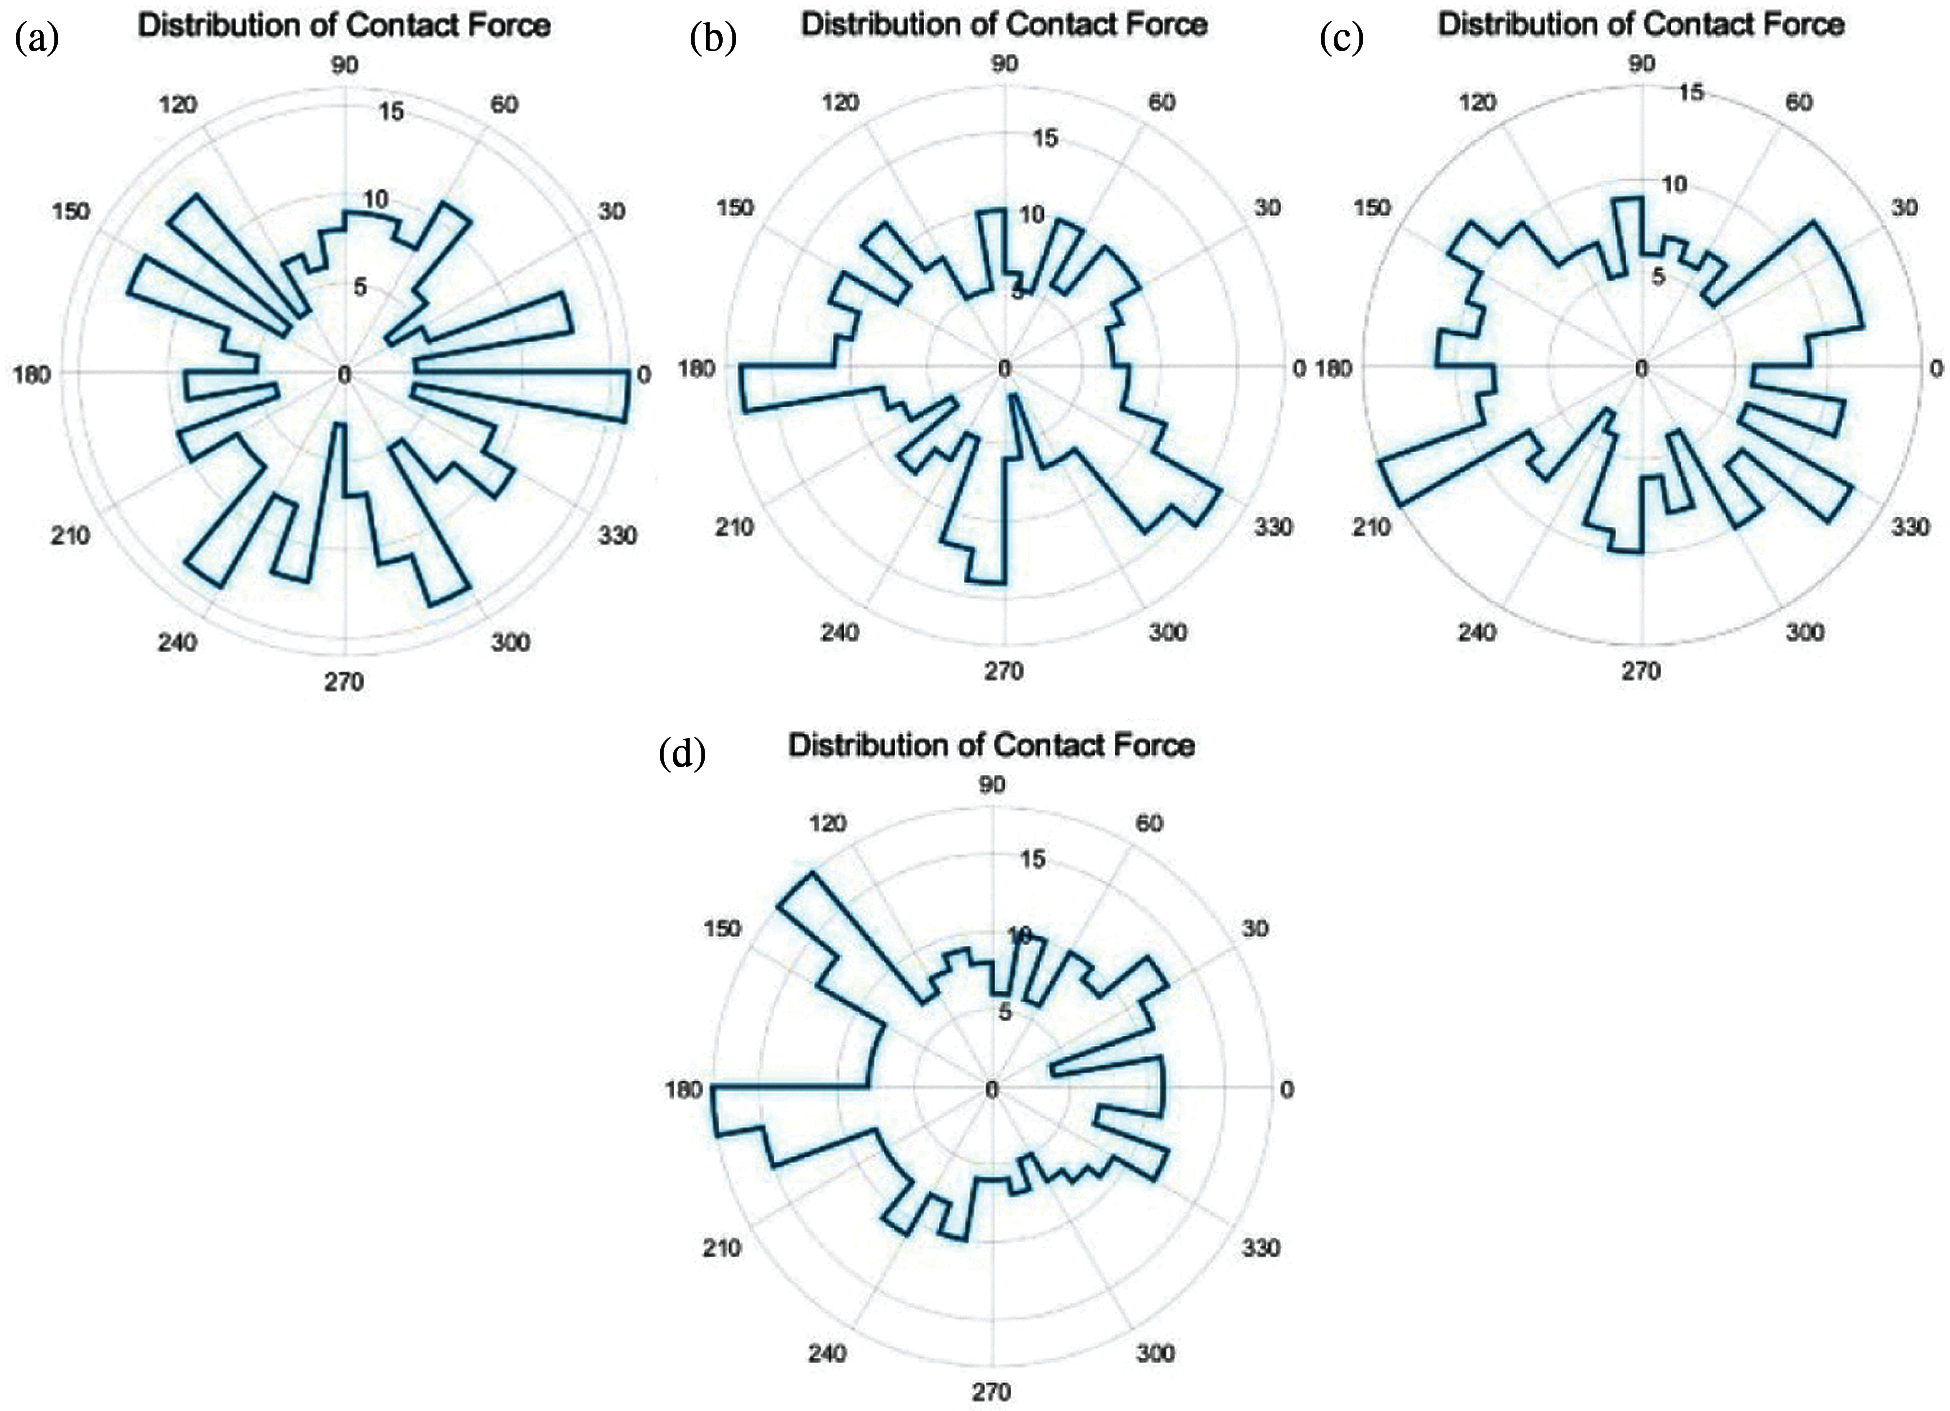
Figure 11: Contact force distribution in four regions at the start point of the initial cycle under fixed wall condition. (a) Region 1 (b) Region 2 (c) Region 3 (d) Region 4
Finally, let us look back at the entire process of cyclic loading. In order to maintain consistency, we still take sample with a confining pressure of 200 kPa and CRS = 0.125 as an example. Fig. 13 shows the correspondence between the axial strain and the contact force distribution and the force chain of Region 1 and Region 2 in the sample during the entire cyclic loading process. The three green identification circles on the curve correspond to the three time instants in Fig. 5. The orientation of the contact force distribution continuously changes with the cyclic loading. Analyzing the relative motion of the particles, from the initial cycle to the intermediate cycle, a large number of force chains are broken and generated, which have been marked in the figure. In addition, the strength of the force chain also changes significantly. The particles show a certain degree of relative movement. Unfortunately, these cannot be well observed in this figure. From the intermediate cycle to the final cycle, the change in the topology of the force chain is small. The movement between the particles is also maintained at a small level. So it can be considered that the sample has reached a stable state. This can also be demonstrated by the fact that the contact force distribution remains unchanged during the subsequent cyclic loading process.
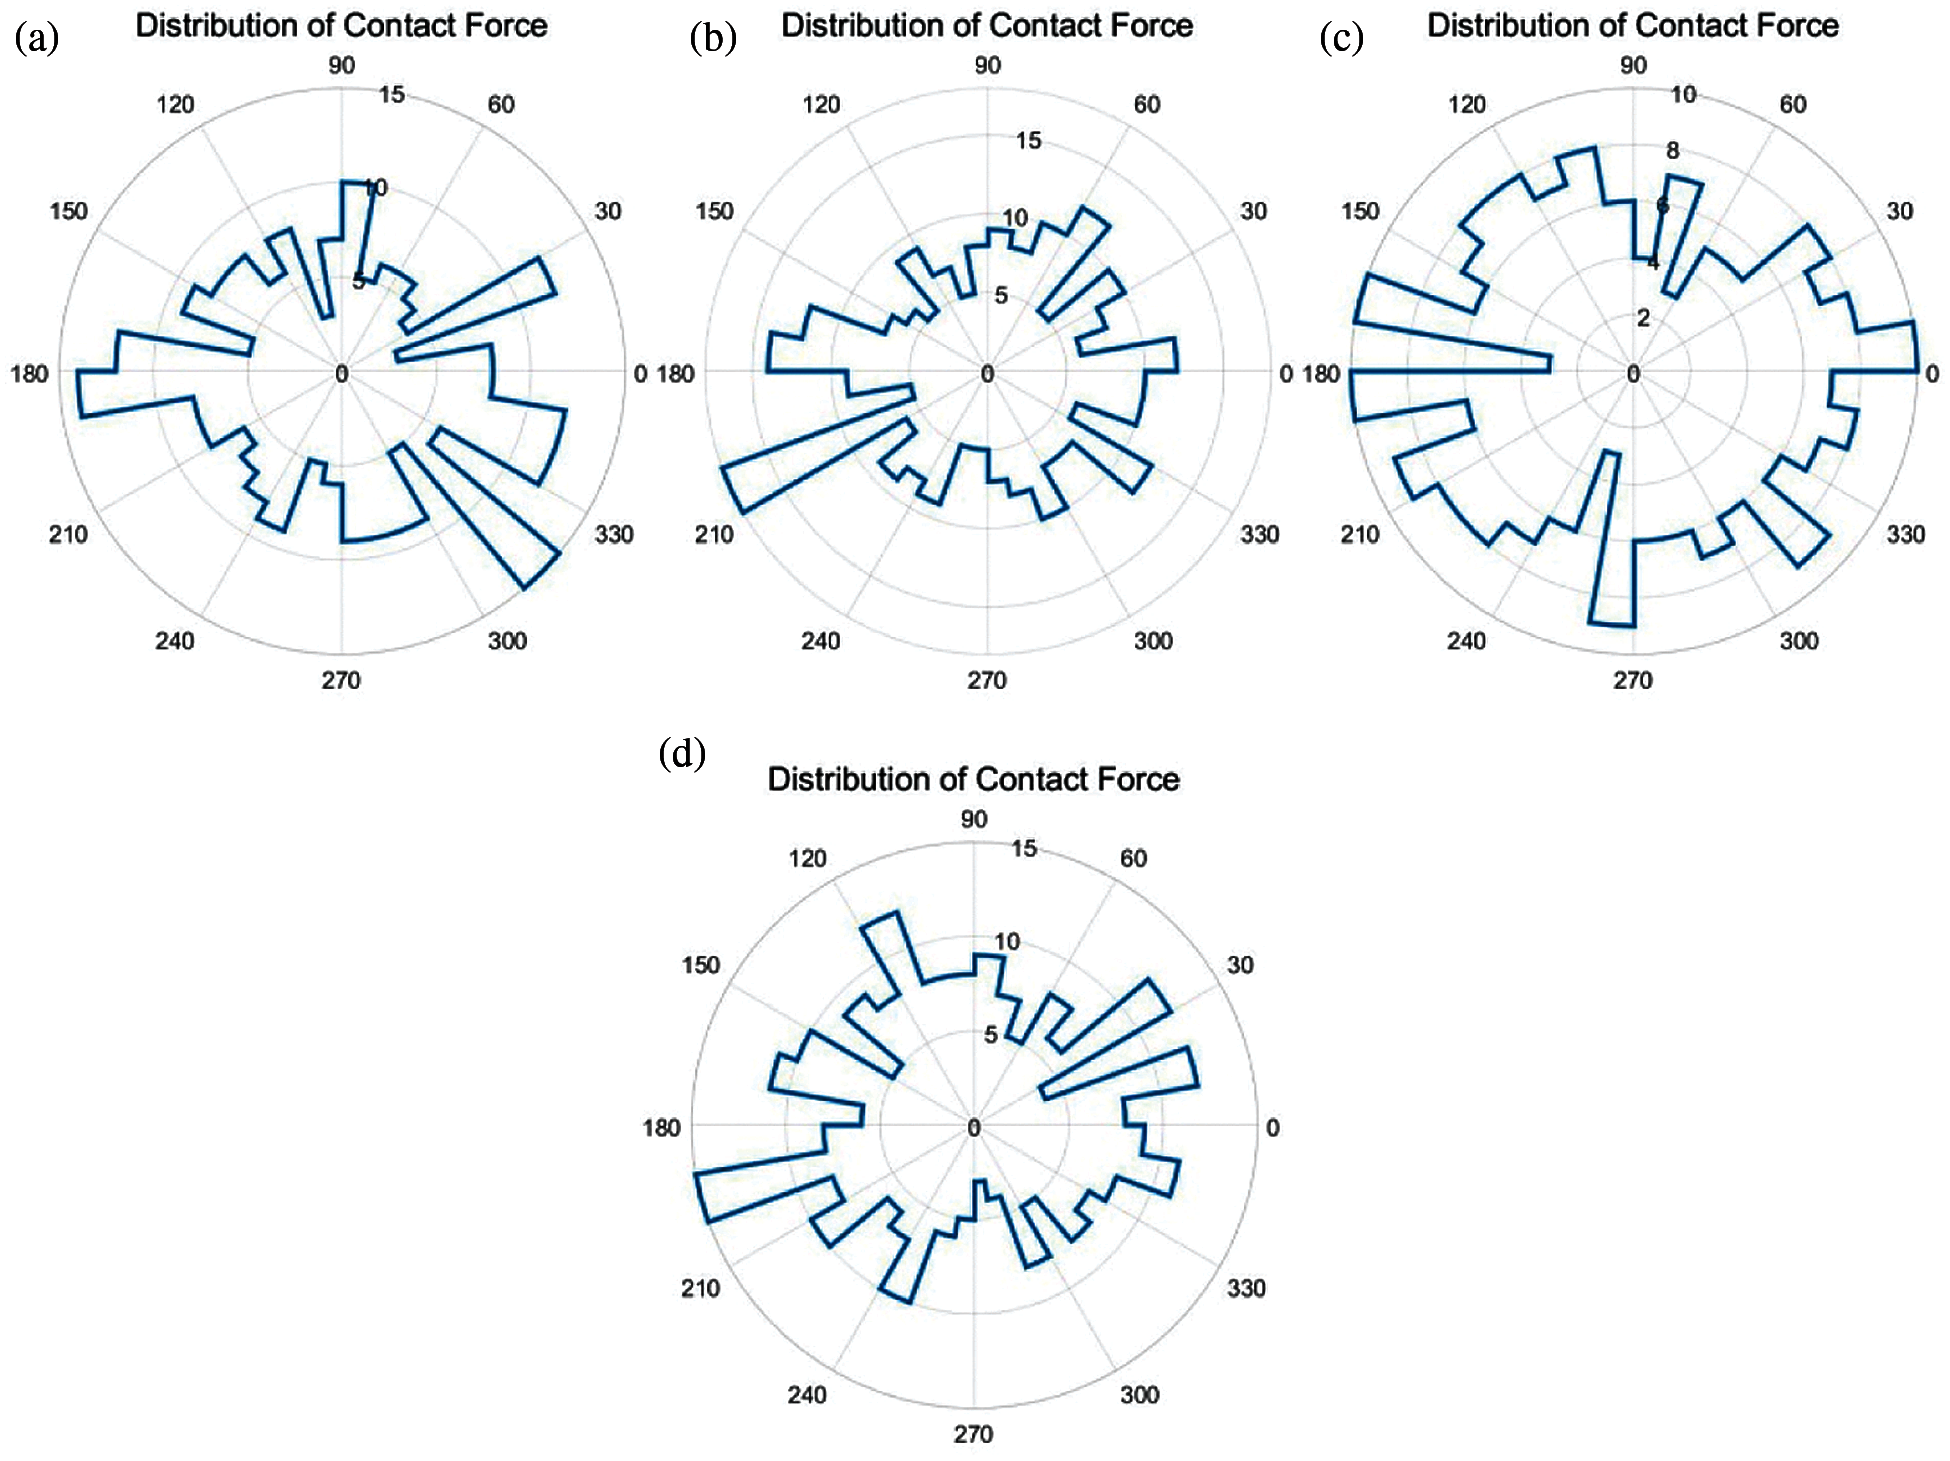
Figure 12: Contact force distribution in four regions at the start point of the initial cycle under constant confining stress condition. (a) Region 1 (b) Region 2 (c) Region 3 (d) Region 4
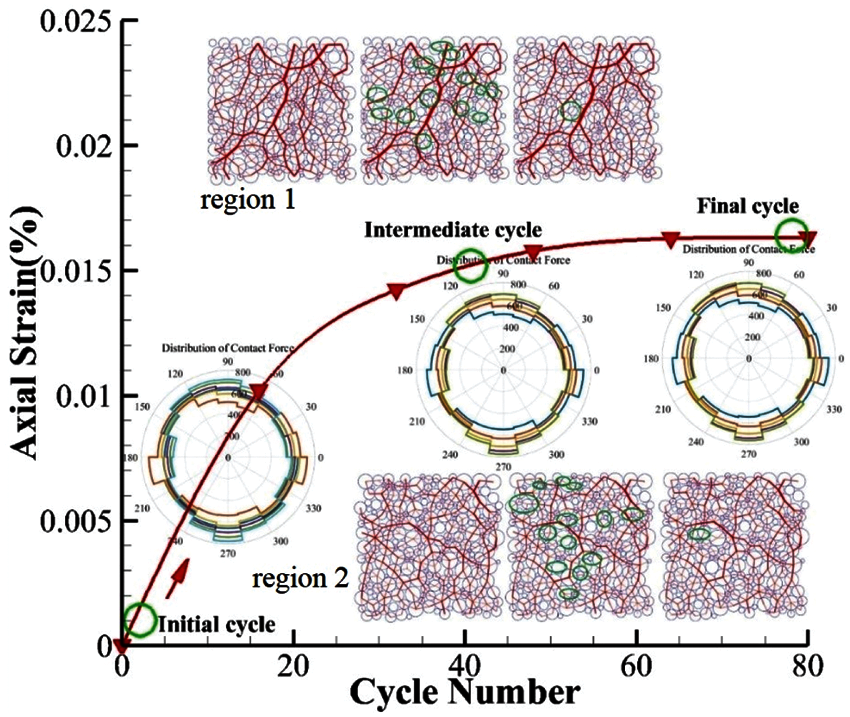
Figure 13: Correspondence between contact force distribution, force chain and axial strain during cyclic loading
This study mainly discussed the mechanical response of granular materials under different cyclic loading conditions. Macroscopically, the maximum axial strain is affected by the combination of consolidation pressure and cyclic dynamic stress. Higher confining stress conditions make the material more compact and the interaction between particles is stronger, which makes the material reach a stable state faster. The change of the relative positions of the particles causes the evolution of the internal mesostructures. Mesoscopically, both the contact normal and the force chain show obvious directionality. The strong and weak force chains in the material are directional, but the two directions are not completely overlapped. The strong force chain accounts for a small proportion and changes more dramatically during the loading process. The deformation mode of different positions in the material is different. The adjustment of the particle position under constant confining pressure is more obvious, which is beneficial to the improvement of the topological structure. This was further verified by the strain analysis. In general, under different cyclic loading conditions, granular materials exhibit specific macro- and meso-mechanical properties. This research will provide insights into the understanding of granular materials behaviors under cyclic loading.
Funding Statement: This work was supported by the National Natural Science Foundation of China (Nos. 11902228, 11772237) and the Fundamental Research Funds for Central Universities (No. 2682021CX083).
Conflicts of Interest: The authors declare that they have no conflicts of interest to report regarding the present study.
1. Kumar, N., Suhr, B., Marschnig, S., Dietmaier, P., Christof Marte, C. et al., (2019). Micro-mechanical investigation of railway ballast behavior under cyclic loading in a box test using DEM: Effects of elastic layers and ballast types. Granular Matter, 21(4). DOI 10.1007/s10035-019-0956-9. [Google Scholar] [CrossRef]
2. Jiang, X., Liu, E., Jiang, L., Tian, J., Sun, Y. (2018). Evolution of mesostructures and mechanical properties of granular materials under triaxial compression state from complex network perspective. Granular Matter, 20(3), 54. DOI 10.1007/s10035-018-0827-9. [Google Scholar] [CrossRef]
3. Tian, J., Liu, E. (2018). Effect of particle shape on micro- and mesostructured evolution of granular assemblies under biaxial loading conditions. Comptes Rendus Mécanique, 346, 1233–1252. DOI 10.1016/j.crme.2018.08.013. [Google Scholar] [CrossRef]
4. Gu, X., Huang, M., Qian, J. (2014). DEM investigation on the evolution of microstructure in granular soils under shearing. Granular Matter, 16, 91–106. DOI 10.1007/s10035-013-0467-z. [Google Scholar] [CrossRef]
5. Guo, N., Zhao, J. (2013). The signature of shear-induced anisotropy in granular media. Computer and Geotechnics, 47, 1–15. DOI 10.1016/j.compgeo.2012.07.002. [Google Scholar] [CrossRef]
6. Sitharam, T., Vinod, J., Ravishankar, B. (2009). Post-liquefaction undrained monotonic behaviour of sands: Experiments and DEM simulations. Géotechnique, 59(9), 739–749. DOI 10.1680/geot.7.00040. [Google Scholar] [CrossRef]
7. Phusing, D., Suzuki, K. (2015). Cyclic behaviors of granular materials under generalized stress condition using DEM. Journal of Engineering Mechanics, 141(10), 04015034. DOI 10.1061/(ASCE)EM.1943-7889.0000921. [Google Scholar] [CrossRef]
8. Sazzad, M. (2004). Micro-scale behavior of granular materials during cyclic loading. Particuology, 16, 132–141. DOI 10.1016/j.partic.2013.12.005. [Google Scholar] [CrossRef]
9. Rothenburg, L., Kruyt, N. P. (2004). Critical state and evolution of coordination number in simulated granular materials. International Journal of Solids & Structures, 41, 5763–5774. DOI 10.1016/j.ijsolstr.2004.06.001. [Google Scholar] [CrossRef]
10. Wichtmann, T., Triantafyllidis, T. (2015). An experimental database for the development, calibration and verification of constitutive models for sand with focus to cyclic loading: Part I—tests with monotonic loading and stress cycles. Acta Geotechnica, 11(4), 739–761. DOI 10.1007/s11440-015-0402-z. [Google Scholar] [CrossRef]
11. Wichtmann, T., Triantafyllidis, T. (2015). An experimental database for the development, calibration and verification of constitutive models for sand with focus to cyclic loading: Part II—tests with strain cycles and combined loading. Acta Geotechnica, 11(4), 763–774. DOI 10.1007/s11440-015-0412-x. [Google Scholar] [CrossRef]
12. Li, X., Li, X. S. (2009). Micro-macro quantification of the internal structure of granular materials. Journal of Engineering Mechanics, 135(7), 641–656. DOI 10.1061/(ASCE)0733-9399(2009)135:7(641). [Google Scholar] [CrossRef]
13. Shire, T., O'Sullivan, C., Barreto, D., Gaudray, G. (2013). Quantifying stress-induced anisotropy using inter-void constrictions. Géotechnique, 63(1), 85–91. DOI 10.1680/geot.11.T.020. [Google Scholar] [CrossRef]
14. Ventouras, K., Coop, M. R. (2009). On the behaviour of Thanet Sand: An example of an uncemented natural sand. Géotechnique, 59(9), 727–738. DOI 10.1680/geot.7.00061. [Google Scholar] [CrossRef]
15. Fonseca, J., O'Sullivan, C., Coop, M. R., Lee, P. (2012). Non-invasive characterization of particle morphology of natural sands. Soils & Foundations, 52(4), 712–722. DOI 10.1016/j.sandf.2012.07.011. [Google Scholar] [CrossRef]
16. Wang, G., Wei, J. (2016). Microstructure evolution of granular soils in cyclic mobility and post-liquefaction process. Granular Matter, 18(3), 51. DOI 10.1007/s10035-016-0621-5. [Google Scholar] [CrossRef]
17. Wei, J., Huang, D., Wang, G. (2018). Microscale descriptors for particle void distribution and jamming transition in pre- and post-liquefaction of granular soils. Journal of Engineering Mechanics, 144(8), 04018067. DOI 10.1061/(ASCE)EM.1943-7889.0001482. [Google Scholar] [CrossRef]
18. Huang, X., Kwok, C. Y., Hanley, K. J., Zhang, Z. (2018). DEM analysis of the onset of flow deformation of sands, linking monotonic and cyclic undrained behaviors. Acta Geotechnica, 13(5), 1061–1074. DOI 10.1007/s11440-018-0664-3. [Google Scholar] [CrossRef]
19. Wang, R., Fu, P., Zhang, J., Dafalias, Y. F. (2016). DEM study of fabric features governing undrained post-liquefaction shear deformation of sand. Acta Geotechnica, 11(6), 1321–1337. DOI 10.1007/s11440-016-0499-8. [Google Scholar] [CrossRef]
20. Tordesillas, A., Walker, D. M., Lin, Q. (2010). Force cycles and force chains. Physical Review E Statistical. Nonlinear, and Soft Matter, 81(1), 011302. DOI 10.1103/PhysRevE.81.011302. [Google Scholar] [CrossRef]
21. Cao, P., Liu, E., Jiang, L. (2017). Evolution of the mesoscopic parameters and mechanical properties of granular materials upon loading. Mathematical Problems in Engineering, 4, 1–12. DOI 10.1155/2017/9314689. [Google Scholar] [CrossRef]
22. Jiang, L., Liu, E., Tian, J., Jiang, X. (2017). Effects of inter-particle frictional coefficients on evolution of contact networks in landslide process. Engineering, 09(11), 917–936. DOI 10.4236/eng.2017.911055. [Google Scholar] [CrossRef]
23. Tian, J., Liu, E., Jiang, L., Jiang, X., Sun, Y. et al. (2018). Influence of particle shape on the microstructure evolution and the mechanical properties of granular materials. Comptes Rendus Mécanique, 346(6), 460–476. DOI 10.1016/j.crme.2018.03.006. [Google Scholar] [CrossRef]
24. Radjai, F., Jean, M., Moreau, J., Roux, S. (1996). Force distributions in dense two-dimensional granular systems. Physical Review Letter, 77, 274–277. DOI 10.1103/PhysRevLett.77.274. [Google Scholar] [CrossRef]
25. Radjai, F., Wolf, D. E., Jean, M., Moreau, J. (1998). Bimodal character of stress transmission in granular packings. Physical Review Letter, 80, 61–64. DOI 10.1103/PhysRevLett.80.61. [Google Scholar] [CrossRef]
26. Tordesillas, A. (2007). Force chain buckling, unjamming transitions and shear banding in dense granular assemblies. Philosophical Magazine, 87(32), 4987–5016. DOI 10.1080/14786430701594848. [Google Scholar] [CrossRef]
27. Thornton, C., Antony, S. J. (2000). Quasi-static shear deformation of a soft particle system. Powder Technology, 109, 179–191. DOI 10.1016/S0032-5910(99)00235-1. [Google Scholar] [CrossRef]
28. Tang, H., Xing, Z., Ji, S. (2016). Discrete element analysis for shear band modes of granular materials in triaxial tests. Particulate Science & Technology, 35(3). DOI 10.1080/02726351.2016.1153547. [Google Scholar] [CrossRef]
29. Sun, Y., Liu, E., Jiang, L., Tian, J., Xu, R. (2020). Dynamic mechanical properties and mesostructure evolution of granular materials subjected to cyclic loading. Granular Matter, 22(3), 3. DOI 10.1007/s10035-020-01042-w. [Google Scholar] [CrossRef]
30. Wang, J., Chu, X. (2016). Heterogeneity of particle assemblies and discrete element simulation on its mechanical behaviors. Powder Technology, 314, 59–68. DOI 10.1016/j.powtec.2016.09.055. [Google Scholar] [CrossRef]
31. Wang, J., Chu, X. (2018). Compressive wave propagation in highly ordered granular media based on DEM. International Journal of Nonlinear Science & Numerical Simulation, 19(5), 545–552. DOI 10.1515/ijnsns-2017-0213. [Google Scholar] [CrossRef]
32. Satake, M. (1983). Fundamental quantities in the graph approach to granular materials. Studies in Applied Mechanics, 7, 9–19. DOI 10.1016/B978-0-444-42192-0.50008-6. [Google Scholar] [CrossRef]
33. Wautier, A., Bonelli, S., Nicot, F. (2017). Scale separation between grain detachment and grain transport in granular media subjected to an internal flow. Granular Matter, 19(2), 22. DOI 10.1007/s10035-017-0706-9. [Google Scholar] [CrossRef]
34. Liu, J., Wautier, A., Bonelli, S., J., Liu A Wautier, S., Bonelli François (2020). Macroscopic softening in granular materials from a meso-scale perspective. International Journal of Solids & Structures, 193, 222–238. DOI 10.1016/j.ijsolstr.2020.02.022. [Google Scholar] [CrossRef]
35. Zhu, H., Nicot, F., Darve, F. (2016). Meso-structure evolution in a 2D granular material during biaxial loading. Granular Matter, 18(1), 3. DOI 10.1007/s10035-016-0608-2. [Google Scholar] [CrossRef]
 | This work is licensed under a Creative Commons Attribution 4.0 International License, which permits unrestricted use, distribution, and reproduction in any medium, provided the original work is properly cited. |