| Computer Modeling in Engineering & Sciences |
DOI: 10.32604/cmes.2022.018181
ARTICLE
Dynamic Fatigue Reliability Analysis of Transmission Gear Considering Failure Dependence
1College of Locomotive and Rolling Stock Engineering, Dalian Jiaotong University, Dalian, 116028, China
2School of Mechanical Engineering, Dalian Jiaotong University, Dalian, 116028, China
*Corresponding Author: Yonghua Li. Email: yonghuali@163.com
Received: 05 July 2021; Accepted: 20 August 2021
Abstract: Multiple failure modes and strength degradation are usually inherent in the gear transmission system, which brings new challenges for conducting fatigue reliability analysis and design. This paper proposes a novel dynamic fatigue reliability analysis method for failure dependence and strength degradation based on the combination of the Copula function and Gamma process. Firstly, the dynamic simulation model of the gear transmission system is established to obtain the dynamic stress-time history. The Gamma process is then used to describe the strength degradation to establish the dynamic stress-strength interference model. The marginal distribution functions of tooth contact fatigue and dedendum bending fatigue are calculated respectively based on the dynamic interference model. Finally, the joint distribution of the two failure modes can be obtained by the t-Copula function to characterize the failure dependence, and so the dynamic fatigue reliability considering failure dependence can be estimated. The effectiveness of the proposed method is illustrated with examples. The results reveal the temporal law of reliability and the effects of failure dependence on dynamic fatigue reliability.
Keywords: Gear transmission system; failure dependence; dynamic fatigue reliability; the Gamma process; the Copula function
The gear transmission system has the advantages of compact structure, high carrying capacity, and high efficiency, and it is one of the most widely used transmission modes in the modern industry. Although various fields have different requirements for using the gear transmission system, the most fundamental requirement is high stability and high reliability [1]. There are many potential failure modes in a gear transmission system due to uncertain factors such as load cases, geometric parameters, and material properties [2–5]. Furthermore, the above uncertainties have homology, and there will be different degrees of the dependence relationship between failure modes [6]. When one failure occurs, the process of another failure mode will be affected. In the design process of the gear transmission system, whether to consider the failure dependence has a significant impact on the reliability. Meanwhile, the structural strength will gradually degenerate with increased service time, which aggravates gear failure probability growth, so the reliability shows a downward trend. Therefore, it is necessary to introduce failure dependence and dynamic reliability modeling in the whole design process to provide a more accurate reliability evaluation for gear transmission system design.
Many scholars have studied reliability considering failure dependence and obtained outstanding achievements. Many traditional methods are used to analyze the failure correlation of mechanical components, most of these methods are based on correlation coefficients. Ditlevsen [7,8] given the narrow reliability bounds theory through strict reasoning and proof, is widely accepted by many scholars. This theory can solve mechanical structure reliability with multiple failure modes, which is undoubtedly a milestone. Nevertheless, this method depends on the correlation coefficient, and it is difficult to achieve accurate calculations with the increase of failure modes number. Besides, the calculation result of this method is only an interval, which cannot give accurate reliability. Based on Ditlevsen’s theory, Low et al. [9] simplified the calculation of fault probability boundary by programming, and effectively expanded the application value of narrow reliability bounds theory. Wang et al. [10] introduced the dependence function to quantify the failure dependence among the components, and the method is applied to the parallel system. The research results focused on the influence of the dependence relationship on structural reliability. Although the above research effectively solves the problem of reliability solutions under the coexistence of multiple failure modes, the description of dependency based on correlation coefficient has the following limitations. First, the disadvantage of the linear correlation coefficient is that it may lose the possibility of the theoretical solution, because it cannot determine the joint probability density function. Second, the difficulty of solving the linear correlation coefficient with the increase of failure modes is insurmountable. Most importantly, the linear correlation coefficient can only reveal the first-order linear relationship, but it cannot describe the more complex and higher-order actual relationship between failure modes [11,12]. In recent years, the applicability of the Copula function in solving the problem of correlation is favored by many scholars and has achieved good results. Tang et al. [13] studied the differences of two-dimensional variable correlation models constructed by different Copula functions and analyzed their influence on reliability analysis results. Pan et al. [14] established the dependence relationship between two output performance characteristics of a structural system based on the Copula function. Eryilmaz et al. [15] developed a Copula-based reliability modeling method that uses the multivariate Copula. Because the Copula function only uses one parameter to describe the dependence relationship between variables, it is not suitable for describing a high-dimensional situation. Therefore, some scholars transform multivariate dependence into binary dependence, making the Copula function more practical [16–18]. Shen et al. [19] evaluated the structural reliability under various failure modes by using Rosenblatt transform and Monte Carlo simulation method. This research provides a new way to solve the multivariate reliability problem.
In this paper, the Copula function is used to characterize the dependence relationship of failure modes in solving the fatigue reliability of the gear transmission system. The Gamma process is introduced to describe the strength degradation, and combined with the dynamic stress-time history to establish the dynamic fatigue reliability model. The research results reveal the influence of failure dependence and strength degradation on gear transmission systems reliability, which has an excellent guiding significance for the design and maintenance of gears.
This paper has four parts. The Copula function theory is introduced in Section 2, and the reliability model of the gear transmission system considering failure dependence is constructed. The strength degradation and dynamic stress-strength interference model are detailed in Section 3. The Gamma process is used to reveal the law of strength degradation. Section 4 proposes an engineering practice example to validate the proposed approach. It is shown to be more in line with the engineering practice than the reliability calculation results without failure dependence.
2 Reliability Model of the Gear Transmission System
The coexistence of multiple failure modes is an essential feature of the mechanical structure. There is a different degree of dependence relationship that exists between various failure modes. For example, there is a positive relationship between fatigue crack growth and fatigue pitting of gear teeth. The failure dependence will seriously affect the structure safety function and make the reliability analysis and modeling more complex. According to the mechanical principle and gear transmission characteristics, the reliability model under different failure modes is established. The reliability of the gear transmission system considering the failure dependence is researched.
2.1 Reliability Model Based on Dedendum Bending Fatigue
It is easy for the dedendum to produce fatigue crack in the transmission process, resulting in the bending fatigue fracture. The dedendum bending stress of gears can be calculated as [20]
where
Dedendum bending fatigue strength of gears can be calculated as
where
According to the stress-strength interference theory, the performance function of dedendum bending fatigue can be expressed as
If the value of the performance function is negative, the structure is a failure. On the contrary, if the value is positive, the structure is safe. The border between the negative and positive domains is called the limit state
2.2 Reliability Model Based on Tooth Contact Fatigue
The tooth contact fatigue is the common cause of gear failure and is affected by design geometry, material, manufacturing, and other variables. The contact stress of gears can be calculated as [20]
where
Allowable contact fatigue strength of gears can be calculated as
where
The performance function of tooth contact fatigue can be expressed as
Sklar’s theorem: Any multivariate joint distribution can be written in terms of univariate marginal distribution functions and a Copula function, which describes the dependence structure between the two variables. In other words, the Copula function connects the joint distribution of multivariate random variables with their respective marginal distribution. The Copula function has the following properties [16,21,22].
(1)
(2) For vector
(3) When
(4)
Supposing that
According to the inverse transformation of cumulative distribution function for marginal distribution
When the random variables are two-dimensional, the Copula function is
3 Dynamic Stress-Strength Interference Model
3.1 Dynamic Stress-Strength Interference Theory
The normal operation of a mechanical structure depends on the relationship between strength and stress. In the design service period, if the stress at any moment is greater than the structural strength, the structure will fail; when the stress is less than the strength, the structure will appear cumulative fatigue damage, reducing the structure strength until it fails [23–27]. The traditional structural reliability analysis based on the static stress-strength interference model does not consider the influence of time-variant strength on reliability. Due to the impact of random factors such as material oxidation, load fluctuation, and environmental corrosion, the structural strength will gradually decrease in engineering practice, showing a deterioration trend called strength degradation [28–30]. The dynamic stress-strength interference model is constructed, as shown in Fig. 1.
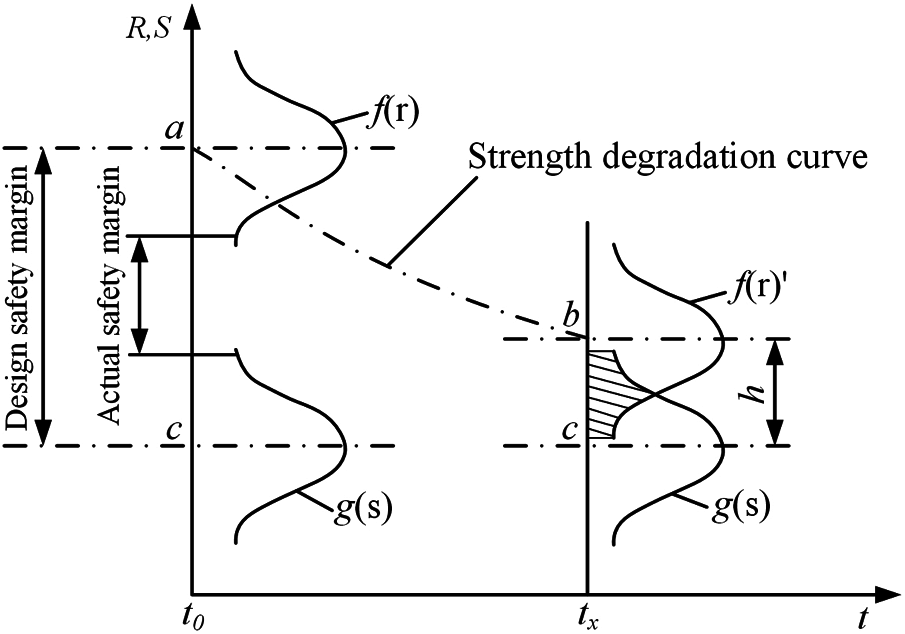
Figure 1: Dynamic stress-strength interference theory
As time goes on, the mean value of structural strength and its probability density distribution function
where
The structural reliability considering the strength degradation during the service period
Strength degradation is an external characterization of structural performance degradation under the action of various stochastic factors, which will lead to the reduction of structural safety and reliability. From the macroscopic point of view, strength degradation is a continuous process with randomness and irreversibility, which is caused by the characteristics of the structure as well as stress effects. The effects caused by strength degradation should be fully considered when performing structural dynamic reliability analysis. Stochastic process theory is usually used to describe the general law of strength degradation. Since the Gamma process [31,32] is an independent and non-negative incremental process, it is considered a natural choice to describe the degradation process. The Gamma process can describe both small degradation fluctuations and drastic steps, and is well characterized for the degradation mechanism of various structures. The probability density function
where
The Gamma process has the following characteristics.
(1) The probability of
(2) When
(3)
The mathematical expectation
Although there are some fluctuations in the strength degradation process, it is generally a stationary random process during engineering experience. Therefore, the shape parameter is a linear function
Considering the essential characteristics of structural strength degradation, the
(1) The
(2) Let
(3) The estimated values of characteristic parameters
Combined with the above introduction, the flow chart of this paper is shown in Fig. 2.
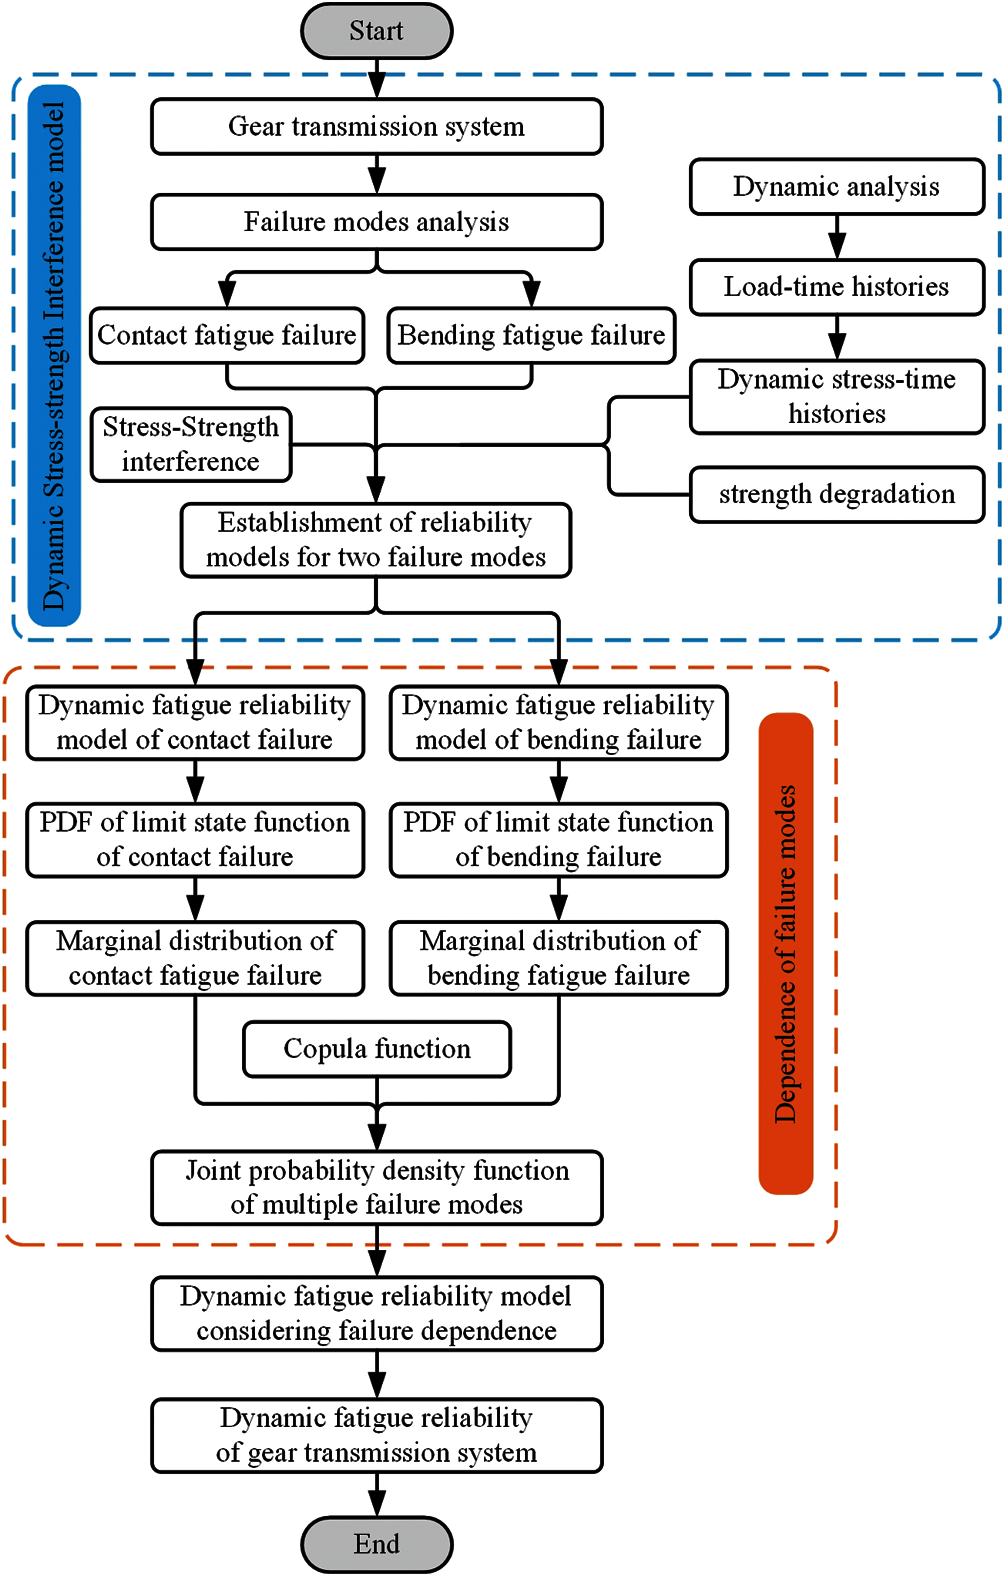
Figure 2: Flow chart of the thesis
4 Dynamic Fatigue Reliability Analysis Considering Failure Dependence
4.1 Dynamic Fatigue Reliability Model
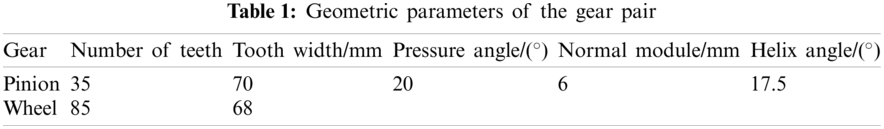
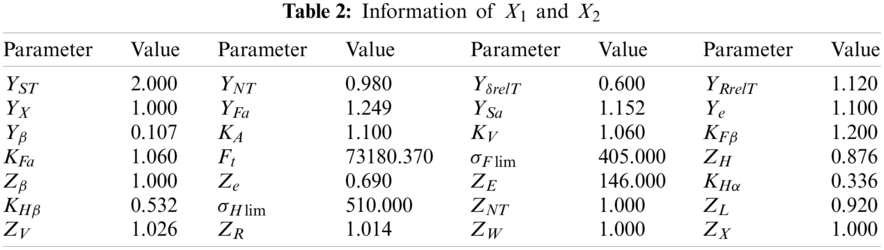
Taking a certain type of EMU gear transmission system as the research object, the dynamic model is constructed according to actual geometric parameters and constraints. According to the 615 kW input power and 4,200 r/min driving gear speed, constant traction torque is applied to the model. The geometric parameters of the gear pair are shown in Table 1. The values of each random variable in
The load-time history of the gear transmission system is obtained by dynamic analysis. The stress-time history is obtained by substituting the load-time history into Eqs. (1) and (4), as shown in Fig. 3. It can be seen that the fluctuation of dedendum bending stress and tooth contact stress fluctuate randomly with time, respectively. Therefore, when the strength degenerates to a certain extent, the gear transmission system may fail, even if the average strength is not less than the stress.
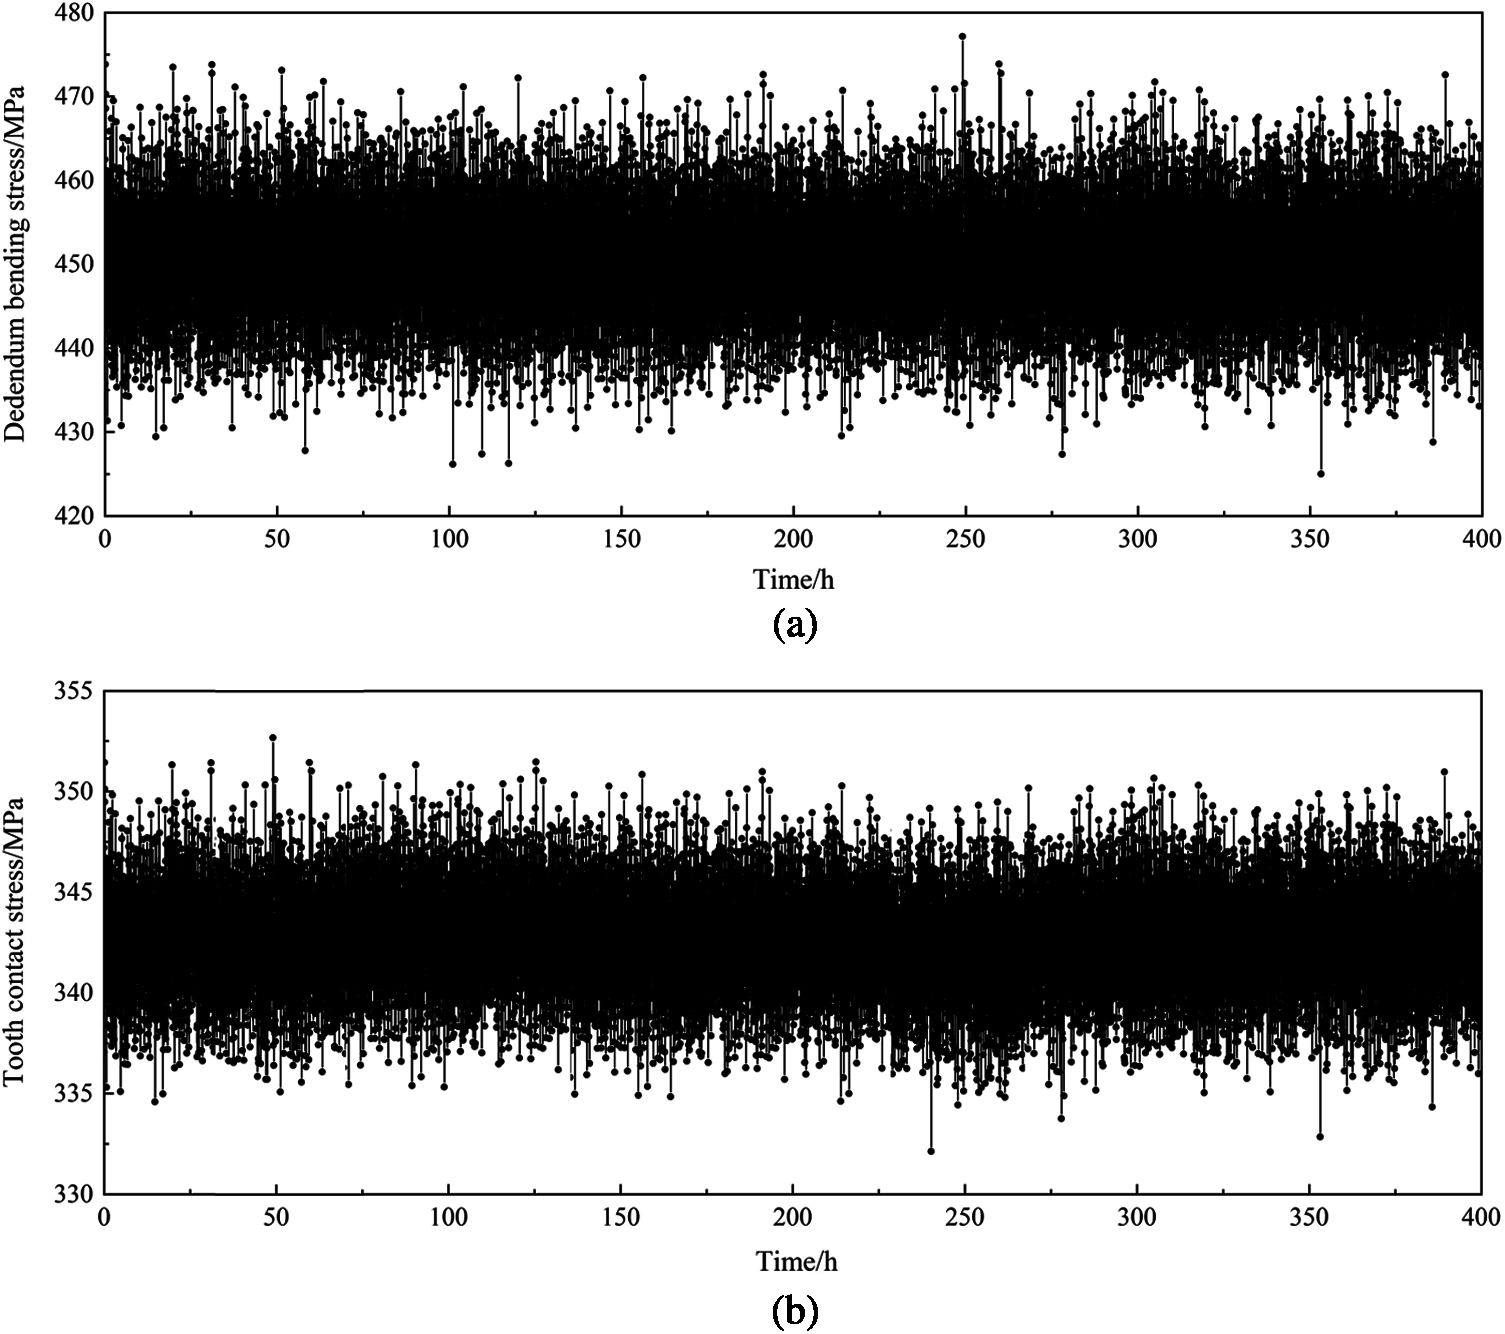
Figure 3: Stress-time history of the gear pair (a) Dedendum bending stress (b) Tooth contact stress
The strength degradation is described by Gamma random process. The
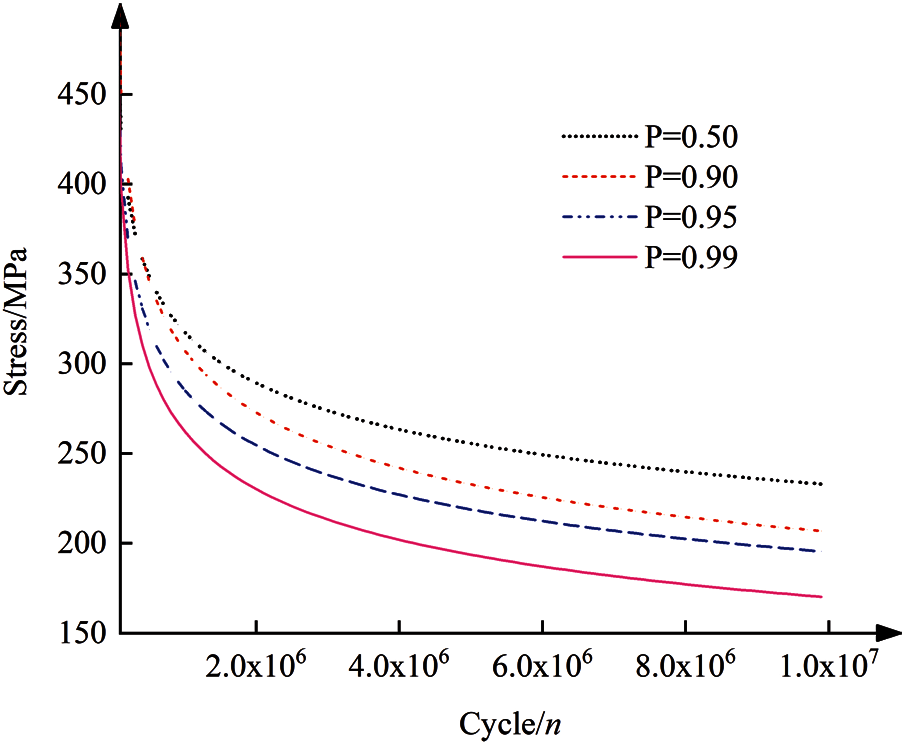
Figure 4: The P–S–N curve of the gear material
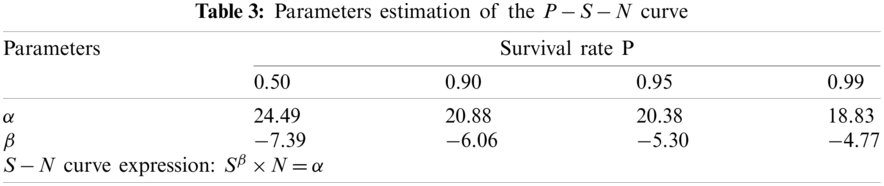
Define the unit of operating time of the gearing system as
The value of strength degradation
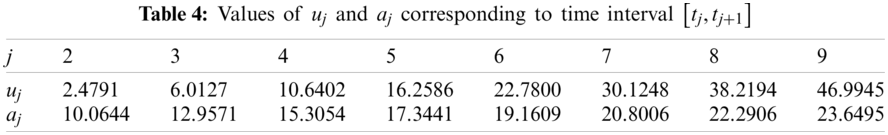
Through the above analysis, the strength degradation of the gear pair can be described as a Gamma process with a shape parameter of 19.2490t and a dimension parameter of 29.6223. By substituting the dynamic stress-time history and Gamma process into Eq. (3) and Eq. (6), the dynamic fatigue reliability model of the gear is constructed. The performance function values of tooth contact and dedendum bending are obtained by numerical calculation.
4.2 Characterization of Failure Dependence
Nonparametric kernel distribution estimation is used to select the optimal Copula function. The core idea of this method is to use nonparametric kernel distribution to estimate the marginal distribution of
The marginal distribution functions of
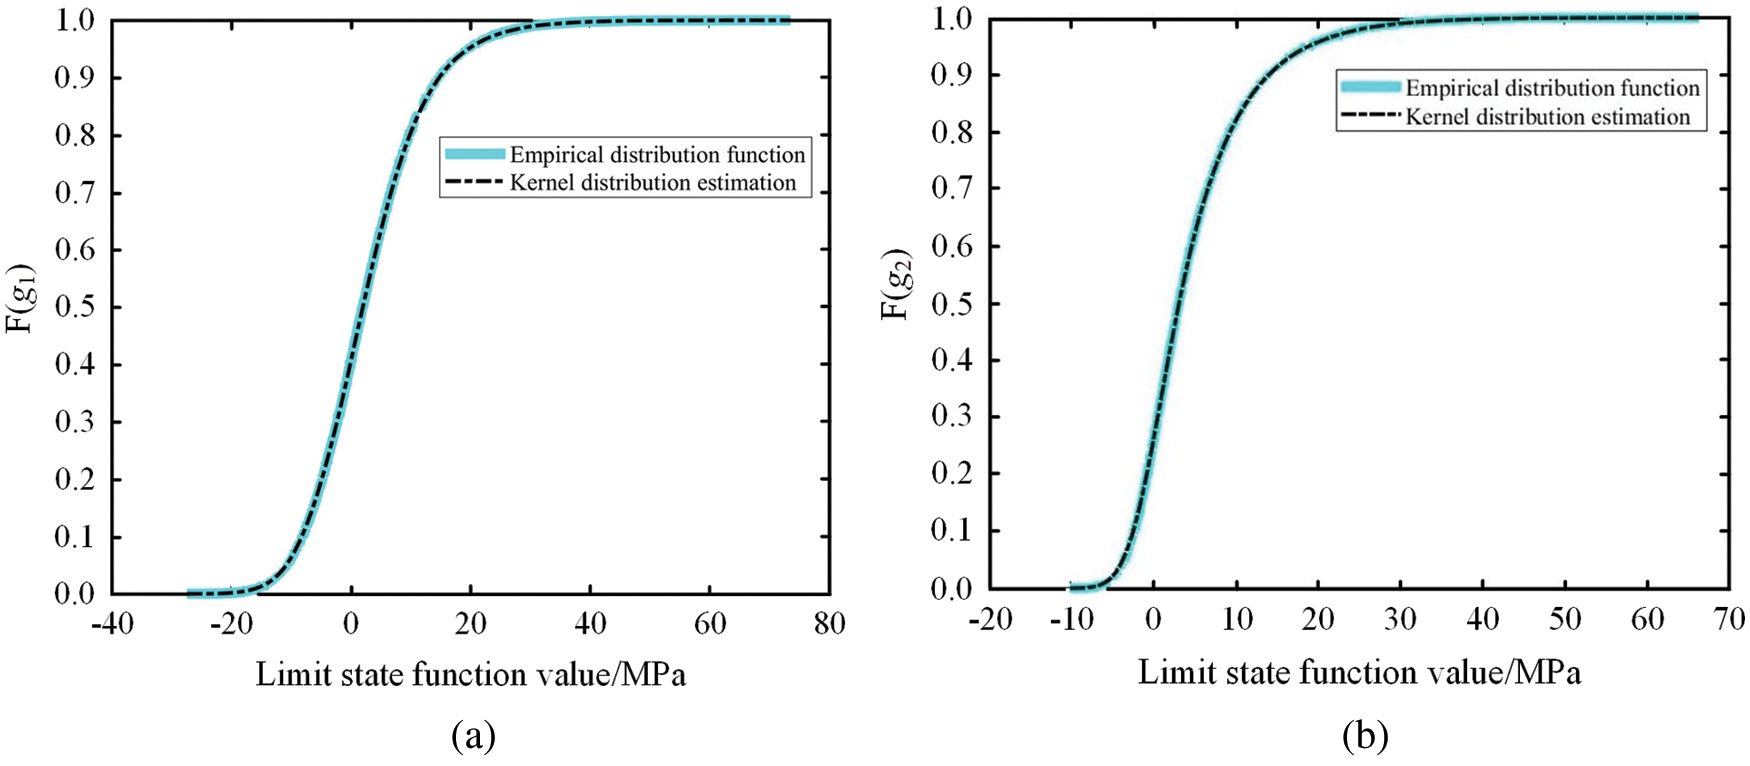
Figure 5: Marginal distribution of limit state functions (a) Dedendum bending (b) Tooth contact
The bivariate frequency histogram (shown in Fig. 6) is drawn as the joint density function for the two failure modes to choose the appropriate Copula function. Fig.6 shows the frequency histogram has tail symmetry, so the Gauss Copula function and t-Copula function are preliminarily selected to fit the dependence relationship of two failure modes. The expressions of the Gauss Copula function and t-Copula function are as follows:
where
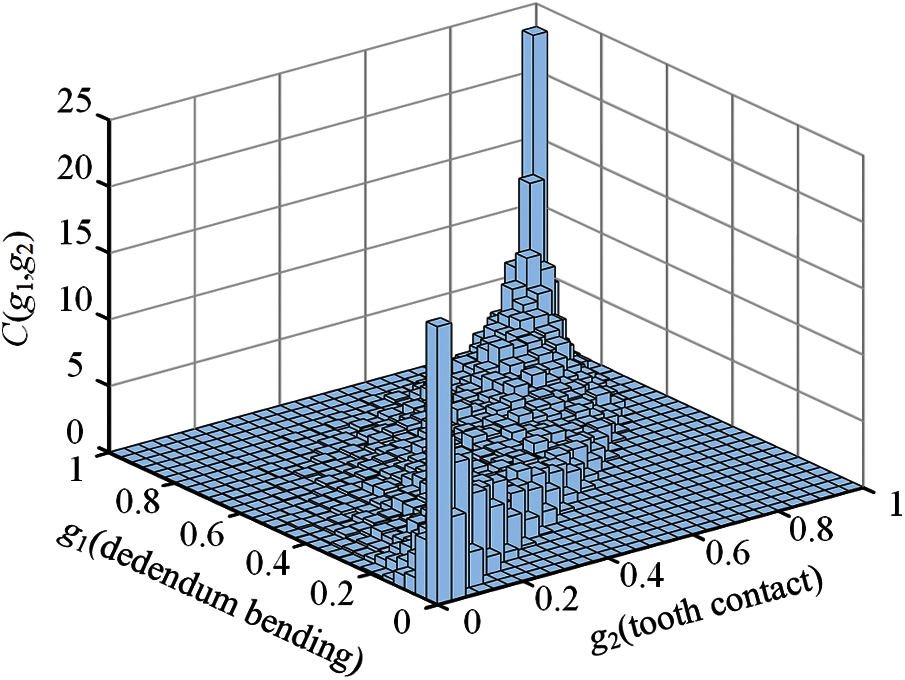
Figure 6: Bivariate frequency histogram
The parameters estimation results for the Gauss Copula and t-Copula functions are calculated, respectively. The coefficient matrix R of Gauss Copula is as follows:
The coefficient matrix R and degree of freedom
It is substituting the R and
where
According to the results in Table 5, the Square Euclid distance between the t-Copula function and the empirical Copula function was the smallest. It indicates that the t-Copula function is more appropriate to describe the dependence relationship. The density function and distribution function of the t-Copula is shown in Fig. 7. It can be seen that the t-Copula function has good tail correlation characteristics, which can well fit the dependence relationship between the tooth contact fatigue and dedendum bending fatigue.
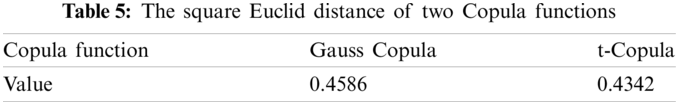
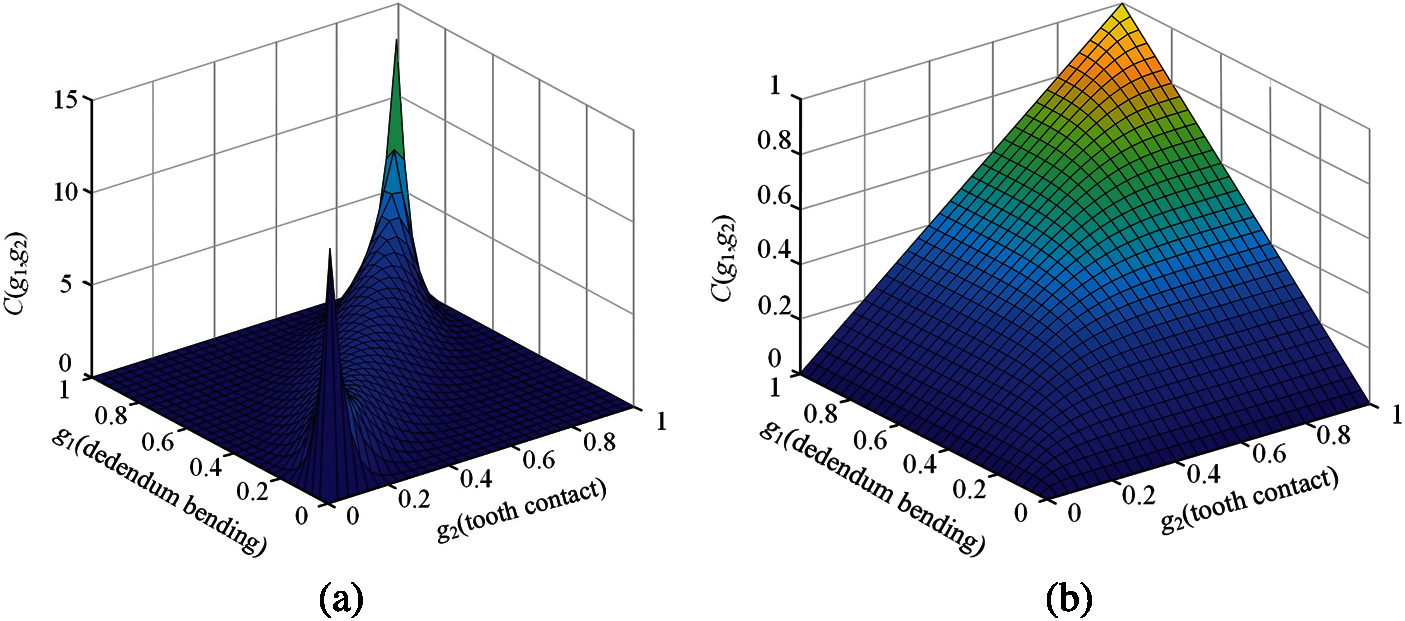
Figure 7: The t-Copula function diagram (a) Density function (b) Distribution function diagram
4.3 Dynamic Fatigue Reliability Analysis Results
Substituting the above-calculated parameters into Eq. (9), the dynamic fatigue reliability of gear transmission system considering failure dependence is obtained, as shown in Fig. 8.
It can be seen from Fig.8 that the reliability gradually decreases due to the strength degradation with the increase of service time. The dynamic fatigue reliability of the gear transmission system has an inevitable fluctuation. The main reason for the reliability fluctuation is that both the dynamic contact stress and dedendum bending stress has randomness. Because of the dependence relationship between the two failure modes, the reliability is lower than that of the single failure mode, and the fluctuation is more obvious. The results show that the failure dependence greatly influences the reliability of the gear transmission system. In this paper, only infant mortality (assume 400 hours) is analyzed, and the reliability is following the description of the bathtub curve. The study provides a theoretical basis for considering the correlation in the design stage. Compared with the deterministic reliability analysis, the result is more suitable for engineering practice.
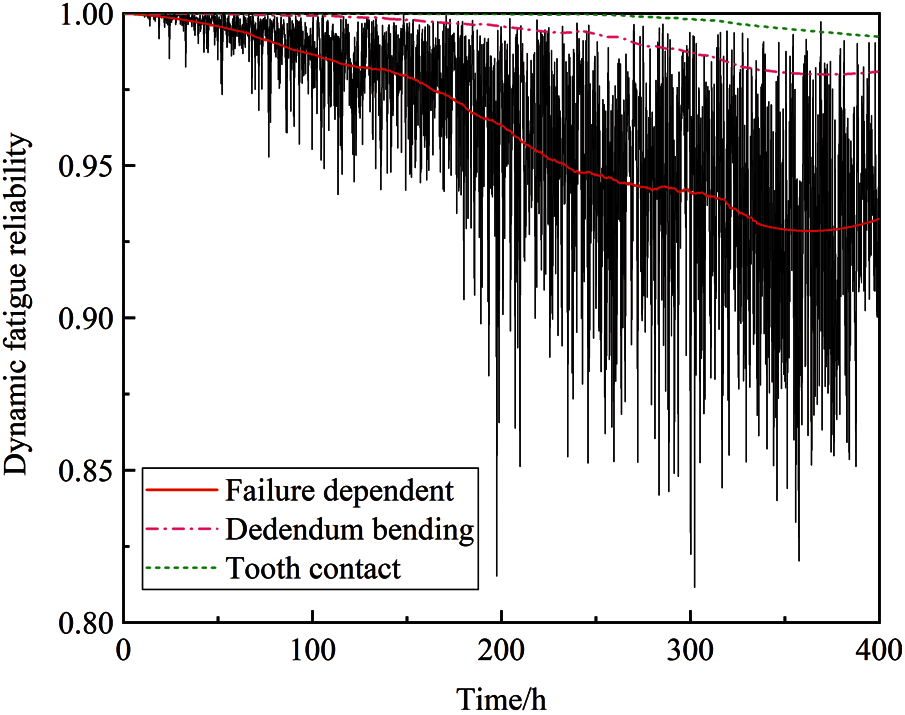
Figure 8: Dynamic fatigue reliability of the gear transmission system
In this paper, a novel dynamic fatigue reliability analysis method for failure dependence and strength degradation is proposed, which provides an effective approach for dynamic fatigue reliability analysis of gear transmission systems in the design stage. We first constructed each failure mode’s function based on stress-strength interference and gear transmission theory, then used the Copula function to characterize the dependence relationship between failure modes. Simultaneously, we introduce the Gamma process to describe structural strength degradation to construct a dynamic fatigue reliability model.
A practical engineering example illustrated the dynamic fatigue reliability considering failure dependence is more in line with the engineering practice, reflecting the influence of failure dependence and strength degradation on reliability. The results show that the gear strength degradation follows the Gamma process with a shape parameter of 19.2490t and a dimension parameter of 29.6223. The reliability of the gear transmission system considering failure dependence is about 0.94 after 400 h, which is lower than that under a single failure mode. It shows that the dependence relationship has a significant influence on structural reliability. The safety of the design can be guaranteed by considering the failure dependence and strength degradation.
This study opens avenues for more accurate calculation of failure probability and determination of design parameters in the design stage. Moreover, the research results can provide essential data for making maintenance cycles and plans.
Funding Statement: This work was supported by the National Natural Science Foundation of China under Contract No. 51875073, the Scientific Research Project of Education Department of Liaoning Province under Contract No. JDL2019005, the Dalian Science and Technology Innovation Fund Plan under Contract No. 2019J11CY017, the Innovation Team Support Plan of Liaoning Higher Education under Contract No. LT2016010.
Conflicts of Interest: The authors declare that they have no conflicts of interest to report regarding the present study.
1. Li, H. N., Chen, S. Y., Tang, J. Y., Chen, W. T., Ouyang, H. W. (2019). A novel approach for calculating no-load static transmission error based on measured discrete tooth surfaces. Mechanism and Machine Theory, 138, 112–123. DOI 10.1016/j.mechmachtheory.2019.03.044. [Google Scholar] [CrossRef]
2. Zhu, S. P., Keshtegar, B., Trung, N., Yaseen, Z. M., Bui, D. T. (2021). Reliability-based structural design optimization: Hybridized conjugate mean value approach. Engineering with Computers, 37(1), 381–394. DOI 10.1007/s00366-019-00829-7. [Google Scholar] [CrossRef]
3. Meng, D., Li, Y., Zhu, S. P., Lv, G., Correia, J. et al. (2019). An enhanced reliability index method and its application in reliability-based collaborative design and optimization. Mathematical Problems in Engineering, 2019(2), 1–10. DOI 10.1155/2019/4536906. [Google Scholar] [CrossRef]
4. Zhi, P. P., Xu, Y., Chen, B. Z. (2020). Time-dependent reliability analysis of the motor hanger for EMU based on stochastic process. International Journal of Structural, 11(3), 453–469. DOI 10.1108/ijsi-07-2019-0075. [Google Scholar] [CrossRef]
5. Zhi, P. P., Li, Y. H., Chen, B. Z., Shi, S. S. (2020). Bounds-based structure reliability analysis of bogie frame under variable load cases. Engineering Failure Analysis, 114(2), 104541. DOI 10.1016/j.engfailanal.2020.104541. [Google Scholar] [CrossRef]
6. Park, C., Kim, N. H., Haftka, R. T. (2015). The effect of ignoring dependence between failure modes on evaluating system reliability. Structural and Multidisciplinary Optimization, 52(2), 251–268. DOI 10.1007/s00158-015-1239-7. [Google Scholar] [CrossRef]
7. Ditlevsen, O. (1983). System reliability bounding by conditioning. Journal of Engineering Mechanics, 109(4), 1156. DOI 10.1061/(ASCE)0733-9399(1983)109:4(1156). [Google Scholar] [CrossRef]
8. Ditlevsen, O. (1979). Narrow reliability bounds for structural systems. Journal of Structural Mechanics, 7(4), 453–472. DOI 10.1080/03601217908905329. [Google Scholar] [CrossRef]
9. Low, B. K., Zhang, J., Tang, W. H. (2011). Efficient system reliability analysis illustrated for a retaining wall and a soil slope. Computers and Geotechnics, 38(2), 196–204. DOI 10.1016/j.compgeo.2010.11.005. [Google Scholar] [CrossRef]
10. Wang, L. Y., Zhang, J., Chen, W., Jia, X. J. (2016). Reliability evaluation of a load-sharing parallel system with failure dependence. Communications in Statistics: Simulation and Computation, 45(9), 3094–3113. DOI 10.1080/03610918.2014.920880. [Google Scholar] [CrossRef]
11. Yu, S., Wang, Z. L., Meng, D. B. (2018). Time-variant reliability assessment for multiple failure modes and temporal parameters. Structural and Multidisciplinary Optimization, 58(4), 1705–1717. DOI 10.1007/s00158-018-1993-4. [Google Scholar] [CrossRef]
12. Lu, H., Zhu, Z. C. (2018). A method for estimating the reliability of structural systems with moment-matching and Copula concept. Mechanics Based Design of Structures and Machines, 46(2), 196–208. DOI 10.1080/15397734.2017.1324312. [Google Scholar] [CrossRef]
13. Tang, X. S., Li, D. Q., Zhou, C. B., Zhang, L. M. (2013). Bivariate distribution models using Copulas for reliability analysis. Proceedings of the Institution of Mechanical Engineers Part O Journal of Risk & Reliability, 227(5), 499–512. DOI 10.1177/1748006X13481928. [Google Scholar] [CrossRef]
14. Pan, Z. Q., Balakrishnan, N., Sun, Q., Zhou, J. L. (2012). Bivariate degradation analysis of products based on wiener processes and Copulas. Journal of Statistical Computation and Simulation, 83(7), 1316–1329. DOI 10.1080/00949655.2012.658805. [Google Scholar] [CrossRef]
15. Eryilmaz, S. (2014). Multivariate Copula based dynamic reliability modeling with application to weighted-k-out-of-n systems of dependent components. Structural Safety, 51, 23–28. DOI 10.1016/j.strusafe.2014.05.004. [Google Scholar] [CrossRef]
16. Gu, Y. K., Fan, C. J., Liang, L. Q., Zhang, J. (2019). Reliability calculation method based on the Copula function for mechanical systems with dependent failure. Annals of Operations Research, 85(5–6), 320. DOI 10.1007/s10479-019-03202-5. [Google Scholar] [CrossRef]
17. Xu, D., Wei, Q. D., Elsayed, E. A., Chen, Y. X., Kang, R. (2016). Multivariate degradation modeling of smart electricity meter with multiple performance characteristics via vine Copulas. Quality and Reliability Engineering International, 33(4), 803–821. DOI 10.1002/qre.2058. [Google Scholar] [CrossRef]
18. Zhang, J. C., Ma, X. B., Zhao, Y. (2017). A stress-strength time-varying correlation interference model for structural reliability analysis using Copulas. IEEE Transactions on Reliability, 66(2), 1–15. DOI 10.1109/TR.2017.2694459. [Google Scholar] [CrossRef]
19. Shen, L. J., Zhang, Y. G., Song, B. F., Song, K. L. (2020). Reliability evaluation and importance analysis of structural systems considering dependence of multiple failure modes. Engineering with Computers. DOI 10.1007/s00366-020-01100-0. [Google Scholar] [CrossRef]
20. Kumar, P., Hirani, H., Agrawal, A. (2017). Fatigue failure prediction in spur gear pair using AGMA approach. Materials Today: Proceedings, 4(2), 2470–2477. DOI 10.1016/j.matpr.2017.02.099. [Google Scholar] [CrossRef]
21. Sklar, M. (1960). Fonctions de répartition à n dimensions et leurs marges. Publications de l’Institut de Statistique de l’Université de Paris, 8, 229–231. [Google Scholar]
22. Nelsen, R. B. (2006). An introduction to copulas. New York: Springer. [Google Scholar]
23. Li, Y. H., Zhi, P. P., Xu, Y., Gong, Q. (2020). Time-variant reliability analysis of motor-hanger connecting bolts in electric trains. Forensic Engineering, 172(4), 125–132. DOI 10.1680/jfoen.20.00006. [Google Scholar] [CrossRef]
24. Zhu, S. P., Liu, Q., Peng, W., Zhang, X. C. (2018). Computational-experimental approaches for fatigue reliability assessment of turbine bladed disks. International Journal of Mechanical Sciences, 142(8), 502–517. DOI 10.1016/j.ijmecsci.2018.04.050. [Google Scholar] [CrossRef]
25. Qian, G., Lei, W. S. (2019). A statistical model of fatigue failure incorporating effects of specimen size and load amplitude on fatigue life. Philosophical Magazine, 99(17), 2089–2125. DOI 10.1080/14786435.2019.1609707. [Google Scholar] [CrossRef]
26. Qian, G., Lei, W. S., Niffenegger, M., González-Albuixech, V. F. (2018). On the temperature independence of statistical model parameters for cleavage fracture in ferritic steels. Philosophical Magazine, 98(11), 959–1004. DOI 10.1080/14786435.2018.1425011. [Google Scholar] [CrossRef]
27. Zhu, S. P., Liu, Q., Zhou, J., Yu, Z. Y. (2018). Fatigue reliability assessment of turbine discs under multi-source uncertainties. Fatigue & Fracture of Engineering Materials & Structures, 41(6), 1291–1305. DOI 10.1111/ffe.12772. [Google Scholar] [CrossRef]
28. Zhu, S. P., Liu, Q., Lei, Q., Wang, Q. Y. (2018). Probabilistic fatigue life prediction and reliability assessment of a high pressure turbine disc considering load variations. International Journal of Damage Mechanics, 27(10), 1569–1588. DOI 10.1177/1056789517737132. [Google Scholar] [CrossRef]
29. Zhu, S. P., Huang, H. Z., Peng, W. W., Wang, H. K., Mahadevan, S. K. (2016). Probabilistic physics of failure-based framework for fatigue life prediction of aircraft gas turbine discs under uncertainty. Reliability Engineering & System Safety, 146(1), 1–12. DOI 10.1016/j.ress.2015.10.002. [Google Scholar] [CrossRef]
30. Ai, Y., Zhu, S. P., Liao, D., Correia, J. A. F. O., Souto, C. et al. (2019). Probabilistic modeling of fatigue life distribution and size effect of components with random defects. International Journal of Fatigue, 126(7), 165–173. DOI 10.1016/j.ijfatigue.2019.05.005. [Google Scholar] [CrossRef]
31. Ling, M. H., Tsui, K. L., Balakrishnan, N. (2015). Accelerated degradation analysis for the quality of a system based on the Gamma process. IEEE Transactions on Reliability, 64(1), 463–472. DOI 10.1109/TR.2014.2337071. [Google Scholar] [CrossRef]
32. Jiang, P. H., Wang, B. X., Wu, F. T. (2018). Inference for constant-stress accelerated degradation test based on Gamma process. Applied Mathematical Modelling, 67(2), 123–134. DOI 10.1016/j.apm.2018.10.017. [Google Scholar] [CrossRef]
 | This work is licensed under a Creative Commons Attribution 4.0 International License, which permits unrestricted use, distribution, and reproduction in any medium, provided the original work is properly cited. |