| Computer Modeling in Engineering & Sciences |
DOI: 10.32604/cmes.2022.017574
ARTICLE
Assess Medical Screening and Isolation Measures Based on Numerical Method for COVID-19 Epidemic Model in Japan
1College of Engineering and Design, Hunan Normal University, Changsha, 410081, China
2School of Engineering and Technology, University of Washington, Tacoma, 98195, USA
3Faculty of Science, Massey University, Palmerston North, 4442, New Zealand
4State Key Laboratory of Developmental Biology of Freshwater Fish, Hunan Normal University, Changsha, 410081, China
*Corresponding Author: Jiaji Pan. Email: pan.jiaji@hunnu.edu.cn
Received: 21 May 2021; Accepted: 20 August 2021
Abstract: This study aims to improve control schemes for COVID-19 by a numerical model with estimation of parameters. We established a multi-level and multi-objective nonlinear SEIDR model to simulate the virus transmission. The early spread in Japan was adopted as a case study. The first 96 days since the infection were divided into five stages with parameters estimated. Then, we analyzed the trend of the parameter value, age structure ratio, and the defined PCR test index (standardization of the scale of PCR tests). It was discovered that the self-healing rate and confirmed rate were linear with the age structure ratio and the PCR test index using the stepwise regression method. The transmission rates were related to the age structure ratio, PCR test index, and isolation efficiency. Both isolation measures and PCR test medical screening can effectively reduce the number of infected cases based on the simulation results. However, the strategy of increasing PCR test medical screening would encountered a bottleneck effect on the virus control when the index reached 0.3. The effectiveness of the policy would decrease and the basic reproduction number reached the extreme value at 0.6. This study gave a feasible combination for isolation and PCR test by simulation. The isolation intensity could be adjusted to compensate the insufficiency of PCR test to control the pandemic.
Keywords: SEIDR epidemic model; multi-level and multi-objective problem; PCR test index; age structure; isolation measure
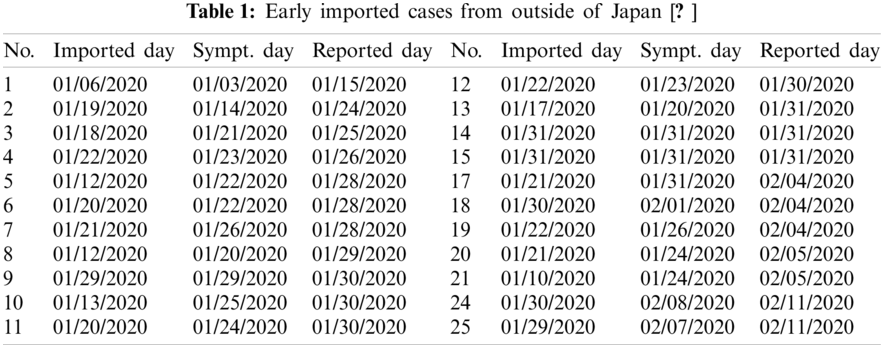
Since December 2019, the first COVID-19 infected case was diagnosed, the disease quickly spread to all Chinese province as well as over 200 countries and regions [1]. There were a large number of undocumented infected individuals which should facilitate the rapid dissemination of COVID-19 [2]. In Japan, the first infected case was reported on 15 February. From 15 January to 30 January 2020, the reported cases were the imported from outside of Japan. The first reported case in Japan came from Wuhan on 06 January 2020 with the onset of symptoms on 03 January 2020. Later, more infected individuals were imported and the spread the disease without testing or isolation. The imported cases with their serial number, imported days, the symptom days, and confirmed days are listed in Table 1 [3]. The exposed individuals, asymptomatic infected individuals, or individuals with mild symptoms were highly contagious, which leads to the virus quickly spread in Japan. It was estimated that 86% of all infections were undocumented infections in the early stage of COVID-19 spread [2]. Thus, non-pharmaceutical control strategies were adopted to stop the virus transmission such as increasing the isolation intensity.
Many mathematical models were raised to analyze the dynamics of the COVID-19 spread, effects of control strategies and offered guidance for the policy makers [4,5]. The most common models are in the original or revised form of susceptible-infected-recovered (SIR) or susceptible-exposed-infected-recovered (SEIR) models [6–11], which could be used for the prediction of the development of disease. In addition, some novel fictionalized mathematical models are raised to analyze the dynamic properties of COVID-19 transmission [12,13], in that introducing fractional derivative should demonstrate a better efficiency and superiority in the simulation of realistic problems [14–17]. Nevertheless, many studies analyzed the impact of single factor on the transmission including distancing measures, the portion of the old population, environmental condition to propose suggestions to control the epidemic [4,5,10,11,18–20]. Inspired by the previous work focusing on either isolation or testing strategies, multiple mixed variables are considered in this work to provide a more comprehensive analysis and offer guidance to cut off the disease transmission.
This study considers the influence of isolation measures, PCR test medical screening, and age structure on COVID-19. A simple susceptible-exposed-infected-documented-recovered (SEIDR) model is established. In the SEIDR model, the influence of isolation and PCR test medical screening will be quantitative description and analyzed. By applying this SEIDR model, a multi-level and multi-objective nonlinear programming model is constructed to estimate parameter values in the model. By solving the optimization problem, the first 96 days are divided into multiple stages, and the parameter values of each stage are obtained. According to the varying parameter values in different stages and the number of PCR tests, the PCR test scale index is defined. Through the stepwise regression method, the relationships among the parameters in the epidemic model, the age structure and PCR test scale index are fitted. By quantifying PCR test medical screening and isolation measures, simulations results illustrated that the isolation measures have a more substantial effect on disease control and prevention than that of PCR test medical screening. The combination of the two can maximize the effectiveness of the epidemic prevention and control.
The remaining part of this paper is structured as follows. Section 2 is to present the differential equations of the epidemic system and the algorithms to determine the parameters. The simulation results are reported in Section 3. The effects of age structure, PCR test index are estimated by the model. An explicit contour diagram of expected number of infected cases using combination of mixed strategies is given. The strategies could be adjusted accordingly. In Section 4, a summary of this study is given that isolation measures should be emphasized. The limitation of this work and future work are also discussed. In particular, we will focus on introducing fractional-order system as our future direction.
We construct the following SEIDR compartmental model to analyze the development of the disease transmission by estimating the values of system parameters.
where S(t), E(t), I(t), D(t) and R(t) denote the proportion of susceptible, exposed (incubation period), infected, documented and recovered by self-healing individuals in the entire populations at the time t, respectively. The documented class includes the confirmed cases under quarantine, cured and dead cases which are assumed to be unable to infect others. Obviously, S(t) + E(t) + I(t) + D(t) + R(t) = 1. β1 and β2 denote the transmission rate from the exposed and infected class, respectively. The incubation period is 1/μ. μ = 0.2 based on previous studies [21,22]. A proportion δ of the infected cases can recover by self-healing and γ is the confirmed rate of the infected individuals.
The basic reproduction number R0, expected value of secondary cases produced by one infected individual [23], is described as
2.2 Assumption of the Imported Individuals
COVID-19 data from the Ministry of Health, Labour et al. [3] are used for the investigation as a case study. The detailed information from official reports are also collected. January 2020 is set as time t = 0 when COVID-19 spread in Japan begins. Based on the Table 1, an individual is assumed as an imported exposed case when the symptomatic day of the individual is later than the imported day. When the symptomatic day of an individual is earlier than the imported day, the individual is assumed as an imported infected case. If the interval between the reported day and imported day is less than one day, the individual is regarded as an imported documented case. And the imported exposed case is assumed as the symptomatic day later than the imported day. Thus, the state of E(t), I(t) and D(t) should be updated by following equations considering these imported cases:
and
where Ein(t), Iin(t) and Din(t) donate the imported proportion at the time t.
2.3 Estimation of the Parameters
Appoint y(t), t = 0, 1,…, 96 as the cumulative reported cases of COVID-19 in Japan from 06 January to 10 April 2020. The strategies were adjusted as the development of COVID-19 spread. To simulate the dynamic state of the disease transmission, the parameters of the model were also change in this epidemic system. For instance, the suspension of business and school and confirmed rate increasing should shut down the transmission rates. At the same time, the self-healing rate should vary with the age structure of the infected cases.
In this work, we employ multi-level and multi-objective programming methods to estimate the parameters of the system in different stage during the early transmission in Japan. A nonlinear programming problem is constructed based on the least-squares method as follows:
where the superscript l denote the stage,
where
To avoid the contradiction between (7) and (8) and optimize the fitting with considering the accumulative error, an admissible upper bound
The traversing method is applied to solve the second level optimization problem and lsqnonlin function in MATLAB [6] is adopted to solve the first level optimization problem. The algorithm is designed as follows:
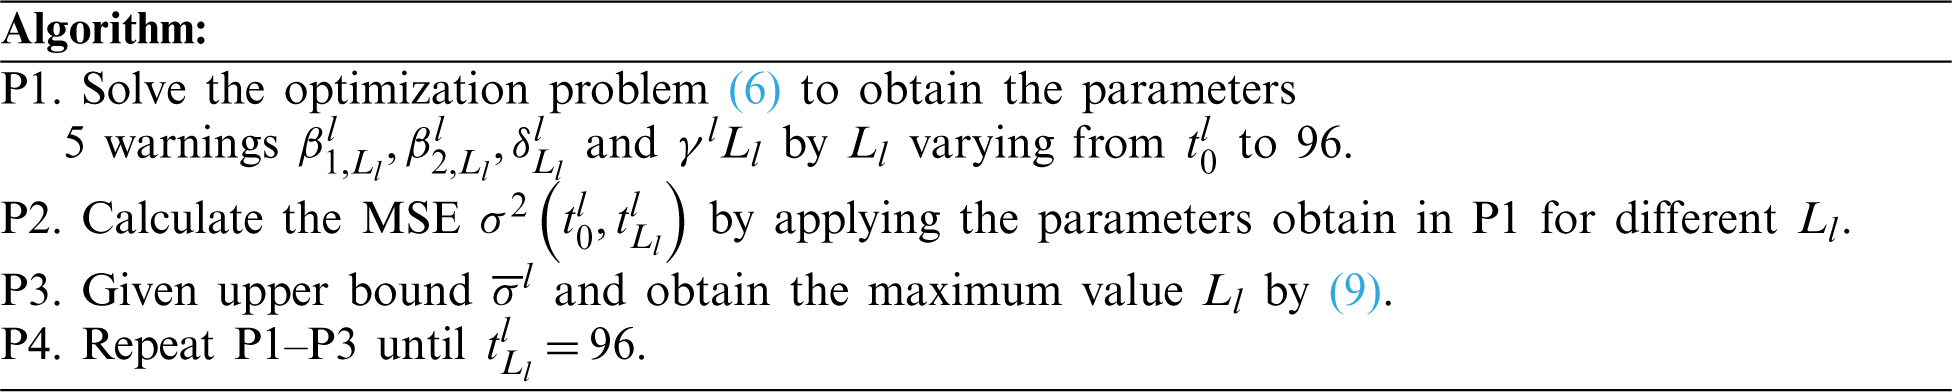
A flowchart is also provided to illustrate the calculation process of the algorithm (Fig. 1).
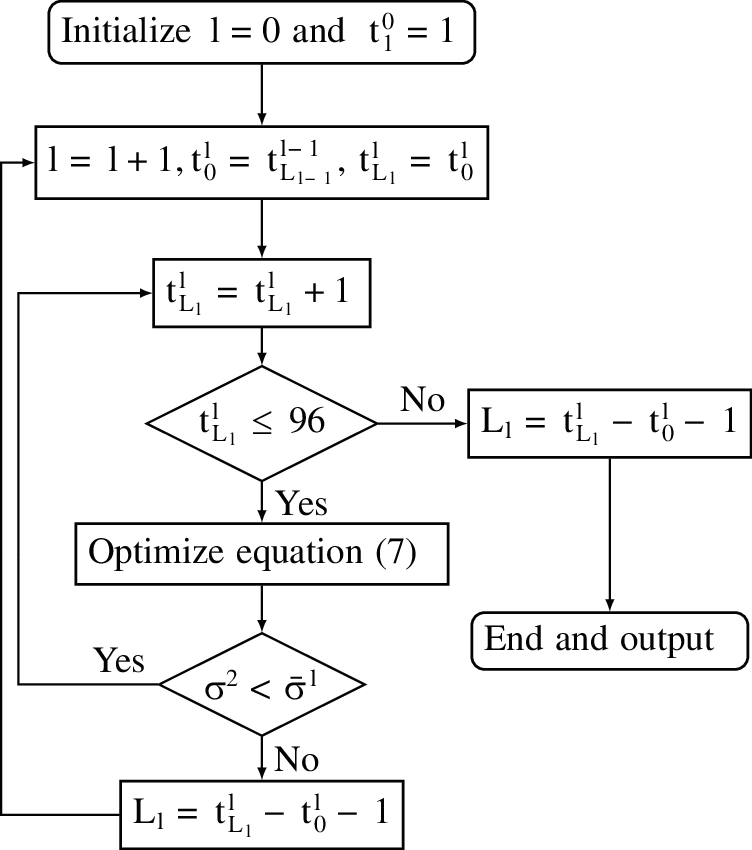
Figure 1: Flowchart of the proposed algorithm
3.1 Stages and Parameters Values
By applying the above algorithm, the early transmission period (96 days) are divided into five stages. The associated dynamic parameters are determined in each stage as illustrated in Table 2. The numerical simulated number of cases fits well with the real number of cases in the five stages (Fig. 2). For the first three stages during which the reported cases are relatively fewer, we set the upper bound of MSE
As shown in Table 2, R0 = 1.58 (95%CI, 1.4890–1.5967) in the first stage, which represents the rapid spreading of COVID-19. On 02 March 2020 [24], the Government of Japan announced policies of school suspension and financial assistance to parents to control this epidemic. In this stage, the transmission rates β1 and β2 are reduced to 0.1535 (95%CI, 0.1196–0.1839) and 0.3831 (95%CI, 0.3700–0.4698), respectively. R0 declines to 1.3485 (95%CI, 1.1499–1.4099). During the period between 16 March and 27 March 2020, R0 rose to 1.8572 (95%CI, 1.6758–1.9735), probably due to a large number of undocumented imported individuals from the Diamond Princess Cruise Ship. The undocumented individuals may increase the transmission rates without being isolated. R0 decreased and the confirmation rate γ increased in Stage 4. More PCR testing were performed to curb the disease transmission. But R0 rose to 2.0248 (95%CI, 1.6758–1.9735) and the confirmation rate γ reduced to 0.0327 (95%CI, 0.0212–0.0978) in the last stage. The variation of R0 and γ are presumed to be related to the PCR testing in the last two stages. The correlation analysis are investigated in the coming subsections.
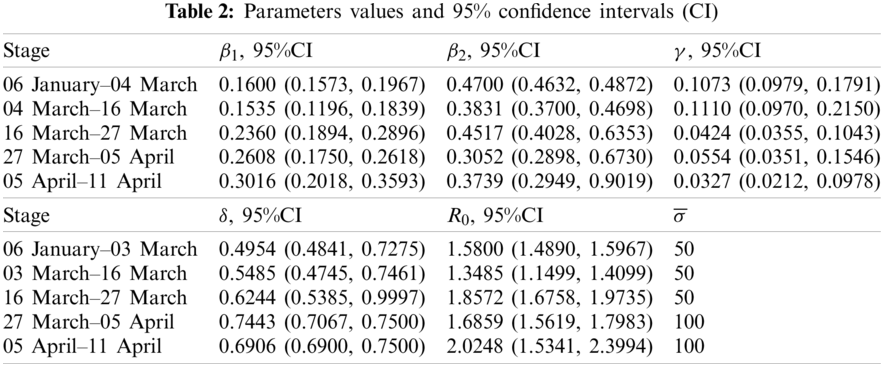
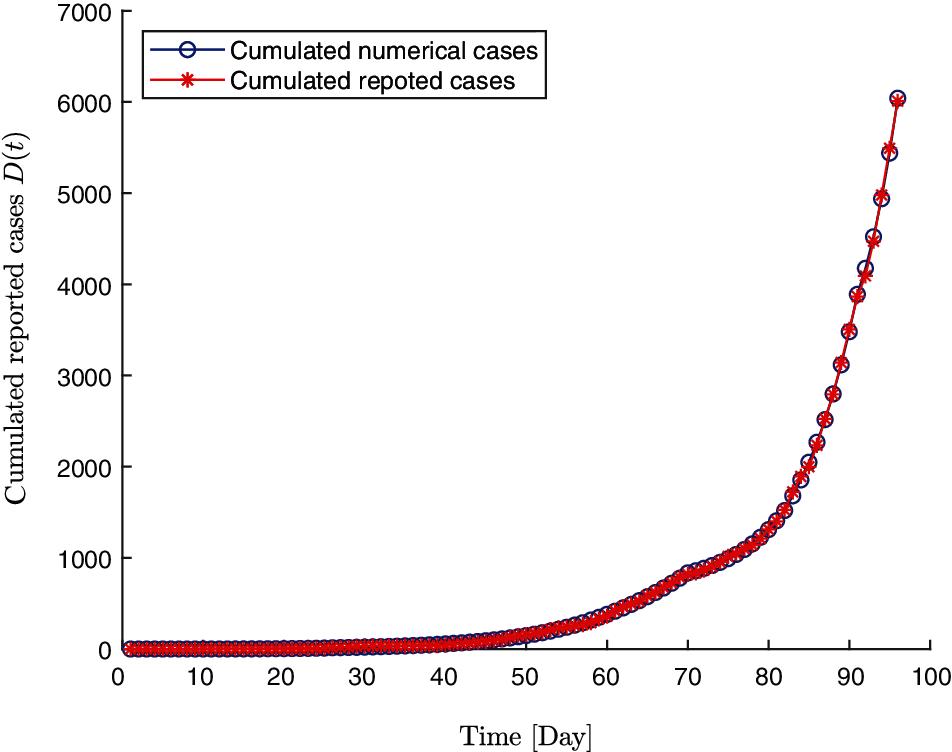
Figure 2: The numerical reported cases D(t) by estimated parameters and real reported cases y(t)
It is assumed that self-healing rate is related to the age structure of the individuals (shown in Fig. 3a). The proportion of infected individuals over 50 years old in each stage are given in the vector (10), the change of which in different stages correlates with the variation of self-healing rates as shown in Fig. 3b. By fitting the scatter points (ϱ, δ), the relationship between the two variables is given by the Eq. (11). The correlation coefficient between the two variables is 98.2%.
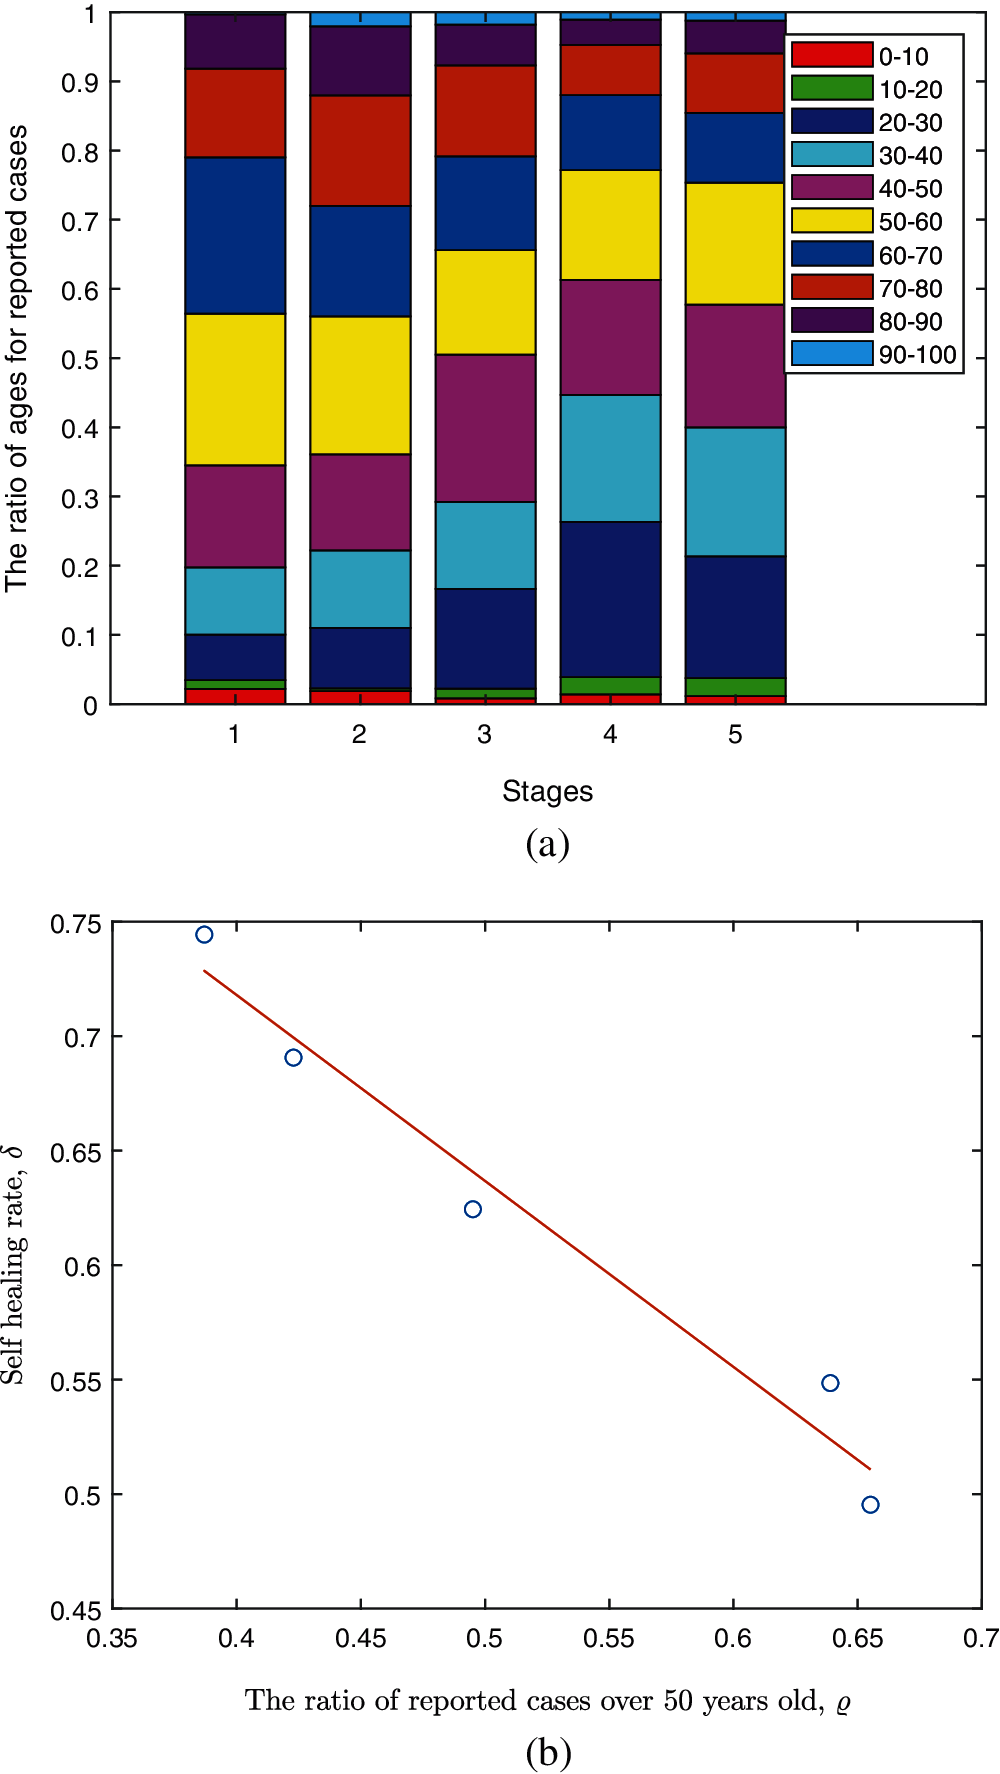
Figure 3: The age structure ratio in the five stages and relationship between ϱ and δ (a) Age structure ratio in the five stages (b) Scatter and fitting plot for ϱ vs. δ
The number of performed PCR test and infected cases to be confirmed are dependent on the duration of the stages dynamically divided by the algorithm. To evaluate the effect of the testing strategies, the intensity of PCR test is standardized for all the stages. We define an average PCR test index χl in Stage l as follows:
where
where starting time of the first stage is 13 February 2020 based on the first official report with PCR test information [25,26].
The PCR test index is varying in the five stages. χ is 0.1445 in Stage 1. In the second stage, the consultation counters were established for PCR tests. More tests were performed as required. Thus, the PCR test index increased to 0.1720. In Stages 3 and 4, the PCR indexes decreased considerably due to the rapid spread of COVID-19. The number of infected individuals to be confirmed increased remarkably while PCR kits were limited. In Stage 5, the testing was strengthened. The number of PCR tests reached 21,505 between 05 April to 09 April, which accounted for one-third of all the tests performed in the five stages. Thus, χ increased to 0.0712. According to the results in vector (13) and Table 2, the confirmation rate γ decreases with the PCR test index χ except in Stage 4 (χ was 0.0465 and γ increased to 0.0554 (95%CI, 0.0351–0.1546)). Based on the data in Table 2, the multiple stepwise regression analysis were conducted for vectors (10) and (13). β1 and β2 are given by the fitting as follows:
and
where ϕ(χ, ϱ) = 0.3437 − 703.7146χ3 + 0.2825 ϱ, ψ(χ, ϱ) = 0.2372 − 14.7645χ2 + 1.7771ϱ. κ denotes the effect of isolation measures. In the last four stages, κ is appointed as a constant 0.8500 corresponding to the government measures on 02 March. Moreover, the relationship between confirmation rate and PCR test index is fitted as follows:
Then, the proportion of population over 50 years old ρ is set as 0.4680 in the simulation of the disease spreading based on the Japan demographics. The trends of transmission parameters β1 (red line), β2 (blue line) and confirmation rate γ (black line) with increasing PCR test index χ are illustrated in Fig. 4a. The transmission parameter β1 would decrease when increasing χ initially. However, β1 remains a non-zero constant after χ reaches over 0.2. The testing measures should not completely disseminate the disease transmission. The variation of the basic reproduction numbers R0 with κ is shown in Fig. 4b. The three lines in different color represent the different intensities of isolation measures. The basic reproduction number R0 would decrease as intensifying the PCR test measures. However, the effect of enhancing PCR test would gradually weaken. The basic reproduction number R0 would reach a non-zero constant. After reaching a sufficient high PCR test index, it is the intensity of isolation measures κ that determines the minimum of R0.
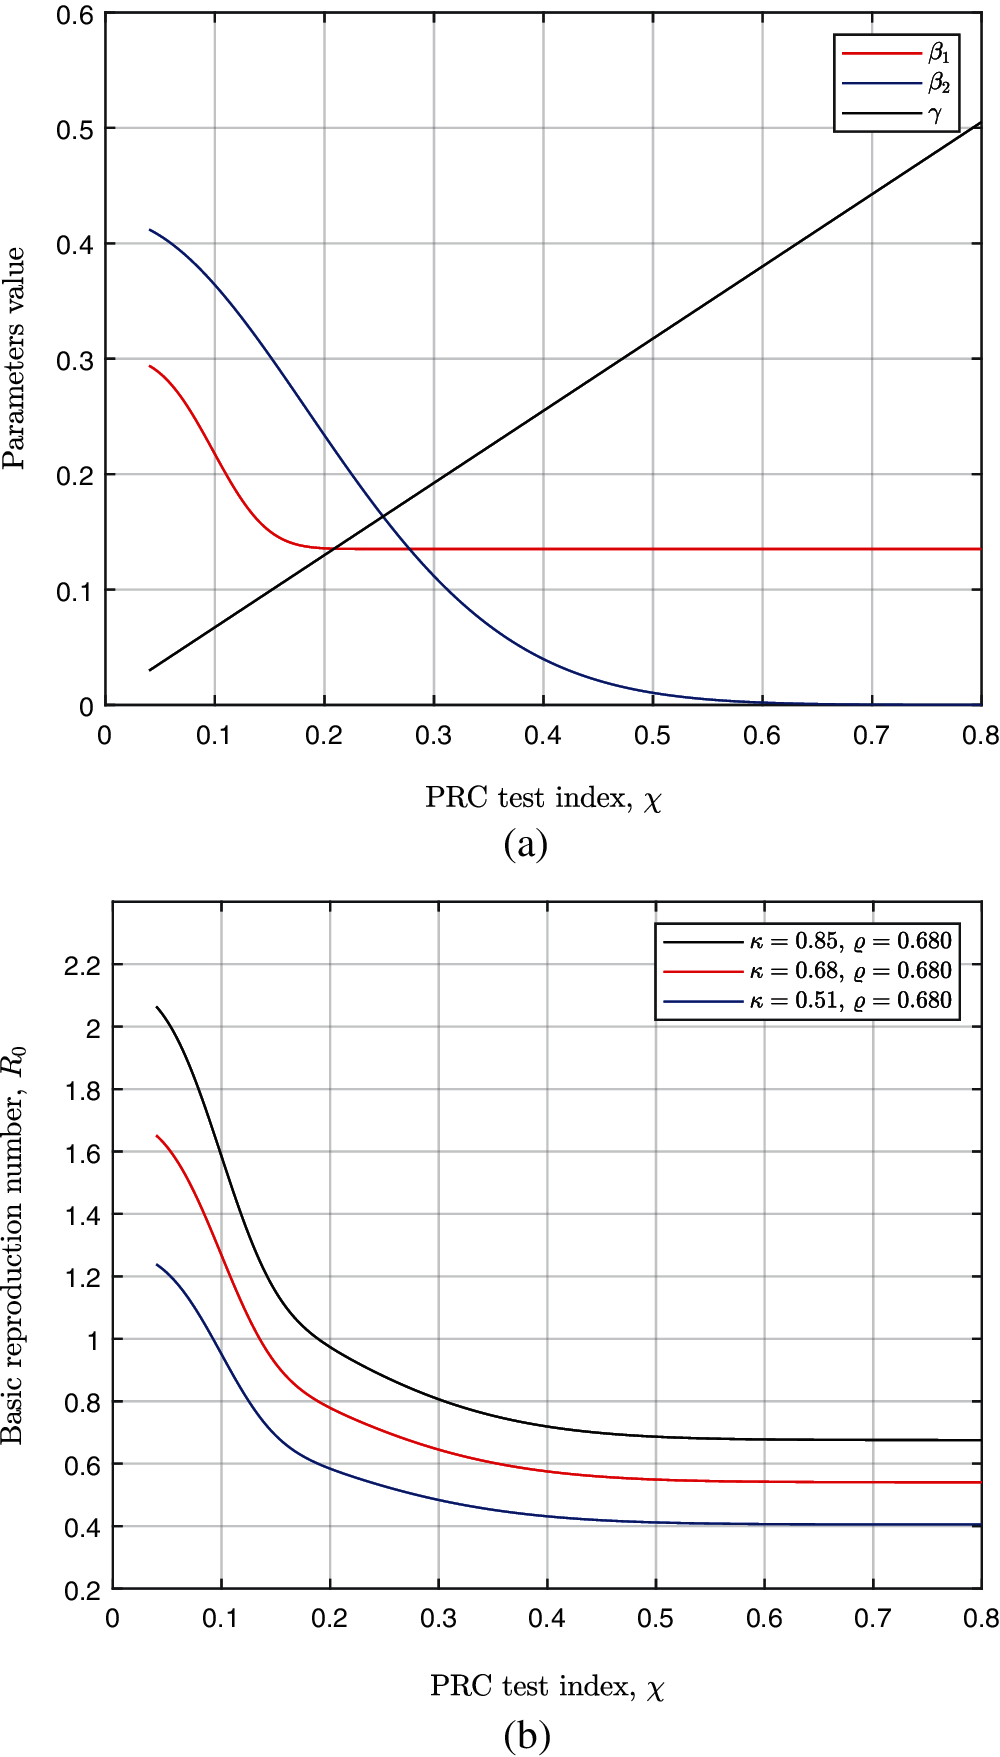
Figure 4: The trends of
3.4 Analyze Effect of PCR Test and Isolation Measures
Further, we investigated the combined effect of PCR test and isolation measures in this subsection. The strategies to increase the isolation intensity is represented by reducing κ value. The measures to conduct more PCR testing is represented by increasing the PCR test χ. As shown in Fig. 5, the trends of number of infected cases are simulated under various strategies composed of different isolation intensity κ and PCR test index χ. When maintaining the same isolation measures (κ = 0.68) and increasing the PCR test index from 0.1910 to 0.3005, the final number of cumulative reported cases decreases by 22,224. The peak time of infection will be 83 days earlier. As for increasing the PCR test index with a stricter isolation intensity (κ = 0.51), the cumulative reported cases decreases by 9,506 and the peak time will be 112 days earlier. The PCR test medical screening could inhibit the spread of COVID-19 and shorten the duration to reach the epidemic peak.
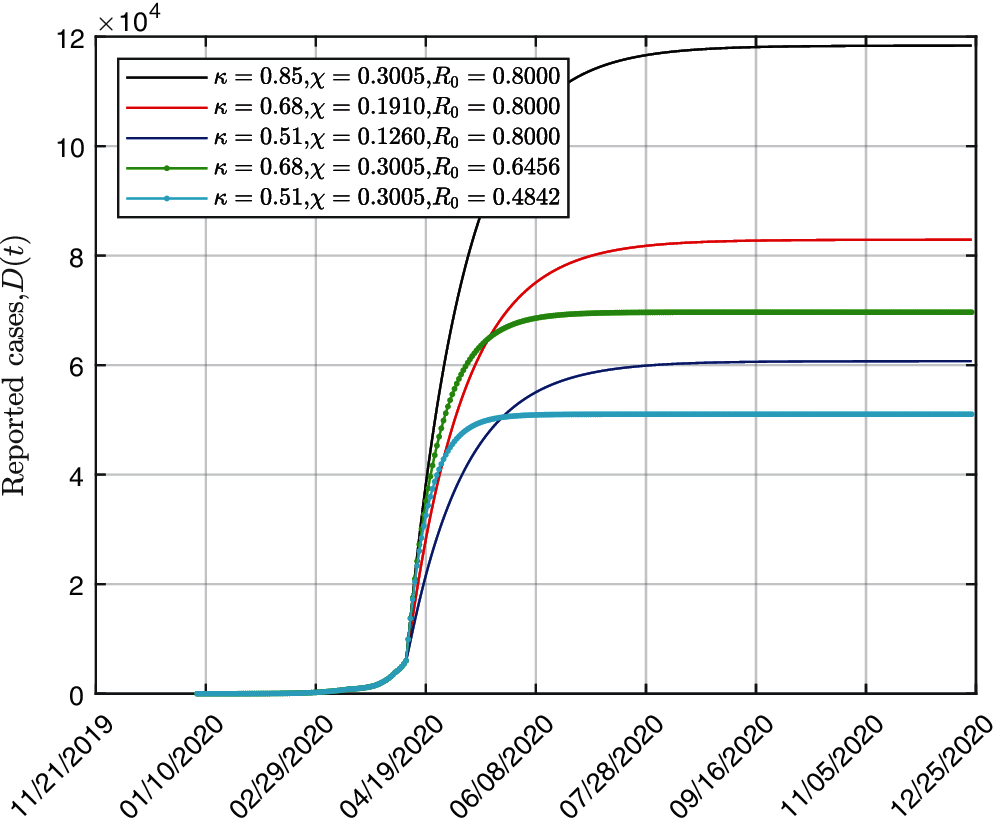
Figure 5: Simulations results of cumulative reported cases based on different PCR test and isolation measures
If keeping χ = 0.3005, setting κ to be 0.85, 0.68 and 0.51, the final numbers of cumulative reported cases are (118,157, 69,672 and 51,036), respectively. Coordinating strategies while maintaining R0 = 0.8 with different combination of χ and κ (green, red, grey lines), it takes almost the same time to reach the peak of infection. The final number of cumulative reported cases decrease sharply as strengthening the isolation measures (reducing κ). Moreover, the combined strategy χ = 0.68 and κ = 0.3005 leads to a lager final number of cumulative reported cases, compared to that with χ = 0.51 and κ = 0.126, although the basic reproduction number of the latter strategy is smaller. It is deduced that isolation measures play more significant role in controlling the disease transmission.
The final number of infected cases should demonstrate the effectiveness of the control strategies to fight against COVID-19. The contour map of log10 (D(t) + R(t)) corresponding to combined strategies is shown in Fig. 6. The horizontal axis represents the intensity of isolation. The vertical axis represents the intensity of PCR testing. The different lines represent the fixed final number of infections (in logarithm form) corresponding to the variation of isolation and PCR testing index. For instance, if the final number of infections is expected to be controlled around 107.2, the combined isolation and PCR test strategies (κ, χ) should locate on the 7.2 contour line (yellow line). If the final number of infected cases is expected to be less than 105.5, then (κ, χ) should local in the upper left area of the 5.5 contour line (violet line).
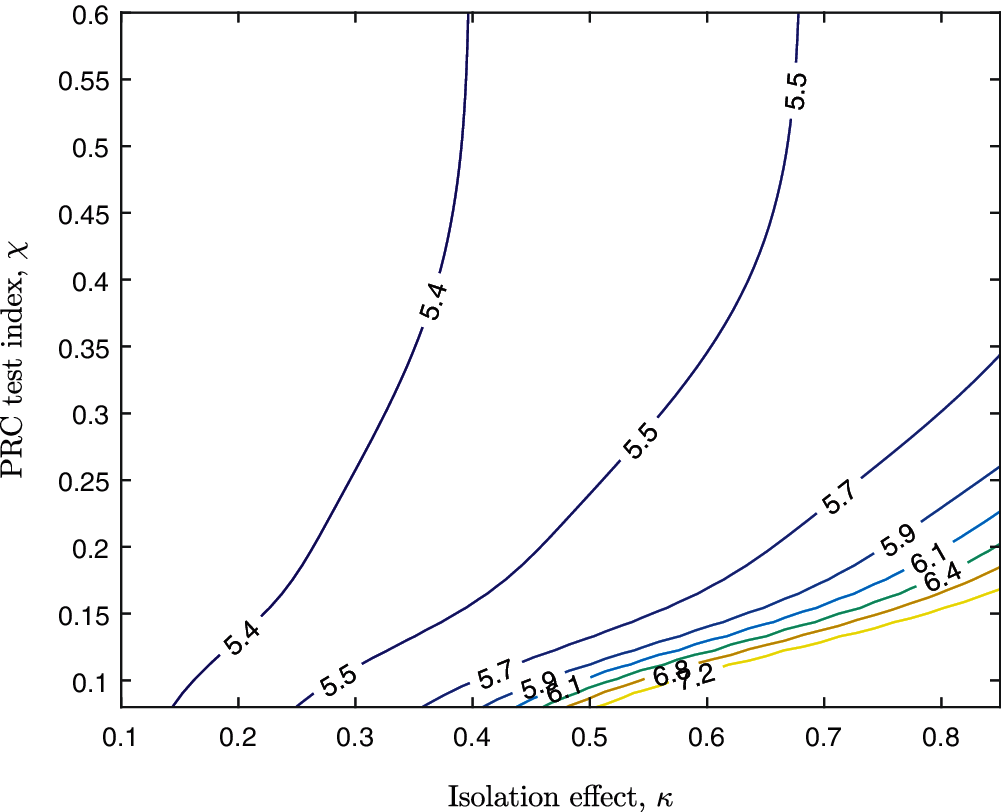
Figure 6: The contour map of the final number of cumulative infected cases
In this study, an SEIDR epidemic model is used to estimate the parameters and assess the effect of control strategies. Since the dynamic system is very sensitive to the initial values, the imported cases are considered in solving the problem. To accurately estimate the parameters, a nonlinear optimization model was established based on multi-level and multi-objective method. The first 96 days of disease transmission are divided into five stages by the proposed algorithm. The dynamic parameters are estimated in these stages. The real reported cases fits well with numerical results.
It is found that the spread of the disease is affected by the age structure of the population by the data analysis. More attention should be given for the elderly. The transmission rates β1, β2 and the self-healing rate δ vary with the change of age structure. Also, β1, β2 and the confirmation rate γ vary as the number of PCR tests changes. The self-healing rate is linearly related to the age structure ratio and the confirmation rate is linearly related to PCR test index. Moreover, β1 and β2 are binary functions of age structure ratio and PCR test index as shown in Eqs. (14) and (15).
After determining these parameters, the strategies involving the related parameters are analyzed under the current age structure ratio. The basic reproduction number R0 reaches the minimal values after the PCR test index χ larger than 0.5. Simulations illustrate that PCR test medical screening can mitigate the severity of COVID-19 transmission. But increasing the testing intensity alone should be insufficient to minimize the final number of infected cases. The bottleneck outcome in response to the PCR test could be compensated by isolation measures, which is more effective to control the epidemic. The isolation measures is also emphasized to control the COVID-19 spread in the study for a specific single strategy [27], compared to our study of mixed strategies. As concluded by other studies, the government should implement strategies to reduce contact rates between the individuals [28]. Moreover, the effectiveness of the combined strategies of isolation and PCR test medical screening are illustrated in the contour graphs, which can intuitively provide guidance on the policy adjustment.
There are some limitations in this study. Only the period of early spread in Japan is analyzed, which is relatively easy to estimate the parameters in the stages. In the future investigations, fractional systems could be adopted to analyze the COVID-19 spread [29–31] for a longer period of time. The simulation of the predicted development of COVID-19 is more precise by taking the fractional operator into account [13,32]. The non-locality of the determined parameters should be substantially improved. Hence, we will determine the enhancement of parameter accuracy with a new fractional-order system based on the current work and compare with other similar mathematical modelling studies [33,34]. Thus, the strategies could be modified to achieve a rapid control with optimal order of fractional system [35]. In addition, the impact of strategies including PCR testing and isolation can be further investigated. The control measures could be classified in detail as isolation, quarantine and hospitalization [36]. Further, stability and sensitivity analysis of the parameters [12,28,36,37] on the COVID-19 spread will be carried out in our future work.
Funding Statement: This work was supported in part by National Natural Science Foundation of China under Grant Nos. 61803152, 31920103016, and 11871475, Doctoral Start-Up Foundation of Hunan Normal University under Grant No. 0531120-3827 and Hunan Provincial Education Department under Grant No. HNKCSZ-2020-0813.
Conflicts of Interest: The authors declare that they have no conflicts of interest to report regarding the present study.
1. Coronavirus Resource Center, Johns Hopkins University (2021). Coronavirus COVID-19 Global Cases by the Center for Systems Science and Engineering (CSSE) at Johns Hopkins University (JHU). https://coronavirus.jhu.edu/map.html. [Google Scholar]
2. Li, R., Pei, S., Chen, B., Song, Y., Zhang, T. et al. (2020). Substantial undocumented infection facilitates the rapid dissemination of novel coronavirus (COVID-19). Science, 368(6490), 489–493. DOI 10.1126/science.abb3221. [Google Scholar] [CrossRef]
3. Ministry of Health, Labor and Welfare, Government of Japan (2020). Latest information on Coronavirus disease 2019 (COVID-19). https://www.mhlw.go.jp/stf/houdou/houdou_list_202001.html. [Google Scholar]
4. Kuniya, T. (2020). Prediction of the epidemic peak of Coronavirus disease in Japan. Journal of Clinical Medicine, 9(3), 789. DOI 10.3390/jcm9030789. [Google Scholar] [CrossRef]
5. Tian, H., Liu, Y., Li, Y., Wu, C. H., Chen, B. et al. (2020). An investigation of transmission control measures during the first 50 days of the COVID-19 epidemic in China. Science, 368(6491), 638–642. DOI 10.1126/science.abb6105. [Google Scholar] [CrossRef]
6. Jose, M., Carcione, J. E., Santos, C. B., Jing, B. (2020). A simulation of a COVID-19 epidemic based on a deterministic SEIR model. https://arxiv.org/abs/2004.03575. [Google Scholar]
7. Simone, P., Davide, C., Paula, V. M., Deepak, B. (2020). Modeling the COVID-19 epidemic in Okinawa. medRxiv. DOI 10.1101/2020.04.20.20071977. [Google Scholar] [CrossRef]
8. Yang, Z., Zeng, Z., Wang, K., Wong, S. S., Liang, W. et al. (2020). Modified SEIR and AI prediction of the epidemics trend of COVID-19 in China under public health interventions. Journal of Thoracic Disease, 12(3), 165–174. DOI 10.21037/jtd.2020.02.64. [Google Scholar] [CrossRef]
9. Prem, K., Liu, Y., Russell, T. W., Kucharsky, A. J., Eggo, R. M. et al. (2020). The effect of control strategies to reduce social mixing on outcomes of the COVID-19 epidemic in Wuhan, China: A modelling study. Lancet Public Health, 5(5), 261–270. DOI 10.1016/S2468-2667(20)30073-6. [Google Scholar] [CrossRef]
10. Jiao, J., Liu, Z., Cai, S. (2020). Dynamics of an SEIR model with infectivity in incubation period and homestead-isolation on the susceptible. Applied Mathematics Letters, 107, 106442. DOI 10.1016/j.aml.2020.106442. [Google Scholar] [CrossRef]
11. Peng, L., Yang, W., Zhang, D., Zhuge, C., Hong, L. (2020). Epidemic analysis of COVID-19 in China by dynamical modeling. medRxiv. DOI 10.1101/2020.02.16.20023465. [Google Scholar] [CrossRef]
12. Alshomrani, A. S., Ullah, M. Z., Baleanu, D. (2021). Caputo SIR model for COVID-19 under optimized fractional order. Advances in Difference Equations, 2021(1), 185. DOI 10.1186/s13662-021-03345-5. [Google Scholar] [CrossRef]
13. Naik, P. A., Yavuz, M., Qureshi, S., Zu, J., Townley, S. (2020). Modeling and analysis of COVID-19 epidemics with treatment in fractional derivatives using real data from Pakistan. European Physical Journal Plus, 135(10), 795. DOI 10.1140/epjp/s13360-020-00819-5. [Google Scholar] [CrossRef]
14. Baleanu, D., Sajjadi, S. S., Jajarmi, A., Defterli, O., Asad, J. H. (2021). The fractional dynamics of a linear triatomic molecule. Romanian Reports in Physics, 73(1), 1–13. [Google Scholar]
15. Baleanu, D., Ghanbari, B., Asad, J. H., Jajarmi, A., Pirouz, H. M. (2020). Planar system-masses in an equilateral triangle: Numerical study within fractional calculus. Computer Modeling in Engineering & Sciences, 124(3), 953–968. DOI 10.32604/cmes.2020.010236. [Google Scholar] [CrossRef]
16. Baleanu, D., Jajarmi, A., Asad, J. H., Blaszczyk, T. (2017). The motion of a bead sliding on a wire in fractional sense. Acta Physica Polonica A, 131(6), 1561–1564. DOI 10.12693/APhysPolA.131.1561. [Google Scholar] [CrossRef]
17. Baleanu, D., Jajarmi, A., Mohammadi, H., Rezapour, S. (2020). A new study on the mathematical modelling of human liver with Caputo-Fabrizio fractional derivative. Chaos, Solitons and Fractals, 134(4), 109705. DOI 10.1016/j.chaos.2020.109705. [Google Scholar] [CrossRef]
18. Kenji, M., Katsushi, K., Alexander, Z., Gerardo, C. (2020). Estimating the asymptomatic proportion of Coronavirus disease 2019 (COVID-19) cases on board the Diamond Princess cruise ship, Yokohama. Japan Euro Surveill, 25(10), 2000180. DOI 10.2807/1560-7917. [Google Scholar] [CrossRef]
19. Yang, C., Wang, J. (2020). A mathematical model for the novel Coronavirus epidemic in Wuhan. China Mathematical Biosciences and Engineering, 17(3), 2708–2724. DOI 10.3934/mbe.2020148. [Google Scholar] [CrossRef]
20. Peto, J. (2020). COVID-19 mass testing facilities could end the epidemic rapidly. BMJ, 368, m1163. DOI 10.1136/bmj.m1163. [Google Scholar] [CrossRef]
21. Linton, N. M., Kobayashi, T., Yang, Y., Hayashi, K., Akhmetzhanov, A. R. et al. (2020). Incubation period and other epidemiological characteristics of 2019 novel Coronavirus infections with right truncation: A statistical analysis of publicly available case data. Journal of Clinical Medicine, 9(3), 538. DOI 10.3390/jcm9020538. [Google Scholar] [CrossRef]
22. Sun, H., Qiu, Y., Yan, H., Huang, Y., Zhu, Y. et al. (2020). Tracking and predicting COVID-19 epidemic in China mainland. Journal of Data Science, 18(3), 455–472. DOI 10.6339/JDS.202007 18(3). 0010. [Google Scholar]
23. Dreessche, P., Watmough, J. (2002). Reproduction numbers and sub-threshold endemic equilibria for compartmental models of disease transmission. Mathematical Bioences, 180(1–2), 29–48. DOI 10.1016/S0025-5564(02)00108-6. [Google Scholar] [CrossRef]
24. Messaoud, R. B., Hajji, S. (2018). Nonlinear observer using mean value theorem and lsqnonlin matlab algorithm. WSEAS Transactions on Systems, 17, 191–196. [Google Scholar]
25. Ministry of Health, Labor and Welfare, Government of Japan (2020). Parental leave acquisition support (new subsidy system) accompanying temporary closures of elementary schools, etc., related to new-type Coronavirus infectious diseases. https://www.mhlw.go.jp/stf/newpage_09869.html. [Google Scholar]
26. Ministry of Health, Labor and Welfare, Government of Japan (2020). About the present situation of new Coronavirus infectious disease and correspondence of Ministry of Health, Labor and Welfare (February 13, 2020 Version). https://www.mhlw.go.jp/stf/newpage_09490.html. [Google Scholar]
27. Din, A., Khan, A., Baleanu, D. (2020). Stationary distribution and extinction of stochastic Coronavirus (COVID-19) epidemic model. Chaos, Solitons, and Fractals, 139(14), 110036. DOI 10.1016/j.chaos.2020.110036. [Google Scholar] [CrossRef]
28. Ahmed, I., Modu, G. U., Yusuf, A., Kumam, P., Yusuf, I. (2021). A mathematical model of Coronavirus disease (COVID-19) containing asymptomatic and symptomatic classes. Results in Physics, 21(9), 103776. DOI 10.1016/j.rinp.2020.103776. [Google Scholar] [CrossRef]
29. Odibat, Z., Baleanu, D. (2020). Numerical simulation of initial value problems with generalized caputo-type fractional derivatives. Applied Numerical Mathematics, 156(6), 94–105. DOI 10.1016/j.apnum.2020.04.015. [Google Scholar] [CrossRef]
30. Sweilam, N. H., Al-Mekhlafi, S. M., Albalawi, A. O., Baleanu, D. (2020). On the optimal control of Coronavirus (2019-nCov) mathematical model; A numerical approach. Advances in Difference Equations, 2020(1), 528. DOI 10.1186/s13662-020-02982-6. [Google Scholar] [CrossRef]
31. Zha, T. H., Castillo, O., Jahanshahi, H., Yusuf, A., Alassafi, M. O. et al. (2021). A fuzzy-based strategy to suppress the novel Coronavirus (2019-nCov) massive outbreak. Applied and Computational Mathematics, 20(1), 160–176. [Google Scholar]
32. Omay, T., Baleanu, D. (2021). Fractional unit-root tests allowing for a fractional frequency flexible fourier form trend: Predictability of COVID-19. Advances in Difference Equations, 2021(1167, 1–33. DOI 10.1186/s13662-021-03317-9. [Google Scholar] [CrossRef]
33. Baleanu, D., Sajjadi, S. S., Jajarmi, A., Defterli, O. (2021). On a nonlinear dynamical system with both chaotic and nonchaotic behaviors: A new fractional analysis and control. Advances in Difference Equations, 234, 1–17. DOI 10.1186/s13662-021-03393-x. [Google Scholar] [CrossRef]
34. Baleanu, D., Sajjadi, S. S., Asad, J. H., Amin, J., Estiri, E. (2021). Hyperchaotic behaviors, optimal control, and synchronization of a nonautonomous cardiac conduction system. Advances in Difference Equations, 157, 1–24. DOI 10.1186/s13662-021-03393-x. [Google Scholar] [CrossRef]
35. Akgül, A., Ahmed, N., Raza, A., Iqbal, Z., Rafiq, M. et al. (2021). New applications related to COVID-19. Results in Physics, 20(3), 103663. DOI 10.1016/j.rinp.2020.103663. [Google Scholar] [CrossRef]
36. Baba, I. A., Nasidi, B. A., Baleanu, D. (2021). Optimal control model for the transmission of novel COVID-19. Computers, Materials & Continua, 66(3), 3089–3106. DOI 10.32604/cmc.2021.012301. [Google Scholar] [CrossRef]
37. Khan, A., Zarin, R., Hussain, G., Ahmad, N. A., Mohd, M. H. et al. (2021). Stability analysis and optimal control of covid-19 with convex incidence rate in Khyber Pakhtunkhawa (Pakistan). Results in Physics, 20(4), 103703. DOI 10.1016/j.rinp.2020.103703. [Google Scholar] [CrossRef]
 | This work is licensed under a Creative Commons Attribution 4.0 International License, which permits unrestricted use, distribution, and reproduction in any medium, provided the original work is properly cited. |