| Computer Modeling in Engineering & Sciences |
DOI: 10.32604/cmes.2022.016065
ARTICLE
Thermogram Adaptive Efficient Model for Breast Cancer Detection Using Fractional Derivative Mask and Hybrid Feature Set in the IoT Environment
1Rajasthan Technical University, Kota, Rajasthan, 324010, India
2Anand International College of Engineering, Jaipur, 303012, India
3Nonlinear Dynamics Research Center (NDRC), Ajman University, Ajman, 20550, United Arab Emirates
4International Center for Basic and Applied Sciences, Jaipur, 302029, India
5Institute of Mathematical Modeling, Almaty, 050000, Kazakhstan
*Corresponding Author: Praveen Agarwal. Email: goyal.praveen2011@gmail.com
Received: 03 February 2021; Accepted: 23 August 2021
Abstract: In this paper, a novel hybrid texture feature set and fractional derivative filter-based breast cancer detection model is introduced. This paper also introduces the application of a histogram of linear bipolar pattern features (HLBP) for breast thermogram classification. Initially, breast tissues are separated by masking operation and filtered by Gr
Keywords: Thermal image; breast cancer; fractional derivative mask; image texture analysis; feature extraction; radial basis function; machine learning
Breast cancer has become a widely occuring disease among women and the reason of rapidly increasing death rate due to its late diagnosis [1]. Breast cancer is caused by a genetic mutation of Deoxyribonucleic acid (DNA) in the cells of breast tissues and these cells keep reproducing the same muted cells. These abnormal cells cluster together to form a tumor which becomes cancerous when these abnormal cells metastasize to rest of the body parts through the bloodstream or lymphatic system [2]. The most significant factors of developing breast cancer are advancing age and inheritance [3]. Therefore, early and accurate screening of breast cancer offers a major role in treating breast malignancy and reducing the mortality rate.
There are various screening techniques which aim at an early revelation of breast disease. These techniques depend on light, sound, heat, X-ray, nuclear, magnetism, microwave, and fusion of different methods. Among these techniques, digital mammography is believed to be the gold standard and widely used technique for tumor detection and classification [4]. But mammography shows low sensitivity (true positive) with high specificity (true negative) whereas Magnetic Resonance Imaging (MRI) reveals high sensitivity with reduced specificity for premature detection of breast cancers [5]. Also, the patients must bear intense pain during the process of mammography. Thus, the limitations of present screening and diagnostic modalities necessitate the development of an advance and more effective technique with higher sensitivity and specificity for premature stage breast cancer detection [6].
Thermography has immense potential for screening breast diseases as it has already been reported that breast disease can be detected decay prior to the conventional technique like mammography [2]. Thermography is an unobtrusive, contactless, painless, radiation-free, temperature screening imaging technique. It is being regarded as a consistent add-on tool nowadays with high sensitivity and specificity [5]. Most of the breast cancer screening techniques focus on finding the tumor or cancerous regions by detecting physical changes in cell structures, but, thermal imaging has the potential in finding the thermal disruption due to functional changes in the cells which helps in investigating the presence of pre-stage of early cancer [6,7]. It has already been reported that clinically healthy breast tissues have predictable and regular heat patterns on the skin surface while unhealthy breast tissues have irregular heat patterns due to physiological processes such as vascular disturbances and inflammation [1–3].
Thermal patterns emitted by human skin are recorded by a thermal camera and a heat signature is generated called the thermogram [5]. But the thermograms alone are not adequate for clinical experts to make an exact diagnosis, so some expository tools, for example, bio-measurable strategies, automation of the different steps involved in the procedure, artificial intelligence, or computer vision techniques are required to assist and analyze the thermograms objectively. In this regard, several computer-aided diagnosis schemes have been developed to detect the disease accurately [6].
Most of the computer-aided schemes reported in the literature have performed bilateral asymmetry analysis which limits the performance for the cases where malignancies closely resemble in both breasts [7]. The detection accuracy of such schemes is reliant on the difference between features of left and right breast tissues. Since thermograms are low-intensity images with small signal-to-noise ratio therefore the detection accuracy may be limited and the false negative detection rate may be higher [8,9]. However, many schemes reported in literature have also analyzed each breast separately to overcome the above limitation [10,11]. Such schemes may suffer from the problem of false positive error if the selection of feature and feature quality is not proper. Therefore, selection of features and feature quality play a vital role as one kind of feature may not suit other imaging modalities.
In thermogram-based breast cancer detection schemes reported in the literature, statistical, Gabor, HOG, etc., texture features have been exploited to improve the detection accuracy [9–15]. But, the comparative performance evaluation of popular texture feature sets is missing in the literature. Secondly, bias correction and image registration are required in thermograms due to misalignment and inconsistency in the acquisition process. Any inaccuracy in these operations directly affects the performance of cancer detection. Recently, a number of fractional-order mathematical models have been developed for analyzing and treating various diseases [16–18]. Fractional derivative-based filtering has shown its suitability in overcoming the above problems due to its tuning parameter (fractional order parameter) and also enhancing the low-intensity texture [19]. Also, the effect of fractional derivative filters on computer-aided breast cancer detection schemes using thermogram has not been reported yet.
Therefore, within this paper, a computer-aided breast cancer or malignancy detection model using thermograms is presented which processes breast tissues (non-asymmetry based) using fractional derivative-based Sobel filter. The comparative performance of different popular texture feature sets is also performed with respect to fractional derivative order parameter alfa (
• A new hybrid feature set is derived by combining different feature sets and analyzed for breast cancer detection.
• This paper introduces a histogram of linear bipolar pattern features (HLBP) for breast thermogram classification.
• Comparative analysis of thermogram texture features used for breast cancer classification is also presented, which aids the literature.
• A fractional derivative-based Sobel filter is applied for texture enhancement, noise reduction, and providing robustness against variations and degradations in thermograms. It also offers the vitality of optimizing the classification results.
• The proposed model is more generalized and hence it can be applied to analyze thermal images acquired by different protocols/cameras used in different applications also such as skin cancer detection, peripheral vascular disease identification, night vision, surveillance, disease and pathogen detection in plants, etc.
The rest of the article is arranged in the following manner as: Section 2 describes the background theory of materials and methods. The proposed methodology including data-set and data pre-processing is provided in Section 3. Results and discussions are presented in Section 4. Section 5 and Section 6 give a brief discussion and conclude the findings, respectively.
Owing to the limitations of currently used imaging modalities, thermal imaging is continuously being evaluated for breast cancer screening and detection. A brief literature review based on the wide range of research publications related to breast cancer detection and classification is being presented in this section.
The medical thermogram analysis is directly dependent on the quality of the thermogram which mainly depends on acquisition protocol, used thermal camera, and signal to noise ratio of thermogram [1]. The current status of infrared thermal imaging techniques in breast cancer detection, classification, and a few protocols to acquire thermograms have been studied by [3,6]. In general, all computer-aided automated and semi-automated thermogram-based cancer detection systems involve three basic steps, i. Pre-processing and segmentation of the region of interest (ROI): it normally includes background removal and ROI separation for further processing, ii. Texture enhancement and noise reduction in thermogram, iii. Appropriate feature extraction and classification [9–13,20–26].
Thermal images have a low-intensity gradient, absence of clear edges, and high noise to signal ratio [27]. Therefore, the precise segmentation of ROI and analysis of breast cancer become inaccurate and difficult. Thus, many researchers have also reported manual segmentation of ROI and Left/Right regions for symmetrical analysis [10–15,20,21]. In the case of breast cancer detection, the segmentation of ROI indicates the separation of breast tissues from the rest of the body and the background. Various semi-automatic and fully automatic ROI segmentation methods based on image processing techniques such as edge detection [15,20], region growing [21], thresholding [25,26], and morphological approaches have been delineated in literature [14,26]. Since the proposed work focuses only on breast cancer detection and classification, the ground truth masks of respective ROIs of the breast thermal images which are available in the user database have been utilized to achieve the maximum analysis accuracy [28].
In order to improve detection accuracy, researchers have applied several image enhancement and de-noising techniques in spatial and transform domains. The spatial filters such as gaussian, wiener filter and median filter, etc., blur the edges. While the transform-domain techniques like contourlet, wavelet, and curvelet with diffusion and adaptive anisotropic diffusion filtering have been widely employed to enhance and de-noise the thermal images. As thermal images have smooth transitions in intensity values, the wavelet-based de-noising also does not assist well the thermal images [27]. Some other techniques such as the BM3D technique based on enhanced sparse representation have been reported which are capable of sharpening and de-noising low contrast thermograms [7]. Recently, fractional derivative-based techniques have been applied to enhance the texture of various images as it preserves the weak textures while suppressing the noise in the images [29]. This approach has also been explored to enhance and segment medical images [19]. The tissue malignancy or tumors have abrupt textures in comparison to the normal tissues due to the process of angiogenesis. Therefore, the features having texture discrimination properties have been employed on thermal images for the segmentation of suspected regions, detection, and classification in many medical applications [30].
Consecutively, to automate the process of abnormality detection and classification in breast thermograms, different asymmetry-based analyses using machine learning techniques have been applied. A brief summary of the state-of-the-art schemes reported in the literature with user database, types of features, classifier, and the values of performance parameters accounted in the scheme are summarized in Table 1.

In this section, the back ground theory of material and methods, required for implementation of the proposed model are presented.
2.1 Fractional Differential Filter
The Gr
where
If I(x, y) be the image of size MXN, fractionalize image
where
and W
In this section, various textures-based features are discussed briefly.
2.2.1 First Order Statistical Features (FOS)
The first-order statistic features report gray intensity dispersion in an image. The commonly used features are mean, variance, kurtosis, skewness, energy, and entropy [8]. The details of FOS features are given in Appendix A.
2.2.2 Second Order Statistical Features (SOS)
The features calculated from second-order statistics provide the relative information or position of different gray levels within the image. SOS features measure the regularity, coarseness, and smoothness of the image pixels. The widely used methods for texture discriminations are mentioned below:
(a)Gray level co-occurrence matrix features (GLCM)
GLCM describes the textural details of an image and it is useful for classifications of images. These features are found using a co-occurrence matrix where pixels are considered in pairs and the gray level co-occurrence matrix reflects the relationship amongst all pixels or groups of pixels [35]. The GLCM represents a two-dimensional histogram which itself is a component of two parameters, the relative detachment between two pairs of pixels estimated in pixel numbers
where; P is a primary condition which satisfies the values: {
(b) Grey level run length matrix features (GLRLM)
GLRLM is a method towards extracting second-order statistical features. The study shows that GLRLM can discriminate textures which can not be discriminated by GLCM based features extraction. This method computes the figure of gray level runs of different lengths. Where a gray level run is a set of linearly adjoining pixels of alike gray level values and the number of pixels within the run is gray level run length [36]. The GLRL matrix is represented by
(c) Linear binary pattern features (LBP)
Discriminative power, computational simplicity, and rotation invariant linear binary pattern operator is a very popular approach in various applications of classification. This texture operator tags the image pixel by thresholding its neighborhood and specifies binary numbers to their neighbors as a result. It generates a P-dimensional histogram which is used as a texture descriptor [37]. The LBPP, R number that characterizes the image texture around the center pixel (xc, yc) with gray level value
where, P denotes the number of equally spaced pixels (with value vp) on a circle of radius R(R > 0) symmetrical about centre pixel.
(d) Histogram of oriented gradient features (HOG)
HOG feature descriptor outperforms significantly the other feature sets including wavelets for some applications. HOG is determined on an intense grid of equally gapped cells and also applies overlapping local contrast normalizations for better accomplishments. This is achieved by acquiring the local histogram over larger spatial regions labeled as blocks and using the outcome to normalize all of the cells in the block. The length LHOG of the HOG feature is based on the image size and some function parameter values as in Eq. (9) [38]:
Gabor features are particularly suitable for texture representation and discrimination. This feature fundamentally examines if there are any explicit frequency contents in particular orientations in a local area about a point or a region. A 2D Gabor function is achieved by modulating a 2D Gaussian kernel function by a complex sinusoidal plane wave with angular frequency
Thus, Gabor features are constructed by using multiple filters on several frequencies (scale) and orientations
The proposed automated breast cancer detection and classification model using fractional Sobel filter and support vector machine (SVM) with distinct texture features are described in this section. However, many schemes for breast cancer detection using thermogram with SVM reported in the literature have used either integer order filters or power-law transformation to get better signal-to-noise ratio and textural quality of thermal images [25]. Moreover, comparative analysis of different texture features of thermogram commonly used with SVM or any other classifier is also missing in the literature. A new thermogram-based model for breast cancer detection using fractional derivative-based fractional Sobel filter and SVM is presented in this manuscript. Also, a comparative analysis of different texture features with fractional derivative filter is presented [39–43].
RGB color mapped thermograms obtained from the camera are first converted to gray images. This gray image conversion is essential because radiologists favor grayscale images as they comprise a greater resemblance to the mammographic images [1]. These gray scale thermograms are further processed for 1: Segmentation of breast tissues from the background (pre-processing and ROI segmentation), 2: Fractional Sobel filtering, 3: Extraction of different features and feature reduction employing Principal component analysis (PCA), 4: Training the RBF-kernel based SVM classifier using the reduced set of features and 5: Classification of breast tissues as normal or abnormal one. Steps involved in the proposed model are also depicted in Fig. 1. The evaluation of the efficacy of various feature sets with the RBF-SVM classifier is also performed by calculating performance parameters. The detail of the different steps of the proposed model is described below.
3.1 Pre-Processing and Region of Interest (ROI) Segmentation
The performance of the algorithm can greatly be enhanced by accurate segmentation of ROI. In this step, the breast tissues are separated from the background region. Following are the steps used:
(1) All the input thermograms I(i, j) are converted to grayscale images.
(2) The background subtraction is done by masking the thermal images with respective ground truth images [28]. The regions other than breast tissues such as shoulders, neck, armpits, and the region below the infra-mammary are cropped out manually.
(3) The uniformity in the size of images is maintained while achieving the ROIs, i.e., IROI(i, j). Two groups of normal and abnormal ROIs are prepared.

Figure 1: Schematic-diagram of the proposed thermogram adaptive breast cancer detection
3.2 Fractional Derivative Based Sobel Filtering
Fractional derivative-based Sobel filter termed as fractional Sobel filter in this paper is employed to enhance the ROI segmented thermograms IROI(i, j). The fractional derivative based filter improves the thermal image texture quality and intensity gradient while restraining the noise enhancement [26]. Thegradient components of Sobel operator can be formed to get fractional order differential forms as shown in Eqs. (11), (12) using Eqs. (5), (6):
Thus, a fractional-order Sobel convolution operator for x and y directions are found by approximating Eqs. (11) and (12) and are shown in Fig. 2. Where,
Further, this fractional Sobel filter is applied on all thermograms. Eq. (13) depicts the masking operation on image IROI with fractional mask

Figure 2: 3
Also, Fig. 3 shows the fractional derivative based Sobel masks (

Figure 3: Fractional derivative-based Sobel mask
The Sobel fractional derivative filter masks of size
3.3 Feature Extraction and Dimensionality Reduction
In the proposed model, two well-founded and proficient texture feature sets are extracted from enhanced ROIs such as first-order statistical features (FOS), higher-order statistical features (HOS). Higher-order statistical features include gray level co-occurrence matrix (GLCM), gray level run length matrix (GLRLM), histogram of oriented gradient (HOG), and Histogram of a linear binary pattern (HLBP). These features imitate the association among the intensities of two image pixels or pixel sets and determine the image properties related to FOS and HOS. Gabor wavelet features capture the locality, frequency, orientation, and generate multi-resolution texture information concerning both spatial and frequency domains is also calculated. A hybrid set of statistical features is also formed by combining first and second-order statistical features, HOG, and HLBP features. The principal component analysis is done for reducing the dimensionality of the feature sets.
With the purpose to characterize breast thermogram and to generate a dataset for classification total of six feature extraction methods, based on effective texture are employed. First-order statistical features, second-order statistical features (GLCM, GLRLM), HOG, HLBP, Gabor wavelet, and a hybrid set of statistical features as described in Section 2 are extracted and quantified as explained below:
(1) First-order statistical features Mean, standard deviation, variance, kurtosis, skewness, entropy, and energy are extracted.
(2) Twenty-one GLCM features are extracted at distance
(3) Seven GLRLM features such as SRE, LRE, GLN, RLN, RP, LGLRE, and HGLRE are also extracted in four orientations
(4) HOG features are based on horizontal and vertical gradients. The image is divided into cells having several evenly spaced orientation bins. An unsigned gradient of
(5) HLBP features are extracted by generating a p-dimensional histogram of the image. The values of P = 8 and R = 1 are taken for the purpose of this study.
(6) Gabor wavelet features are computed by convolving Gabor-wavelet filters with the image. Gabor wavelet filters are generated for five distinct scales in eight orientations respectively with a window of size of
(7) Hybrid feature set is formed by combining first and second-order statistical features, HOG features as well as HLBP features. The experimentations are performed by taking different combinations of feature sets. However, the Gabor feature captures the local texture in the frequency domain but the detection accuracy is low and dimensionality is very high, hence not included in the hybrid feature set.
Fig. 4 depicts the total sets of features extracted from thermograms. Total 7 FOS features, 168 GLCM features, 28 GLRLM features, 1764 HOG features, and 256 HLBP features make a 1967-dimensional statistical feature vector and Gabor feature vectors with the dimension of 40960 are extracted.

Figure 4: Extracted and reduced feature sets
3.3.2 Dimensionality Reduction of Features
The feature vectors attained from the previous step are of very high dimensions and it becomes computationally intensive to process such big data. Therefore, a linear dimension reduction technique principal component analysis is employed to slash down the dimensions of feature vector sets. Dimensionality reduction also makes the algorithms more efficient to generate more accurate predictions using machine learning algorithms. As described in [8], “PCA orthogonally transforms a set of (possibly) correlated variables in a minor set of uncorrelated variables called principal components and the number of principal components is same or less than the original variables present in dataset”. The first principal component locates the maximum variability (eigenvalue) in data and each of the succeeding components has variability in decreasing order. If PCA has Vn non-zero eigenvectors, the optimal number of eigenvectors Vp must be picked according to the Eq. (14) to keep the average projection error to be less than 0.01.
where, Si represents the ith eigen value. The dataset must be normalized to zero mean and unit variance before applying PCA on it and 99% of the variance is kept by the feature vectors used for the next step of training and testing the classifier. Reduced sets of feature vectors for all types of texture features are also depicted in Fig. 4.
3.4 Classification and Performance Evaluation
The reduced sets of feature vectors extracted from thermal images are presented as a binary classification problem and the dataset consists of feature vectors of normal and malignant classes. These vectors are further employed to train a supervised learning technique, support vector machine (SVM) with RBF kernel for classification. An SVM makes a hyper plane or a group of hyper planes in a large or infinite-dimensional space. These hyper-plane are used to distinguish the two classes as the transformed dataset develops into more distinguishable in comparison to the original input dataset [10]. hyper-planes are decision boundaries that facilitate to classify the data points and the dimension of these hyperplanes is decided by the number of features. Support vectors are data points that are closer to the hyperplane and affect the orientation of the hyperplane. The data points residing on either side of the hyperplane can be characterized to different classes.
In the present work, SVM-RBF is trained with the training set of feature vectors and predictions are made for the unseen testing set. A five-fold cross-validation technique is owned to validate the model. The performance of trained classifier to identify the breast malignancy is evaluated in provisions of parameters; Specificity, Sensitivity, Accuracy and Area under the curve [15–17]:
It is the percentage of actual positives rightly identified as positives by the classifier and is computed as:
It is also known as true negative rate and is the capacity to spot the negative samples. It is computed as:
Accuracy defines the measure of the correctness of the classifier. It can be calculated as:
3.4.4 Area under the Curve (AUC)
AUC measures the quality of the classifier. AUC is the amount of area under the receiver operating characteristics (ROC) curve which is obtained by plotting sensitivity vs. (1-specificity). Its value is between 0 and 1. The quality of diagnostic test is better if it has AUC value approaching to 1, where, TN: True negative, TP: True positive, FP: False positive and FN: False negative.
4.1 Experimental Set-Up and Dataset
Computer simulation outcomes of the anticipated model using MATLAB are presented in this section. Breast thermograms for this research work are taken from the database readily available under the project PROENG, captured by FLIR Thermal Cam S45. The acquisition method, protocol, and other details of the thermograms are given by [28] for further study. Sample breast thermograms taken from the selected database are depicted in Fig. 5 [28], which shows the normal and abnormal thermal patterns indicating the presence or absence of suspicious regions in the breast tissues. Total of randomly selected 130 (83 normal and 47 abnormal) IR images of size 320

Figure 5: Sample breast thermogram images (a) Both normal (b)–(d) [28]
The pre-processing, ROI segmentation, and fractional Sobel filtering with order
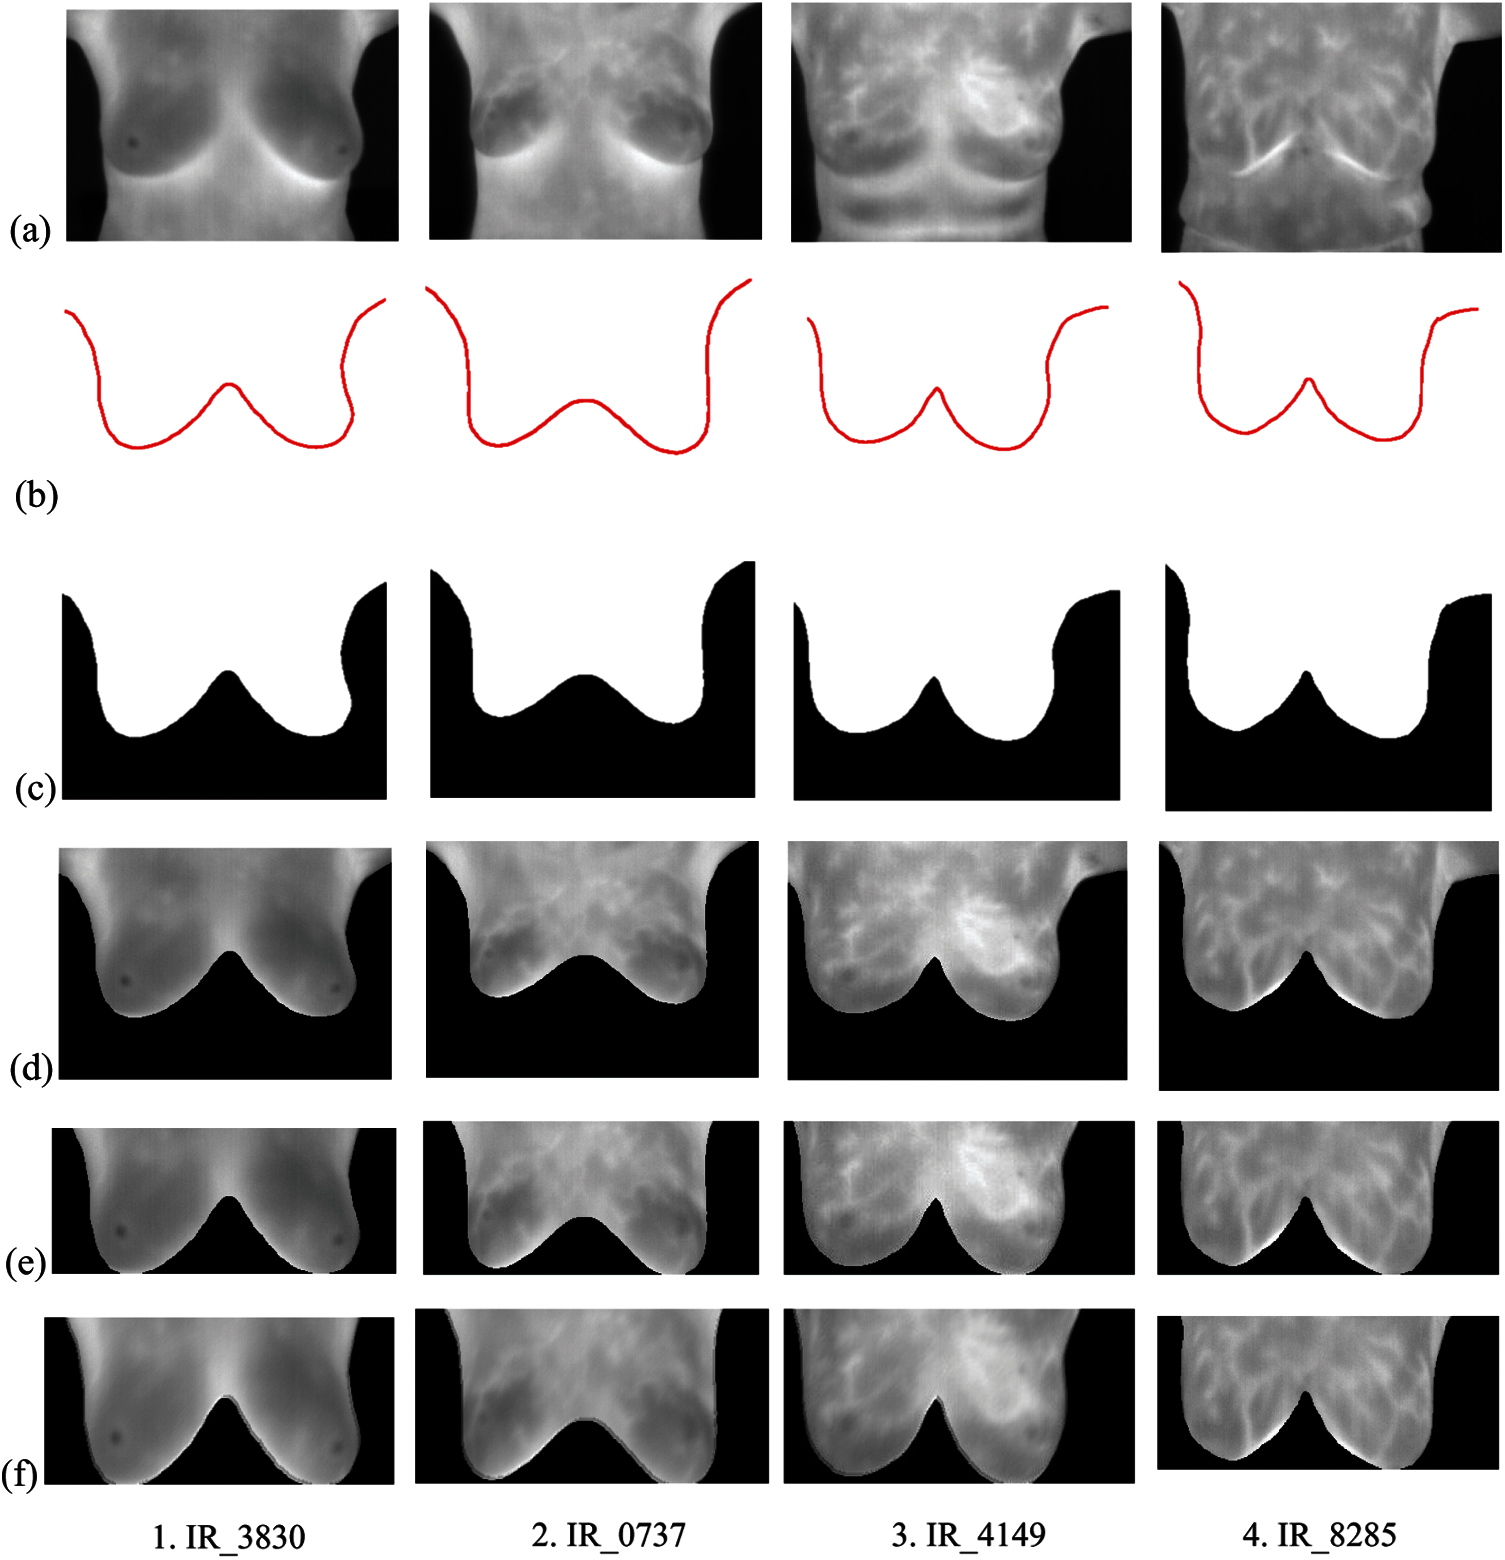
Figure 6: Pre-processing, ROI segmentation and fractional derivative filtering using fractional Sobel filter of order
A fractional-order Sobel mask with k = 4 is used and
To study the effect of fractional derivative Sobel filter on thermal images; the quantitative analysis of gray level co-occurrence matrix (derived from the database of normal and abnormal images) which describes the comprehensive information of texture is done. A set of GLCM features (described in Section 2) is extracted in four directions

Further, the five sets of features (as mentioned in Section 3) including, first and second-order statistical, HOG, HLBP, Gabor, and a hybrid set of statistical features are extracted from every segmented thermal image, respectively. As the dimensions of feature sets are very high, PCA is applied for dimensionality reduction. Now, these feature sets are fed to SVM-RBF for the classification of breast thermograms. It is also mentioned here that, experimentations are performed to investigate the performance of SVM with different kernel functions such as linear, RBF, etc. but the results of the RBF kernel are more improved, so the RBF kernel is used in the proposed model.

For evaluating the performance of distinct feature sets, significant classification parameters such as accuracy, specificity, and sensitivity to evaluate the trained classifier are calculated. The variation of these performance constraints for each feature set with fractional derivative parameter alfa (
It can clearly be observed from Figs. 7–9 that the performance parameters have the most suitable values for the fraction order of
It is also observed from Table 4 that the results of the proposed model with hybrid features at fraction

Figure 7: Variation of performance parameter (Accuracy) with alfa
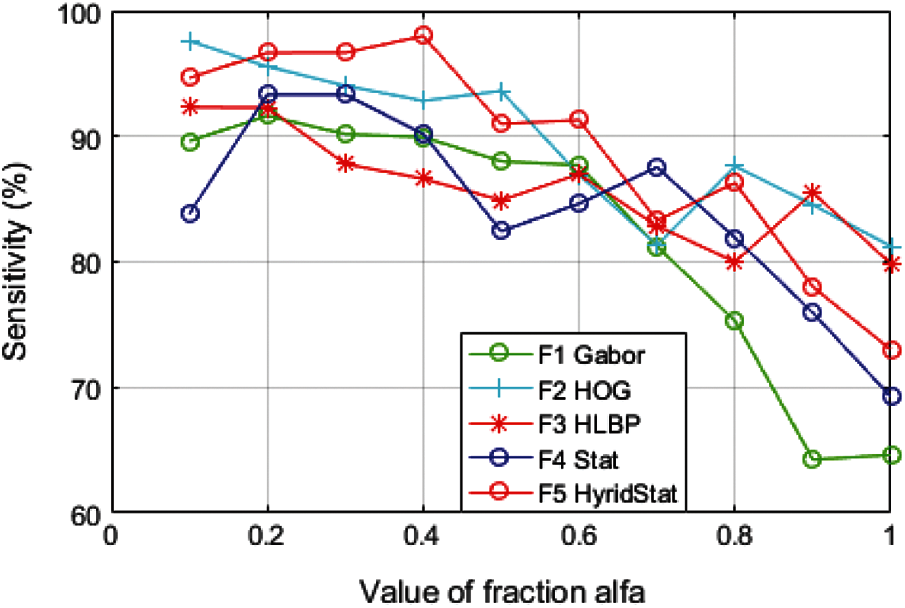
Figure 8: Variation of performance parameter (Sensitivity) with alfa
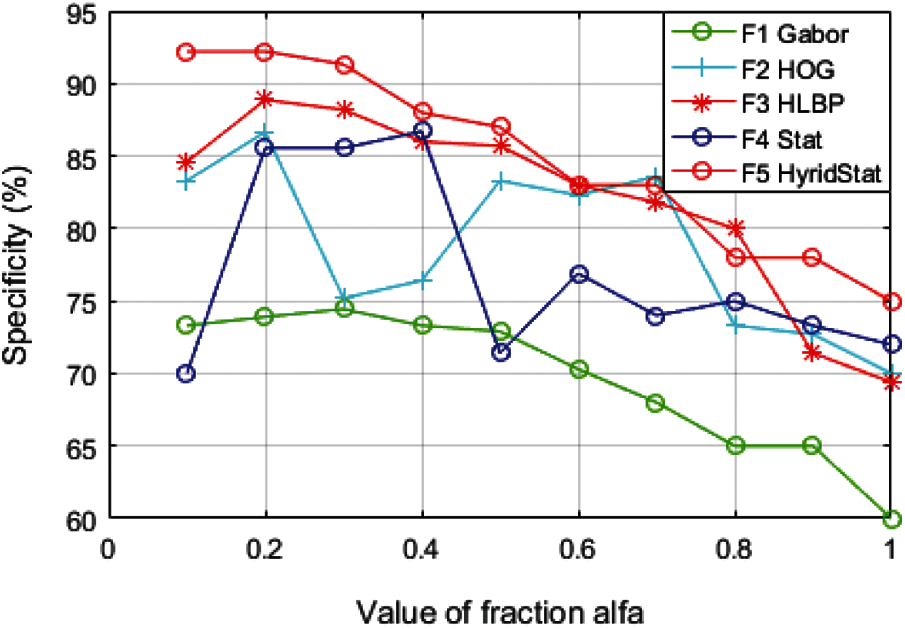
Figure 9: Variation of performance parameter (Specificity) with alfa


Figure 10: Performance parameters of proposed hybrid feature set along with other feature sets

Asymmetry analysis-based schemes limit their performance when both breast tissues have similar abnormalities and tissue regions, because of the features measuring the abnormality result in the nonappearance of abnormality. The proposed model characterizes the thermal patterns of individual breast tissues and discovers the abnormalities. Evaluation results show that the proposed model with fractional order filtering, specific feature selection technique, classifier, explicit parameters, and the five-fold cross-validation achieves the highest performance with hybrid texture features at fraction order
It is evident from the comparative analysis of the features for multiple values of alfa (Figs. 7–9) that the performance of the feature set is sensitive to the value of fraction
Comparative analysis of different features (Gabor, HOG and statistical, HLBP) presented in this paper aids the literature. HLBP features are evaluated for the first time in this paper which gives the classification accuracy of 90.55% and other performance parameters are also comparable to the state-of-art schemes.
It is worth mentioning here that the smaller size lesions and early detection problems of medical imaging modalities such as mammography, MRI, etc. could be overcome up to some extent by the proposed model. Moreover, the use of fractional order filter makes the model more generalized with an iterative selection of fractions alfa for required performance in diverse thermogram acquisition protocols and respective applications such as skin cancer, thyroid, diabetic foot, peripheral vascular disease, pathogen detection in plants, in night vision and surveillance, etc.
A new fractional-order derivative and hybrid feature set dependent thermogram adaptive computer-aided breast cancer detection model is implemented. Performance of the two new feature sets of thermogram including HLBP and hybrid feature sets are also analyzed. The hybrid texture feature set is derived by combining different texture features for improved classification accuracy. A comparative study of hybrid feature set with other popular statistical and texture features for different values of fractional order
Funding Statement: We would like to thank all the faculty members and technicians who provided us their scientific guidance and assistance in completing this study. Praveen Agarwal, thanks to the SERB (Project TAR/2018/000001), DST (Projects DST/INT/DAAD/P-21/2019 and INT/RUS/RFBR/308), and NBHM (DAE) (Project 02011/12/2020 NBHM (R.P)/RD II/7867).
Conflicts of Interest: The authors declare that they have no conflicts of interest to report regarding the present study.
1. Silva, L. F., Santos, A. A., Bravo, R. S., Silva, A. C., Muchaluat-Saade, D. C. et al. (2016). Hybrid analysis for indicating patients with breast cancer using temperature time series. Computer Methods and Programs in Biomedicine, 130, 142–153. DOI 10.1016/j.cmpb.2016.03.002. [Google Scholar] [CrossRef]
2. Etehadtavakol, M., Ng, E. Y. K. (2017). An overview of medical infrared imaging in breast abnormalities detection. In: Ng, E., Etehadtavakol, M. (eds.Application of infrared to biomedical sciences, series in bio engineering, pp. 45–47. Springer, Singapore. DOI 10.1007/978-981-10-3147-2_4. [Google Scholar] [CrossRef]
3. Raghavendra, U., Gudigar, A., Rao, T. N., Ciaccio, E. J., Ng, E. Y. K. et al. (2019). Computer-aided diagnosis for the identification of breast cancer using thermogram images: A comprehensive review. Infrared Physics and Technology, 102(1), 103041. DOI 10.1016/j.infrared.2019.103041. [Google Scholar] [CrossRef]
4. Ng, E. Y. K. (2009). A review of thermography as promising non-invasive detection modality for breast tumor. International Journal of Thermal Sciences, 48(5), 849–859. DOI 10.1016/j.ijthermalsci.2008.06.015. [Google Scholar] [CrossRef]
5. Ng, E. Y. K., Sudharsan, N. M. (2001). Numerical computation as a tool to aid thermographic interpretation. International Journal of Medicine Engineering Technology, 25(2), 53–60. DOI 10.1080/03091900110043621. [Google Scholar] [CrossRef]
6. Kandlikar, S. G., Raya, I. P., Raghupati, P. A., Gonzalez-Hernandez, J., Dabydeen, D. et al. (2017). Infrared imaging technology for breast cancer detection-current status, protocol and new directions. International Journal of Heat and Mass Transfer, 108(6), 2303–2320. DOI 10.1016/j.ijheatmasstransfer.2017.01.086. [Google Scholar] [CrossRef]
7. Prabha, S., Sujatha, C. M., Ramakrishnan, S. (2014). Asymmetry analysis of breast thermograms using bm3d technique and statistical texture features. International Conference on Informatics Electronics Vision, pp. 1–4. DOI 10.1109/ICIEV.2014.6850730. [Google Scholar] [CrossRef]
8. Gonzalez, R. C., Woods, R. E. (2001). Digital image processing. 2nd ed. USA: Prentice Hall. [Google Scholar]
9. Schaefer, G., Zavisek, M., Nakashima, N. (2012). Thermography based breast cancer analysis using statistical features and fuzzy classification. Pattern Recognition, 42(6), 1133–1137. DOI 10.1016/j.patcog.2008.08.007. [Google Scholar] [CrossRef]
10. Acharya, U. R., Ng, E. Y. K., Tan, J. H., Sree, S. V. (2012). Thermography based breast cancer detection using texture features and support vector machine. Journal of Medical Systems, 36(3), 1503–1510. DOI 10.1007/s10916-010-9611-z. [Google Scholar] [CrossRef]
11. Mookiah, M. R. K., Acharya, U. R., Ng, E. Y. K. (2012). Data mining technique in breast cancer detection in thermograms using hybrid feature extraction strategy. Quantitative Infrared Thermography Journal, 9(2), 151–165. DOI 10.1080/17686733.2012.738788. [Google Scholar] [CrossRef]
12. Suganthi, S. S., Ramakrishnan, S. (2014). Analysis of breast thermograms using gabor wavelet anisotropy index. Journal of Medical Systems, 38, 101. DOI 10.1007/s10916-014-0101-6. [Google Scholar] [CrossRef]
13. Acharya, U. R., Ng, E. Y. K., Sree, S. V., Chua, C. K., Chattopadhyay, S. (2014). Higher order spectra analysis of breast thermograms for the automated identification of breast cancer. Expert Systems, (1), 37–47. DOI 10.1111/j.1468-0394.2012.00654.x. [Google Scholar] [CrossRef]
14. Araujo, M. C., Lima, R. C. F., DeSouza, R. M. C. R. (2014). Interval symbolic feature extraction for thermography breast cancer detection. Expert Systems with Applications, 41(15), 6728–6737. DOI 10.1016/j.eswa.2014.04.027. [Google Scholar] [CrossRef]
15. Etehadtavakol, M., Chandran, V., Ng, E. Y. K., Kafieh, R. (2013). Breast cancer detection from thermal images using bispectral invariant features. International Journal of Thermal Sciences, 69, 21–36. DOI 10.1016/j.ijthermalsci.2013.03.001. [Google Scholar] [CrossRef]
16. Naik, P. A., Zu, J., Owolabi, K. M. (2020). Global dynamics of a fractional order model for the transmission of HIV epidemic with optimal control. Chaos Solitons Fractals, 138(2), 109826. DOI 10.1016/j.chaos.2020.109826. [Google Scholar] [CrossRef]
17. Naik, P. A., Yavuz, M., Qureshi, S., Zu, J., Townley, S. (2020). Modeling and analysis of COVID-19 epidemics with treatment in fractional derivatives using real data from Pakistan. European Physical Journal Plus, 135(10), 795. DOI 10.1140/epjp/s13360-020-00819-5. [Google Scholar] [CrossRef]
18. Owolabi, K. M. (2016). Numerical solution of diffusive HBV model in a fractional medium. Springer Plus, 5(1), 1643. DOI 10.1186/s40064-016-3295-x. [Google Scholar] [CrossRef]
19. Tian, D., Xue, D., Chen, D., Sun, S. (2013). A fractional-order regulatory CV model for brain MR image segmentation. Control and Decision Conference, pp. 37–40. DOI 10.1109/CCDC.2013.6560890. [Google Scholar] [CrossRef]
20. Etehadtavakol, M., Chandran, V., Ng, E. Y. K., Rabbani, H. (2013). Separable and non-separable discrete wavelet transform based texture features and image classification of breast thermograms. Infrared Physics & Technology, 61(5), 274–286. DOI 10.1016/j.infrared.2013.08.009. [Google Scholar] [CrossRef]
21. Francis, S. V., Sasikala, M. (2013). Automatic detection of abnormal breast thermograms using asymmetry analysis of texture features. Journal of Medical Engineering and Technology, 37(1), 17–21. DOI 10.3109/03091902.2012.728674. [Google Scholar] [CrossRef]
22. Suganthi, S., Ramakrishnan, S. (2014). Anisotropic diffusion filter-based edge enhancement for segmentation of breast thermogram using level sets. Biomedical Signal Processing and Control, 10(5), 128–136. DOI 10.1016/j.bspc.2014.01.008. [Google Scholar] [CrossRef]
23. Francis, S. V., Sasikala, M., Saranya, S. (2014). Detection of breast abnormality from thermograms using curvelet transform based feature extraction. Journal of Medical Systems, 38(4), 23. DOI 10.1007/s10916-014-0023-3. [Google Scholar] [CrossRef]
24. Raghvendra, U., Acharya, U. R., Ng, E. Y. K., Tan, J. H., Gudigar, A. (2016). An integrated index for breast cancer identification using histogram of oriented gradient and kernel locality preserving projection. Quantitative Infrared Thermography Journal, 13(2), 195–209. DOI 10.1080/17686733.2016.1176734. [Google Scholar] [CrossRef]
25. Garduno-Ramon, M. A., Vega-Mancilla, S. G., Morales-Henandez, L. A., Osomio-Rios, R. A. (2017). Supportive noninvasive tool for the diagnosis of breast cancer using a thermographic camera as sensor. Sensors (Switzerland), 17(3), 497. DOI 10.3390/s17030497. [Google Scholar] [CrossRef]
26. Gogoi, U. R., Bhowmik, M. K., Bhattacharjee, D., Ghosh, A. K. (2018). Singular value based characterization and analysis of thermal patches for early breast abnormality detection. Australian Physical & Engineering Sciences in Medicine, 41(4), 861–879. DOI 10.1007/s13246-018-0681-4. [Google Scholar] [CrossRef]
27. Lin, C. L., Chang, Y., Kuo, C., Huang, H., Jian, E. (2010). A fast-denoising approach to corrupted infrared images. International Conference on System Science and Engineering, pp. 207–211. DOI 10.1109/ICSSE.2010.5551743. [Google Scholar] [CrossRef]
28. Image processing and image analyses applied to mastology. 2020. https://visual.ic.uff.br/en/proeng/. [Google Scholar]
29. Pu, Y. F., Zhou, J. L., Yuan, X. (2010). Fractional differential mask: A fractional differential-based approach for multiscale texture enhancement. IEEE Transactions on Image Processing, 19(2), 491–511. DOI 10.1109/TIP.2009.2035980. [Google Scholar] [CrossRef]
30. Rong, S., Zhou, H., Zhao, D., Cheng, K., Qian, K. et al. (2018). Infrared fix pattern noise reduction method based on shearlet transform. Infrared Physics Technology, 91(5), 243–249. DOI 10.1016/j.infrared.2018.05.002. [Google Scholar] [CrossRef]
31. Chebbah, N. K., Ouslim, M., Temmar, R. (2018). A new approach for breast abnormality detection based on thermography. Medical Technologies Journal, 2(3), 257–265. DOI 10.26415/2572-004X-vol2iss3p245-254. [Google Scholar] [CrossRef]
32. Singh, D., Singh, A. K. (2020). Role of image thermography in early breast cancer detection-past, present and future. Computer Methods and Programms Biology, 183, 105074. DOI 10.1016/j.cmpb.2019.105074. [Google Scholar] [CrossRef]
33. Zuluaga-Gomez, J., Masry, Z. A., Benaggoune, K., Meraghni, S., Zerhouni, N. (2020). A CNN-based methodology for breast cancer diagnosis using thermal images. Computer Methods in Biomechanics and Biomedical Engineering: Imaging & Visualization, 9(2), 131–145. DOI 10.1080/21681163.2020.1824685. [Google Scholar] [CrossRef]
34. Sanchez-Ruiz, D., Olmos-Pineda, I., Olvera-Lopez, J. A. (2020). Automatic region of interest segmentation for breast thermogram image classification. Pattern Recognition Letters, 135(10), 72–81. DOI 10.1016/j.patrec.2020.03.025. [Google Scholar] [CrossRef]
35. Clausi, D. A. (2002). An analysis of co-occurrence texture statistics as a function of grey level quantization. Canadian Journal of Remote Sensing, 28(1), 45–62. DOI 10.5589/m02-004. [Google Scholar] [CrossRef]
36. Dasarathy, B. V., Holder, E. B. (1991). Image characterizations based on joint gray-level run-length distributions. Pattern Recognition Letters, 12(8), 497–502. DOI 10.1016/0167-8655(91)80014-2. [Google Scholar] [CrossRef]
37. Ojala, T., Pietikainen, M., Maenpaa, T. (2002). Multiresolution gray scale and rotation invariant texture classification with local binary patterns. IEEE Transactions on Pattern Analysis and Machine Intelligence, 24(7), 971–987. DOI 10.1109/TPAMI.2002.1017623. [Google Scholar] [CrossRef]
38. Dalal, N., Triggs, B. (2005). Histograms of oriented gradients for human detection. Conference on Computer Vision and Pattern Recognition, pp. 886–893. DOI 10.1109/CVPR.2005.177. [Google Scholar] [CrossRef]
39. Agarwal, P., Deniïz, S., Jain, S., Alderremy, A. A., Aly, S. (2020). A new analysis of a partial differential equation arising in biology and population genetics via semi analytical techniques. Physica A: Statistical Mechanics and its Applications, 542(1–2), 122769. DOI 10.1016/j.physa.2019.122769. [Google Scholar] [CrossRef]
40. Rehman, A., Singh, R., Agarwal, P. (2021). Modeling, analysis and prediction of new variants of covid-19 and dengue co-infection on complex network. Chaos Solitons & Fractals, 150(1), 111008. DOI 10.1016/j.chaos.2021.111008. [Google Scholar] [CrossRef]
41. Günay, B., Agarwal, P., Guirao, J. L. G., Momani, S. (2021). A Fractional approach to a computational eco-epidemiological model with holling type-ii functional response. Symmetry, 13(7), 1159. DOI 10.3390/sym13071159. [Google Scholar] [CrossRef]
42. Agarwal, P., Singh, R., Rehman, A. (2021). Numerical solution of hybrid mathematical model of dengue transmission with relapse and memory via Adam-Bashforth–Moulton predictor-corrector scheme. Chaos, Solitons & Fractals, 143(1), 110564. DOI 10.1016/j.chaos.2020.110564. [Google Scholar] [CrossRef]
43. Agarwal, P., Singh, R. (2020). Modelling of transmission dynamics of Nipah virus (NivA fractional order approach. Physica A: Statistical Mechanics and its Applications, 547(1), 124243. DOI 10.1016/j.physa.2020.124243. [Google Scholar] [CrossRef]
where,
where
Hx and Hy are the entropy of Cx and Cy
H
Hxy2=
where M and N are the total figure of gray levels and pixels in an image respectively while L is the longest run.
 | This work is licensed under a Creative Commons Attribution 4.0 International License, which permits unrestricted use, distribution, and reproduction in any medium, provided the original work is properly cited. |