| Computer Modeling in Engineering & Sciences |
DOI: 10.32604/cmes.2021.017422
ARTICLE
Clinical Data-Driven Finite Element Analysis of the Kinetics of Chewing Cycles in Order to Optimize Occlusal Reconstructions
Dedicated to Professor Karl Stark Pister for his 95th birthday
1Institute of Mechanics, Karlsruhe Institute of Technology (KIT), Karlsruhe, Germany
2Department of Prosthodontics, Dental School, University of Würzburg, Würzburg, Germany
3Department of Prosthodontics, University of Heidelberg, Heidelberg, Germany
*Corresponding Author: Karl Schweizerhof. Email: karl.schweizerhof@kit.edu
Received: 09 May 2021; Accepted: 05 August 2021
Abstract: The occlusal design plays a decisive role in the fabrication of dental restorations. Dentists and dental technicians depend on mechanical simulations of mandibular movement that are as accurate as possible, in particular, to produce interference-free yet chewing-efficient dental restorations. For this, kinetic data must be available, i.e., movements and deformations under the influence of forces and stresses. In the present study, so-called functional data were collected from healthy volunteers to provide consistent information for proper kinetics. For the latter purpose, biting and chewing forces, electrical muscle activity and jaw movements were registered synchronously, and individual magnetic resonance tomograms (MRI) were prepared. The acquired data were then added to a large complex finite element model of the complete masticatory system using the functional information obtained and individual anatomical geometries so that the kinetics of the chewing process and teeth grinding could be realistically simulated. This allows developing algorithms that optimize computer-aided manufacturing of dental prostheses close to occlusion. In this way, a failure-free function of the dental prosthesis can be guaranteed and its damage during usage can be reduced or prevented even including endosseous implants.
Keywords: Occlusal design; mechanical simulations of mandibular movement; finite element model of the complete masticatory system; simulation of chewing process and teeth grinding
1 Introduction and Goal of the Study
The occlusal design plays a decisive role in the fabrication of dental restorations. Due to the necessary “relocation” of the fabrication process outside of the patients’ mouths, dentists and dental technicians depend on mechanical simulations of mandibular movement that are as accurate as possible. This is the only way to produce interference-free, yet chewing-efficient dental restorations. For some years now, prosthetic restorations have increasingly been designed and manufactured with the aid of computers. This makes it possible to take individual, patient-specific functional parameters into account even more precisely during fabrication than it was possible with manually fabricated restorations so far. However, this requires that not only kinematic but also kinetic data, i.e., movements and deformations under the influence of forces and stresses, are available. This has not been the case to date: only kinematic data can be taken into account in the manufacture of dental restorations. Movements of the teeth, the deformation of the mandible during jaw movements, the elasticity of the discus articularis of the temporomandibular joint, in fact, all involved tissues under the influence of biting and chewing forces cannot be captured at present, in particular not those forces that are developed during the dynamics of the chewing process. Especially, in the case of all-ceramic or ceramic-veneered fixed partial dentures, this can lead to failure of the ceramic due to the material-specific properties. Precisely, interference-free fabrication of restorations under short-range intercuspation (area comprising a vertical dimension from the maximum intercuspation to a separation of the teeth on the opening of approximately 3 mm) and under kinetic conditions is of particular interest here.
Therefore, in the following study, the “missing” information should be supplemented with functional data collected from healthy volunteers. For this purpose, biting and chewing forces, electrical muscle activity and jaw movements had to be registered synchronously, and individual magnetic resonance tomograms (MRI) had to be prepared. The acquired data were then to be added to an already existing finite element model of the masticatory system (temporomandibular joint, all masticatory muscles, mandible, maxilla, teeth and periodontium) using the functional information obtained and individual anatomical geometries in such a way that the kinetics of the chewing process and teeth grinding could be realistically simulated. Finally, the trajectories determined under kinetic conditions (more precisely, the movement space required for interference-free function) should serve to develop algorithms that optimize computer-aided manufacturing of dental prostheses close to occlusion. In this way, a failure-free function of the dental prosthesis could be guaranteed and its damage during usage (e.g., chipping of the ceramic veneer) could be reduced or prevented. These data appear to be very important, especially in view of the increasing number of endosseous dental implants. Therefore, the use of implants should also be simulated. Because the implant is very tightly connected to the bone, occlusal forces occurring during function cannot be “damped or absorbed” as is the case of natural teeth.
The presentation in this paper summarizes major parts of our work on this subject. For the reader interested in some details, we referred to the dissertation of Martinez et al. [1] and some parts presented as first step in previous contributions [2,3] focusing on specific issues.
2 Clinical Part–Tests and Experiments
In the main study, we recorded bilaterally the activation states of all major masticatory muscles (bilateral: anterior and posterior temporalis, masseter, medial and lateral pterygoid, anterior digastric), jaw movements and masticatory forces during simulated chewing. The EMG recordings were performed with both intramuscular and surface electrodes [4]. MRI tomograms of the 16 subjects, in addition to the reconstruction of muscle volumes and anatomical geometries, were used to determine the target coordinates for the intramuscular electrode placement.
For the purpose of simultaneous chewing force measurement, an intraoral measuring device was developed which, on the one hand, imitated a realistic food bolus and, on the other hand, was able to simulate the chewing forces occurring as realistically as possible without compromising the natural intercuspation. The hydrostatic force measuring system already used in an earlier work of the authors, whose material was apparently too vulnerable for mastication simulations, was redesigned, further developed and duplicated. For this purpose, it was necessary to find a material for the bite pads that was “stable” enough to resist the tooth penetration during the chewing cycle. The two test foods used were wine jelly, which has tough-elastic properties, and carrots which are rather hard and brittle [5].
The measuring devices were fabricated extraorally in the dental laboratory on the individual plaster models of the test persons. The plaster models were made according to precision impressions of the test persons’ tooth rows. Two splints were constructed for each test person. The splint in the upper jaw was used to stabilize a plastic container that contained the test food and prevented dislocation of the chipped test food by means of a special holder. The mandibular splint had a similar mount that held the pressure sensor in place during chewing (Fig. 1).
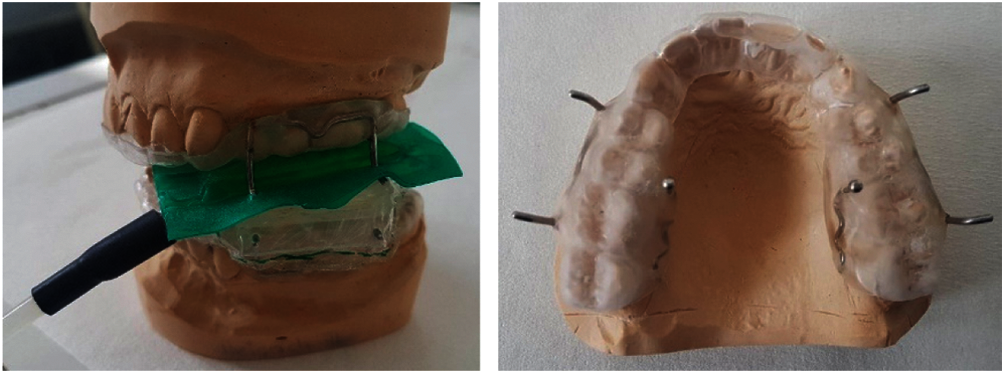
Figure 1: Left: side view of the complete force measuring device including stabilization system on the plaster models. Right: horizontal view of the maxillary splint with the integrated brackets
By the aid of MRI tomograms, which had been individually prepared for each test person at the Institute for Diagnostic and Interventional Radiology at the University Hospital of Würzburg, Germany, the penetration depths and penetration directions for the intramuscular fine wire electrodes were precisely determined, thus ensuring the exact final localization of the electrodes. An example of the measurements from an MRI layer (here pterygoideus lateralis) is shown in Fig. 2.
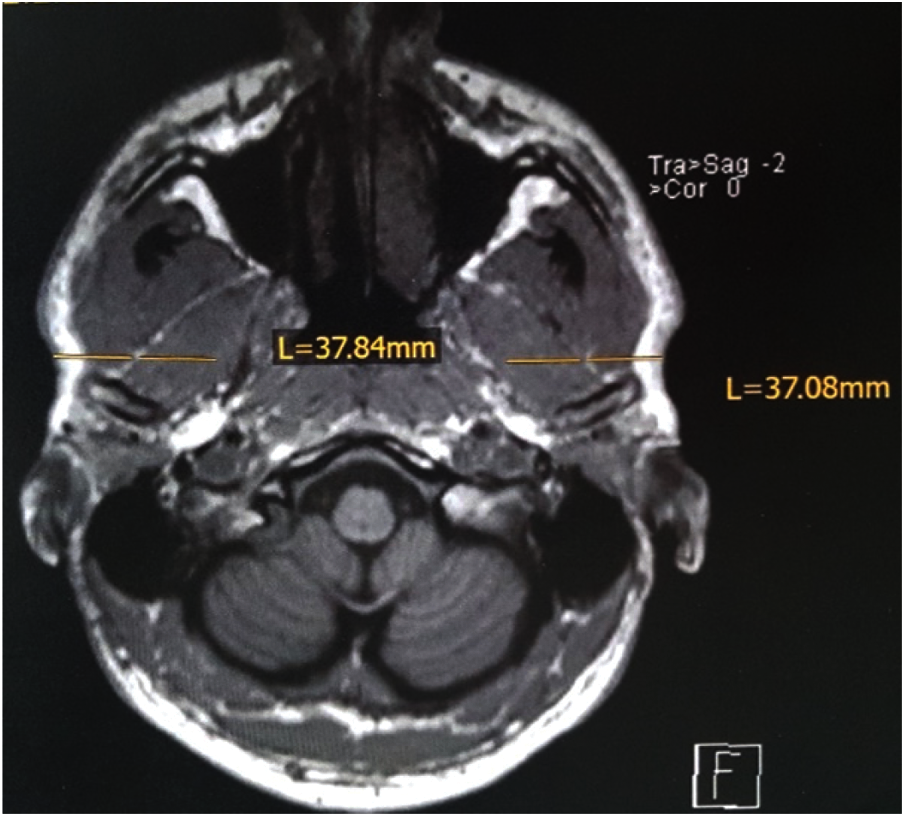
Figure 2: Example of measurements of penetration depth on the transverse plane of the skull MRI, for the pterygoideus lateralis muscle
The intramuscular electrodes were produced manually in the own laboratory and inserted into the previously determined position in the corresponding muscle by means of insertion aids. Synchronously with the EMG and force measurements, the mandibular kinematics were recorded at the incisal point using a magnetic field-based telemetric device (Myotronics K7).
The subjects were prepared for the final test session in several trial sessions. At the final measurement (see Fig. 3), the cocontraction patterns of the masticatory muscles were recorded and normalized with the maximum electrical activation of the muscles [MVC%], which was also recorded, to allow inter-individual comparisons.
The results of the project serve both, the further development of the FE-model and a deeper understanding of the masticatory muscle cooperation during mastication. The cocontraction behavior of the masticatory muscles during mastication cycles has not been investigated to date under synchronous recording of the muscle activity of all masticatory muscles, recording of the mandibular kinematics [6], and registration of the masticatory forces. Knowledge of these physiological relationships will help to distinguish functional from pathological patterns in the future, which could be of ultimate importance for the therapy of chewing function disorders.
The originally planned force-controlled simulation of eccentric teeth grinding in the experiment was not carried out, as this would have meant a considerable additional load on the test persons during the already very extensive test sessions. However, comparable data are available from a previous publication of the applicants [7].
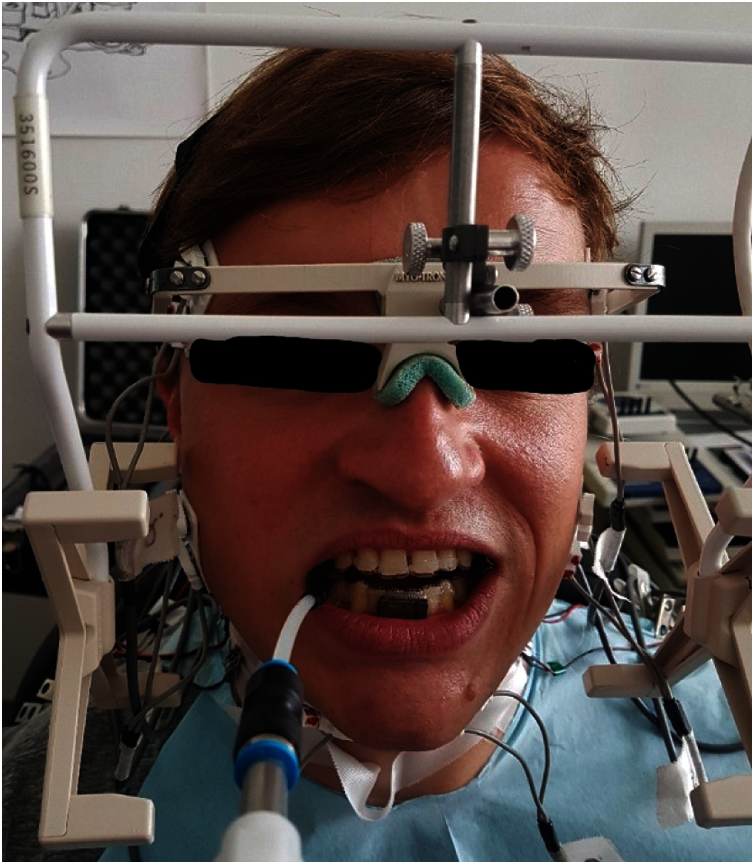
Figure 3: Test person with the entire measuring equipment in situ
3 Numerical Modelling and Study
The main goal of the numerical modelling project was to analyze, by means of the finite element method (FEM), the kinetics of nearer occlusion functional and dysfunctional movements of the masticatory system for the optimization of dental prosthesis. In order to accomplish this goal, several specific tasks were considered within this project, namely:
• Development and discussion of an enhanced model for the simulation of a food bolus
• Individualization of models of the masticatory system
• Selective simulations to establish the contribution of the articular disc and the periodontium
• Incorporation of implants
• Investigation of the displacement of the condyle during the mastication cycle.
The basis of this project was to employ, modify and enhance a previously created model of the masticatory system which incorporated the majority of the components of the masticatory system. This is described in more detail in the following.
3.1 Geometry, Materials, Loading and Methods
The ideas of the work of Koolstra et al. [8–10] are implemented in the FE model, however, ignoring the rigid components. The experience of previous studies [11–13] was incorporated to model the components of the jaw joint. We employed osseous-structure material properties as reported by O'Mahoney et al. [14] and by Tanaka et al. [15]. Obtaining periodontal-ligament (PDL) material properties were challenge due to significant discrepancies found in publications [16]. Different successful implementations of material models [17–19]-often time consuming-can be found. However, in the present study standard material models as well as a self-calibrated model were used.
The different aspects and parts of the FEM model are described briefly below. Transient analyses were performed. We enforced the system kinematic constraints by guiding the jaw motion.
3.1.1 Model Geometry, Discretization and Boundary Conditions
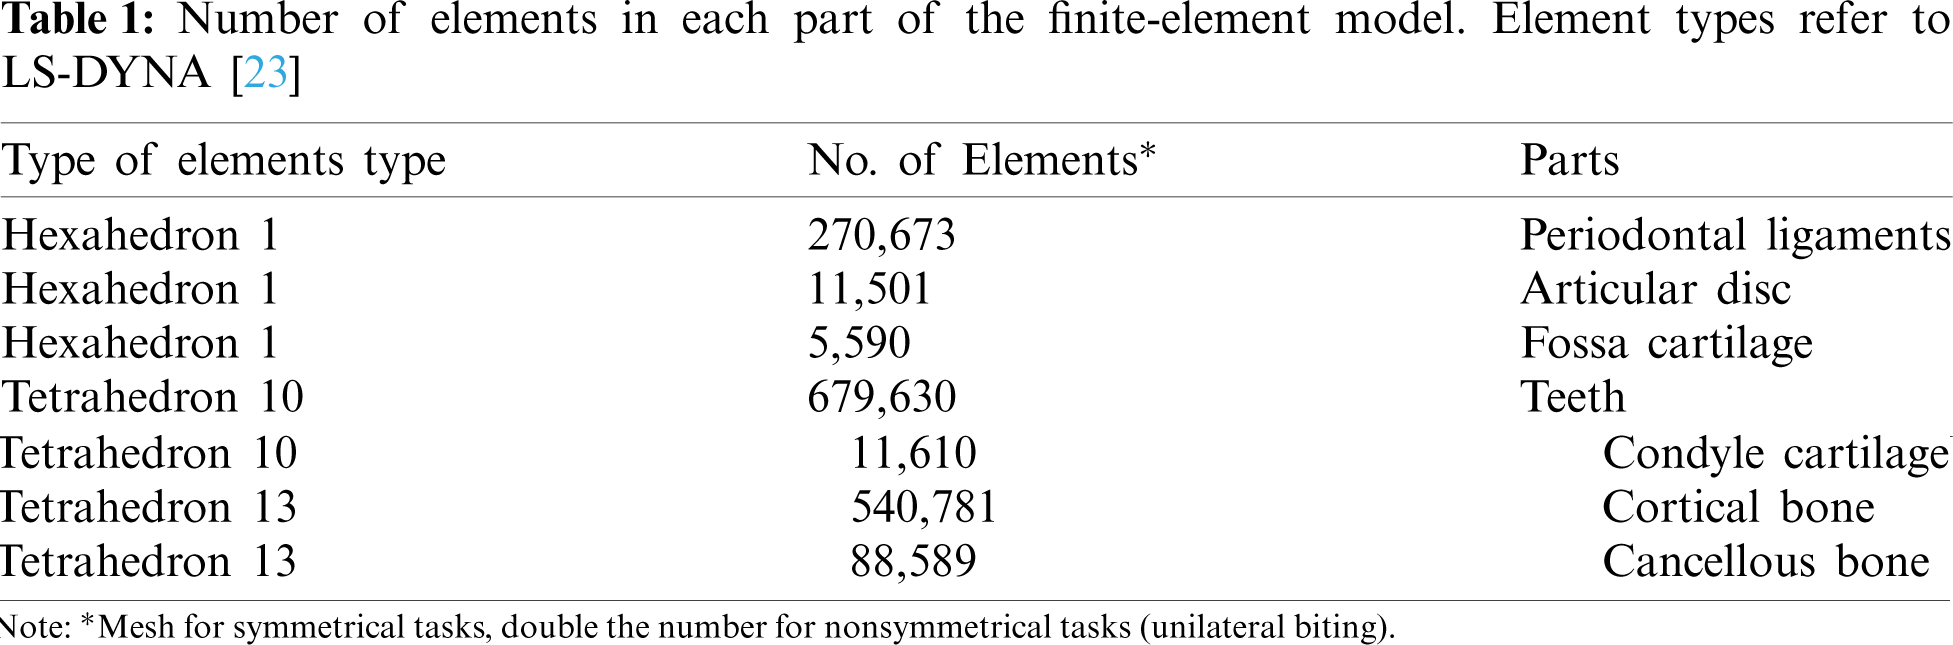
CT scans obtained from a male patient (age 35) were the basis of the geometry of our final FE model. In a first step these CT scans were then processed using the segmentation software “Mimics Innovation Suite” [20] creating the geometry. With the software “Geomagic Studio 12” [21] defects of the geometry from the segmentation process were repaired in a second step followed by converting the files into a compatible format for computer-aided design (CAD) software. In order to get a Finite Element model the preprocessor “Hypermesh 12” [22] was used to mesh the complete model. A standard mesh convergence analysis with different nonlinear runs lead to a model with more than 1.800.000 elements for unilateral biting. Concerning the boundary conditions in the model, the superior part of the periodontal ligament of the maxillary teeth is constrained as well as the superior part of the cartilage of the fossa. An impression about the types and number of elements in LS-DYNA [23] is given in Table 1. To these numbers we have to add the numbers of elements for the bolus as well as the truss elements used for attachments, ligaments and muscles. The teeth are set rigid; thus, each tooth is treated as a separate rigid body.
Determined experimentally in previous work [24,25], forces on the model are imposed as a result of the activation of the muscles. By using of the software LS-DYNA 6.1 [23] the nonlinear transient simulations were performed with an explicit time-integration scheme, the so-called central difference scheme, which has second order accuracy, leading to very small time-steps. This had the advantage to avoid hard to manage iterations often occurring with the use of implicit time integration problems with such a complex model. As indicated in Fig. 4. the x–y plane (essential the Frankfort horizontal plane) acts as reference plane for the computations. A detailed explanation of this model (Fig. 4) can be found in a previous publication [2] to get an impression on the required CPU time for a complete analysis of about 600 ms simulation time on massively parallel computers: 64 CPUs about 60 h, 128 CPUs about 38 h.

Figure 4: Entire mandible model, including cancellous and cortical bone, masticatory muscles, periodontal ligaments, teeth, and all important jaw-joint tissues (cartilage, osseous-bone-structures, ligaments, disc and bilaminar zone), anterior temporalis (a), articular disc (j), capsule attachments (h), condyle (l), deep masseter (d), digastricus (g), lateral pterygoid (f), mandibular fossa (k), medial pterygoid (e), posterior temporalis (b), superficial masseter (c), temporomandibular ligament (i), plus an artificial bolus (2). The x, y coordinate axes span the Frankfort horizontal plane. The modular composition of the FE model is represented by the different colors
The temporomandibular joint (TMJ)–for a more extensive discussion concerning the specific behavior of the TMJ we referred to [3,1]–is composed of the condyle, the articular disc, the cartilage of the fossa, the cartilage of the condyle and the lateral, medial, posterior and anterior attachments of the disc (Fig. 4). Based on a first publication of Koolstra et al. [8] the cartilage and the articular disc were modeled with a Mooney–Rivlin hyperelastic material which is usually described by means of a strain energy function. This allows the derivation of the stress–strain relationship. The strain energy function W for the chosen Mooney–Rivlin material model is given by
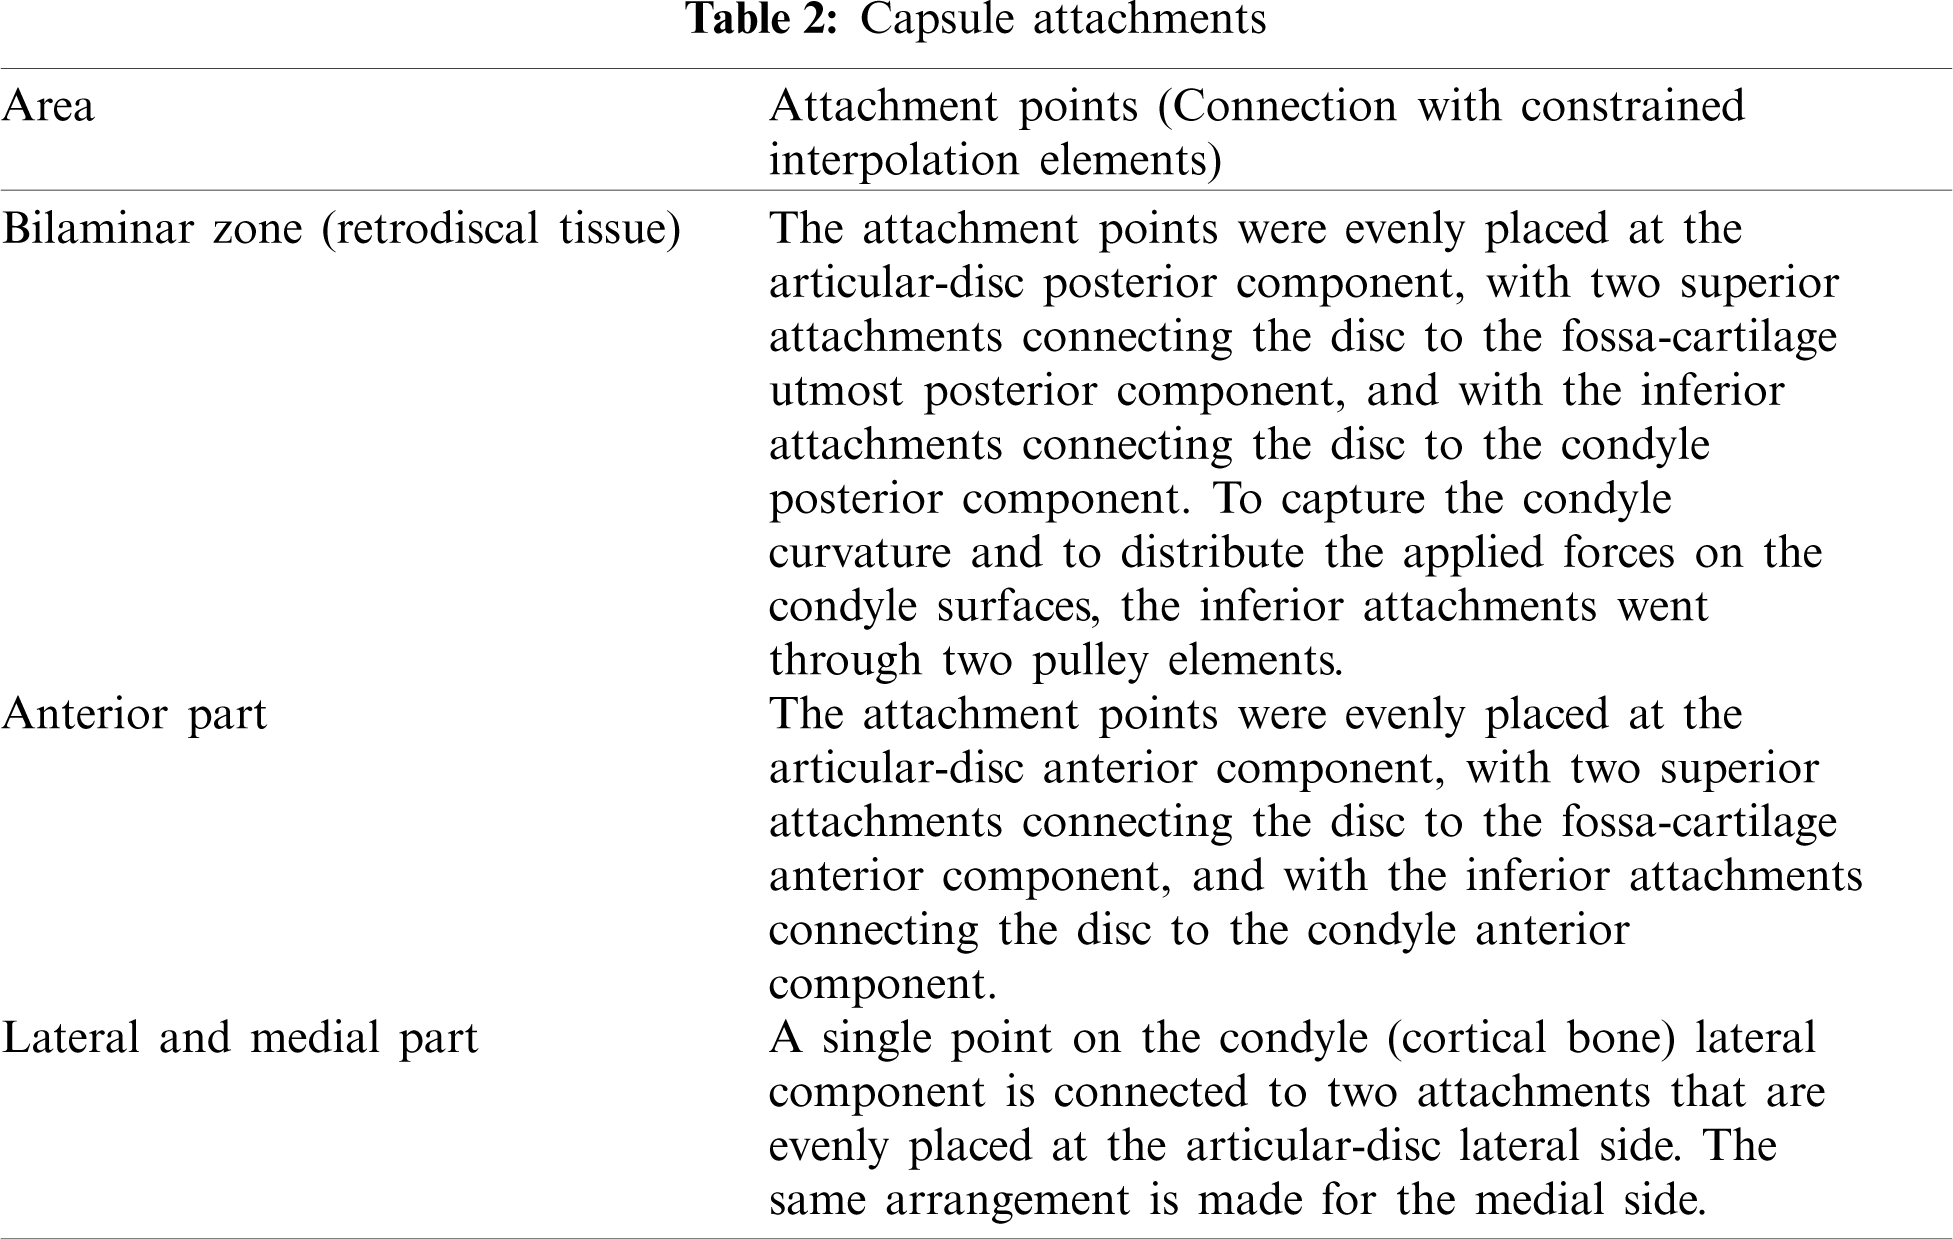
By including viscoelastic behavior of the disc, the choice of the decay constants follows a second publication of Koolstra et al. [9]. In order to ensure joint stability during kinetic loading posterior and anterior attachments of the capsule and the temporomandibular ligament have to be included. By using truss elements for them, a reasonable model for the lateral, medial, anterior and posterior attachments was achieved. For material data an elastic modulus following the stress–strain curve obtained by Tanaka et al. [26] was chosen. In Table 2 verbal information about the positions of these attachments is given. The temporomandibular ligament is modeled by a pair of trusses for each side with material properties following Palomar et al. [12]. The extent of the trusses was estimated from the area covered by the attachments on the disc.
3.1.3 Cortical and Cancellous Bone
The cortical bone material is well known to be anisotropic in the radial direction, as well as in the longitudinal direction along the bone axis [27]. On the other hand, for both types of bone models, we employed a material behavior that is linear, elastic, and isotropic. Such material behavior was proved to be sufficient for our investigation. To this end, we used the material data, such as the Young's moduli and the Poisson's ratios, for the cortical and spongy bone, as reported in O'Mahony et al. [14] and in Tanaka et al. [15], see Table 3.

The muscles in the jaw opener (superior and inferior lateral pterygoid, digastric) and in the jaw closer (medial pterygoid, superficial and deep masseter, anterior and posterior temporalis) were partitioned into fibres and tendons. To represent the tendons, which in reality undergo very little, thus negligible deformation, an inextensible wire was used. With Hill's muscle model [28] the fibres behavior was approximated. In principle the sarcomeres regulate the forces produced by the muscles, which mainly depended on their lengths (force-vs.-length relation) and their contraction velocities (force-vs.-velocity relation). Further, as during stretching a passive elastic force is generated in the muscles, the Hill-type muscle model–LS-DYNA Material No. 156-represents the principal characteristics very well. The general definition follows the work of van Ruijven et al. [29] as:
where the instantaneous activation level is denoted by A(t), the force-length factor by FV(t), the force-velocity factor by FV(t), the maximum isometric muscle force by Fmax, the parallel elastic force by FP(t), with t denoting time. The CT scans of the test subject determined the muscle origin and insertion points. The necessary data for the calculation of the sarcomere length were obtained from the work of van Eijden et al. [30]. The number of sarcomeres acting in parallel influences the maximum force produced by a muscle. The product of the physiological cross-sectional area (PCSA) of the muscle with an estimated factor of 40 N cm−2 [31] yields such a maximum muscle force. Moreover, each masticatory muscle has its PCSA value as reported in [30]. Different tasks have their activation level obtained from Rues et al. [24] and from Schindler et al. [25]; see also our first study in [2]. The muscle tendon lengths and the muscle force magnitudes are provided in Table 4.

In general, the periodontal ligament (PDL) is a binding tissue that attaches the teeth to the alveolar bone and governs short-term tooth mobility. It is composed of bundles of connective tissue fibers (Sharpey's fibers), specific cells, vasculature, nerves and ground substance [32,33]. Occlusal forces are absorbed by the oblique fibers, which cover most of the surface of the tooth. Located at the top and at the bottom of the PDL are the remaining fiber bundles that counteract the tipping and the rotating forces. With respect to the PDL's functional properties the vasculature plays an essential role, which means the fluids inside in the PDL (blood vessels and ground substance). Once the teeth were loaded, the fluids in the PDL's rich vascular supply would flow into the alveolar bone, producing the tissue dissipative properties. However, this fluid flow is limited, the PDL becomes finally almost incompressible and hydraulic pressure distribution can be observed [34].
The PDL geometry was obtained using Boolean operations, together with a 250 μm of positive offset expanding a set of teeth. We thus cut out a matching set of maxilla and jaw dental alveoli. The final PDL volumes were then approximately defined as the space between the new alveoli and the normal-sized teeth. The PDL behavior was first approximated in the FE model by a first-order hyperelastic Ogden material model with bulk property fundamental for its behavior. In LS-DYNA, Material 77 [23] is the Ogden material law with the strain energy function W given by
where
where the parameters for the material are denoted by C10, C20, C30, D1, D2, D3, the right-Cauchy-strain-tensor first invariant by
3.1.6 Bolus–Standard Simple Model
The bolus with 2 mm thickness was placed, see Fig. 4, between the maxillary molar No. 16 and the mandibular molar No. 46 (i.e., the right-side-jaw first molars). Such a small thickness enables an optimum fit of the bolus in the deformed state, under applied bite forces, to the molar surface. For the bolus first a linear elastic material was taken, almost equivalent to the elastic modulus of an almond under compression, with a Young's modulus of 20 MPa and a Poisson's ratio of 0.47 [37].
3.2 Simulation and Results of a Simple Bolus Model–Muscle Activation from Older Experiments [24,25]
The simulation in this section is already included in our previous publication [2]. It is repeated here briefly to give the reader of this contribution a better insight into our complete study/project, in particular, showing the various steps and the developments in this study.
First the jaw has to be opened for 220 ms, so the bolus could fit between the molars having a gap of approximately 6.5 mm. We thus need to adjust the muscle activation levels to this gap. For the molar teeth to firmly and stably grip the bolus, it was necessary to have a slight activation of the closing muscles up to t = 400 ms. In the FE model the so-called contact elements in between the molar teeth were activated at t = 230 ms. At t = 259 ms, molar 46 and the bolus became in contact at an approximate gap of 5.5 mm. Further a rigid body rotation of the bolus occurred until time t= 278 ms at an approximate gap of 4 mm. Then the bolus was completely captured by the cusps of the molars. For time t > 400 ms, the levels of activation were gradually and linearly increased to the values in Table 4 to reach a bite force with the realistic magnitude 150 N, and a gap of approximately 2 mm at time t = 600 ms. See Schindler et al. [25] for more details.
Fig. 5 shows the resulting force between tooth 16 and tooth 46 (see Fig. 4) from both the frontal and the sagittal perspectives. The green and red dots mark the points of application of the resultant force. At time t = 400 ms and at time t = 600 ms, the gap between the molars is approximately 3.1 and 2 mm, respectively, with the resulting force vector given by the red interrupted line and the black line, respectively. Based on the resulting forces and moments for both teeth the location of the application points was estimated, by means of an iterative process. During the initial biting phase, when the teeth are capturing the bolus, the resulting force and the root direction are essentially, but not completely, aligned. Thus initially, the resultant force direction forms a significant angle with the sagittal plane and with the frontal plane, relative to the occlusal plane. Further along in the biting process, with the force and the deformation increasing, the resulting force essentially points in the vertical direction, normal to the Frankfort horizontal (FH) plane. The spatial kinematic behavior can, in principle, be thought of as a partial spiral movement resulting in a short-range intercuspation. The development of the force components on tooth 16 over time are given in Fig. 6.

Figure 5: Resulting force directions at time t = 400 ms and time t = 600 ms. The red and green dots are the predicted application points. Force F, Frankfort horizontal plane FH, Sagittal angle α between FH and occlusal plane
An important information, which is extensively discussed in [2,37], is that the displacements of molar 46 are fully controlled by its PDL, as the maxillary bone at the PDL's border constrains it.
A further important observation of these FE simulations–confirmed by Rues et al. [24] and by Schindler et al. [25] in their reported experimental investigations-is that the molar teeth are axially loaded only at the incipient power stroke, but not during the motion toward short-range intercuspation. This is in contrast to many opinions found in the literature.

Figure 6: Force components on tooth 16. Development over time in the vertical, lateral-medial and anterior-posterior directions
4 Discussion of an Enhanced Model for the Simulation of the Food Bolus Considering Large Deformations
One of the main goals of this project was to study the behavior of the masticatory system during chewing, specifically near intercuspation, particularly, in order to investigate the role of tooth mobility during the chewing process. For this, a bolus which would allow large deformations and fracture was also required, as food boluses are minced when the teeth are near to intercuspation.
Thus, an alternative bolus was modeled using a plastic kinematic material model where fracture can be defined through strain. The bolus has a cuboid shape and is modeled fully by hexahedral elements. The material data are chosen with the properties of a carrot. The elastic modulus was obtained from the literature [5]. Since the material undergoes fracture, the contact surface changes during the simulation. These cases are handled in LS-DYNA through the card *CONTACT_ERODING, which automatically redefines the contact surface once one of the contact surface elements has been deleted. In order to avoid any hourglassing problem a fully integrated formulation for elements with poor aspect ratio was employed.
The aim of this task was to bring the teeth very close to intercuspation, with a distance of less than 0.5 mm between the surface of the antagonistic molars. Forces on the bolus should also be higher than 100 N. Additionally, the muscle activation levels were calibrated to produce a jaw motion that would closely capture the kinematics of the chewing task. For this end, experimental activation levels of the muscles were investigated and calibrated to produce displacements and speeds on the chin of the mandible that matched those found in the literature. The experimental activation levels of the muscles during the chewing process were taken from the experiments discussed in Section 2.
5 Utilization of the Clinical Muscle Activation Data within the Numerical Studies
The raw EMG signals of the muscles of Section 2 were processed through the software AcqKnowledge [4]. In order to acquire a normalized force, EMG levels of the muscles were obtained both, during mastication and maximum bite force. There are several approaches to process the EMG signals of the muscles, in our work a simple root mean square was employed since the mastication process is dynamic. It has been stated in the literature [37], that the interpretation of the EMG signals depends on the type of the contraction the muscles are undergoing. While a strong correlation can be obtained with the mean EMG level and the produced force during isometric contraction, during movement this relationship is more variable. For this reason, the processed values were employed partially as a basis for the final activation levels.
Due to several factors, calibration of the activation levels of the muscles was extremely time-consuming. During the calibration of the muscles’ activation levels, the motion of the jaw revealed that several parameters, such as the muscle passive resistance as well as the retrodiscal tissue and attachments of the disc required further calibration. Additionally, the retrodiscal tissue, previously modeled using trusses, pulley and rigid elements, was remodeled with solid elements (Fig. 7). The previous model employed pulley elements in order to keep the inferior retrodiscal tissue attached to the surface of the condyle, due to problems arising from defining contact between beam elements and the irregular surface of the condyle. This, however, created problems during large anterior displacements/rotations of the condyle as the tissue begins to resist the rotational movements of the condyle. In reality, this tissue relaxes as the condyle rotates.

Figure 7: Retrodiscal tissue modeling using truss, pulley and rigid elements (left) and solid elements (right)
The new geometry of the retrodiscal tissue is attached to the posterior of the articular disc and to the posterior part of the condyle through a tied contact formulation. Contact between the interior surface of the retrodiscal tissue and the cartilage of the condyle is defined as well. This new geometry indeed produces the expected behavior of the retrodiscal tissue, keeping the articular disc above the condyle during biting tasks and relaxing when the condyle rotates during jaw opening.
The calibrated activation levels, which produced motions in the condyles and in the chin of the jaw similar to those measured in the clinical experiments of Section 2 can be observed in Fig. 8.
Forces present at the ipsilateral and contralateral joint, as well as the total biting force during a chewing task can be observed in Fig. 9. It can be seen that forces in both joints increase during the initial jaw opening movement, diverging significantly at around time 300 ms. At this point the contralateral condyle continues to anteriorly displace while the ipsilateral condyle begins to retract. These opposing movements of the condyles are responsible for the lateral movement of the chin of the mandible. At the time when the teeth make contact with the bolus, forces in the ipsilateral joint are half as those found in the contralateral joint. Forces are, as expected, much larger in the contralateral joint during the power stroke.

Figure 8: Calibrated normalized activation levels of the muscles for both sides of the mandible to produce a chewing motion
In Fig. 10, an anterior view of the motion followed by the molar during the chewing task is shown. In this same figure, an isometric and frontal cut view of the molar and the bolus at the end of the simulation can be observed. The maximum width of the mastication path was observed to be of 4.88 mm while the maximum vertical displacement was 17 mm. These displacements are inside the ranges of experimental measurements [6].

Figure 9: Forces in the joints and in the bolus during a chewing task

Figure 10: Front view of the path followed by the molar during a chewing task (left), isometric view of the molars and bolus at time 600 ms (middle) and cut view of the molars involved in the chewing task at time 600 ms (right)
6 Individualization of Complete Models
The mesh of the existing model was modified to closely resemble the geometries from diverse CT scans provided in [38]. The properties of the muscle models were adjusted as well following the observable areas in the scans. The measurements taken were the width, defined as the distance between the outer borders of the condyles, the height, from the top of the condyles to the bottom of the body of the mandible, and the length, from the posterior part of the condyles to the anterior part of the body of the mandible (Fig. 11).

Figure 11: Measurements taken of each mandible
The measurements of the different subjects can be observed in Table 5. The model was modified by scaling the three dimensions of the mesh. In total, four models were created by scaling the original model, one for each respective subject.

A mastication cycle was simulated with each of the modified models in order to study the differences in joint and biting forces. The mastication cycle was produced using the calibrated activation levels employed in the previous section.
It was observed that the scaled model 1 has the lowest force at the contralateral joint during the opening phase of the chewing task. The rest of the scaled models shows a very similar ratio of forces between the joints to that of the original. At this stage, since there is no contact with the bolus, the discrepancy of force shown by the first scaled model occurs by the difference of muscle length. The smaller muscle length results in an overall smaller force as the range where the muscle can effectively generate force is also reduced. In the case of the third scaled model, which also has jaw reduced length, muscle length remains fairly similar to the original model, due to the jaw's height increase.
Comparing the distribution of forces between the joints and the teeth when a biting force of 50 N has been reached reveals that for all models the force distribution is almost identical, with an ipsilateral joint force of 7–8 N, and a contralateral joint force of 25–27 N.
The scaled models show a width of the chewing motion inside the range of experimental observation. In the case of the first and third model, the vertical displacement is shorter than excepted. There is also contact between teeth that are not involved in the mastication process, such as the premolars and canines, in the third and fourth scaled model.
It is very difficult, at present, to assess the insight that the creation of individual geometries for each patient would produce. In the current state of the model, there are many assumptions regarding the different tissues of the masticatory system. Material properties were taken from experimental tests performed on different animals and were further calibrated through the incorporation of different biting/chewing tasks, where experimental data was available. In order to further the comprehension of the masticatory system, the individual geometry of the patient should be accompanied by considerable experimental measurements, which are considerably difficult to acquire at this point of time.
The chewing task was repeated with different stiffness parameters for the articular disc and the periodontium. For the articular disc, two simulations were executed, one where the stiffness parameters were reduced by 25% and another where it was increased by 25%. Displacements of the condyles and subsequently the path of the molars are essentially identical, with the stiffer disc showing a minuscule higher displacement at the contralateral side. In the case of the forces, it was also observed that the changes were minimal, with force distribution staying essentially the same. More noteworthy were the changes of the stresses in the articular disc, where in the case of the softer disc the maximum compressive stress was reported as −3.42 MPa, while the stiffer disc showed a maximum compressive stress of around −4.5 MPa. The reduction of stresses within the softer disc is a result of the increase of its incompressibility, as, while the shear modulus was reduced, the bulk modulus remained constant. As the material becomes more incompressible, forces on its surface are more evenly distributed, reducing the stresses.
The geometry of the implant using the specifications of a STRAUMANN dental implant (Fig 12, left) was modeled through the CAD software Autodesk Inventor [39] (Fig 12, right). Implants are available in different lengths, in our investigation, a length of 14 mm was chosen.
The assembly of the implants into the mandible can be observed in Fig. 13. To incorporate the implants into the mandible, the geometry of the PDL was removed and the remaining orifices at the top of the mandible were sealed with a simple plane. The dental crowns were created by modifying the geometry of the teeth via removing their roots. The implants and the dental crowns were then joined to the mandible through Boolean operations. This configuration results in an oversized cortical bone, which leads to stresses around this area not having a meaningful value. This first configuration, however, was employed and proved to be useful to study the effect of restoring dentition through implants on the temporomandibular joint.
Three different tasks were compared to study the effect of introducing implants in the mandible. First a unilateral biting molar task of 100 N with a mandible with normal dentition was performed. Next a unilateral premolar biting task of 100 N with molars 46 and 47 removed from the mandible was carried out followed by a unilateral molar biting task of 100 N with a mandible with implants restoring molars 46 and 47.
Forces on the joint show a clear increase when the premolars are employed instead of the molars. This results from the increase in distance between the joint and the biting point, which increases the lever of the biting force. The introduction of the implants restores the initial forces on the joint, but does not affect the displacements of the condyles during the biting task.

Figure 12: STRAUMANN implant (left) and geometry recreated in Inventor (right) [39]

Figure 13: Assembly of the implants (left), configuration without molar teeth and with bolus (right)
9 Investigation of Displacement of the Condyle during the Mastication Cycle
Experimental data provided in [38] show the displacements of the condyles during the mastication cycle. During the initial part of the opening phase, both condyles move forward and downward to an almost identical degree, which results in a jaw opening with very small lateral movements. As the jaw opening progresses, the displacement of the non-working condyle begins to overtake the displacement of the working condyle, which triggers the lateral movement of the mandible. The largest lateral velocity of the incisor occurs when the non-working condyle is still displacing forward and, simultaneously, the working condyle begins to return to its original position. As previously mentioned, these dynamics of the mandible during chewing required careful adjustment of the attachments of the disc, specifically the remodeling of the retrodiscal tissue. Fig. 14 presents the displacements of the condyles obtained with our model during chewing.

Figure 14: Vertical (top) and anterior (bottom) displacement of the condyles during mastication
Comparison with experimental data provided in [38] shows that the anterior displacement of the condyles should be slightly larger. However, although this may vary between patients, it most likely originates from the reduction of the considered simulation time from 800 to 600 ms because this results in a partially reduced motion of the jaw during mastication.
10 Relevance of the Obtained Results
In this study, the jaw chewing motion was calibrated through the direct activation levels of the muscles. Such calibration took a considerable effort before the resulting behavior could be considered acceptable for the performed studies. Many biomechanical studies measure the motion of biological tissue and incorporate these data directly into the simulation. Such an approach was not employed here, since error propagation when employing contact and non-linear materials, makes such strategies impractical. This applies especially in biomechanics, where many assumptions have to be made regarding the different material parameters. It was observed here, that employing the same activation levels with the individualized models led to similar chewing motions, although a considerable amount of calibration is still required as contact occurred between teeth not involved in the mastication process.
The behavior and role of different tissues was studied during the mastication process, which revealed that many assumptions required revisions. For instance, the stiffness of the temporomandibular ligament and the original attachments of the disc restricted the anterior displacement of the contralateral condyle. On the other hand, the stiffness of the articular disc itself had almost no effect on the motion of the condyles.
The present work is a first step towards investigating the feasibility of producing individualized models in order to analyze specific patients. Furthermore, it revealed that the behavior of different tissues is decisive for the optimization of dental implants. The current study employs many assumptions of the properties of different tissues as for most materials, it is impossible to acquire them in in-vivo studies. The interaction of these tissues between each other during complex tasks helps us to better understand their complex behavior. For more details, see [1]. However, further significant research and discussion is required to capture the behavior of the masticatory system. In the future, the incorporation of more sophisticated material models for the biological tissues as well as more complex implants would deepen the knowledge in this field.
In the clinical part of the investigation, the electromyographic activity of all twelve main chewing muscles, the kinematics, and the chewing forces of the lower jaw during the comminution of natural test food was recorded synchronously, for the first time.
Sixteen healthy subjects completed the experimental protocol successfully and without complications. The data obtained from an asymptomatic test subject and its recorded MRI images were used to validate the FE model. Thus, the occlusal micromovements between antagonistic molars during chewing could be simulated realistically. Furthermore, the results better understood the cocontraction patterns of all major masticatory muscles during the chewing cycle.
In the numerical modelling part of the cooperative project, several numerical studies were performed using a FE model of the masticatory system in order to obtain knowledge that would improve the planning of dental prostheses. As a primary goal, first a simple model, and in the following a model with a more sophisticated bolus were developed. In the latter case, the bolus could undergo large deformations and fracture, in order to allow the antagonistic teeth to come into near occlusion. Additionally, the activation levels of the muscles, experimentally measured in the clinical part of the project, were processed and calibrated to produce the complicated chewing motion of the human mandible in the FE model.
The model was furthermore modified to match the different geometries of individual patients with a simplified approach by adjusting the mesh of the FE model to match the geometries of the different patients. The same activation levels used to produce the chewing motion were employed with the modified models. Finally, a parametric study was carried out for different material components of the masticatory system, to study their role and influence on the behavior of the masticatory system.
The specific findings of this project are summarized as follows:
• The main result of our FE investigations is that, in contrast with many opinions found in the literature, axial loading of the molar teeth can be observed only at the very beginning of the power stroke and not during the path into short-range intercuspation. This finding is in agreement with previous clinical-experimental data reported.
• Despite the direct employment of EMG activation levels resulting in fairly accurate results for static biting forces, the measured EMG levels during mastication required a considerable amount of calibration before the results were considered satisfactory. This corroborates the difficulty to interpret the EMG levels of the muscles during movement.
• During mastication with the improved bolus material, the contralateral joint overtakes a much larger load than the ipsilateral joint. Forces on the ipsilateral joint increase very slowly as the biting force raises.
• The employment of activation levels to produce a specific biting force on models with a modified geometry, results in almost identical reaction forces on the joints. Although the motions of the jaw of the different modified models are similar for the same activation levels of the muscles, the variations in motion result from interference of teeth that are not involved in the mastication process.
• The creation of custom-made models for patients remains very challenging, as significant calibration remains necessary. However, once a model has been properly set up, modifications can readily be incorporated (e.g., implants) to determine their impact on the overall behavior of the system.
• Variation of material parameters of the soft tissues such as the articular disc and the periodontium, has minimal effect on the displacements and resulting forces. However, as the tissues become more incompressible, the stresses are reduced as the forces are more evenly distributed.
• The border movements of the jaw are constrained by the attachments of the disc, the ligaments and the passive response of the muscles. The parameters shown in the literature for these tissues were found to be too stiff to allow for the movements observed during in vivo measurements.
• The current model allows first to optimize the investigation of existing treatments and second on its basis an analysis of the proof-of-efficacy of a new treatment. Particularly interesting is the use of the FE model in the current search of criteria for an optimal design of dental implant crowns, as the minimal movements of the teeth in the close-up range with respect to the jaws can be determined which is crucial for the design.
• The minimal displacements of the posterior teeth and both condyles at the end of the power stroke support the sufficiency of kinematic recordings of the mandible for prosthetic reconstructions, as no essential micro-deformation of the involved structures occur at this movement phase. In addition, the cusps and fossae of intercuspation support the guidance of the mandible into the nearest approximation of the teeth without excessive use of neuromuscular coordinative performance.
Acknowledgement: The authors thank particularly Professors Loc Vu-Quoc and Shaofan Li for the opportunity to contribute to this special issue within CMES honoring Professor Karl S. Pister.
Funding statement: We acknowledge the support of the German Research Foundation Grant Nos. SCHM 2456/5-1 and SCHW 307/30-1, together with funding for the project initial phase from the German Federal Ministry for Economy and Technology Grant No. KF 2875101WM. (Bundesministerium für Wirtschaft und Technologie) according to a decision of the German Bundestag.
Conflicts of Interest: The authors declare that they have no conflicts of interest to report regarding the present study.
1. Martinez Choy, S. E. (2018). A comprehensive finite element model of the human masticatory system. (DoctoralDissertation). Institut für Mechanik, Fakultät für Bauingenieur-, Geo-und Umweltwissenschaften (BGUKarlsruhe Institute of Technology. DOI 10.5445/IR/1000084245. [Google Scholar] [CrossRef]
2. Martinez Choy, S. E., Lenz, J., Schweizerhof, K., Schmitter, M., Schindler, H. J. (2017). Realistic kinetic loading of the jaw system during single chewing cycles. Journal of Oral Rehabilitation, 44(5), 375–384. DOI 10.1111/joor.12501. [Google Scholar] [CrossRef]
3. Martinez Choy, S. E., Lenz, J., Schweizerhof, K., Schindler, H. J. (2018). Effects of introducing gap constraints in the masticatory system: A finite element study. Proceedings of the 5th International Conference on Biodental Engineering, Porto, Portugal. CRC Press. DOI 10.1201/9780429265297. [Google Scholar] [CrossRef]
4. ACqKnowledge 3.9 Software Guide (2007). BIOPAC Systems, Inc., Santa Barbara, California, USA. [Google Scholar]
5. Williams, S. H., Wright, B. W., Truong, V., Daubert, C. R., Vinyard, C. J. (2005). Mechanical properties of foods used in experimental studies of primate masticatory function. American Journal of Primatology, 67(3), 329–346. DOI 10.1002/ajp.20189. [Google Scholar] [CrossRef]
6. Bhatka, R., Throckmorton, G. S., Wintergerst, A. M., Hutchins, B., Buschang, P. H. (2004). Bolus size and unilateral chewing cycle kinematics. Archives of Oral Biology, 49, 559–566. DOI 10.1016/j.archoralbio.2004.01.014. [Google Scholar] [CrossRef]
7. Schindler, H. J., Rues, S., Türp, J., Schweizerhof, K., Lenz, J. (2007). Jaw clenching: Muscle and joint forces, optimization strategies. Journal of Dental Research, 86(9), 843–847. DOI 10.1177/154405910708600907. [Google Scholar] [CrossRef]
8. Koolstra, J., van Eijden, T. (2005). Combined finite-element and rigid-body analysis of human jaw joint dynamics. Journal of Biomechanics, 38(12), 2431–2439. DOI 10.1016/j.jbiomech.2004.10.014. [Google Scholar] [CrossRef]
9. Koolstra, J., van Eijden, T. (2007). Consequences of viscoelastic behavior in the human temporomandibular joint disc. Journal of Dental Research, 86(12), 1198–1202. DOI 10.1177/154405910708601211. [Google Scholar] [CrossRef]
10. Koolstra, J., van Eijden, T. (1997). Dynamics of the human masticatory muscles during a jaw open-close movement. Journal of Biomechanics, 30(9), 883–889. DOI 10.1016/S0021-9290(97)00047-X. [Google Scholar] [CrossRef]
11. Pérez del Palomar, A., Doblaré M. (2007). An accurate simulation model of anteriorly displaced TMJ discs with and without reduction. Medical Engineering & Physics, 29(2), 216–226. DOI 10.1016/j.medengphy.2006.02.009. [Google Scholar] [CrossRef]
12. Pérez del Palomar, A., Doblaré M. (2006). Finite element analysis of the temporomandibular joint during lateral excursions of the mandible. Journal of Biomechanics, 39(12), 2153–2163. DOI 10.1016/j.jbiomech.2005.06.020. [Google Scholar] [CrossRef]
13. Osborn, J. (1989). The temporomandibular ligament and the articular eminence as constraints during jaw opening. Journal of Oral Rehabilitation, 16(4), 323–333. DOI 10.1111/j.1365-2842.1989.tb01348.x. [Google Scholar] [CrossRef]
14. O'Mahony, A. M., Williams, J. L., Katz, J. O., Spencer, P. (2000). Anisotropic elastic properties of cancellous bone from a human edentulous mandible. Clinical Oral Implants Research, 11(6), 415–421. DOI 10.1034/j.1600-0501.2000.011005415.x. [Google Scholar] [CrossRef]
15. Tanaka, E., Rodrigo, D., Tanaka, M., Kawaguchi, A., Shibazaki, T. et al. (2001). Stress analysis in the TMJ during jaw opening by use of a three-dimensional finite element model based on magnetic resonance images. International Journal of Oral and Maxillofacial Surgery, 30(5), 421–430. DOI 10.1054/ijom.2001.0132. [Google Scholar] [CrossRef]
16. Fill, T., Toogood, R., Major, P., Carey, J. (2012). Analytically determined mechanical properties of, and models for the periodontal ligament: Critical review of literature. Journal of Biomechanics, 45(5), 9–16. DOI 10.1016/j.jbiomech.2011.09.020. [Google Scholar] [CrossRef]
17. Natali, A., Pavan, P., Scarpa, C. (2004). Numerical analysis of tooth mobility: Formulation of a non-linear constitutive law for the periodontal ligament. Dental Materials, 20(7), 623–629. DOI 10.1016/j.dental.2003.08.003. [Google Scholar] [CrossRef]
18. Limbert, G., Middleton, J., Laizans, J., Dobelis, M., Knets, I. (2003). A transversely isotropic hyperelastic constitutive model of the PDL. Analytical and computational aspects. Computer Methods in Biomechanics and Biomedical Engineering, 6(5–6), 337–345. DOI 10.1080/10255840310001637572. [Google Scholar] [CrossRef]
19. Pietrzak, G., Curnier, A., Botsis, J., Scherrer, S., Wiskott, A. et al. (2002). A nonlinear elastic model of the periodontal ligament and its numerical calibration for the study of tooth mobility. Computer Methods in Biomechanics and Biomedical Engineering, 5(2), 91–100. DOI 10.1080/10255840290032117. [Google Scholar] [CrossRef]
20. Mimics Innovation Suite 14.12, Reference Guide (2011). Materialise NV, Leuven, Belgium. [Google Scholar]
21. Geomagic Studio 12, Reference Guide (2010). 3D Systems Inc., Rock Hill, South Carolina, USA. [Google Scholar]
22. Hyperworks 12, Reference Guide (2013). Altair Engineering, Inc., Troy, Michigan, USA. [Google Scholar]
23. LS-DYNA 6.1 Manual (2011). Livermore Software Technology Corporation, Livermore, California, USA. [Google Scholar]
24. Rues, S., Lenz, J., Türp, J., Schweizerhof, K., Schindler, H. J. (2011). Muscle and joint forces under variable equilibrium states of the mandible. Clinical Oral Investigations, 15(5), 737–747. DOI 10.1007/s00784-010-0436-4. [Google Scholar] [CrossRef]
25. Schindler, H. J., Lenz, J., Türp, J., Schweizerhof, K., Rues, S. (2009). Small unilateral jaw gap variations: Equilibrium changes, co-contractions and joint forces. Journal of Oral Rehabilitation, 36(10), 710–718. DOI 10.1111/j.1365-2842.2009.01985.x. [Google Scholar] [CrossRef]
26. Tanaka, E., Hanaoka, K., Tanaka, M., van Eijden, T., Iwabe, T. et al. (2003). Viscoelastic properties of bovine retrodiscal tissue under tensile stress-relaxation. European Journal of Oral Sciences, 111(6), 518–522. DOI 10.1111/j.0909-8836.2003.00081.x. [Google Scholar] [CrossRef]
27. Lettry, S., Seedhom, B., Berry, E., Cuppone, M. (2003). Quality assessment of the cortical bone of the human mandible. Bone, 32(1), 35–44. DOI 10.1016/S8756-3282(02)00921-3. [Google Scholar] [CrossRef]
28. Biewener, A. A., Wakeling, J. M., Lee, S. S., Arnold, A. S. (2014). Validation of hill-type muscle models in relation to neuromuscular recruitment and force-velocity properties: Predicting patterns of in vivo muscle force. Integrative and Comparative Biology, 54(6), 1072–1083. DOI 10.1093/icb/icu070. [Google Scholar] [CrossRef]
29. van Ruijven, L., Weijs, W. (1990). A new model for calculating muscle forces from electromyograms. European Journal of Applied Physiology, 61(5–6), 479–485. DOI 10.1007/BF00236071. [Google Scholar] [CrossRef]
30. van Eijden, T., Korfage, J., Brugman, P.(1997). Architecture of the human jaw-closing and jaw-opening muscles. The Anatomical Record, 248(3), 464–474. DOI 10.1002/(SICI)1097-0185(199707)248:3<464::AID-AR20>3.0.CO;2-M. [Google Scholar] [CrossRef]
31. Weijs, W., Hillen, B. (1985). Physiological cross-section of the human jaw muscles. Acta Anatomica, 121, 31–35. DOI 10.1159/000145938. [Google Scholar] [CrossRef]
32. Feneis, H. (1952). Anatomy and physiology of the normal gingiva. Deutsche Zahnärztliche Zeitschrift, 7(8), 467–476. [Google Scholar]
33. Keilig, L., Drolshagen, M., Tran, K. L., Hasan, I., Reimann, S. et al. (2016). In vivo measurements and numerical analysis of the biomechanical characteristics of the human periodontal ligament. Annals of Anatomy, 206, 80–88. DOI 10.1016/j.aanat.2015.08.004. [Google Scholar] [CrossRef]
34. Kristiansen, A. B., Heyeraas, K. J. (1989). Micropuncture measurements of interstitial fluid pressure in the rat periodontal ligament. Proceedings of the Finnish Dental Society, 85(4–5), 295–300. [Google Scholar]
35. Yoshida, N., Jost-Brinkmann, P. G., Yamada, Y. (1995). Initial tooth movement under extraoral force and considerations for controlled molar movement. The Angle Orthodontist, 65(3), 199–208. DOI 10.1043/0003-3219(1995)065<0199:ITMUEF>2.0.CO;2. [Google Scholar] [CrossRef]
36. Su, M. Z., Chang, H. H., Chiang, Y. C., Cheng, J. H., Fuh, L. J. et al. (2013). Modeling viscoelastic behavior of periodontal ligament with nonlinear finite element analysis. Journal of Dental Sciences, 8(2), 121–128. DOI 10.1016/j.jds.2013.01.001. [Google Scholar] [CrossRef]
37. Roberts, T. J., Gabaldon, A. M. (2008). Interpreting muscle function from EMG: Lessons learned from direct measurements of muscle force. Integrative and Comparative Biology, 48(2), 312–320. DOI 10.1093/icb/icn056. [Google Scholar] [CrossRef]
38. Schindler, H. J. (2017). Experimental data on muscle EMG and jaw motion. Karlsruhe (Unpublished data). [Google Scholar]
39. Autodesk Inventor 2017, Reference Guide (2017). Autodesk, Inc., San Rafael, California, USA. [Google Scholar]
 | This work is licensed under a Creative Commons Attribution 4.0 International License, which permits unrestricted use, distribution, and reproduction in any medium, provided the original work is properly cited. |