| Computer Modeling in Engineering & Sciences |
DOI: 10.32604/cmes.2021.017332
ARTICLE
MIA-UNet: Multi-Scale Iterative Aggregation U-Network for Retinal Vessel Segmentation
Network and Data Security Key Laboratory of Sichuan Province, University of Electronic Science and Technology of China, Chengdu, 610054, China
*Corresponding Author: Zhen Qin. Email: qinzhen@uestc.edu.cn
Received: 02 May 2021; Accepted: 23 June 2021
Abstract: As an important part of the new generation of information technology, the Internet of Things (IoT) has been widely concerned and regarded as an enabling technology of the next generation of health care system. The fundus photography equipment is connected to the cloud platform through the IoT, so as to realize the real-time uploading of fundus images and the rapid issuance of diagnostic suggestions by artificial intelligence. At the same time, important security and privacy issues have emerged. The data uploaded to the cloud platform involves more personal attributes, health status and medical application data of patients. Once leaked, abused or improperly disclosed, personal information security will be violated. Therefore, it is important to address the security and privacy issues of massive medical and healthcare equipment connecting to the infrastructure of IoT healthcare and health systems. To meet this challenge, we propose MIA-UNet, a multi-scale iterative aggregation U-network, which aims to achieve accurate and efficient retinal vessel segmentation for ophthalmic auxiliary diagnosis while ensuring that the network has low computational complexity to adapt to mobile terminals. In this way, users do not need to upload the data to the cloud platform, and can analyze and process the fundus images on their own mobile terminals, thus eliminating the leakage of personal information. Specifically, the interconnection between encoder and decoder, as well as the internal connection between decoder sub-networks in classic U-Net are redefined and redesigned. Furthermore, we propose a hybrid loss function to smooth the gradient and deal with the imbalance between foreground and background. Compared with the U-Net, the segmentation performance of the proposed network is significantly improved on the premise that the number of parameters is only increased by 2%. When applied to three publicly available datasets: DRIVE, STARE and CHASE_DB1, the proposed network achieves the accuracy/F1-score of 96.33%/84.34%, 97.12%/83.17% and 97.06%/84.10%, respectively. The experimental results show that the MIA-UNet is superior to the state-of-the-art methods.
Keywords: Retinal vessel segmentation; security and privacy; redesigned skip connection; feature maps aggregation; hybrid loss function
Blood vessels in the human body are usually not directly observed. However, the transparency of cornea, lens and vitreous in ocular structure makes it possible to observe microvascular circulation directly and noninvasively from the fundus. Ophthalmologists can detect the presence of lesions in the optic nerve, retina, choroid and refractive media through fundus images. In addition, fundus images also provide basis for early diagnosis and judgment of other systemic diseases, such as diabetic retinopathy (DR) [1], hypertensive retinopathy (HR) [2], retinopathy of prematurity (ROP) [3], glaucoma [4] and so on. In this way, the analysis and research of fundus image becomes essential. In the past, fundus images were captured by professional fundus cameras, which were not only expensive, but also required professional ophthalmologists to operate. Fortunately, with the rapid development of science and technology, the camera performance of smart phones has gradually improved. Now we can easily get the fundus image by adding a special lens to the smartphone. If a lightweight network can be designed to run on the mobile terminal to analyze and process the fundus image, then users do not need to upload the data to the cloud platform, thus eliminating the leakage of personal information.
The existing researches on fundus images can be roughly divided into segmentation-based research and detection-based research. The former mainly focuses on the segmentation of landmarks in fundus images, such as optic disc [5,6], macula [7], retinal blood vessels, etc. In contrast, the detection-based research pays more attention to ophthalmic diseases and systemic diseases that can lead to retinopathy, specifically, the detection of lesions in fundus images, such as edema [8], hemorrhage [9], soft and hard exudation [10], neovascularization [11], etc. Fig. 1 clearly and intuitively shows the landmarks in the normal fundus image (left) and the common types of lesions in the diabetic retinopathy fundus image (right). It is not difficult to see from the figure that the optic disc, macula and related lesions are scattered in the fundus image, while the distribution of retinal blood vessels extends outward in a large area with a tree structure and fills the whole fundus image, which is closely related to most of the lesions. If the rapid and accurate segmentation of retinal blood vessels can be realized, it will provide important basis and support for the location of the lesion area and the judgment of the severity of the disease, which is of great significance for ophthalmic diagnosis and auxiliary diagnosis of other systemic diseases.

Figure 1: Landmarks in normal fundus image (left) and lesion areas in pathological fundus Image (right)
The existing research methods for retinal vessel segmentation can be roughly divided into traditional machine learning methods and deep learning methods. Considering that segmentation results need higher accuracy and faster feedback time when used in ophthalmic auxiliary diagnosis, the deep learning method is adopted for research. As we all know, the performance of U-Net [12] in the field of medical image segmentation is particularly prominent, because of its unique U-shaped network structure and skip connection, which combines the shallow semantic features and deep semantic features of the image for segmentation. It is worth noting that the network does not start the up-sampling operation until all down-sampling has been performed, which leads to the incomprehensibility of the network in capturing different levels of features. To solve this problem while considering the privacy security issues, we propose the MIA-UNet, a multi-scale iterative aggregation U-network, which aims to achieve accurate and efficient retinal vessel segmentation for ophthalmic auxiliary diagnosis while ensuring that the network has low computational complexity to adapt to mobile terminals. The contributions of this paper are as follows:
• Proposed MIA-UNet model: A novel MIA-UNet model is proposed, which aims to achieve accurate and efficient retinal vessel segmentation for ophthalmic auxiliary diagnosis while ensuring that the network has low computational complexity to adapt to mobile terminals. Fundus image acquisition and processing analysis are completed on the mobile terminal, which largely prevents the leakage of personal privacy. Compared with the U-Net, the segmentation performance of the proposed network is significantly improved on the premise that the number of parameters is only increased by 2%. The effectiveness of the proposed model is verified on three public datasets. The experimental results show that the proposed network is superior to the state-of-the-art models.
• Redesigned interconnection between the encoder and decoder: In the encoding phase, the MIA-UNet proposed in this paper performs an up-sampling operation immediately after each down-sampling operation. The feature maps are transmitted to the same-scale decoder sub-network through the newly added dense connections. The above make more feature maps with different semantic scales aggregate and greatly improves the segmentation performance.
• Redesigned internal connections between decoder sub-networks: In the decoding stage, each decoder layer receives not only the same-scale feature maps from the encoder, but also the larger-scale feature maps from other decoder layers. The combination of the internal connection between encoder sub-networks and the redesigned skip connection between encoder and decoder sub-networks makes it possible for full-scale semantic features to be aggregated.
• Hybrid segmentation loss function: We define a hybrid segmentation loss function composed of the pixel-wise binary cross entropy (BCE) loss and dice-coefficient loss to smooth the gradient and deal with the imbalance between foreground and background.
The remaining portion of this paper is arranged as follows: In Section 2, we introduce the research status of retinal vessels segmentation. The details of the proposed model are described in Section 3, and the evaluation findings are reported in Section 4. In Section 5, we discuss the computational complexity and limitations of the model. Finally, we summarize this paper in Section 6.
Retinal blood vessels, as the only blood vessels that can be directly and noninvasively observed in human body, can reflect the changes of blood vessels in the whole body to a certain extent. Therefore, the segmentation of retinal vessels has always been a hot topic. In recent years, the research on retinal vessels segmentation by researchers at home and abroad can be roughly divided into two categories: traditional machine learning and deep learning.
2.1 Traditional Machine Learning Methods
The traditional machine learning method is friendly to small data sets and has low computational time and space complexity, so it does not need high hardware configuration. Wang et al. [13] introduced a novel unsupervised learning method to automatically extract retinal vessels. In this method, the revised top-bottom-hat transformation is used to remove the bright lesions in the fundus image, and a novel feature, called flattening of minimum circumscribed ellipse, is used to identify retinal vessels. Due to the continuity and extendibility of retinal vessels, Fan et al. [14] used the region feature of blood vessels to automatically generate the trimap and applied it to the hierarchical image matting model to segment retinal vessels. In order to preserve the edge and corner details of blood vessels and accurately segment the microvessels, Karn et al. [15] proposed a hybrid active contour model, which combines gradient vector flow (GVF)-based snake and balloon method, and used a new preprocessing technology to segment retinal vessels in fundus images. Gamarra [16] proposed a method to segment retinal vessels from color fundus images and locate the fovea zone of the vessels simultaneously, which greatly reduces the computational time. To solve the problem of low contrast between the pale vessel pixels and the surrounding pixels, Yue et al. [17] improved a multi-scale linear detector, which calculates the linear response of blood vessels in multi-scale windows, and uses the maximum value as the response value to enhance the pale vessel pixels.
In contrast, deep learning is more suitable for large data sets, and more data means higher accuracy. Unlike traditional machine learning, deep learning does not require complex feature engineering. At the same time, transfer learning also makes deep learning technology have the characteristics of strong adaptability and easy conversion, which can be more easily adapted to different fields and applications.
To improve the accuracy of retinal vessels segmentation, Tang et al. [18] used adaptive histogram equalization, hessian matrix filter and Gaussian matching filter to enhance the green channel in fundus image, and then used BP neural network to segment retinal vessels. Liskowski et al. [19] introduced a supervised segmentation technique, which applied convolutional neural network (CNN) to the segmentation of retinal vessels. In this study, the fundus image is processed into multiple patches, and then input into the network for training after global contrast normalization, zero-phase whitening, and data augmentation. Budak et al. [20] found that when there are direct connections between the input layer and the output layer of the convolutional neural network, the training of the network will be more accurate and effective. Therefore, they put forward a new CNN model called densely connected and concatenated multi encoder-decoder (DCCMED) network, to extract retinal vessels from fundus images. At the same time, a patch-based data augmentation strategy is proposed to train the model to improve the generalization ability of the network. In the study of Dasgupta et al. [21], the task of retinal vessel segmentation is formulated as a multi-label inference task. Due to the implicit advantage of combining convolutional neural network and structural prediction, a retinal vessel segmentation model based on full convolutional networks (FCNs) is proposed. Sathananthavathi et al. [22] improved the network performance by implementing different levels of image preprocessing, and proposed a parallel full convolution network architecture for retinal vessel segmentation. Fully convolution neural network involves a large number of tunable hyper-parameters, and the structure of decoder also increases the end-to-end training time. To solve this problem, Khan et al. [23] proposed a residual connection based encoder decoder network (RCED-Net) to segment retinal vessels, which is an extension of a variant of the FCNs. The proposed network uses a skip-connections strategy, which shares the indices obtained from the max-pooling to the decoder to improve the resolution of the feature map. This operation makes it possible to reduce the hyper-parameters in the network, at the same time, it also greatly reduces the computational cost of training and testing phase. Son et al. [24] used generative adversarial network (GAN) framework to achieve accurate segmentation of retinal vessels and optic disc. The existing deep learning methods usually use a unified loss function to segment retinal vessels. Due to the difference in spatial characteristics between thick and thin vessels, the unified loss function is only applicable to thick vessels. In addressing this challenge, Rammy et al. [25] invented a conditional patch-based generative adversarial network (CPGAN) technique, in which an additional loss function was introduced to allow the generator network to iteratively learn the thick and thin vessels in the fundus image, while the discriminator network was used to obtain a combined objective function in segmentation. In the study of Yan et al. [26], a joint-loss framework based on U-Net is proposed and applied to the segmentation of retinal vessels. In the training phase, the segment-level loss and pixel-wise loss are used as two branches to balance the thickness inconsistency between thick and thin vessels, while in the test phase, the probability maps generated by the two branches are integrated for subsequent segmentation.
In this paper, the public datasets of fundus image commonly used in the research of retinal vessel segmentation are described in detail as follows:
Digital Retinal Images for Vessel Extraction (DRIVE): the DRIVE database [27] was established by a diabetic retinopathy screening program in the Netherlands, which aims to make comparative studies on retinal vessel segmentation. 40 fundus images were randomly selected from 400 diabetic patients aged 25–90 years, 33 showed no signs of diabetic retinopathy, and 7 showed signs of mild early diabetic retinopathy. Each image was captured using a Canon CR5 non-mydriatic 3CCD camera with a 45 degree field of view (FOV) and a resolution of 565 × 584. The 40 images in the database are divided into a training set and a test set, each containing 20 images. For the training set, a single manual annotation is provided. For the test set, two kinds of manual annotation are available; one is used as gold standard, and the other can be used to compare computer-generated segmentation with manual segmentation by human observers.
Structured Analysis of the Retina (STARE): the STARE was a project conceived and initiated by Michael Goldbaum in 1975. Hoover et al. [28] cited and published the STARE database for the first time in 2000. The images and clinical data in the STARE database were provided by the Shiley Eye Center and Veterans Administration Medical Center at the University of California, San Diego. The entire database contains about 400 images, including those for retinal vessel segmentation, artery/vein classification, and optic nerve detection. In this paper, only 20 fundus images related to retinal vessel segmentation were used, including 10 pathological fundus images and 10 normal fundus images. The image resolution is 605 × 700, and two kinds of manual annotation are provided.
CHASE_DB1: the CHASE_DB1 [29] database contains 28 color fundus images with resolution of 999 × 960, which were collected from the left and right eyes of 14 school-age children.
The samples of the three datasets used in this paper, including healthy samples and pathological samples, are randomly selected and displayed in Fig. 2. The first line is the original fundus image, and the second line is the corresponding manual annotation. The corresponding datasets from left to right are DRIVE dataset, STARE dataset and CHASE_DB1 dataset.

Figure 2: The original fundus image and its corresponding manual annotation. From left to right for each column: #35_Training in DRIVE dataset, #im0139 in STARE dataset and #image_03R in CHASE_DB1 dataset
Although deep neural network performs well when using raw data as input, a large number of studies show that proper preprocessing can effectively improve the performance of the network [19,30]. In the process of fundus image acquisition, affected by the differences of acquisition conditions and imaging sensors, the fundus image has the problems of uneven illumination, noise interference, low contrast between microvessels and background. In addition, the existing fundus image database has the problem of small amount of data. Therefore, data preprocessing is imperative.
Deep learning model needs enough data support to train better. In order to ensure the effective training of the model, data augmentation is indispensable. Data augmentation can make the limited data produce more data, increase the number and diversity of training samples, and improve the robustness of the model. At the same time, changing the training samples randomly can reduce the dependence of the model on some attributes, so as to improve the generalization ability of the model. In this paper, we consider to augment the fundus image data by rotating, flipping, blurring and adding noise. As shown in Fig. 3, an image randomly selected from the STARE database is used to describe the details of the data augmentation process. Among them, (a) is the original image, (b) is the blurred image, (c) is the image after adding noise, (d) and (e) are the image after horizontal and vertical flipping respectively, and (f) to (l) are the images obtained by clockwise rotation in steps of 45 degrees.

Figure 3: Data augmentation example, the original image randomly selected from the STARE database. (a) Original image; (b) blur the image; (c) add noise to the image; (d) flip horizontal (e) flip vertical; (f)–(l) rotate the image clockwise in steps of 45 degrees
In order to effectively solve the problems of uneven illumination, noise interference and low contrast between microvessels and background in fundus images, the following preprocessing operations are implemented: firstly, the green channel in the color fundus image is extracted to obtain high contrast between the blood vessel and the background, and bilateral filtering is used for denoising. Then, the contrast limited adaptive histogram equalization (CLAHE) [31] algorithm is adopted to improve image contrast. Adaptive histogram equalization (AHE) algorithm calculates the local histogram of the image, and then redistributes the brightness to change the image contrast. However, when the pixel values in a region are very similar, the transformation function of histogram will map a very narrow range of pixels to the whole range of pixels, resulting in a small amount of noise in some flat regions being over amplified. CLAHE algorithm can effectively limit this unfavorable amplification. Specifically, the contrast magnification around the specified pixel value is mainly determined by the slope of the transform function. This slope is proportional to the cumulative histogram slope of the domain. Before calculating the cumulative distribution function, CLAHE uses a predefined threshold to cut the histogram to limit the amplification. Finally, the multi-scale top-hat transform (MTHT) [32] is introduced to further enhance image details. The intermediate image results after each preprocessing are clearly shown in Fig. 4. It is not difficult to see that after a series of preprocessing, the contrast between the blood vessels and the background in the fundus image is stronger, and the details of the blood vessels are clearer.

Figure 4: (a) Original image; (b) green channel image of (a); (c) image after CLAHE operation on (b); (d) image after MTHT operation on (c)
3.3 Proposed Network Architecture: MIA-UNet
The evolution from the original U-Net to the proposed MIA-UNet is shown in Fig. 5. In the following, we first explain its evolution motivation, and then describe its technology and implementation details.
3.3.1 Motivation behind the New Architecture
Fig. 5a shows a classic 4-layer U-Net architecture, which is essentially an encoding-decoding process. Encoding is a process of feature abstraction. Shallow features (such as
Although U-Net has excellent performance in the field of medical image segmentation, the network architecture has two limitations. First, the network does not start the up-sampling operation until all the down-sampling is completed, which results in only deep semantic features being effectively extracted. As mentioned in previous papers, the features of different levels have different emphases. The shallow features focus on the contour and color features of the image, while the deep features focus on the abstract features of the image, both of which are very important for improving the performance of segmentation. Therefore, in the design of network, how to effectively extract different levels of semantic features is an urgent problem to be solved. Secondly, the design of skip connection in the network forces the feature mapping fusion between encoder and decoder sub-networks to only appear on the same-scale, but there is no reliable theory to guarantee that such feature mapping fusion is the best match.

Figure 5: (a) Original four layer U-Network architecture; (b) IDA-UNet: the U-Net combined with iterative deep aggregation architecture; (c) MIA-UNet: the IDA-UNet combined with multi-scale fusion mechanism
In order to overcome these two limitations, inspired by the literature [33], we consider introducing an iterative deep aggregation architecture to better extract semantic features at different levels. Specifically, the interconnection between the encoder and decoder sub-networks is redesigned. We define the combination of different layers in the network as aggregation, which starts from the shallowest and smallest scale, and then iteratively merges deeper and larger scales, so that the network can integrate semantic features of different levels iteratively. At the same time, the long skip connection in U-Net architecture is also preserved, which connects a large amount of information of input image and helps to recover the information loss caused by down-sampling. The architecture of this iterative deep aggregation U-Network is shown in the Fig. 5b, which is called IDA-UNet. To make more effective use of features, enhance feature transfer and reduce gradient disappearance, we make the following improvements on the basis of IDA-UNet: introducing dense block [34] and increasing the interconnection between decoder subnetworks. Specifically, the feature mapping between encoder and decoder in the same layer is transmitted through dense connection, and each decoder layer receives not only the same-scale feature maps from the encoder, but also the larger-scale feature maps from other decoder layers. The improved IDA-UNet is called multi-scale iterative aggregation u-network, namely MIA-UNet, and its architecture is shown in the Fig. 5c. The combination of the internal connection between encoder sub-networks and the redesigned interconnection between the encoder and decoder sub-networks makes the fusion of multi-scale semantic features possible. The detailed diagram of MIA-UNet architecture is shown in Fig. 6.

Figure 6: Diagram of MIA-UNet architecture
3.3.2 Redesigned Skip Connection
To extract more semantic features from different levels and realize the effective fusion of shallow features and deep features, we redesigned the interconnection between the encoder and decoder sub-networks and the internal connection between the decoder sub-networks. At the same time, a feature fusion mechanism is further proposed, which consists of multiple 3 × 3 filters, a batch normalization and a ReLU activation function. Let i denotes the down-sampling layer along the encoder and j denotes the convolution layer along the short skip connection. The stack of feature maps represented by
where function
3.3.3 Hybrid Segmentation Loss
The task of blood vessel segmentation in fundus images can be regarded as a binary classification problem. In this paper, we consider introducing a hybrid segmentation loss function for network learning. As we all know, the pixel-wise binary cross entropy loss (BCE) as a common objective function is widely used in this kind of classification scene. Let
BCE loss function can smooth gradient and avoid gradient dispersion. However, it is worth noting that when the number of foreground and background in the image is seriously unbalanced, using this function for network training will usually cause the local minima of the loss function, resulting in a network with strong prediction bias to the background, which eventually makes the detection of foreground area incomplete. The dice-coefficient loss proposed in [35] can deal with the serious imbalance between foreground and background voxels. As shown in Eq. (5), the term
In order to effectively combine the advantages of the two loss functions, smooth the gradient and deal with the imbalance between foreground and background, we define a hybrid segmentation loss function, which is composed of BCE loss and dice-coefficient loss. Mathematically, the hybrid loss is defined as:
This chapter introduces the details of the experiment implementation, evaluation metrics and experimental results.
Our experiments are implemented in Keras with Tensorflow backend, and the hardware facilities of an Intel Core i7-7700k CPU and two NVDIA GTX1080TI GPU graphics cards are configured. In the training process, the Adam optimizer is adopted to update the weights of neural network iteratively, in which the initial learning rate is 1e-4 and the weight decay is set to 0.001. At the same time, the initialization method introduced in the literature [36] is also used in this experiment to avoid the output loss gradient of the layer activation function disappearing or exploding during the forward propagation of the deep neural network. In addition, batch normalization and dropout are used to reduce gradient vanishing and overfitting, respectively. Tab. 1 summarizes three fundus image databases used in this experiment: DRIVE, STARE and CHASE_DB1. All data sets are divided into training set and test set. The training set is used to train parameters and fit the model, while the test set is used to evaluate the performance of the model. For DRIVE database, the original fundus images have been divided into training set and test set. For STARE and CHASE_DB1 databases, the leave-one-out cross-validation is adopted: the M fundus images in the data set are randomly divided into training set and test set, of which M-1 is used for training and the remaining one is used for testing. The above steps are repeated M times.

It is worth mentioning that in order to further weaken the problem of small amount of data, this experiment carried out a clipping operation. Both training and testing are done based on 96 × 96 patches, which are chosen to overlap by half of the patch size via sliding windows. The images of the three datasets are also resized as needed. Tab. 2 clearly shows the validation scheme of the three datasets, image resizing and the number of patches input into the network. The preprocessed patches are shown in Fig. 7b, and Fig. 7c shows the corresponding manual annotation.


Figure 7: Examples of patches and corresponding manual annotations. (a) Original image patches; (b) Preprocessed image patches; (c) Corresponding manual annotations
The segmentation task of retinal vessels in fundus images can be regarded as a binary classification problem, in which two class labels are vessel and non-vessel. In order to compare the segmentation results with the ground truth more reasonably, the following four measures are introduced: the vessel pixels classified as vessels are defined as true positive (TP); the vessel pixels classified as non-vessels are defined as false negative (FN); the non-vessel pixels classified as non-vessels are defined as true negative (TN); and the non-vessel pixels classified as vessels are defined as false positive (FP). Based on evaluation using three publicly available datasets, the performance of the proposed network is compared with the state of the art methods, in terms of accuracy (Acc), specificity (Spec), sensitivity (Sens) and F1-score. In addition, the area under the receiver operating characteristic (ROC) curve (AUC) plotted with Sens as ordinate and (1-Spec) as abscissa is also applied in the performance evaluation of the network. The evaluation metrics are defined as follows:
At the same time, the dice similarity coefficient (DSC) and the Jaccard similarity coefficient (JSC) are used to further compare the performance of different network versions. In order to prove the statistical significance of the proposed network, the p-value of paired samples T test is also used to evaluate the network. The mathematical expressions of relevant evaluation metrics are as follows:
4.3 Comparison with State-of-the-Art
Fig. 8 shows the segmentation results of different networks more intuitively. As shown in the figure, from left to right are the original image, ground truth, segmentation results of U-Net, IDA-UNet and MIA-UNet. The first two rows are from the DRIVE dataset, the middle two rows are from the STARE dataset, and the last two rows are from the CHASE_DB1 dataset. The detailed comparison of segmentation results is shown in Fig. 9. It is obvious from the figure that in the three networks, the segmentation result of MIA-UNet is closer to the ground truth. Compared with the U-Net, the proposed MIA-UNet has better performance in the segmentation of microvessels at the ends of vascular branches, while compared with IDA-UNet, the MIA-UNet has less possibility to classify non-vessels into vessels.
Figs. 10–12 compared the segmentation performance of U-Net, IDA-UNet and MIA-UNet on three public datasets in terms of accuracy, specificity, sensitivity, F1-score and the area under the ROC curve. The emphasis font in the table identifies the best result for this column of data. It can be clearly observed from the table that the MIA-UNet proposed in this paper achieves the best performance among all the evaluation metrics when applied to the DRIVE dataset, especially the sensitivity and F1-score are significantly improved, from 75.31% and 80.21% to 81.68% and 84.34%, respectively. The IDA-UNet formed by the combination of U-Net and iterative deep aggregation structure has poor performance in the sensitivity of STARE and CHASE_DB1 datasets. Fortunately, the MIA-UNet formed by adding decoder internal interconnection and dense modules has improved the sensitivity from 81.06% and 80.64% to 82.32% and 82.78%, respectively. This also shows the effectiveness of multi-scale feature fusion in improving image segmentation performance. It is worth mentioning that when the MIA-UNet is applied to CHASE_DB1 dataset, the improvement in accuracy and F1-score is also obvious, from 95.78% and 77.39% to 97.06% and 84.10%, respectively.
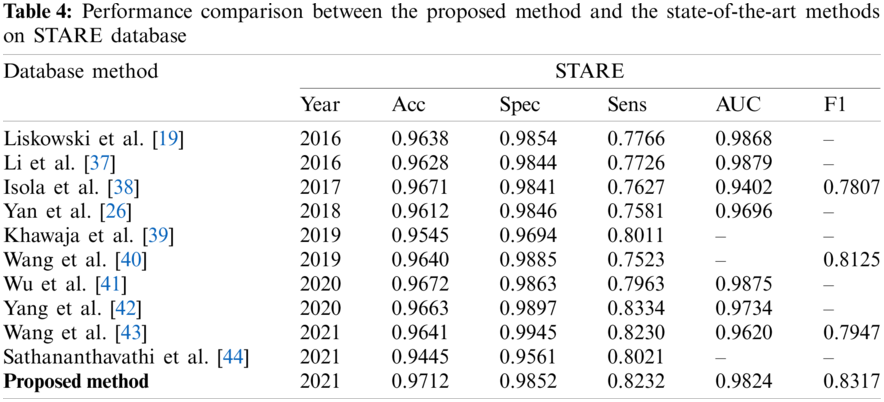
We further compared the proposed MIA-UNet with the state-of-the-art methods. As shown in Tabs. 3–5, the retinal vessel segmentation methods in recent five years are selected for systematic comparison with the network proposed in this paper, in which single underline marks the best performance in this column, and double underline marks the second best. It can be observed that when applied to three publicly available, datasets: DRIVE, STARE and CHASE_DB1, the proposed network achieves the accuracy/F1-score of 96.33%/84.34%, 97.12%/83.17% and 97.06%/84.10%, respectively. The experimental results show that the MIA-UNet is superior to the state-of-the-art methods in some of the metrics.

Figure 8: Segmentation results of different networks

Figure 9: Detail comparison of segmentation results

Figure 10: Performance comparison of different networks on drive dataset

Figure 11: Performance comparison of different networks on STARE dataset

Figure 12: Performance comparison of different networks on CHASE_DB1 dataset


This work proposes a multi-scale iterative aggregation u-network, which is evolved from the classic U-Net. It aims to aggregate as many features on different semantic scales as possible to achieve accurate and effective retinal vessel segmentation. Some studies [34] have shown that increasing the complexity of the network will usually enhance the characterization ability and obtain better performance. However, in many clinical environments, there are usually not enough computing resources to deploy and run models with high complexity. Based on the above reasons, we estimate and compare the parameters of different versions of networks. Among the three network versions (U-Net, IDA-UNet and MIA-UNet) involved in this work, the layer with parameters mainly includes convolution layer, transpose convolution layer and BN layer, while the activation function layer (ReLU, etc.), maximum pooling layer and bilinear interpolation up-sampling layer have no parameters, they only provide a linear or nonlinear transformation. The calculation formula of parameters for different layers is as follows:
where K is the convolution kernel size,
As shown in Fig. 6, each row in the network architecture is regarded as a stage for parameter calculation, and the parameters of each stage of the three networks are shown in Tab. 6. It is not difficult to observe from the table that the biggest difference between the parameters of classic U-Net and improved networks (IDA-UNet and MIA-UNet) comes from the redesigned interconnection between the encoder and decoder and the way of up-sampling. Although the former increases the number of convolution layers, compared with the transposed convolution up-sampling in U-Net, the bilinear interpolation up-sampling in MIA-UNet greatly reduces the network parameters, and finally makes the network parameters only increase from 7.7 M to 7.9 M without significant increase.
We further compared the network performance of U-Net, IDA-UNet and MIA-UNet on three public datasets in terms of DSC and JSC. To prove the statistical significance of the proposed network, the p-value of paired sample t-test based on F1-score is also used for network evaluation. As shown in Tab. 7, our proposed network achieves better performance, with the highest score of DSC/JSC (DRIVE:84.34%/72.92%, CHASE_DB1:84.10%/72.56%), while the number of parameters does not increase significantly, which indicates that the improvement of the MIA-UNet performance is not based on sacrificing the complexity of the network, but by proposing a novel and effective technology to extract more scale semantic information and generate more representative features.


The MIA-UNet proposed in this paper is evolved from the classic U-Net. The interconnection between encoder and decoder is redesigned and the IDA architecture is introduced. The same-scale sub-networks of encoder and decoder are connected by dense modules. Meanwhile, the internal interconnection of decoder subnetworks is redefined. In this way, the shallow features are redefined, and the semantic features of different scales are integrated to segment retinal vessels. We compared the segmentation performance of U-Net, IDA-UNet and MIA-UNet on three public datasets. Experimental results show that, compared with the U-Net, the proposed MIA-UNet has a significant improvement on DRIVE and CHASE_DB1 datasets. The sensitivity and F1-score of the former are improved from 75.31% and 80.21% to 81.68% and 84.34%, respectively, while the accuracy and F1 score of the latter are improved from 95.78% and 77.39% to 97.06% and 84.10%, respectively.
However, it is undeniable that when the MIA-UNet is applied to STARE dataset, the improvement effect is not significant. Although the accuracy and specificity were slightly improved, the sensitivity, F1-score and the area under the ROC curve were decreased. The reason may be that half of the pathological images are included in the STARE dataset. In the retinal vessel segmentation experiment, the location of lesions (such as retinal hemorrhage, soft and hard exudation, etc.) in the pathological images will cause misjudgment (the bleeding points are classified as vessels), which will increase the false positive rate and lead to the degradation of segmentation performance. The proposed MIA-UNet has a significant performance improvement on retinal vessel segmentation of normal fundus images. However, it is worth noting that the segmentation performance of pathological images, especially the vessel segmentation of lesions which are prone to misjudgment, needs to be strengthened.
We have proposed a novel architecture named MIA-UNet for more accurate and effective retinal vessel segmentation in fundus images. The performance improvement of our MIA-UNet is attributed to the redesigned skip connection between encoder and decoder, as well as the internal connection between decoder sub-networks, which aims to address two key challenges of U-Net: 1) the effective extraction of semantic features at different levels; 2) the effective fusion of multi-scale features. At the same time, the fundus image acquisition and processing analysis are completed on the mobile terminal, which largely prevents the leakage of personal privacy. We have evaluated MIA-UNet on three public fundus image databases and demonstrated consistent performance improvements over various state-of-the-art methods.
Our work is of great significance for ophthalmic diagnosis and auxiliary diagnosis of other systemic diseases. In the future work, we will continue to develop this method to achieve better segmentation performance for pathological images without increasing the computational complexity of the network.
Funding Statement: This work was supported in part by the National Natural Science Foundation of China (Nos. 62072074, 62076054, 62027827, 61902054), the Frontier Science and Technology Innovation Projects of National Key R&D Program (No. 2019QY1405), the Sichuan Science and Technology Innovation Platform and Talent Plan (No. 2020JDJQ0020), the Sichuan Science and Technology Support Plan (No. 2020YFSY0010), and the Natural Science Foundation of Guangdong Province (No. 2018A030313354).
Conflicts of Interest: The authors declare that they have no conflicts of interest to report regarding the present study.
1. Colomer, A., Igual, J., Naranjo, V. T. (2020). Detection of early signs of diabetic retinopathy based on textural and morphological information in fundus images. Sensors, 20(4), 1005. DOI 10.3390/s20041005. [Google Scholar] [CrossRef]
2. Kario K., Kanegae H., Oikawa T., Suzuki K. (2019). Hypertension is predicted by both large and small artery disease. Hypertension, 73(1), 75–83. DOI 10.1161/HYPERTENSIONAHA.118.11800. [Google Scholar] [CrossRef]
3. Zhang, Y., Wang, L., Wu, Z., Zeng, J., Chen, Y. et al. (2018). Development of an automated screening system for retinopathy of prematurity using a deep neural network for wide-angle retinal images. IEEE Access, 7, 10232–10241. DOI 10.1109/ACCESS.2018.2881042. [Google Scholar] [CrossRef]
4. Li, L., Xu, M., Liu, H., Li, Y., Wang, N. (2019). A large-scale database and a CNN model for attention-based glaucoma detection. IEEE Transactions on Medical Imaging, 39(2), 413–424. DOI 10.1109/TMI.2019.2927226. [Google Scholar] [CrossRef]
5. Xu, Y. L., Lu, S., Li, H. X., Li, R. R. (2020). Mixed maximum loss design for optic disc and optic cup segmentation with deep learning from imbalanced samples. Sensors, 19(20), 4401. DOI 10.3390/s19204401. [Google Scholar] [CrossRef]
6. Fu, H., Cheng, J., Xu, Y., Wong, D. W. K., Liu, J. et al. (2018). Joint optic disc and cup segmentation based on multi-label deep network and polar transformation. IEEE Transactions on Medical Imaging, 37(7), 1597–1605. DOI 10.1109/TMI.2018.2791488. [Google Scholar] [CrossRef]
7. Alais, R., Dokládal, P., Erginay, A., Figliuzzi, B., Decencière, E. (2020). Fast macula detection and application to retinal image quality assessment. Biomedical Signal Processing and Control, 55(2), 101567. DOI 10.1016/j.bspc.2019.101567. [Google Scholar] [CrossRef]
8. Syed, A. M., Akram, M. U., Akram, T., Muzammal, M., Khalid, S. et al. (2018). Fundus image-based detection and grading of macular edema using robust macula localization. IEEE Access, 6, 58784–58793. DOI 10.1109/ACCESS.2018.2873415. [Google Scholar] [CrossRef]
9. Wang, B., Xiao, L., Liu, Y., Wang, J., Liu, B. et al. (2018). Application of a deep convolutional neural network in the diagnosis of neonatal ocular fundus hemorrhage. Bioscience Reports, 38(6), BSR20180497. DOI 10.1042/BSR20180497. [Google Scholar] [CrossRef]
10. Guo, X., Lu, X., Liu, Q., Che, X. (2019). EMFN: Enhanced multi-feature fusion network for hard exudate detection in fundus images. IEEE Access, 7, 1. DOI 10.1109/ACCESS.2019.2957776. [Google Scholar] [CrossRef]
11. Tang, M. C. S., Teoh, S. S., Ibrahim, H., Embong, Z. (2021). Neovascularization detection and localization in fundus images using deep learning. Sensors, 21(16), 5327. DOI 10.3390/s21165327. [Google Scholar] [CrossRef]
12. Ronneberger, O. (2017). U-Net: Convolutional networks for biomedical image segmentation. Berlin, Heidelberg: Springer Vieweg. [Google Scholar]
13. Wang, W., Wang, W., Hu, Z. (2019). Segmenting retinal vessels with revised top-bottom-hat transformation and flattening of minimum circumscribed ellipse. Medical & Biological Engineering & Computing, 57(7), 1481–1496. DOI 10.1007/s11517-019-01967-2. [Google Scholar] [CrossRef]
14. Fan, Z., Lu, J., Wei, C., Huang, H., Cai, X. et al. (2019). A hierarchical image matting model for blood vessel segmentation in fundus images. IEEE Transactions on Image Processing, 28(5), 2367–2377. DOI 10.1109/TIP.2018.2885495. [Google Scholar] [CrossRef]
15. Karn, P. K., Biswal, B., Samantaray, S. R. (2019). Robust retinal blood vessel segmentation using hybrid active contour model. IET Image Processing, 13(3), 440–450. DOI 10.1049/iet-ipr.2018.5413. [Google Scholar] [CrossRef]
16. Gamarra, M. (2020). Convexity shape constraints for retinal blood vessel segmentation and foveal avascular zone detection. Computers in Biology and Medicine, 127. DOI 10.1016/j.compbiomed.2020.104049. [Google Scholar] [CrossRef]
17. Yue, K., Zou, B., Chen, Z., Liu, Q. (2018). Improved multi-scale line detection method for retinal blood vessel segmentation. IET Image Processing, 12(8), 1450–1457. DOI 10.1049/iet-ipr.2017.1071. [Google Scholar] [CrossRef]
18. Tang, S., Yu, F. (2020). Construction and verification of retinal vessel segmentation algorithm for color fundus image under BP neural network model. The Journal of Supercomputing, 77(1), 1–15. DOI 10.1007/s11227-020-03422-8. [Google Scholar] [CrossRef]
19. Liskowski, P., Krawiec, K. (2016). Segmenting retinal blood vessels with deep neural networks. IEEE Transactions on Medical Imaging, 35(11), 2369–2380. DOI 10.1109/TMI.2016.2546227. [Google Scholar] [CrossRef]
20. Budak, M., Cmert, Z., Ibuk, M., Sengur, A. (2020). DCCMED-Net: Densely connected and concatenated multi encoder-decoder CNNs for retinal vessel extraction from fundus images. Medical Hypotheses, 134, 109426. DOI 10.1016/j.mehy.2019.109426. [Google Scholar] [CrossRef]
21. Dasgupta, A., Singh, S. (2017). A fully convolutional neural network based structured prediction approach towards the retinal vessel segmentation. 2017 IEEE 14th International Symposium on Biomedical Imaging, pp. 248–251. Melbourne, VIC, Australia. [Google Scholar]
22. Sathananthavathi, V., Indumathi, G., Swetha, R. A. (2020). Parallel architecture of fully convolved neural network for retinal bessel segmentation. Journal of Digital Imaging, 33(1), 168–180. DOI 10.1007/s10278-019-00250-y. [Google Scholar] [CrossRef]
23. Khan, T. M., Alhussein, M., Khursheed, K., Arsalan, M., Junaid Nawaz, S. (2020). Residual connection based encoder decoder network (RCED-Net) for retinal vessel segmentation. IEEE Access, 8, 131257–131272. DOI 10.1109/ACCESS.2020.3008899. [Google Scholar] [CrossRef]
24. Son, J., Park, S. J., Jung, K. H. (2019). Towards accurate segmentation of retinal vessels and the optic disc in funduscopic images with generative adversarial networks. Journal of Digital Imaging, 32(3), 499–512. DOI 10.1007/s10278-018-0126-3. [Google Scholar] [CrossRef]
25. Rammy, S. A., Abbas, W., Hassan, N. U., Raza, A., Zhang, W. (2020). CPGAN: Conditional patch-based generative adversarial network for retinal vessel segmentation. IET Image Processing, 14(6), 1081–1090. DOI 10.1049/iet-ipr.2019.1007. [Google Scholar] [CrossRef]
26. Yan, Z., Yang, X., Cheng, K. T. (2018). Joint segment-level and pixel-wise losses for deep learning based retinal vessel segmentation. IEEE Transactions on Biomedical Engineering, 65(9), 1912–1923. DOI 10.1109/TBME.2018.2828137. [Google Scholar] [CrossRef]
27. Staal, J., Abramoff, M., Niemeijer, M., Viergever, M. A., van Ginneken, B. (2004). Ridge-based vessel segmentation in color images of the retina. IEEE Transactions on Medical Imaging, 23(4), 501–509. DOI 10.1109/TMI.2004.825627. [Google Scholar] [CrossRef]
28. Hoover, A., Kouznetsova, V. (2002). Locating blood vessels in retinal images by piecewise threshold probing of a matched filter response. IEEE Transactions on Medical Imaging, 19(3), 203–210. DOI 10.1109/42.845178. [Google Scholar] [CrossRef]
29. Owen, C. G., Rudnicka, A. R., Mullen, R., Barman, S. A., Monekosso, D. et al. (2009). Measuring retinal vessel tortuosity in 10-year-old children: Validation of the computer-assisted image analysis of the retina (CAIAR) program. Investigative Ophthalmology & Visual Science, 50(5), 2004–2010. DOI 10.1167/iovs.08-3018. [Google Scholar] [CrossRef]
30. Atli, B., Gedik, O. S. (2020). Sine-Net: A fully convolutional deep learning architecture for retinal blood vessel segmentation. Engineering Science and Technology an International Journal, 24(2), 271–283. DOI 10.1016/j.jestch.2020.07.008. [Google Scholar] [CrossRef]
31. Pizer, S. M., Johnston, R. E., Ericksen, J. P., Yankaskas, B. C., Muller, K. E. (1990). Contrast-limited adaptive histogram equalization: Speed and effectiveness. Proceedings of the First Conference on Visualization in Biomedical Computing, pp. 337–345. Piscataway, NJ. [Google Scholar]
32. Bai, X., Zhou, F., Xue, B. (2012). Image enhancement using multi scale image features extracted by top-hat transform. Optics & Laser Technology, 44(2), 328–336. DOI 10.1016/j.optlastec.2011.07.009. [Google Scholar] [CrossRef]
33. Yu, F., Wang, D., Shelhamer, E., Darrell, T. (2018). Deep layer aggregation. 2018 IEEE/CVF Conference on Computer Vision and Pattern Recognition, pp. 2403–2412. Piscataway, NJ. [Google Scholar]
34. Huang, G., Liu, Z., Laurens, V., Weinberger, K. Q. (2017). Densely connected convolutional networks. 2017 IEEE Conference on Computer Vision and Pattern Recognition, pp. 2261–2269. Piscataway, NJ. [Google Scholar]
35. Milletari, F., Navab, N., Ahmadi, S. A. (2016). V-Net: Fully convolutional neural networks for volumetric medical image segmentation. Fourth International Conference on 3D Vision, pp. 565–571. Piscataway, NJ. [Google Scholar]
36. He, K., Zhang, X., Ren, S., Sun, J. (2015). Delving deep into rectifiers: surpassing human-level performance on ImageNet classification. IEEE International Conference on Computer Vision, pp. 1026–1034. Piscataway, NJ. [Google Scholar]
37. Li, Q., Feng, B., Xie, L., Liang, P., Zhang, H. et al. (2016). A cross-modality learning approach for vessel segmentation in retinal images. IEEE Transactions on Medical Imaging, 35(1), 109–118. DOI 10.1109/TMI.2015.2457891. [Google Scholar] [CrossRef]
38. Isola, P., Zhu, J. Y., Zhou, T., Efros, A. A. (2017). Image-to-image translation with conditional adversarial networks. IEEE Conference on Computer Vision and Pattern Recognition, pp. 5967–5976. Piscataway, NJ. [Google Scholar]
39. Khawaja, A., Khan, T. M., Khan, M. A. U., Junaid Nawaz, S. (2019). A multi-scale directional line detector for retinal vessel segmentation. Sensors, 19(22), 4949. DOI 10.3390/s19224949. [Google Scholar] [CrossRef]
40. Wang, X., Jiang, X., Ren, J. (2019). Blood vessel segmentation from fundus image by a cascade classification framework. Pattern Recognition, 88(7), 331–341. DOI 10.1016/j.patcog.2018.11.030. [Google Scholar] [CrossRef]
41. Wu, Y., Xia, Y., Song, Y., Zhang, Y., Cai, W. (2020). NFN+: A novel network followed network for retinal vessel segmentation. Neural Networks, 126(3), 153–162. DOI 10.1016/j.neunet.2020.02.018. [Google Scholar] [CrossRef]
42. Yang, T., Wu, T., Li, L., Zhu, C. (2020). SUD-GAN: Deep convolution generative adversarial network combined with short connection and dense block for retinal vessel segmentation. Journal of Digital Imaging, 33(4), 946–957. DOI 10.1007/s10278-020-00339-9. [Google Scholar] [CrossRef]
43. Wang, C., Zhao, Z., Yu, Y. (2021). Fine retinal vessel segmentation by combining nest U-Net and patch-learning. Soft Computing, 25(7), 5519–5532. DOI 10.1007/s00500-020-05552-w. [Google Scholar] [CrossRef]
44. Sathananthavathi, V., Indumathi, G. (2021). Encoder enhanced atrous (EEA) Unet architecture for retinal blood vessel segmentation. Cognitive Systems Research, 67(4), 84–95. DOI 10.1016/j.cogsys.2021.01.003. [Google Scholar] [CrossRef]
 | This work is licensed under a Creative Commons Attribution 4.0 International License, which permits unrestricted use, distribution, and reproduction in any medium, provided the original work is properly cited. |