| Computer Modeling in Engineering & Sciences |
DOI: 10.32604/cmes.2021.016226
ARTICLE
Study on the Whole Process Simulation and Regulation Mechanism of Urban Green Ecological Rainwater Drainage System
School of Water Resources and Electric Power, Xi’an University of Technology, Xi’an, 710048, China
*Corresponding Author: Yuling Liu. Email: liuyuling@xaut.edu.cn
Received: 18 February 2021; Accepted: 19 May 2021
Abstract: In view of the frequent waterlogging caused by rapid urbanization and the public’s dissatisfaction with the drainage system, the article based on the concept of the green ecological drainage system, constructed the urban green ecological drainage comprehensive simulation research system, and quickly evaluated pipe network operation and surface water of an industrial park under typical rainfall conditions. The results showed that the drainage capacity of the designed green ecological rainwater drainage system reached 100%, and there was no ponding phenomenon, which indicated that the green ecological rainwater drainage system could effectively solve the practical problems of urban drainage. The green ecological rainwater comprehensive simulation research system had good adaptability. The research results provided the scientific theoretical basis and reference significance for planning, designing, constructing, operating, and managing urban rainwater system scientifically and systematically.
Keywords: Urban waterlogging; rainwater pipe network; green ecological drainage system; rapid evaluation model; regulation mechanism
In recent years, with the acceleration of urbanization, the impermeable area on the earth’s surface has increased sharply, and the gathering of rainwater has speeded up. Urban waterlogging has become another “high incidence” in cities after traffic congestion and haze [1–3], which not only affects the rapid development of cities and the normal production and life of residents but also brings huge economic losses to cities. The rainwater system is an important infrastructure for collecting, transporting, treating, recycling, and discharging rainwater in cities. It has the dual functions of protecting the environment and reducing urban disasters. With the development of the city, the hardened pavement increases, and the surface runoff becomes larger. In the case of a severe rainstorm, under the condition that the design recurrence period of the pipe network remains unchanged, the collection and discharge of rainwater by the rainwater pipe network cannot effectively guarantee waterlogging prevention in the city. Therefore, it is extremely urgent to accurately assess the operational capacity of the rainwater system and quickly identify bottleneck points, the overload operation of the network, and impounded surface water.
At present, scholars worldwide have carried out researches on concepts of storm flood management and the waterlogging disaster simulation. In terms of management concepts, the US has successively proposed new concepts such as Best Management Practices and Application (BMP) [4], Low Impact Development (LID) [5], and Green Infrastructure (GI) [6]. Australia has proposed Water Sensitive Urban Design (WSUD) [7]. Britain has put forward the Sustainable Drainage system (SUDS) [8]. Based on the advanced foreign concepts, China has proposed the concept of Sponge City [9]. In terms of the flood disaster simulation, the widely used simulation software at present includes SWMM software developed by the US Environmental Protection Agency [10,11], Infoworks ICM software developed by Wallingford of the UK [12,13], and MIKE series software developed by DHI in Denmark [13–15]. Zhang et al. [16] established an analysis model for urban waterlogging disasters based on GIS, which has been widely applied. Bisht et al. [17] built the two-dimensional model of urban waterlogging by using EPA SWMM and MIKE 21 models and propose to reduce the peak rainfall outflowing from the pipe network by setting up multi-purpose flood detention ponds. Zhao et al. [18] combined “Dynamic Simulation Calculation Function of Drainage Pipe Network” with “GIS Spatial Management and Analysis Function” to build Digital Water Simulation (DS), and applied it to urban drainage planning, transformation, and waterlogging risk assessment. However, the analysis of these methods suggested that these methods still had some limitations in the large-scale urban rainstorm early warning system, and were no longer suitable for the actual needs of big cities at this stage.
This exploration focused on urban waterlogging in the process of urban development at this stage. The rainwater system and green ecological system were combined to form a green ecological concept of the urban rainwater system with Chinese characteristics. Besides, an ecological integrated simulation system of urban rainwater was built and applied to an industrial park. The operation of the regional pipe network and impounded surface water before and after the regulation and control were compared to explore the measures and methods of controlling excessive rainfall and reducing the load of the rainwater pipe network.
2 The Green Ecological Concept of Rainwater System
The green ecological rainwater system mainly emphasized the on-site recycling of urban rainwater resources, which integrated the drainage function of traditional rainwater facilities, the rainwater utilization functions of rainwater reuse facilities, the ecological restoration functions of rainwater infiltration facilities, and the disaster reduction functions of urban flood control facilities. Compared with the simple urban rainwater system for rainwater discharge, the green ecological rainwater system focused on the idea of recycling rainwater as a resource according to local conditions. It could comprehensively solve the problems of water resource shortage, water pollution, flood control and drainage, ecological restoration, and groundwater supply. Therefore, the urban green ecological rainwater system was a rainwater management system integrating the concepts of environment, ecology, and sustainable development.
3 Research Method and Model Principle
Equations and mathematical expressions must be inserted into the main text. Two different types of styles can be used for equations and mathematical expressions. They are: in-line style, and display style.
Based on the theory of urban rainfall hydrology and hydraulics, with the support of computer simulation technology and numerical solution, a 1D drainage network model was established for an industrial park in semi-humid and semi-arid areas of China, and the real-time dynamic model of excess surface water was established by coupling the urban surface characteristics. At the same time, the green ecological rainwater facilities were generalized into the math module and added to this model under different rainfall conditions. Rapid qualitative and quantitative analysis of the rainwater drainage process improved the ability of the study area to deal with excess surface water induced by rainfall.
The 1D model of the rainwater pipe network was built by using MIKE URBAN software and could accurately describe the rainfall-runoff process and pipe flow process.
The rainfall-runoff model mainly adopted the equal flow time method (namely time-area curve method) [19]. The time step was used to discretize the runoff process, and the corresponding time-area curve was automatically selected according to the shape of the surface generalization catchment area [20], as shown in Eqs. (1)–(3).
where:
The pipe flow model could evaluate the unsteady flow dynamics in the whole pipe network in detail. The calculation was based on the Saint-Venant equations of 1D free surface flow, namely, the continuity equation (mass conservation) and momentum equation (momentum conservation-Newton’s second law), as shown in Eqs. (2) and (3). The motion wave method was used to ignore the inertia term and pressure term in the momentum equation [21]. The numerical method was the finite difference method of the Abbott-Ionescu six-point implicit scheme [22].
The equation of mass conservation:
The equation of momentum conservation:
where: Q–cross-section discharge, m3/s; A–cross-section area, m2; y–the depth of water in the pipeline, m; X–a distance of pipeline along water direction, m; g–gravitational acceleration, m/s2; t–time coordinates, s; α–momentum correction coefficient;
The 2D rapid assessment model of surface water was built by using the same software and described the interaction between surface free flow and rainwater pipe network, combining with the terrain and the distribution characteristics of buildings. The governing equation was the 2D shallow water equation along the water depth of Reynolds averaged Navier–Stokes equation, as shown in Eqs. (4)–(6). The Alternating Direction Implicit (ADI) scheme was used to discretize the continuous equation and the momentum equation. The central difference scheme [23] was used to solve the differential terms and important coefficients. Limited by the difference scheme, the model adopted a structured rectangular grid.
The continuity equation of water flow:
The momentum equation of water flow along the
The momentum equation of water flow along the
where:
3.2.3 Green Ecological Rainwater Facility Model
Based on the above principle, the basic principle of node generalization was used, and a green ecological rainwater model was designed. The model combined the relevant parameters of geometry size and hydrological parameters. According to the node water balance equation, the node storage and detention, infiltration, inflow, and outflow processes under rainfall conditions were simulated, as shown in Eq. (7). The relevant hydrological parameters mainly included: infiltration type, infiltration rate, porosity, initial water level, and parameters of infiltration rate calculation, as shown in Eqs. (8) and (9) for a specific calculation. Porosity represented the proportion of water storage space in the total space of the facility.
where:
The planned industrial park covers 13.867 hm2, which is divided into a working area of 12.746 hm2 and a living area of 1.121 hm2. The specific distribution is shown in Tab. 1. The terrain of the park is high in the north and low in the south. The natural ground elevation is 587~598 m, and the maximum height difference is 11 m. A separate drainage system is adopted inside, and the recurrence periods of rainwater discharge is one year. There are 102 polyethylene rainwater pipes with a total length of 2916.4 m. The pipeline size is between DN300 and DN1000. There are 101 rainwater inspection wells and one drainage outlet. The terrain generalization is shown in Fig. 1.
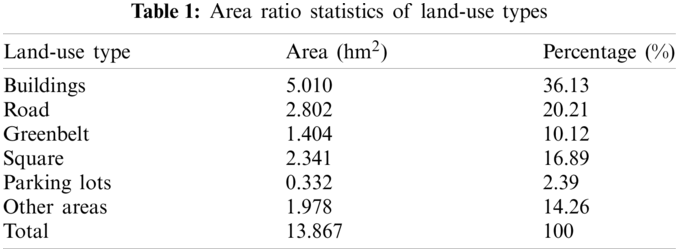
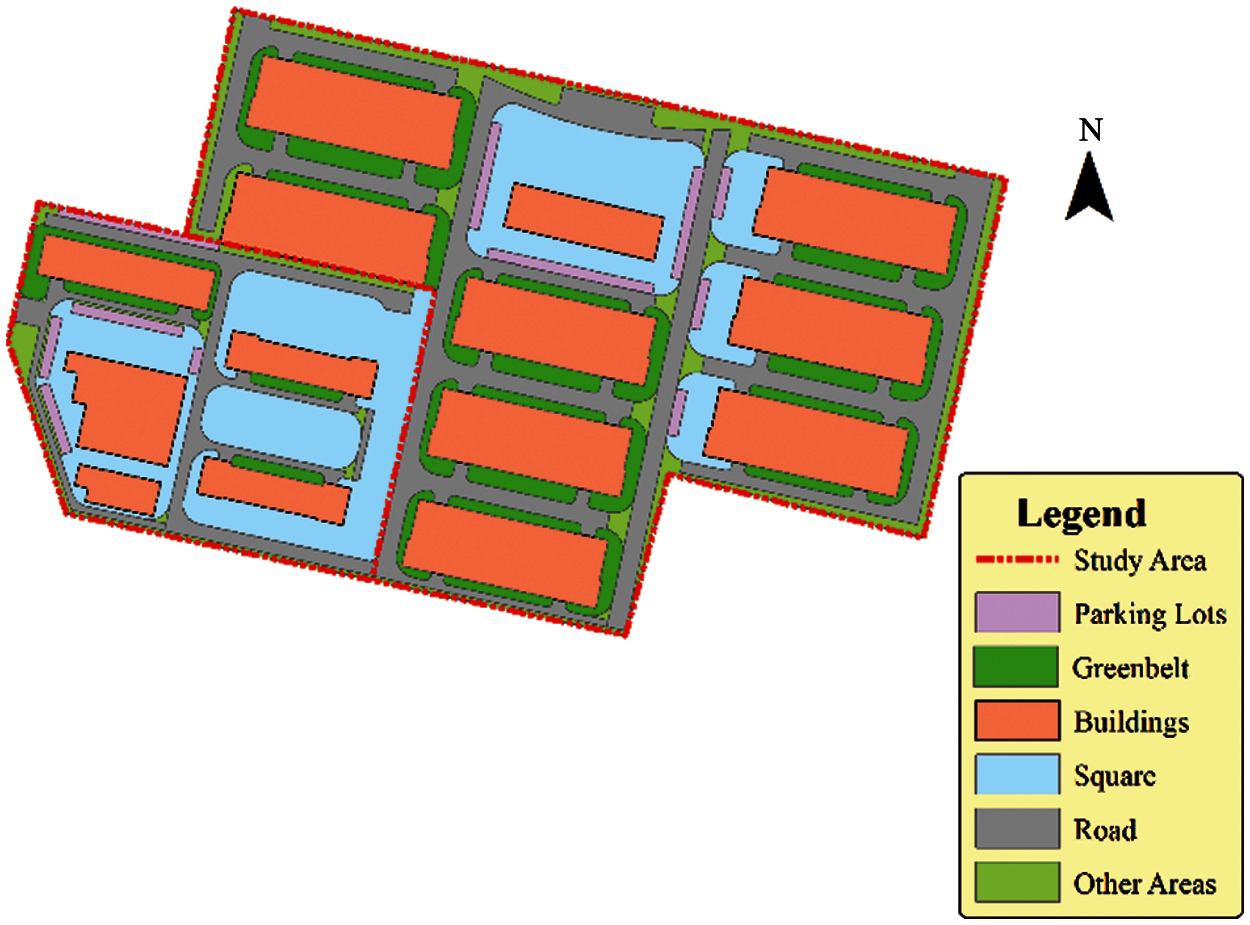
Figure 1: Land use of study area
Due to the lack of measured rainfall data and the small study area, the Chicago storm pattern method was adopted to synthesize rainfall considering that the short duration of heavy rainfall has a greater impact on the region. The rainstorm equation was derived from the latest annual maximum sampling method in the Code for Design of Outdoor Drainage (GB50014-2006), as shown in Eq. (10).
where:
A large number of studies at home and abroad showed that the short duration of rainfall was mainly in the form of a single peak. The relative position of the rain peak was basically between 0.30 and 0.5. This time, 0.35 was taken, and the recurrence periods were 1a, 1.4a, 2a, 3a, and 5a. The rainfall process was shown in Fig. 2.
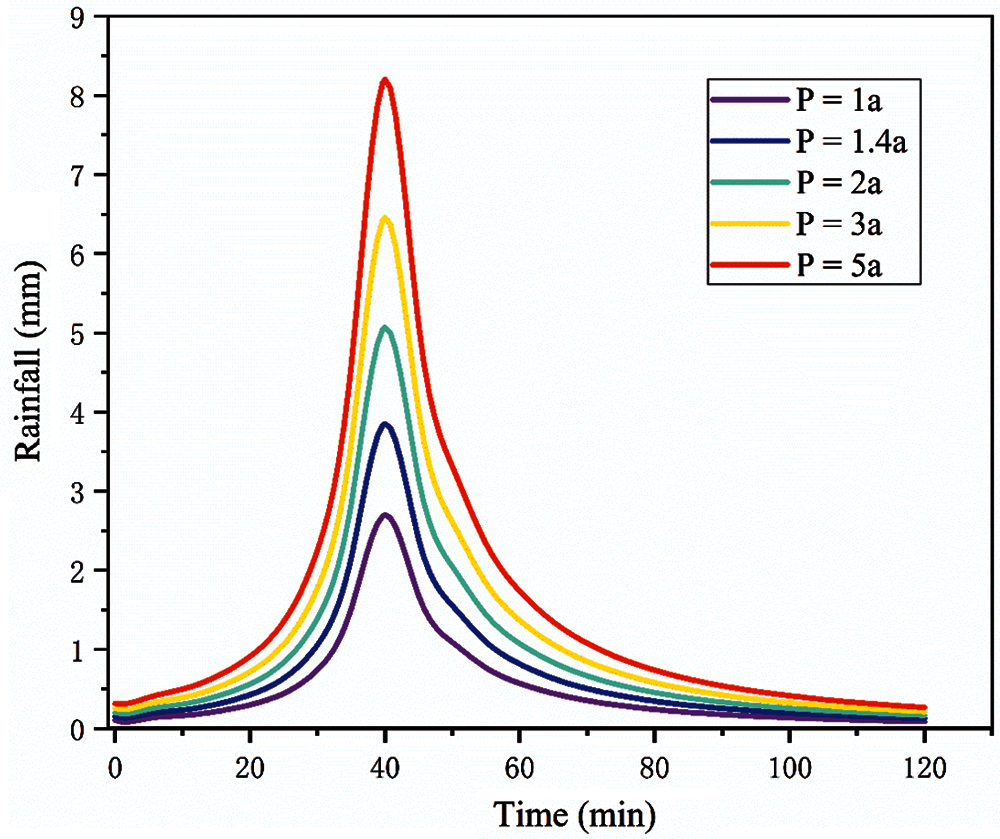
Figure 2: Rainfall processes at different recurrence periods
4.2.2 Figure Labels and Captions
1) Generalization of the Pipe Network
The model was used for the digital processing of pipe network data. 102 sections of circular pipe with a total length of 2916.4 m, 101 inspection wells, 1 drainage outlet, and 101 catchment areas were generalized. The pipe network topology was shown in Fig. 3. The area and characteristic parameters of various types of land were shown in Tab. 2.
The processed data was loaded into the model in the form of Geodatabase.
2) Terrain Generalization
According to the measured 1:1000 topographic map, a digital elevation map (DEM) was obtained after processing in the model. The grid accuracy was 5 m × 5 m, the number of data nodes was 2,144,597, and the number of grids was 250,104, as shown in Fig. 4. Meanwhile, to make the surface details and confluence path of the model more accurate, the building height outside the red line of the road was set at 10 m, and the road was reduced by 0.15 m according to the stone height by local road edge. The processing results were shown in Fig. 5.
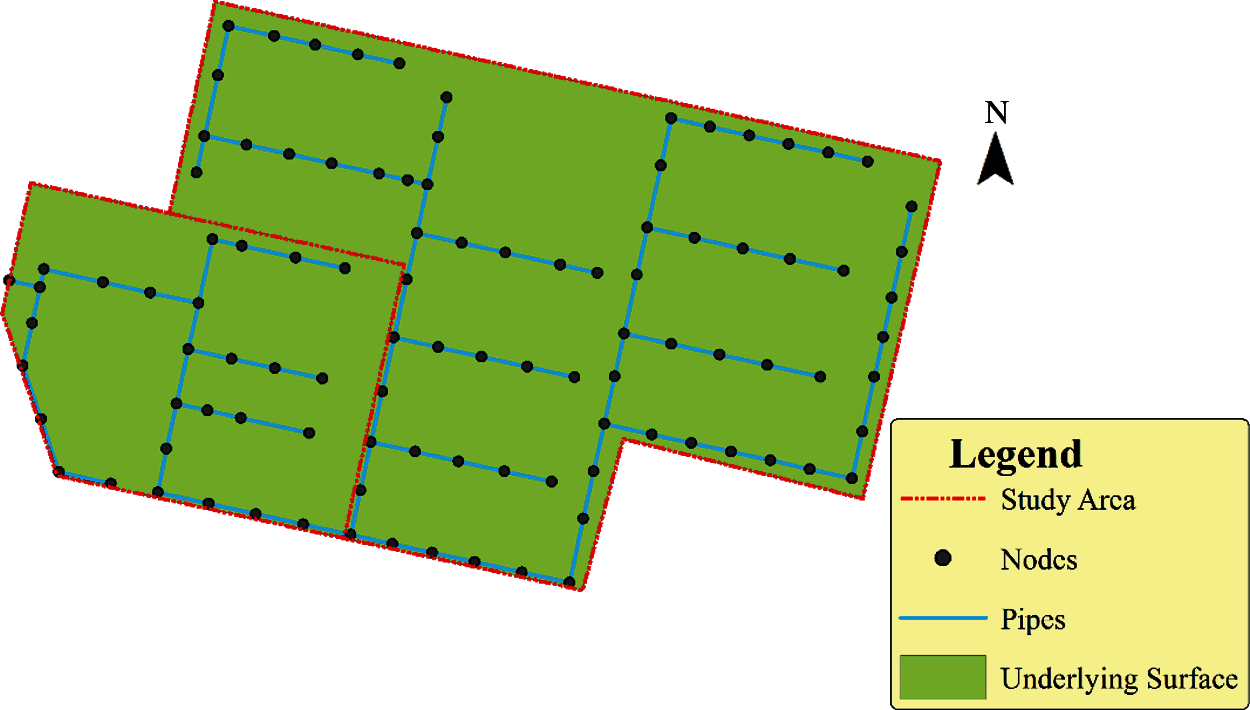
Figure 3: Pipe network topology
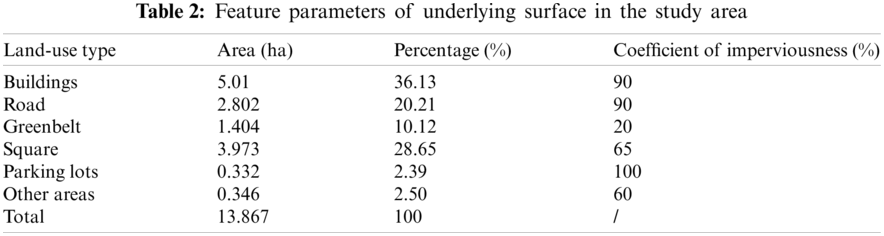
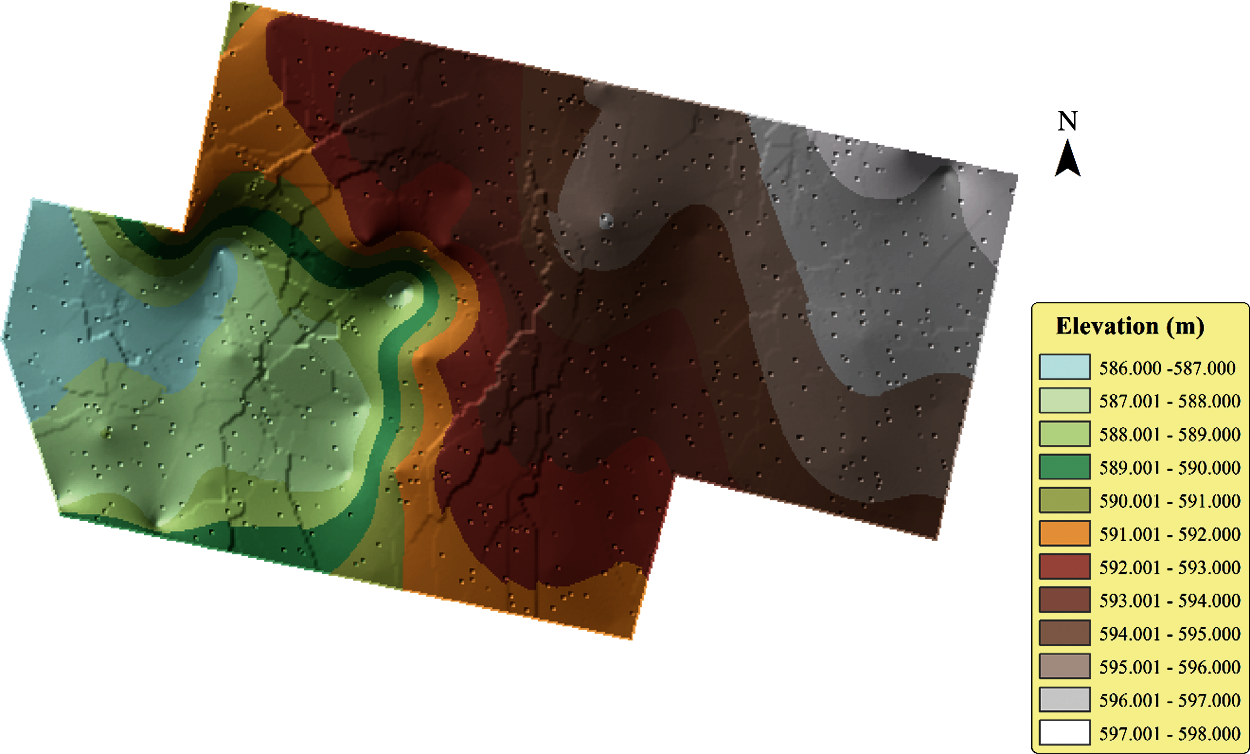
Figure 4: Terrain DEM map of study area
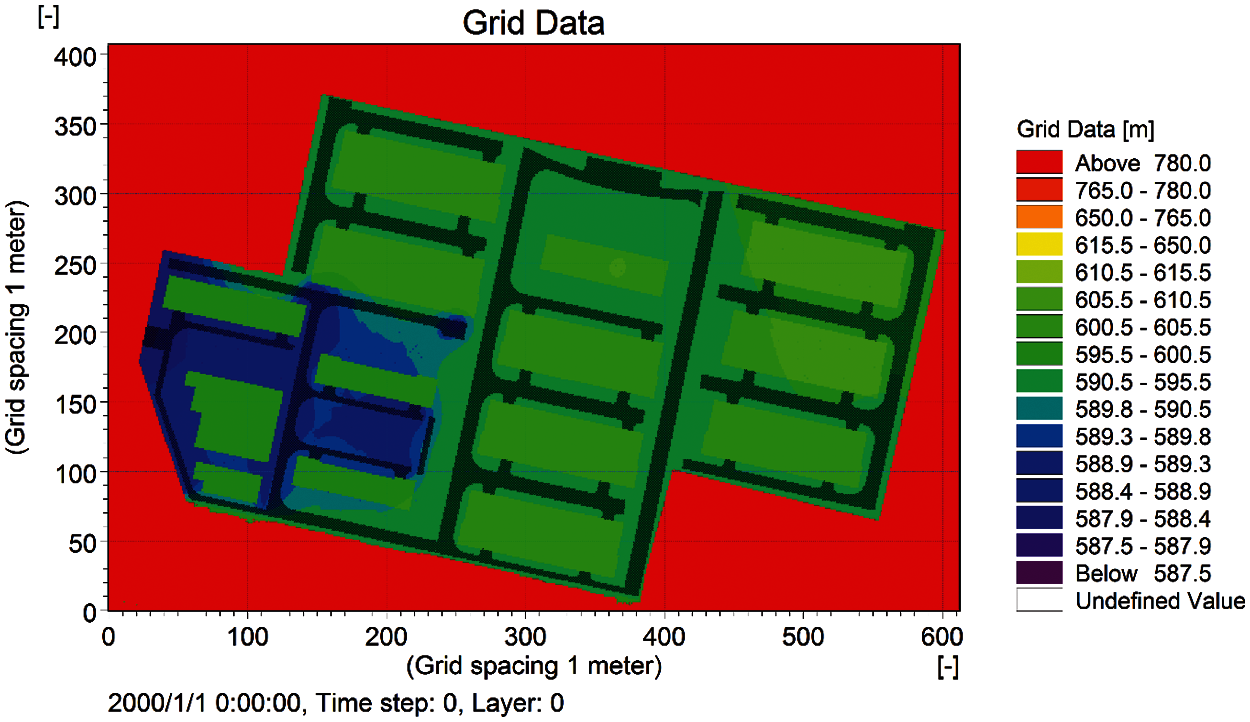
Figure 5: The general layout of 2 D terrain
3) Boundary Condition
The upstream boundary of the pipe network model was the loaded rainfall time series file, and the downstream boundary was the water level value of the pipe network outlet, which would not be processed this time. The surface waterlogging model needed to establish the land closed boundary, which was to set a particular land value outside the study area.
4) Simulation Time
The time step was consistent with the time interval of rainfall data, taking 5 min. The groundwater collection time in the catchment area of the pipe network model was set at 5–10 min. The time step of the simulation calculation was the self-adaptive adjustment step size, and the variable range of the step size was 10–60 s. The simulation step length of the surface water accumulation model was 1 s.
Referring to Technical Guide for Sponge City Construction and the construction status of the study area, the annual runoff control rate of the study area was set as 80%, which was equivalent to the rainfall of 2 h with a recurrence period of 1.4 years.
5) Model Parameter Setting
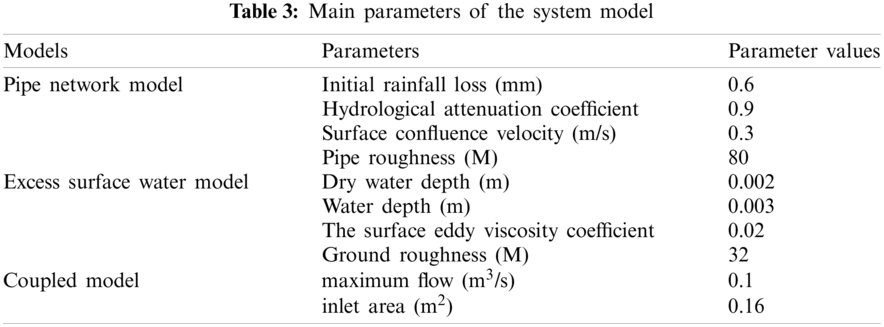
The rapid assessment model was based on the lack of detailed rainfall data. The parameters of the 1D pipe network model and excess surface water model are set referring to the 2016 edition of Code for Design of Outdoor Drainage (GB 50014-2006) and previous studies, as shown in Tab. 3.
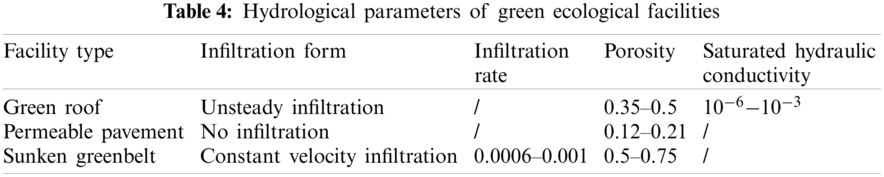
The hydrological parameters of green ecological rainwater facilities were determined according to the regional demand and referring to previous studies. The parameters were facility type, infiltration form, infiltration rate, porosity, and soil hydraulic conductivity. The values were shown in Tab. 4.
6) Model Calibration and Verification
Since this study was for planning an industrial park and lacks measured data, the model was calibrated and verified based on the runoff coefficient. The basic principle was that the runoff coefficient was used as the objective calibration function of the model parameters, and the empirical parameters of the model were calibrated by comparing the actual value of the urban comprehensive runoff coefficient with the simulated value of the model. After calibration and verification, the values of parameters in the model were shown in Tabs. 3 and 4.
The drainage capacity of the pipe network and the water accumulation in the study area were taken as the main research evaluation indexes. The comparison between the designed model and the traditional model was mainly analyzed. The annual runoff control rate was set at 80%, and the control comparison between the green ecological rainwater system model and the traditional model was analyzed and compared. ArcGIS10.2 software (Esri, Redlands, USA) was mainly used for model simulation to judge the effect of the green ecological rainwater system model.
4.3.1 Current Results Analysis
1) Operation Analysis of Pipe Network
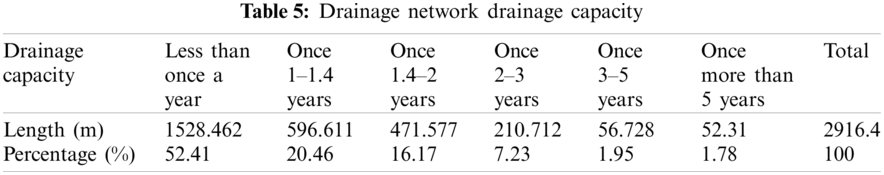
The pipe network load capacity was analyzed based on whether the pipe network reached the maximum pipe filling. The calculation was shown in Eq. (11). If pipe filling was less than or equal to 1, the drainage capacity could meet the current drainage demand. If pipe filling was greater than 1, the drainage capacity could no longer meet the current demand. The simulation results of pipe network drainage capacity under different rainfall conditions were shown in Fig. 6, and the statistical results of pipe network drainage capacity were shown in Tab. 5.
where:
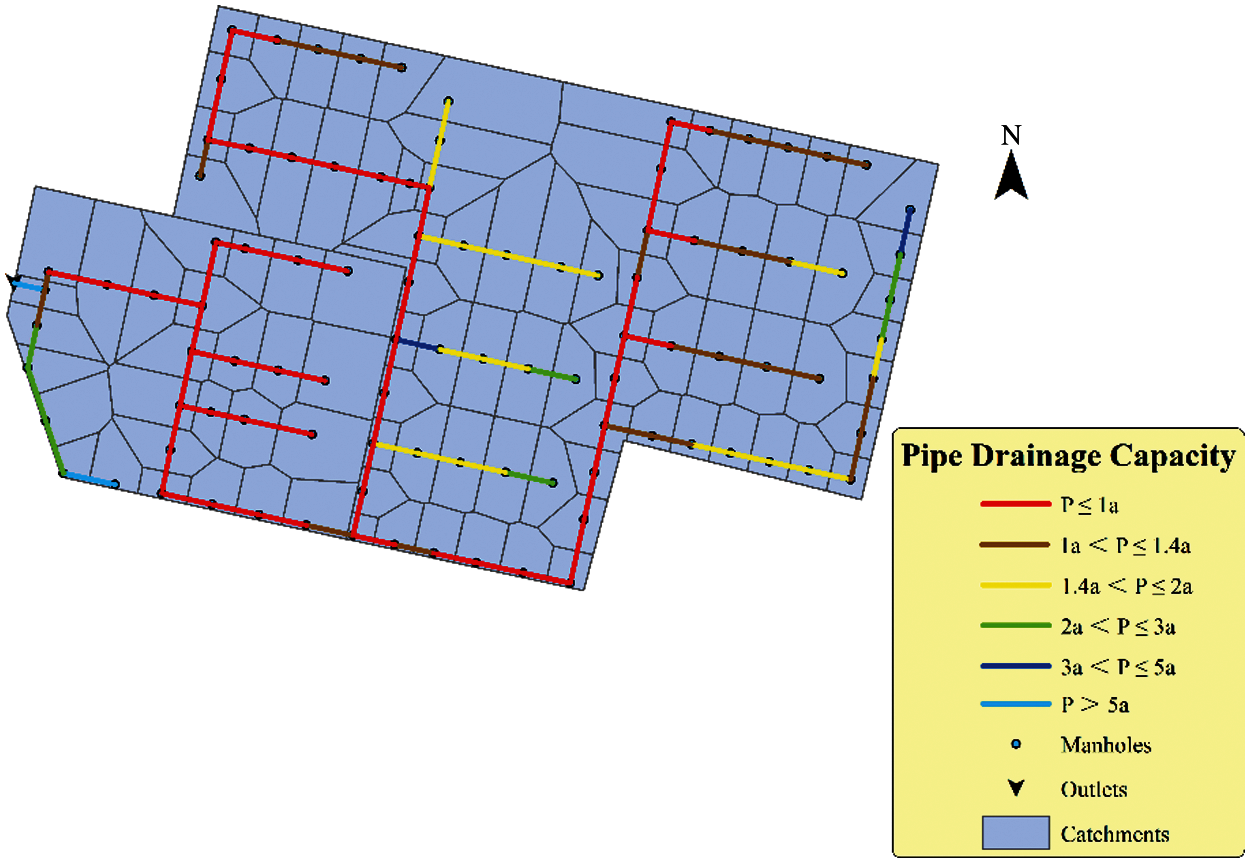
Figure 6: Evaluation of pipe network drainage capacity under different recurrence periods
According to the simulation results, under the rainfall condition of once 1.4 years, most of the pipe filling has reached the critical value. The longer the recurrence period, the more filled pipe sections. The overall analysis shows that the drainage capacity of the current regional pipe network was inferior, which was mainly due to the low design standard of the pipe network. Concurrently, the traditional planning model fails to integrate the pipe network system with green ecological facilities to realize the on-site rainwater absorption and utilization.
2) Analysis of Excess Surface Water
The surface flow was mainly considered from the water accumulation after the rainwater overflows from the generalized node, ignoring the ponding phenomenon before the surface runoff enters the pipe network. The water accumulation range and depth at max depth time under the set rainfall condition were calculated as the analysis indexes to directly reflect the dynamic changes of range and depth of excess surface water. The distribution of accumulated water was shown in Fig. 7, and the classified statistical results were shown in Tab. 6.

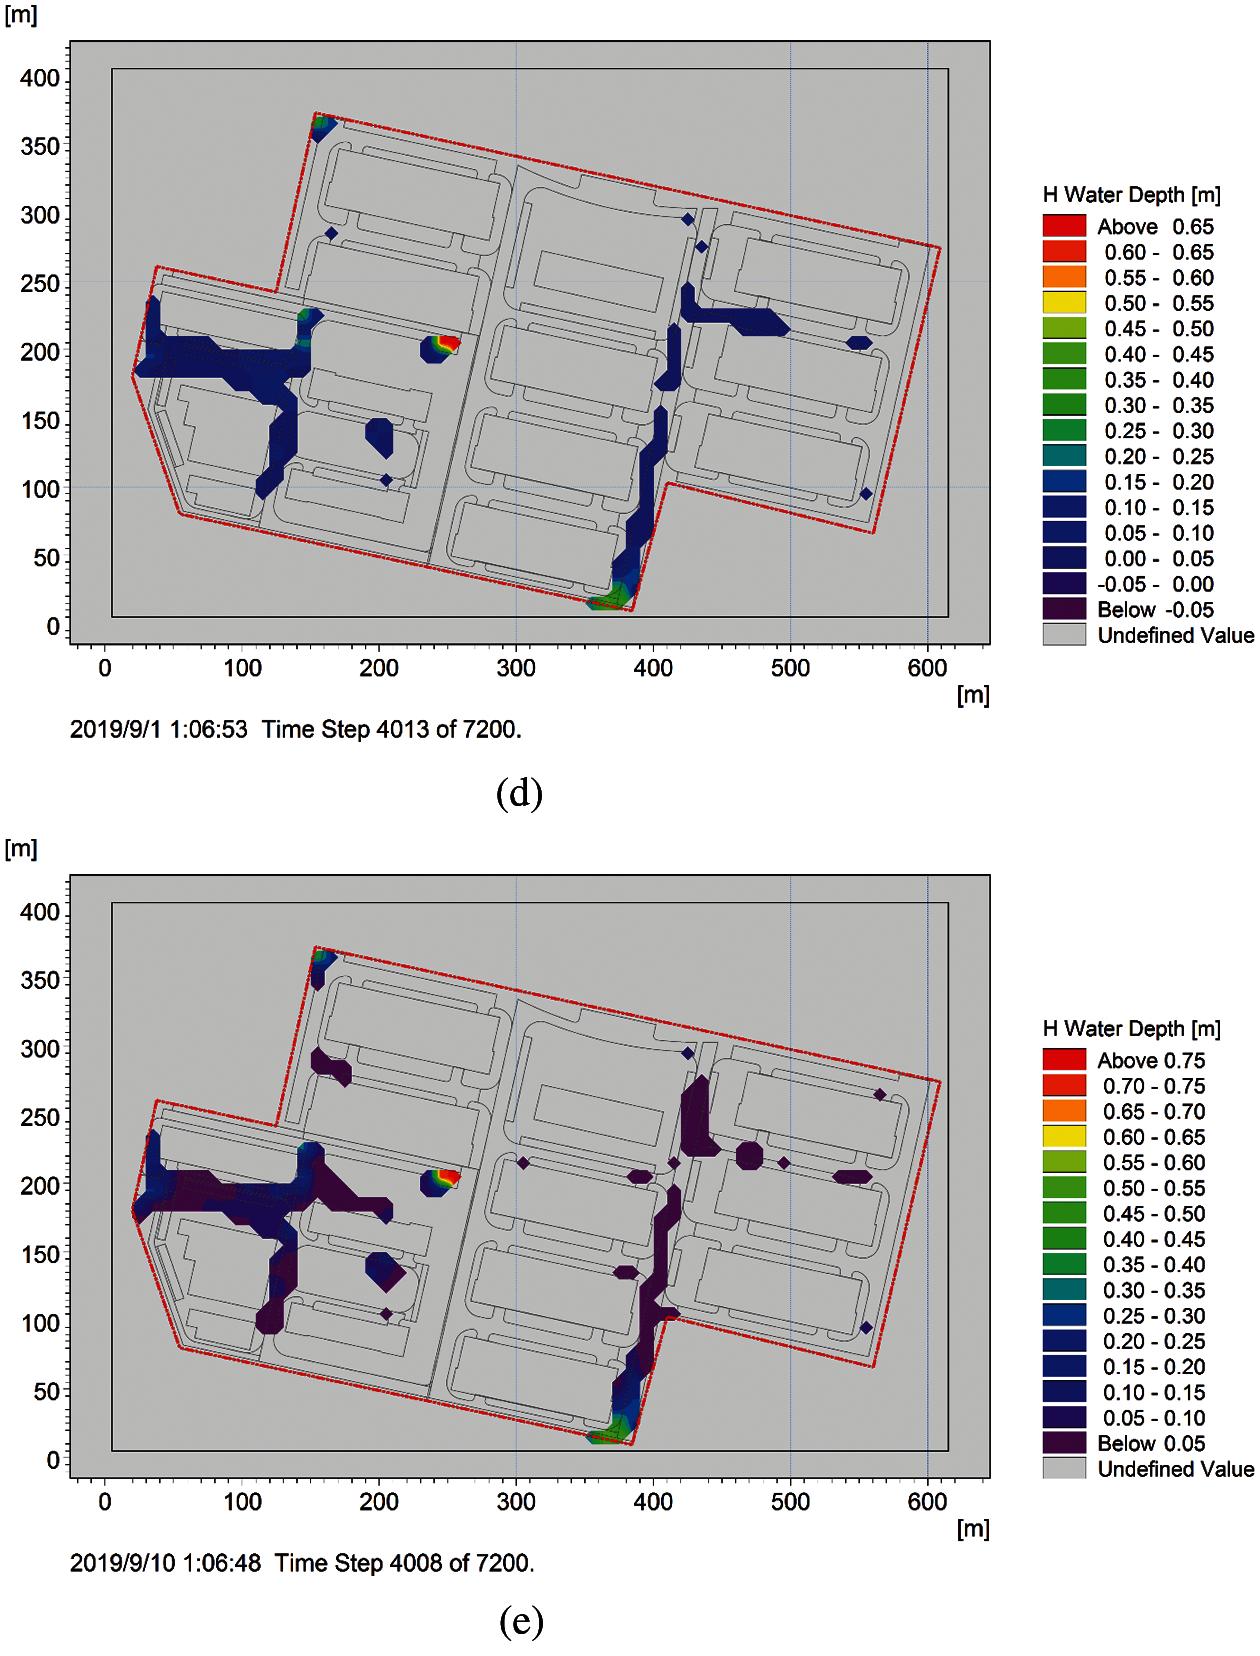
Figure 7: The distribution of water accumulation at max depth time under different recurrence periods (a) 1-year frequency (b) 1.4-year frequency (c) 2-year frequency (d) 3-year frequency (e) 5-year frequency
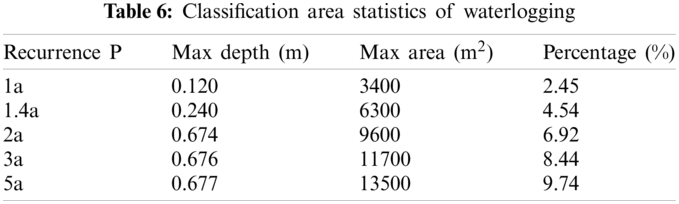
The simulation results suggested that there was a positive correlation between the surface ponding area, ponding depth, and the design rainstorm recurrence period. The distribution of ponding in the study area was similar under different rainfall scenarios, and the water depth was mainly 0–0.677 m. With the increase of rainfall magnitude, the ponding area expands continuously, and the maximum ponding depth was increasing. The investigations tracing to the source of the pipe network via overflow ponding nodes indicated that the design recurrence period of the pipe network in the ponding area was relatively short, which was an important reason for the overflow water accumulation. The corresponding streets all suffer from waterlogging.
4.3.2 Results Analysis of Green Ecological Rainwater System
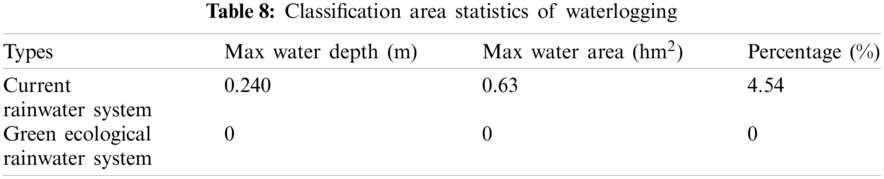
The green ecological rainwater system model was used to plan and design the rainwater system under the rainfall condition of 1.4a 2 h. The current simulation results were compared and analyzed to evaluate the improvement effect of green ecological rainwater facilities on urban water accumulation. The simulation and comparison results of the pipe network drainage capacity were shown in Fig. 8. The assessment results of the pipe network drainage capacity were shown in Tab. 7. The distribution of water accumulation in the study area was shown in Fig. 9 and the classified statistical results were shown in Tab. 8.
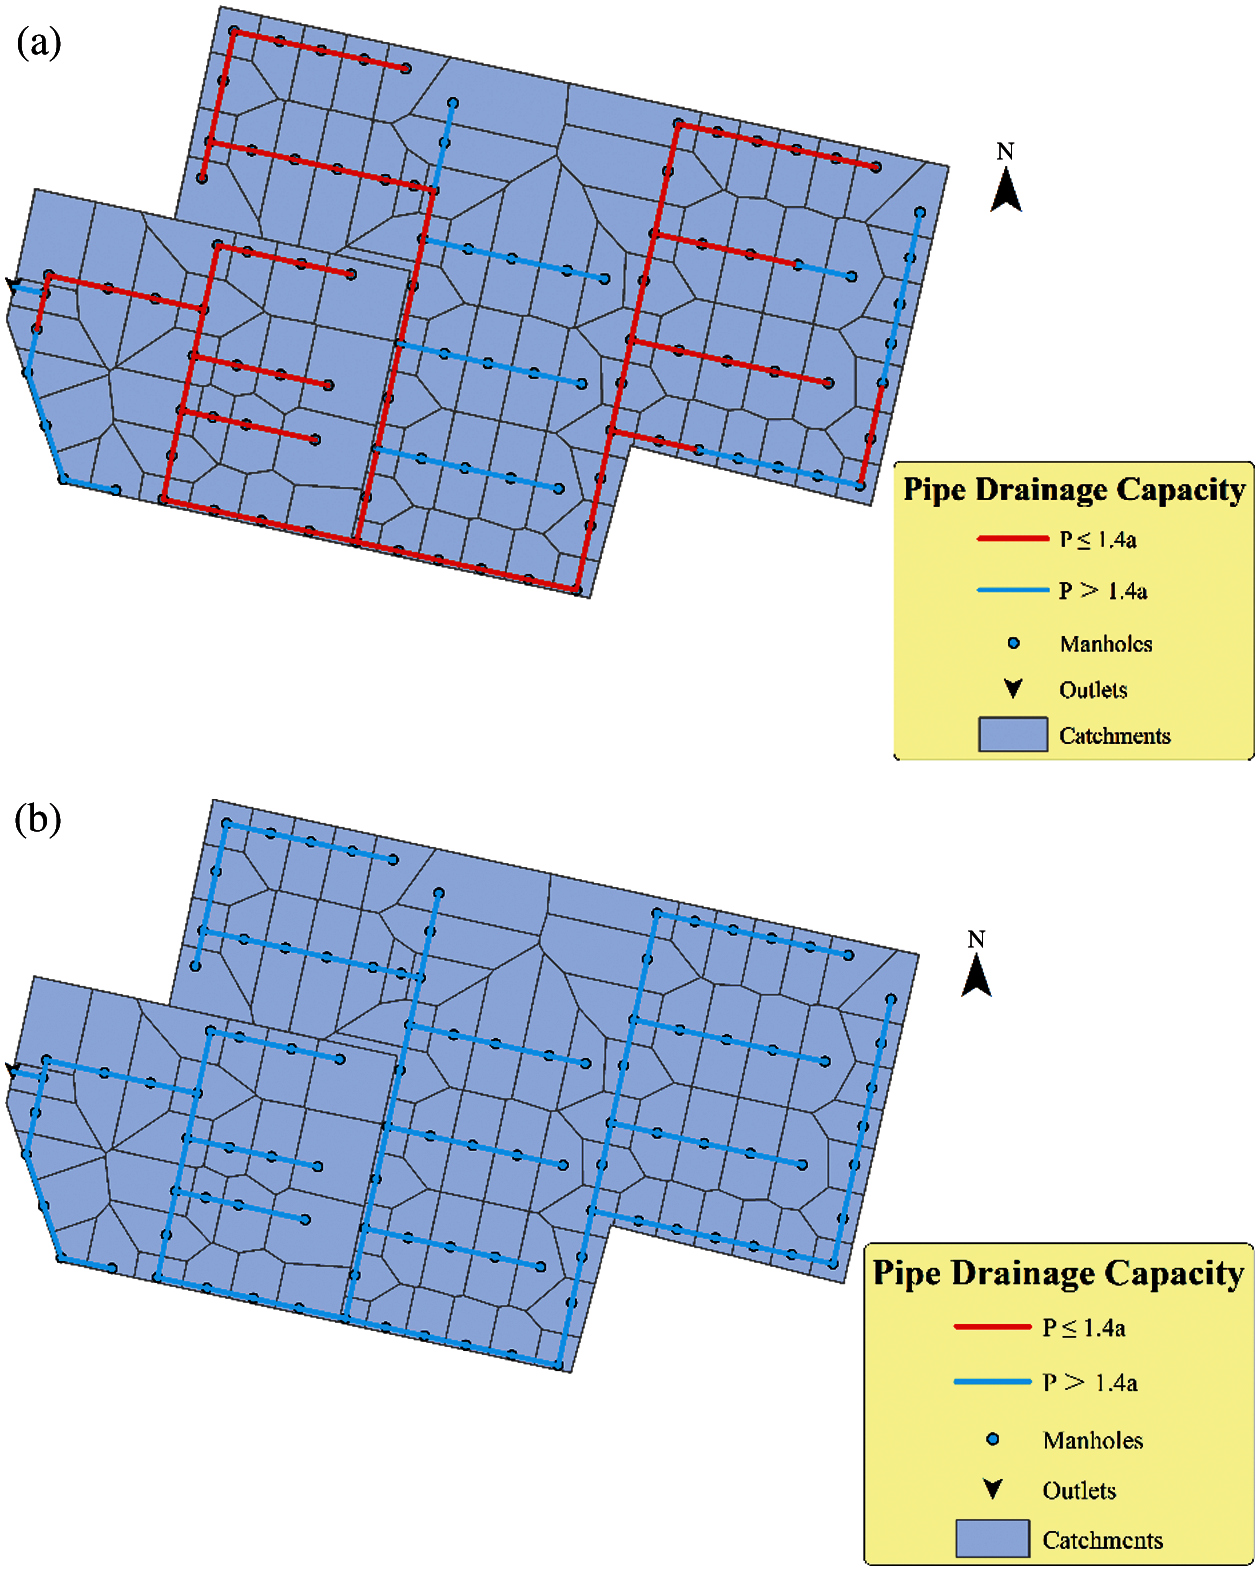
Figure 8: Comparison between the current rainwater system and the green ecological rainwater system (a) Under the current condition (b) Under the green ecological rainwater system condition
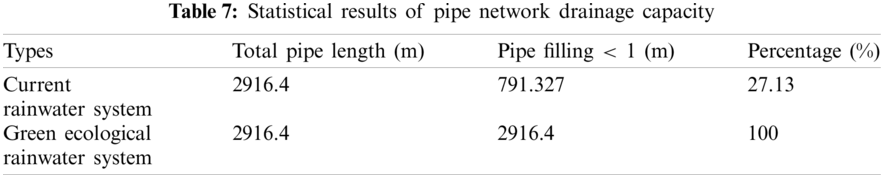
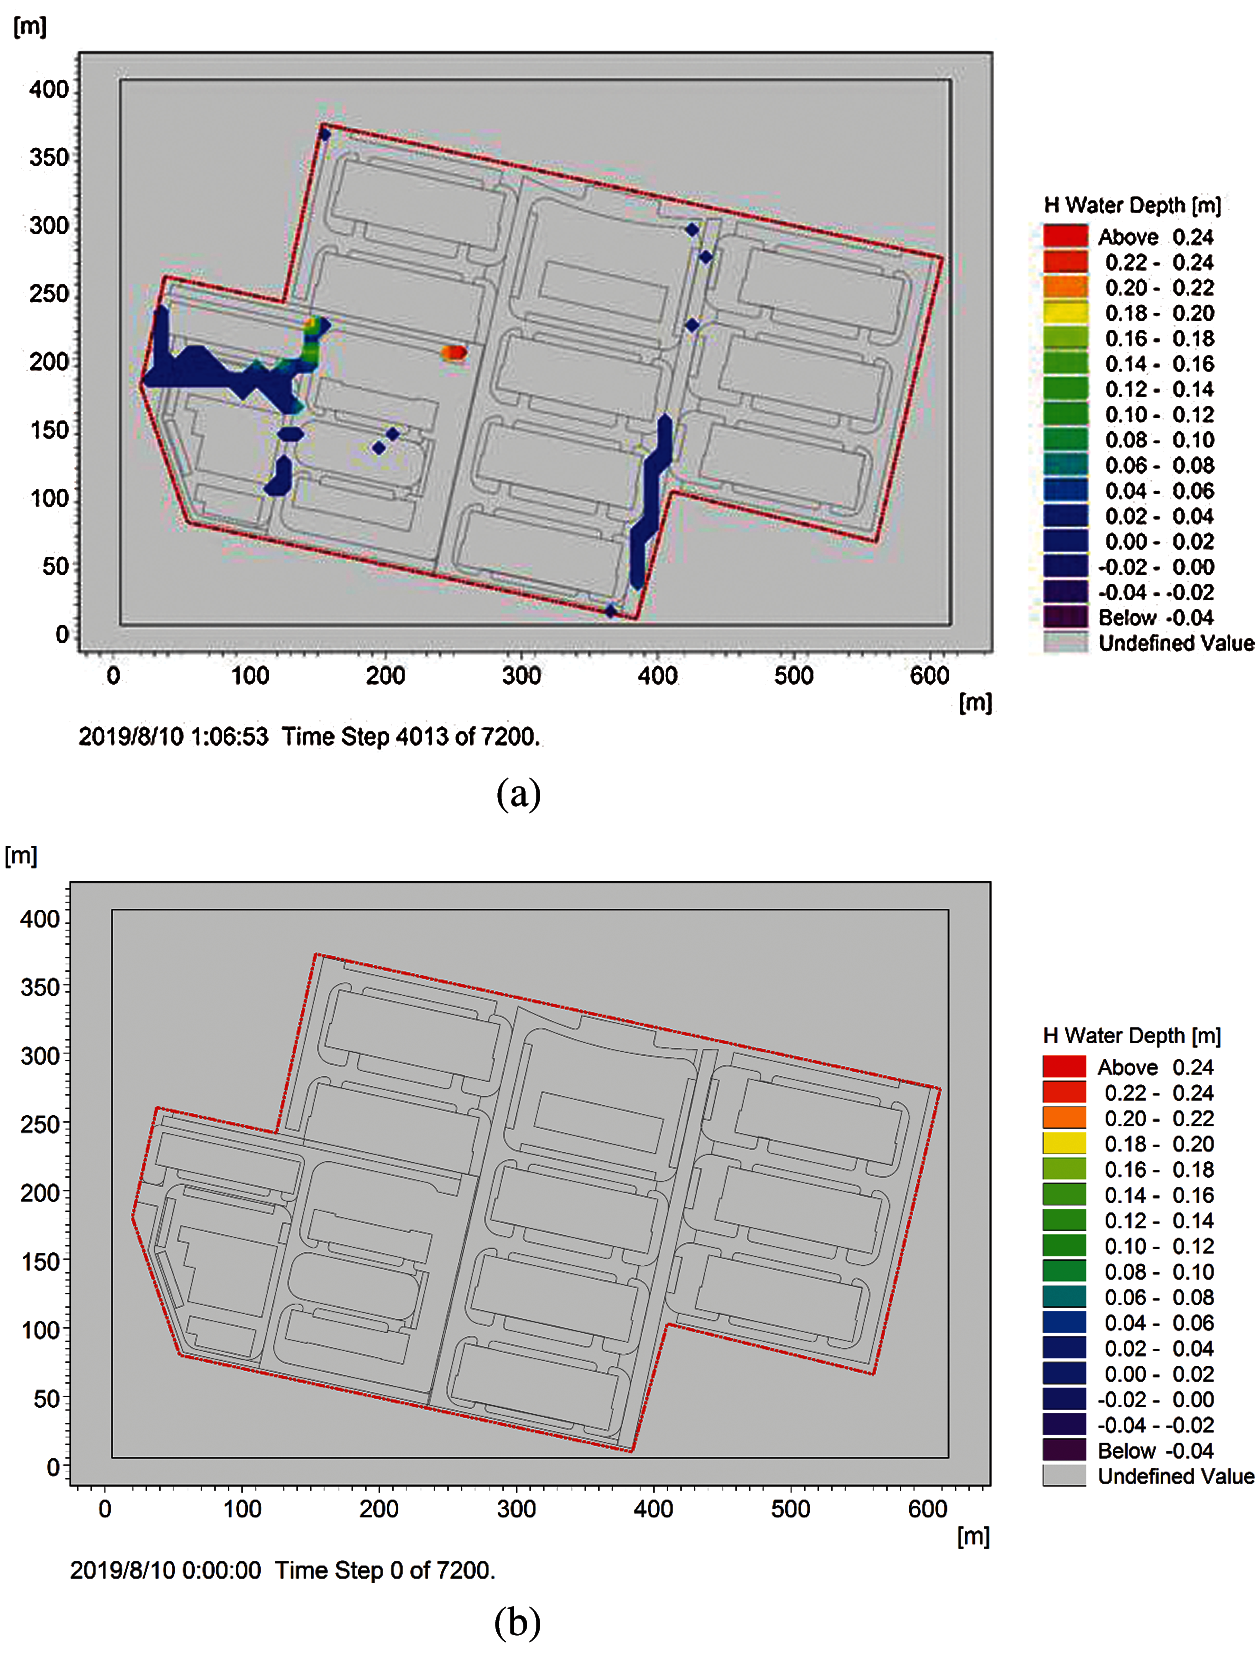
Figure 9: Comparison of water accumulation between the current rainwater system and the green ecological rainwater system (a) Under the current condition (b) Under the green ecological rainwater system condition
The results in Tab. 8 showed that in the existing rainwater system simulation model, the maximum ponding amount was 0.24 m, and the maximum ponding area was 0.63 hm2; there was no ponding when the green ecological rainwater system was used and the simulation effect of the model was good. The results above showed that after the improvement of green ecological rainwater facilities in the study area, the bearing capacity of the rainwater pipe network and the excess surface water were significantly improved. There was almost no runoff discharge in the study area, which has achieved the research goal. Therefore, the green ecological rainwater system model could effectively reduce the risk of ponding.
With an industrial park as an example, a comprehensive simulation and research system of the green ecological drainage system was constructed to quickly evaluate the capacity of regional drainage facilities under different rainfall recurrence periods. At the same time, based on this model, rainwater regulation and control were carried out in the study area. Besides, the operation of the regional pipe network and drainage load, before and after regulation and control, were compared and evaluated. The conclusions are as follows:
The concept of an urban green ecological rainwater system has been defined, which is composed of rainwater engineering facilities including rainwater infiltration, storage, and reuse, storage and peak shaving, infiltration and drainage, rainwater purification, and new rainwater pipeline drainage. After upgrading the green ecological rainwater system model in the study area, the drainage pressure of the pipe network and surface water accumulation is effectively reduced. It proves the applicability of the model in the evaluation of green ecological measures. The simulation results show that the drainage capacity of the model is 100%, and there is no ponding phenomenon. The designed rainwater pipeline analysis model has the advantages of simple modeling and fast calculation. Therefore, the research content has a very important practical application value and reference value, which is very suitable for the needs of ecological city construction at this stage. However, due to limited data, only a rapid evaluation model has been built to simulate and analyze a typical area. Next, the simulation of the model will be expanded and compared with the real-time monitoring of the drainage and ponding process to enhance the reliability of the model and improve the simulation accuracy.
Funding Statement: The authors received no specific funding for this study.
Conflicts of Interest: The authors declare that they have no conflicts of interest to report regarding the present study.
1. Huong, H. T. L. (2013). Urbanization, and climate change impacts on future urban flooding in Can Tho City. Vietnam Hydrology and Earth System Sciences, 17(1), 379–394. DOI 10.5194/hess-17-379-2013. [Google Scholar] [CrossRef]
2. Chui, T. F. M., Liu, X., Zhan, W. (2016). Assessing cost-effectiveness of specific LID practice designs in response to large storm events. Journal of Hydrology, 533(2), 353–364. DOI 10.1016/j.jhydrol.2015.12.011. [Google Scholar] [CrossRef]
3. Cano, O. M., Barkdoll, B. D. (2017). Multiobjective, socioeconomic, boundary-emanating, nearest distance algorithm for stormwater low-impact BMP selection and placement. Journal of Water Resources Planning and Management, 143(1), 5016013. DOI 10.1061/(ASCE)WR.1943-5452.0000726. [Google Scholar] [CrossRef]
4. Yu, S., Tong, S., Yang, Y. J. (2016). Modeling the cost-effectiveness of stormwater best management practices in an urban watershed in Las Vegas Valley. Applied Geography, 76(8), 49–61. DOI 10.1016/j.apgeog.2016.09.005. [Google Scholar] [CrossRef]
5. Autixier, L., Mailhot, A., Bolduc, S., Madoux-Humery, A. S., Galarneau, M. et al. (2014). Evaluating rain gardens as a method to reduce the impact of sewer overflows in sources of drinking water. Science of the Total Environment, 499, 238–247. DOI 10.1016/j.scitotenv.2014.08.030. [Google Scholar] [CrossRef]
6. Firehock, K., Walker, R. A. (2015). Strategic green infrastructure planning: A multi-scale approach. Britain: Island Press/Center for Resource Economics. [Google Scholar]
7. Lottering, N., Plessis, D., Donaldson, R. (2015). Coping with drought: The experience of water sensitive urban design (WSUD) in the George Municipality. Water S.A, 41(1), 1–7. DOI 10.4314/wsa.v41il1. [Google Scholar] [CrossRef]
8. Perales-Momparler, S., Andrés-Doménech, I., Hernández-Crespo, C., Vallés-Moránb, F., Martín, M. et al. (2016). The role of monitoring sustainable drainage systems for promoting transition towards regenerative urban built environments: A case study in the Valencian region. Spain Journal of Cleaner Production, 163(7–8), S113–S124. DOI 10.1016/j.jclepro.2016.05.153. [Google Scholar] [CrossRef]
9. Che, W., Zhao, Y., Li, J. Q., Wang, W. L., Wang, J. L. et al. (2015). Explanation of sponge city development technical guide: Basic concepts and comprehensive goals. Chinese China Water & Wastewater, 11(8), 1–5. DOI CNKI:SUN:GSPS.0.2015-08-004. [Google Scholar]
10. Mollerup, A. L., Mikkelsen, P. S., Thornberg, D., Sin, G. (2015). Regulatory control analysis and design for sewer systems. Environmental Modelling & Software, 66(2), 153–166. DOI 10.1016/j.envsoft.2014.12.001. [Google Scholar] [CrossRef]
11. Cipolla, S. S., Maglionico, M., Stojkov, I. (2016). A long-term hydrological modelling of an extensive green roof by means of SWMM. Ecological Engineering, 95(4), 876–887. DOI 10.1016/j.ecoleng.2016.07.009. [Google Scholar] [CrossRef]
12. Wagh, V., Panaskar, D., Muley, A., Mukate, S., Gaikwad, S. (2018). Neural network modelling for nitrate concentration in groundwater of Kadava River basin, Nashik, Maharashtra, India. Groundwater for Sustainable Development, 7, 436–445. DOI 10.1016/j.gsd.2017.12.012. [Google Scholar] [CrossRef]
13. Zhou, Q. Q. (2014). A review of sustainable urban drainage systems considering the climate change and urbanization impacts. Water, 6(4), 976–992. DOI 10.3390/w6040976. [Google Scholar] [CrossRef]
14. Hu, L., Lu, W., Zhang, Z. K. (2016). Application of MIKE11 model in water quality early-warning and protection in Dong Tiaoxi water source. Chinese Journal of Hydrodynamics, 31(1), 28–36. DOI 10.16076/j.cnki.cjhd.2016.01.005. [Google Scholar] [CrossRef]
15. Morianou, G. G., Kourgialas, N. N., Karatzas, G. P., Nikolaidis, N. P. (2016). Hydraulic and sediment transport simulation of Koiliaris river using the MIKE 21C model. Procedia Engineering, 162(3), 463–470. DOI 10.1016/j.proeng.2016.11.089. [Google Scholar] [CrossRef]
16. Zhang, S. H., Pan, B. Z. (2014). An urban storm-inundation simulation method based on GIS. Journal of Hydrology, 517(5), 260–268. DOI 10.1016/j.jhydrol.2014.05.044. [Google Scholar] [CrossRef]
17. Bisht, D. S., Chatterjee, C., Kalakoti, S., Upadhyay, P., Sahoo, M. et al. (2016). Modeling urban floods and drainage using SWMM and MIKE URBAN: A case study. Natural Hazards, 84(2), 749–776. DOI 10.1007/s11069-016-2455-1. [Google Scholar] [CrossRef]
18. Chen, X. L., Zhao, S. D., Zhao, D. Q., Sheng, Z. (2015). Introduction of digitalwater simulation system. Chinese China Water & Wastewater, 31(1), 104–108. DOI 10.19853/j.zgjsps.1000-4602.2015.01.027. [Google Scholar] [CrossRef]
19. Lee, K. S., Cho, W. S., Hwang, J. W., Byeon, S. J., Joo, K. H. (2015). Numerical simulation for reducing the flood damage of green park using MIKE URBAN. International Journal Control Automation & Systems, 8(1), 37–54. DOI 10.14257/ijca.2015.8.1.04. [Google Scholar] [CrossRef]
20. Yang, Q., Qiang, D., Han, D., Zhu, X., Zhang, S. (2018). Impact of the storm sewer network complexity on flood simulations according to the stroke scaling method. Water, 10(5), 645. DOI 10.3390/w10050645. [Google Scholar] [CrossRef]
21. Mignot, E., Li, X., Dewals, B. (2019). Experimental modelling of urban flooding: A review. Journal of Hydrology, 568(4), 334–342. DOI 10.1016/j.jhydrol.2018.11.001. [Google Scholar] [CrossRef]
22. Noh, S. J., Lee, J. H., Lee, S., Kawaike, K., Seo, D. J. (2018). Hyper-resolution 1D–2D urban flood modelling using LiDAR data and hybrid parallelization. Environmental Modelling & Software, 103, 131–145. DOI 10.1016/j.envsoft.2018.02.008. [Google Scholar] [CrossRef]
23. Zhou, L., Wang, H., Bergant, A., Tijsseling, A. S., Liu, D. (2018). Godunov-type solutions with discrete gas cavity model for transient cavitating pipe flow. Journal of Hydraulic Engineering, 144(5), 4018017. DOI 10.1061/(ASCE)HY.1943-7900.0001463. [Google Scholar] [CrossRef]
 | This work is licensed under a Creative Commons Attribution 4.0 International License, which permits unrestricted use, distribution, and reproduction in any medium, provided the original work is properly cited. |