| Computer Modeling in Engineering & Sciences |
DOI: 10.32604/cmes.2021.016071
ARTICLE
Methodology for Road Defect Detection and Administration Based on Mobile Mapping Data
1Department for Civil Engineering and Geodesy, Faculty of Technical Sciences, University of Novi Sad, Novi Sad, 21000, Serbia
2University of Applied Sciences Würzburg-Schweinfurt, Würzburg-Schweinfurt, 97070, Germany
*Corresponding Author: Marina Davidović. Email: marina.davidovic@uns.ac.rs
Received: 03 February 2021; Accepted: 03 June 2021
Abstract: A detailed inspection of roads requires highly detailed spatial data with sufficient precision to deliver an accurate geometry and to describe road defects visually. This paper presents a novel method for the detection of road defects. The input data for road defect detection included point clouds and orthomosaics gathered by mobile mapping technology. The defects were categorized in three major groups with the following geometric primitives: points, lines and polygons. The method suggests the detection of point objects from matched point clouds, panoramic images and ortho photos. Defects were mapped as point, line or polygon geometries, directly derived from orthomosaics and panoramic images. Besides the geometric position of road defects, all objects were assigned to a variety of attributes: defect type, surface material, center-of-gravity, area, length, corresponding image of the defect and degree of damage. A spatial dataset comprising defect values with a matching data type was created to perform the attribute analysis quickly and correctly. The final product is a spatial vector data set, consisting of points, lines and polygons, which contains attributes with further information and geometry. This paper demonstrates that mobile mapping suits a large-scale feature extraction of road infrastructure defects. By its simplicity and flexibility, the presented methodology allows it to be easily adapted to extract further feature types with their attributes. This makes the proposed approach a vital tool for data extraction settings with multiple mobile mapping data analysts, e.g., offline crowdsourcing.
Keywords: Deformation detection; engineering; visual inspection; data analyses; mobile mapping; GIS
Work efficiency along with time and resources saving is an increasingly important aspect of contemporary life and business. A major area of any business involves projects whose success relies entirely on recent scientific achievements and their novel fields of application. One of such novelties entails the development and use of spatial data in modern technologies which allow improved productivity and preservation of time and resources.
Mobile Mapping System (MMS) delivers an extensive amount of data, high data density and sufficient accuracy. MMS significantly reduces acquisition time compared to classical methods in the field. The focus of modern methods is shifting to the processing of this data in the office instead of on the working site because of the enormous amount of data and large processing efforts. Conscientious processing of the data in the office allows the usage of additional information provided by means of innovative multi-sensor technology. This leads to a larger field of products derived from MMS data and inherently requires networking between various scientific fields where each actor collaborates to exploit the full potential of possibilities. Synergies raise the magnitude and multitude of possible refined products and call for a strategic approach so as to be appropriate to the application [1–5].
The novel road detection method presented in this paper is an example of this interdisciplinary nature. Namely, the use of MMS, software solutions and Geographic Information Systems (GIS) has enabled the development of this method to a great extent. To implement a spatial database, it is crucial to understand the outer circumstances and workflows. For this task, the field of road maintenance was analyzed to obtain the information on the major types and reasons for road damages. The principal causes for damaged roads are poor maintenance, adverse weather conditions with a broad difference in temperatures and heavy loads on vehicles with high axle load. The consequences are the deformation of lanes and the appearance of cracks and potholes. In order to maintain the function of the road infrastructure, it is necessary to detect road defects as early as possible. In addition to the possibility of a much wider application, the primary goals of the given methodology include mapping defected road sections and providing attributes so that those in charge can hire adequate companies to assess, plan and conduct road repair tasks.
There are manual and automatic procedures available to detect road damages. Automatic data collection methods require less detection time and allow crawling vast amounts of data in a short time. Unfortunately, hardware and software are costly compared to manual assessment methods [6]. Conversely, the limitations that need to be considered when manual techniques are observed refer to investing much more time and resources for data collection on the site, whereas the density of such data is far lower. The road defect detection methodology presented in this paper offers the advantages of automatic methods in terms of data collection efficiency and at the same time includes the operators who detect deformations on specified roads in data processing. It is important to point out that their involvement is similar to that of an operator in the field, with the important economic difference since they use a real road infrastructure model on the computer. MMS collects 3D data based on a multi-sensor technology. Most of the visual sensors create 2D data, and by tracking the MMS platform, 3D point clouds and images with spatial reference can be obtained. The trajectory is the position of an MMS over time. The combination of multiple navigation sensors allows overcoming the weakness of single navigation solutions. A Global Navigation Satellite System (GNSS) continuously records the absolute position in 3D space. An Inertial Measurement Unit (IMU) records deviations in acceleration concerning the earth frame, while an odometer tracks the movement of the vehicle's tires. Both instruments help to close gaps in the GNSS positioning. To get a precise trajectory used in the presented methodology, GNSS, IMU and odometric measurements have been combined in Kalman filtering.
The major part of MMS for the 3D geometry are laser scanners that emit laser beams into space. The result of each emitted and received laser beam is the position of a 3D object point along with the reflection intensity. After pre-processing, a grey-scale point cloud is obtained from laser raw data and trajectory. To support visual inspection, a camera with a nearly 360° view is mounted on the MMS. The camera system records panoramic images continuously while the vehicle is moving. A back-down camera and side cameras are continuously capturing additional photos. Images simplify the visual inspection of spatial objects and allow an easier interpretation of laser scanning results. Combining all trajectories, laser data and camera data with spatial reference produces a global colored point cloud for road defect detection [7–9].
Spatial data is crucial to detect and map road defects in a GIS. Here, the GIS was used to inspect, map, analyze and store spatial and non-spatial data in a database. The database allows remote access from any location by multiple clients at the same time. Redundancy of data has been avoided and efficient views have been implemented, so each client can analyze the data. Clients can conduct various queries and create interactive views depending on their needs simultaneously. A GIS is an excellent system to view spatial data, most notably to be used for decision-making based on gathered spatial findings. The GIS is very convenient for various fields, such as land management [10], urban environmental management [11], water quality management [12], archaeological sites [13], etc.
An integrated workflow to process MMS data using a GIS is presented in the paper. Data collection and extraction tool for road damages was implemented. Geometry was created based on spatial range of damages and attributes were defined according to road damage characteristics. The final product of the proposed method has been a spatial database containing the geometry of the detected defects and additional information significant for assessing road conditions and planning maintenance.
The detection of road defects is a topic that has been discussed in various scientific papers. Most of the conducted researches aim at further improvements of detection methods themselves. Research has made progress in automation of data processing and it has produced accuracy improvements in automated feature detection in the context of increased efficiency and reduction in the amount of time necessary for feature collection.
In a low-cost method, which uses video data of a parking camera, the Semantic Texton Forests (STFs) algorithm has been used for the automatic detection of pavement defects. The algorithm detects longitudinal and transverse cracks, patches, and potholes simultaneously [14]. It acts as a supervised classifier of an area of interest. This method uses parking cameras—with low resolution and a small area of view—for collecting data. Hrůza et al. [15] verified the accuracy of the forest road damages detected by four different remote sensing methods: close-range photogrammetry, terrestrial laser scanning, mobile laser scanning and airborne laser scanning. However, the damage detection did not reach the required precision in particular areas with high vegetation, as the point cloud was not dense enough.
Some authors focus on the use of laser scanning to acquire detailed information about the road surface in terms of a three-dimensional point cloud for detecting its defects [16–21]. To decompose 3D laser scanning pavement profiles into a sparse component, a low-frequency component, a vibration component and a 3D Pavement Components Decomposition Model (3D-PCDM) were proposed [16]. Based on these three characteristics, the algorithm identifies separate components with multiple properties of the pavement such as cracks, road markings and potholes. The conducted experiments were founded on 3D asphalt data (highway pavement, municipal pavement and airport asphalt pavement); however, further analysis whether the mentioned method can be applied to structures such as cement pavements and concrete structures is necessary along with certain adjustments. Another workflow for processing mobile mapping data to extract road surface defects consists of four steps [17]: 1) editing the point cloud to extract points belonging to the road surface, 2) determination of road roughness predicated on the deviation in the height of every single point of the point cloud compared with the modeled road surface, 3) segmentation of the defected parts, and 4) computation of the geometric parameters to classify detected defects by severity levels. This method requires a smart numeric choice of input parameters of the computation software. The choice of parameters is complex, especially when it comes to different road surface materials, which prevents a wide applicability of this method. Therefore, a set of input parameters must be carefully selected with regard to the properties of the data, as this has a big impact on the quality of the results.
Zhong et al. [18] described crack detection employing point cloud rasterization to apply proven image-based crack extraction. They identified crack candidates by integrating differential intensity and height changes from their neighbors. This method was used to compute crack parameters: crack direction, width, length and area. It allows to detect cracks larger than 1 cm.
Zhang et al. [19] proposed a sparse processing algorithm for 3D pavement profiles. They designed this algorithm to extract crack candidate points and deformation support points. The algorithm combines the extracted candidate points with an improved minimum cost spanning tree algorithm for robust crack detection. The drawback is that they have confirmed the method only on four defect types: shoving, rutting, potholes and subsidence.
Tsai et al. [20] used a 3D laser technology to detect cracks under different lighting and low-intensity contrast conditions. The results showed that the 3D laser system can detect cracks with a width of 2 mm and more in a controlled laboratory environment. Their method can achieve consistent results when detecting cracks under different lighting conditions: nighttime, daytime with shadow, and daytime without shadow. It can even provide detection of cracks with low-intensity contrast. This method still needs verification in terms of comprehensive field tests (e.g., whether it is applicable on different asphalt pavement surfaces) as well as evaluation concerning the capability to detect cracks with multiple severity levels and their various characteristics.
Szulwic et al. [21] suggested a method to extract ruts from point cloud data. A vehicle equipped with line scan cameras, laser illumination and hardware-software acquisition was used in this research to store digital images intended for road crack identification [22].
Feature-matching and image-stitching methods were used to eliminate duplicates and visually indicate local pavement distress [23]. An industrial camera with a relatively small area of road view was used, thus requiring multiple passages in order to obtain a comprehensive model of the whole road surface. Another approach is based on a two-dimensional Empirical Mode Decomposition (EMD) algorithm. A non-parametric and data-driven sifting method was utilized for three-dimensional pavement detection [24]. An improved Active Contour Model (ACM) was developed in [25] in order to increase the effectiveness and efficiency of pavement crack detection. An automated pavement inspection system which employs a 3D camera and a structured laser light was used for acquiring dense transverse profiles of a pavement lane surface in [26]. Measurements showed a declining trend of detected cracks with vehicle speed increasing. Developing a new imaging system that can scan pavement surface at highway speed and determine the level of severity of pavement cracking without using any artificial lighting was recommended in another study [27]. An algorithm for the crack width computation in multiple crack structures based on the deformation analysis of triangle meshes is given in [28]. The objective of another research presented in [29] was to obtain an optimal quality of a 3D model using state-of-the-art technologies. A Mobile Mapping System was applied to achieve an accurate 3D model as input data for the creation of BIM (Building Information Model) for road rehabilitation purposes. However, the proposed procedures do not include the usage of a ground camera and a Geographic Information System (GIS) [29]. Vehicle-based mobile laser scanning systems provide a way of collecting three-dimensional point clouds of road environments with high flexibility and precision, but without the usage of nadir camera [30].
Purpose of the study given in [31] was to evaluate the effectiveness of recent mobile technologies for detecting different types of road pavement-surface distresses. Open data available on the crowdsensing-based SmartRoadSense system were compared with the results of two visual methods-data recorded in the Distress Cadastre and the Pavement Condition Index (PCI) recorded by the authors. This method was concluded to be limited by the inability to specify the types of road distresses, because its data are based only on the dynamic parameter of acceleration. This means that the distress must be of sufficient depth in order for the in-car mobile devices to capture appreciable acceleration metrics. Although the effectiveness of the crowdsensing-based SmartRoadSense method varies with the distress type, the system was confirmed to be very efficient for monitoring the most critical road failures. However, the positional accuracy of the system suggested in this paper is much higher than that of the sensors in a smartphone.
The advantage of the novel method presented in this paper is a combined use of laser scanning data and image data, and the capability to detect all types of road defects with an adequate level of accuracy. While the other authors suggest the detection of certain defect types, defects with defined minimum length or area, this method is comprehensive and broadly applicable. It allows derivation of a multitude of geometric features including point, line and polygon defects with feature attributes of all types. The approach presented here is flexible and suitable for further applications, such as footways, cycle paths, traffic islands and other neighboring surfaces. In addition, this paper proposes a method for storing defect data in a database with additional information regarding each defect separately. For example, besides many specific attributes for each defect, an image is automatically assigned to the defect. Every user has access to the exacted image of defect. The image helps workers to find defects outside in the field and makes road maintenance faster. Also, the presented approach to data collection, storage and crack detection provides a comprehensive overview of the road condition and opens up the possibility of further analysis and updating that uses a versioning system which further facilitates the option of tracking changes with time stamps.
The suggested methodology for road defects detection is here described in detail. It is divided into three sections: data acquision methodology, detailed visual inspection methodology and preparation of the final product. Fig. 1 presents the steps of the suggested approach, with their coherent explanation throughout the chapter.
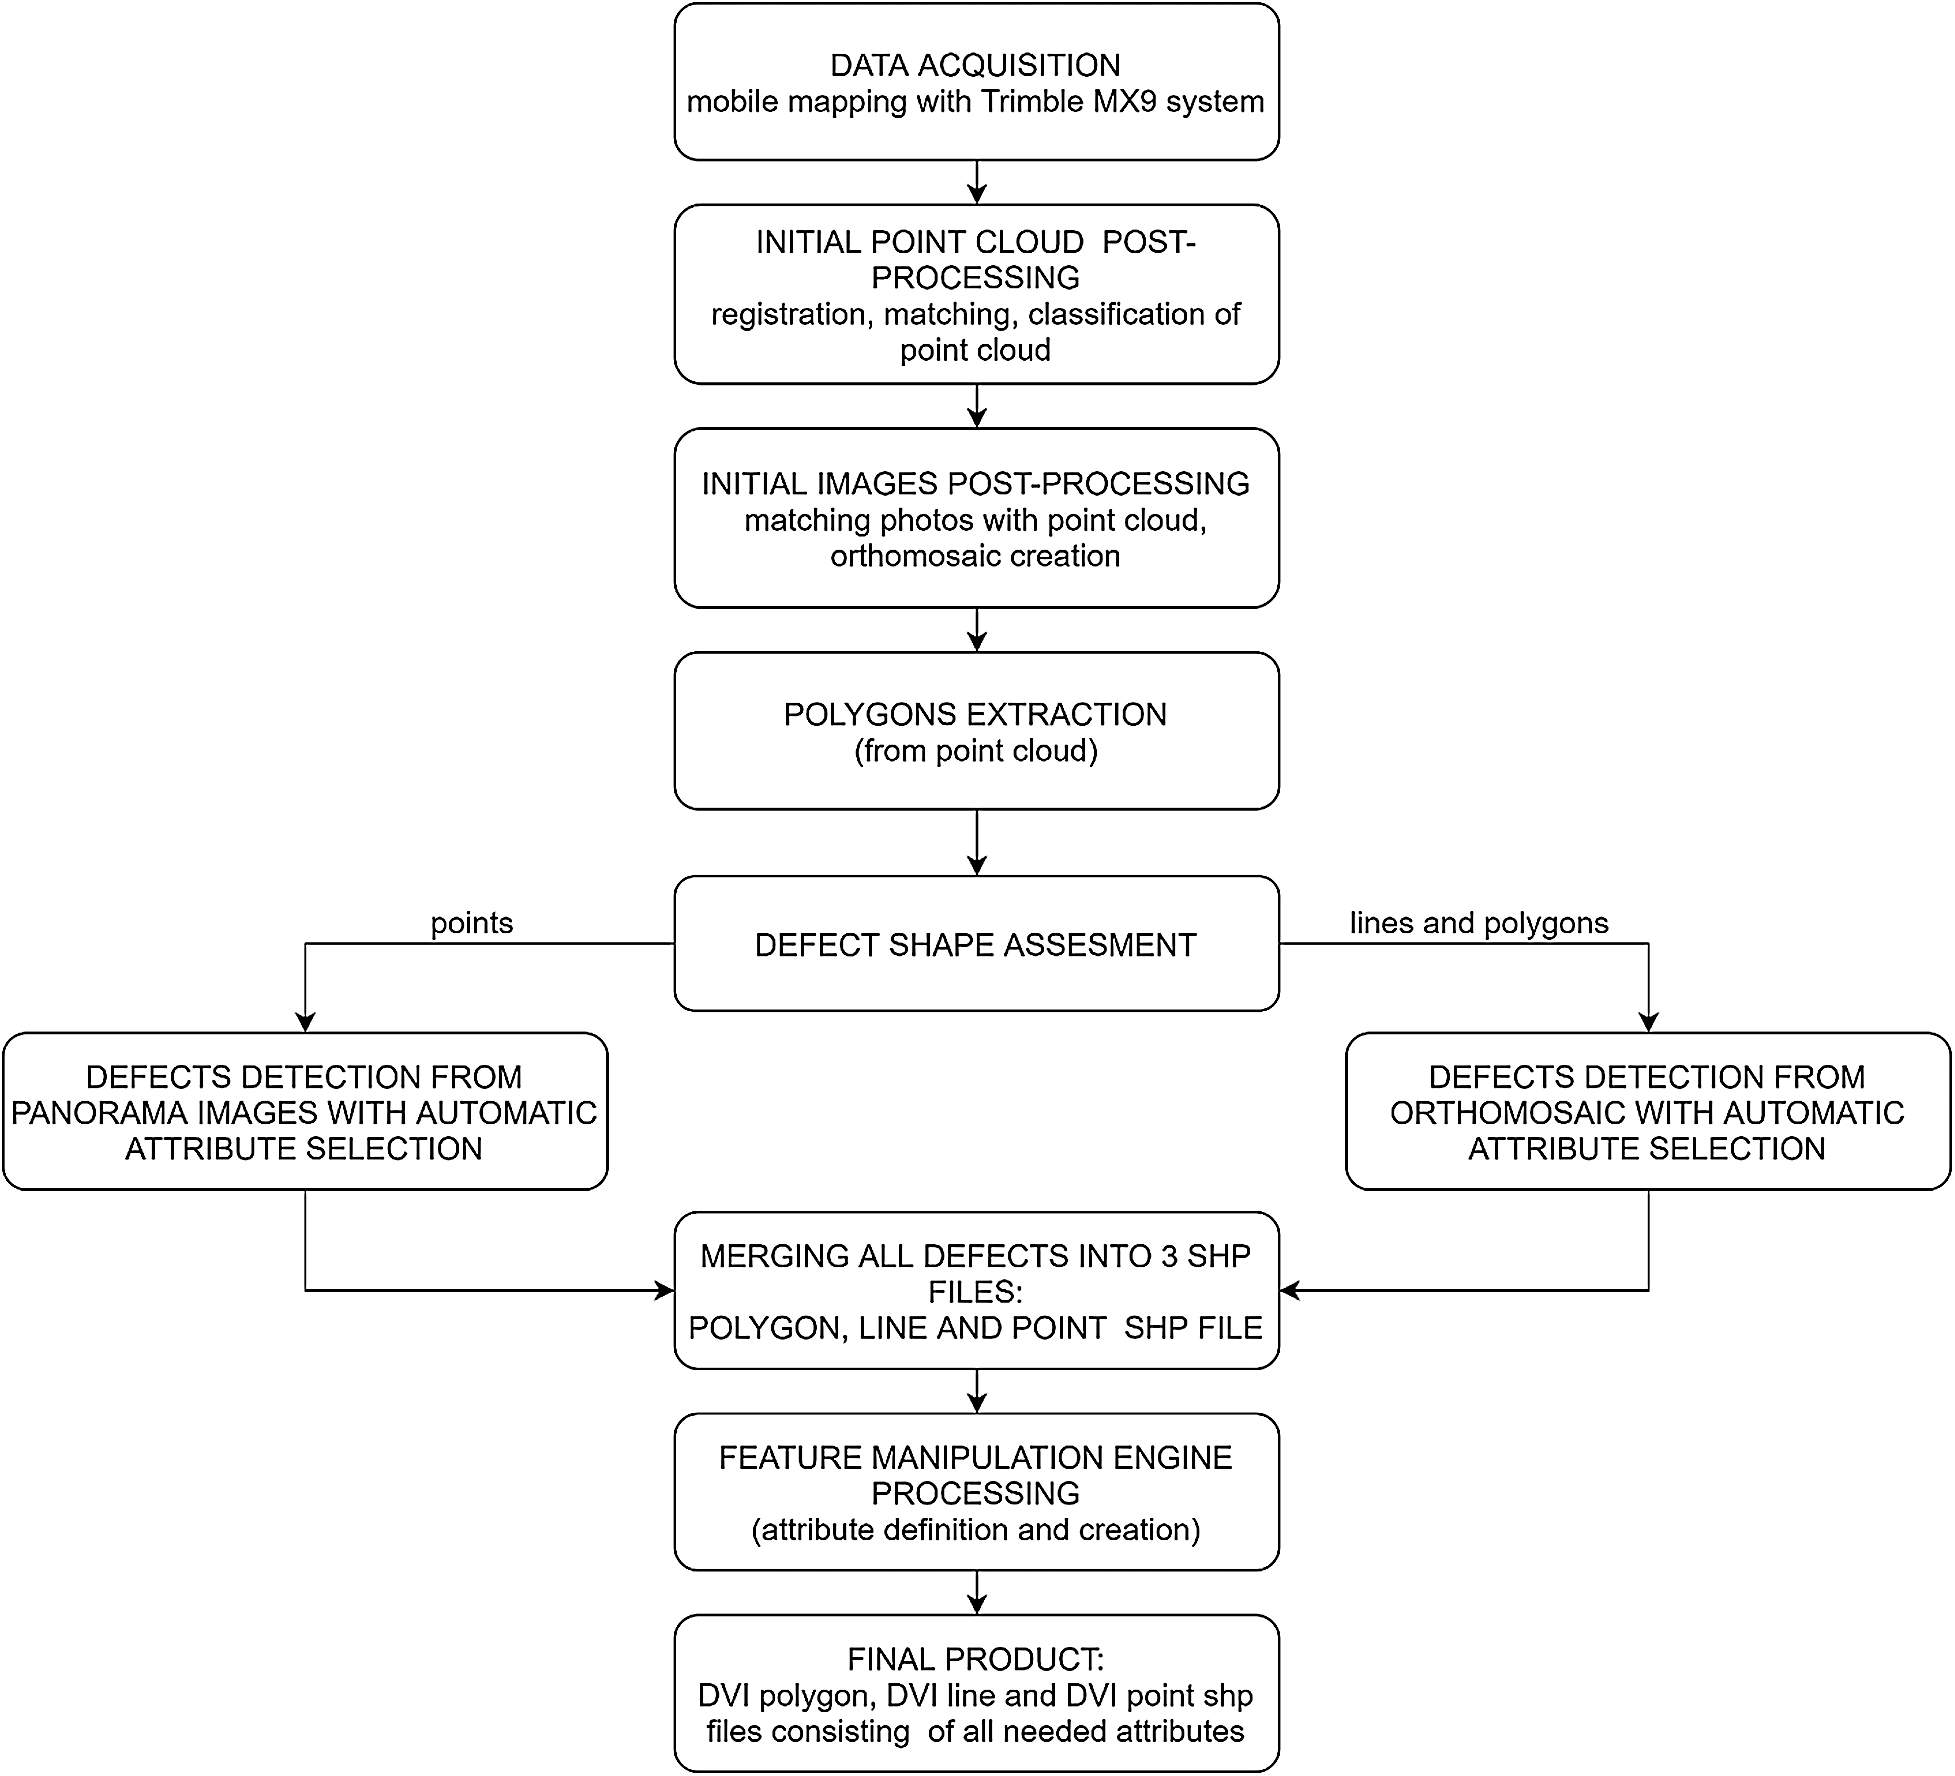
Figure 1: The flowchart of the presented method from data acquisition to the final product of detected road defects
2.1 Data Acquisition Methodology
In projects of maintaining road infrastructure, assessing road conditions is of great importance. The first step in road defect detection projects is data collection. Data collection can be conducted manually or automatically. One of the most appropriate procedures for automatic data collection is the Mobile Mapping technology. Mobile Mapping is used for various highway/road inventory data collection tasks for gathering the information about, e.g., road markings [32], road edges [33], overpasses [34], manholes and sewer covers [35], zebra crossings [36]. The main advantages of Mobile Mapping Systems are [37]:
• High level of detail of collected data.
• Reduction of work time and costs for surveying tasks in the field.
• Derivation of additional spatial data and other various attributes from the collected data.
• The possibility for the files to be archived and used later, even after years, to get additional information.
• Easy adaptation and exploitation of collected data for diverse purposes.
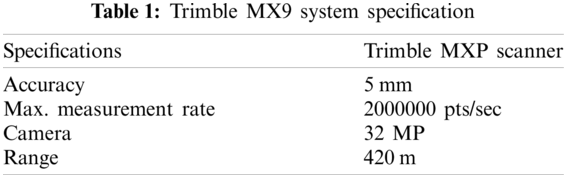
Depending on the requested outcome, defined by the application, the used measuring system can provide a high number of points per second. The Trimble MX9 Mobile Mapping System (MX9) is capable to record about 2,000,000 points per sec [38]. The MX9 has a high overlap between neighboring runs. However, the acquisition of unnecessarily dense data would slow down surveying and post-processing. Therefore, the acquisition settings of the system should be conscientiously selected according to the purpose and unnecessary driving distances need to be avoided. Mission planning prior to measurements is crucial to obtain high-quality results with the lowest memory requirements possible.
The primary output of Mobile Mapping System are images and point clouds [37]. The point clouds are considered to be the essential outcome of an MMS. Recently, images have become more significant for visualizations and the creation of stitched high-resolution maps.
Data collection in the presented project was performed using Trimble MX9 mobile mapping system Tab. 1. The MX9 is typically mounted on the roof of a vehicle and it rapidly captures laser scans along with both panoramic and multi-angle images. The MX9 allows to a mass rich and immersive data driving at highway speed. This avoids the need for expensive road closures and eliminates the risks related to land surveying along busy highways with dense traffic. The captured data was processed with integrated office software tools to gather the data required for deriving further products [38]. Puente et al. [39] carried out an analysis on the current performance of certain outstanding mobile terrestrial laser scanning systems, including Trimble MX9.
A procedure for a detailed visual inspection of roads is presented in this paper in several steps. After data acquisition, the initial post-processing was conducted. This step includes registration, matching and classification of the point cloud. Registration is the process of aligning several point clouds. Matching is necessary to combine multiple overlapping scans of a scene into a single representation for further processing [40]. The classification was conducted to get different classes of point cloud subsets, like low vegetation, high vegetation, objects, ground, etc. Collected images were aligned to point clouds to get a globally matching data set of images and point clouds. The Trimble MX9 system provides back-down, side-view and panoramic images. The back-down images were used for the ortho photo creation for visual road inspection. The parameters for ortho photo creation such as resampling, size and resolution of the ortho photo were adjusted. Those photos were merged to create an orthomosaic. These steps were necessary for the preparation of the data for further manipulation and usage.
2.2 Detailed Visual Inspection (DVI) Methodology
The suggested methodology of defects detection is hierarchically organizedand consists of three main steps:
1. Geometry extraction from the point cloud.
2. Defects detection from panoramic images.
3. Defects detection from orthomosaics.
The primary idea is to divide the surveyed area into the following polygon types: carriageways, footways, cycle paths, shoulders and traffic islands. In the first step, all polygons were extracted from the classified point cloud where each polygon represents one type of inventory. A specific layer was created for each polygon type: carriageway, footway, cycle path, shoulder (i.e., verge) and traffic island. These polygons were digitized in 2D and the attributes in a form of text referring to their corresponding materials were placed into the pictoral representation of every polygon (Fig. 2). This information was aimed at being used laterfor determining the position of a particular defect, i.e., whether the detected defect is on the concrete footway, asphalt carriageway, grass island etc.
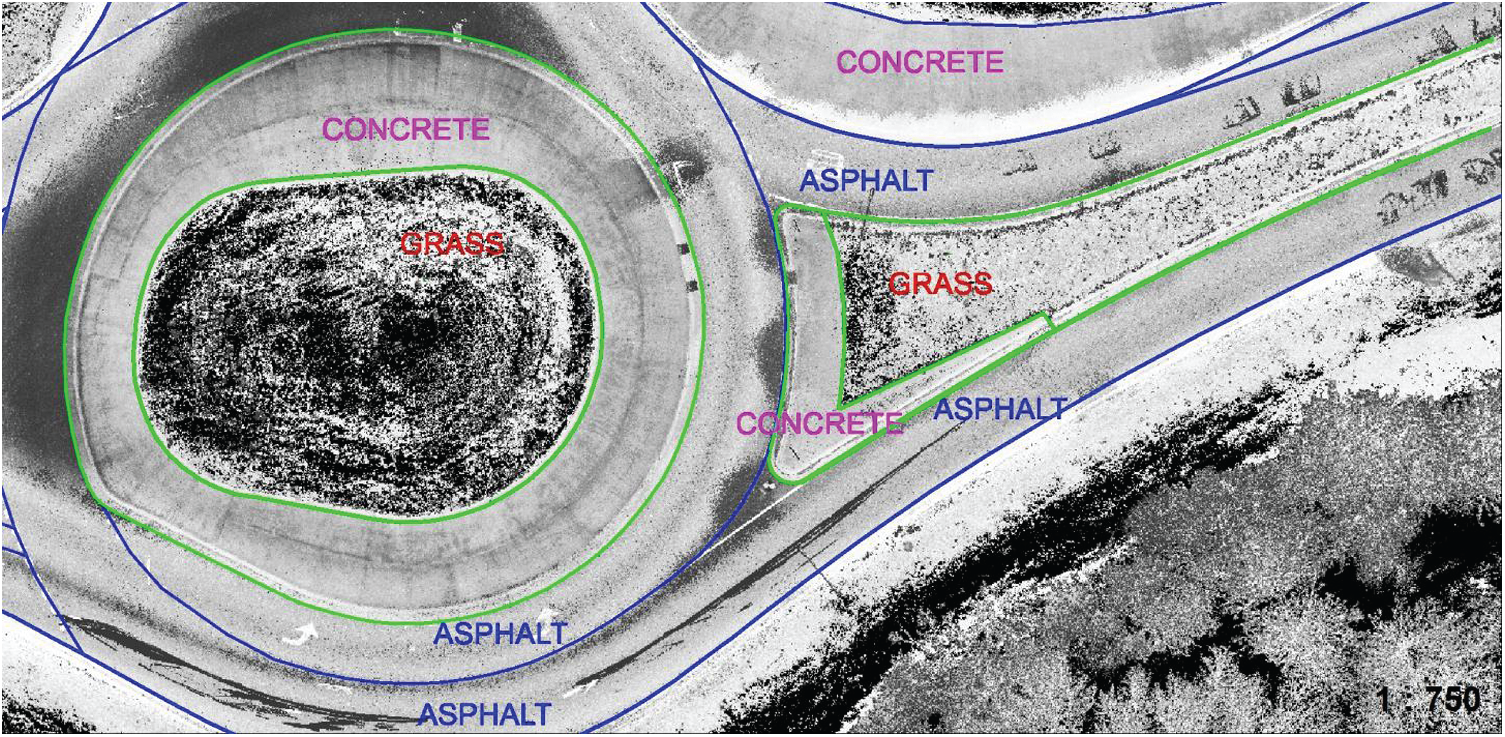
Figure 2: Polygon digitization of different types of road surface (green color refers to traffic islands and blue color to carriageways)
After the extraction of all spatial entities, the defect detection was initiated in the second step. The procedure comprises a visual inspection of the whole area and extraction of road defect features as polygons, lines or points. During this step, portions of images were extracted to obtain a visual representation of defects. Each image was stored with a unique ID. Some defects were extracted from panoramic images, while the others were extracted from the created orthomosaic. This depends on the defect geometry: all points were detected from panoramic images (Fig. 3) and all lines and polygon defects were extracted from the orthomosaic.
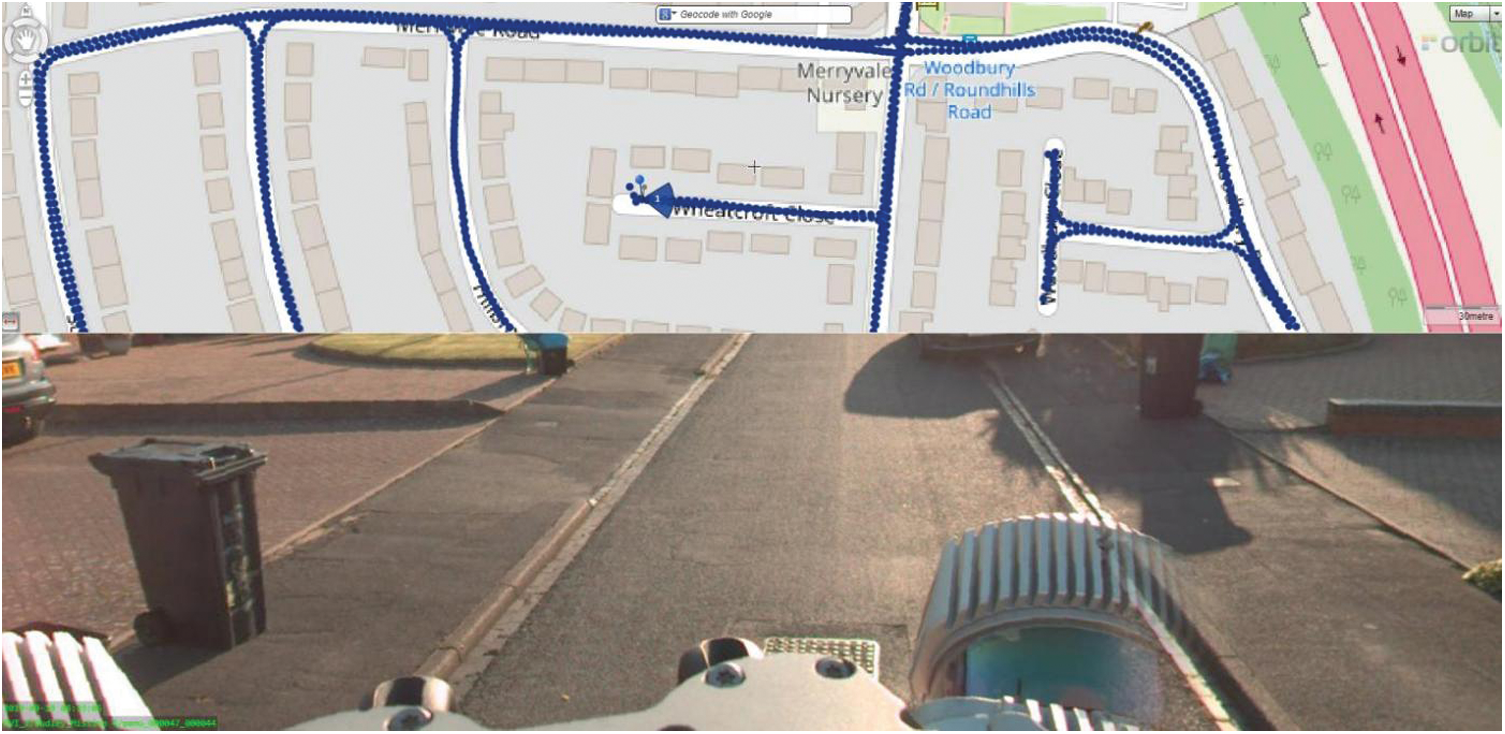
Figure 3: MMS data in OrbitGT Software. The upper part of the figure shows an Open Street Map with panoramic image positions (blue). The lower part of the figure shows a view of the road surface from the MMS
The presented approach makes use of a high-quality panoramic camera. Point defects are effortlessly recognized from panoramic images and thus easily extracted. The operator simply places a geometric object at the area of interest. After the geometric object is created, the operator assigns attributes to the new feature. However, polygon and line defects could be quite long and large, so the extraction from single panoramic images is not likely to be precise enough due to the necessary moving through more images in order to obtain the whole defect. Therefore, the recommendation based on these findings is to extract bigger road damage features as polygons and line geometries and detect them from an orthomosaic. An orthomosaic was imported in QGIS for line and polygon defect detection (Fig. 4).
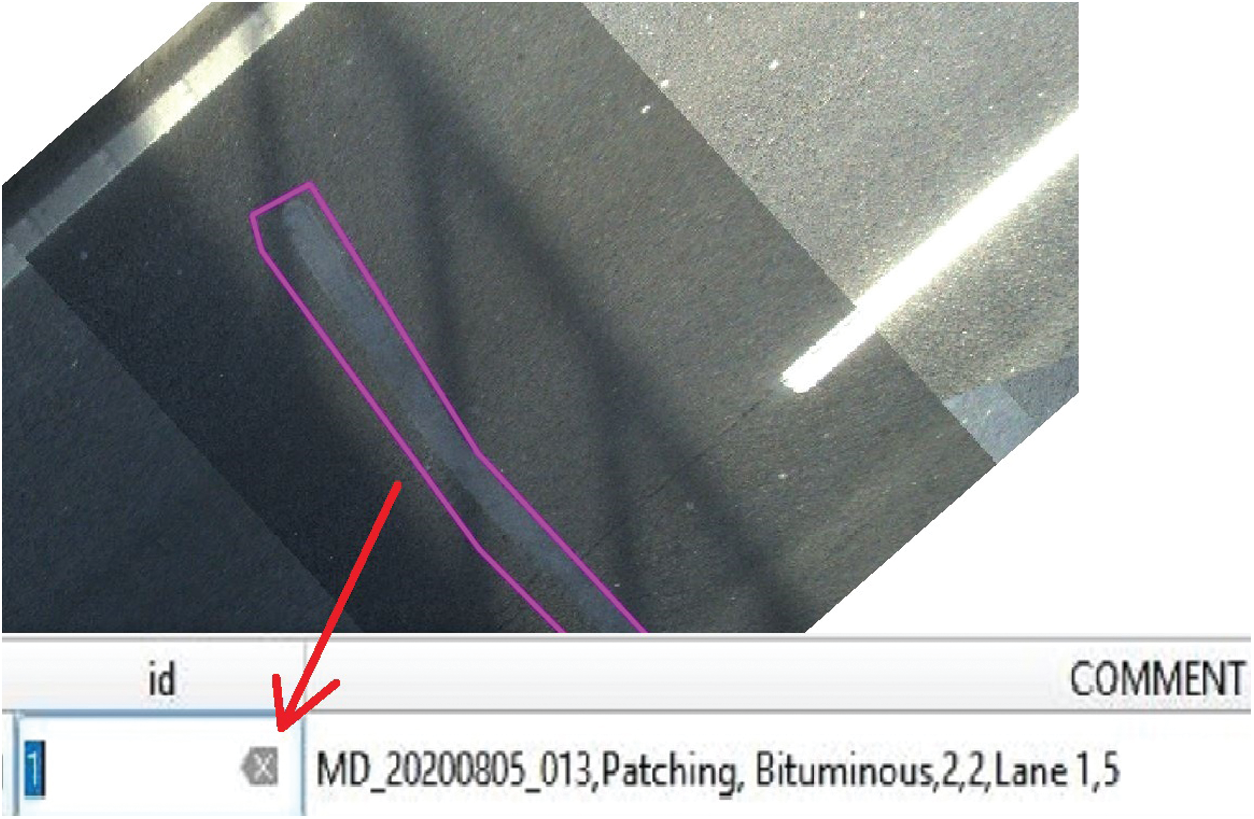
Figure 4: Defect detection from orthomosaic. Patch geometry (purple) with attributes (below the red arrow) on bituminous carriageway in QGIS. The field “COMMENT” contains all the attributes of road damage and will be parsed in Feature Manipulation Engine (FME) later
When defects are detected, all necessary attributes are assigned to each of them. Some of those attributes are defect type, material, size, severity, position and other geometrical values.
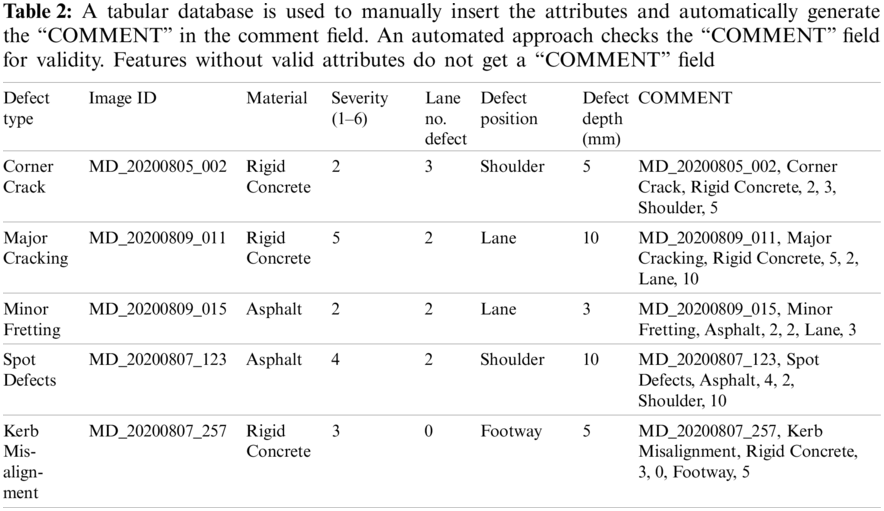
Defect types are: cracking, chip loss, fretting, fatting, left or right recorded edge deterioration severity, surface deterioration, depressed and cracked blocks, spot defects, and others. Considering the materials, defects can be classified as bituminous, concrete, grassed, gravel surface and interlocking paving. Defects are divided by size into minor and major. A severity attribute defines the level of damage in the range of 1–6, where Number 1 refers to a minor damage and Number 6 corresponds to a largely damaged area. This number is defined according to a visual assessment based on the operator's experience. Besides these attributes, each defect is automatically assigned an image and saved in a the database with a unique identifier. This step is done by cropping a damaged area from the orthomosaic and linking the obtained image to the database with all other attributes. Taking all those attributes and their values into account, the defects database is created. This database represents a system of automatic attribute choices (Tab. 2). At first, the operator detects the defect and then chooses the attribute values from the created base. A data container consisting of all elements is automatically generated and assigned to the belonging geometry.
2.3 Preparation of the Final Product
After the detection and marking of road defects, the procedure of creating the final product followed. All measured features were stored as shapefiles. Shapefiles have attribute data containers where all information is connected to the geometry as an attribute in the feature field “COMMENT”. All attributes are separated with a comma.
The created polygons from point clouds were taken as the second input data. Further inputs were the measured geometry objects that describe the type of road—carriageways, footways, cycle paths, shoulders and islands as polygons—and the accompanying text that defines the material type.
The network section shapefile represents a network of roads situated in an area of interest. This shapefile contains a unique name for every street segment. In the final product, each defect contains the attribute that indicates the street where the defect is located. To summarize, the input data was as follows: polygon defects, line defects, point defects, carriageways, footways, cycle paths, verges and islands, along with their respective attributes and the network section.
First, the polygons created from point cloud were assigned a material attribute. After that, the spatial relations defined which polygon each defect belongs to and each defect got two new columns: the surface it is located on and the type of polygon it belongs to. For example, if a defect was found on an interlocking paved island, it got the following attributes: Surface-interlocking paving and polygon-island. After that, the street was assigned to each defect. The assignment was done according to the principle of the closest neighboring street or the street the defect intersects with. The strategy to compute the start and the end of stationary attributes was used.
Filters and geometric calculations of the minimum and maximum defect polygon coordinates were used, i.e., the minimum and maximum distances of that defect from the beginning of the street.
In addition, geometric quantities were calculated in this step, e.g., perimeter, area, diameter, polygon centroid, line length, first and last line coordinates, point coordinates.
The data container created from the defect database was arranged through the software for feature manipulation. Different attribute columns are separated by commas, and they are given appropriate names and formats (double, date, string). The workflow from input to output is presented in Fig. 5.
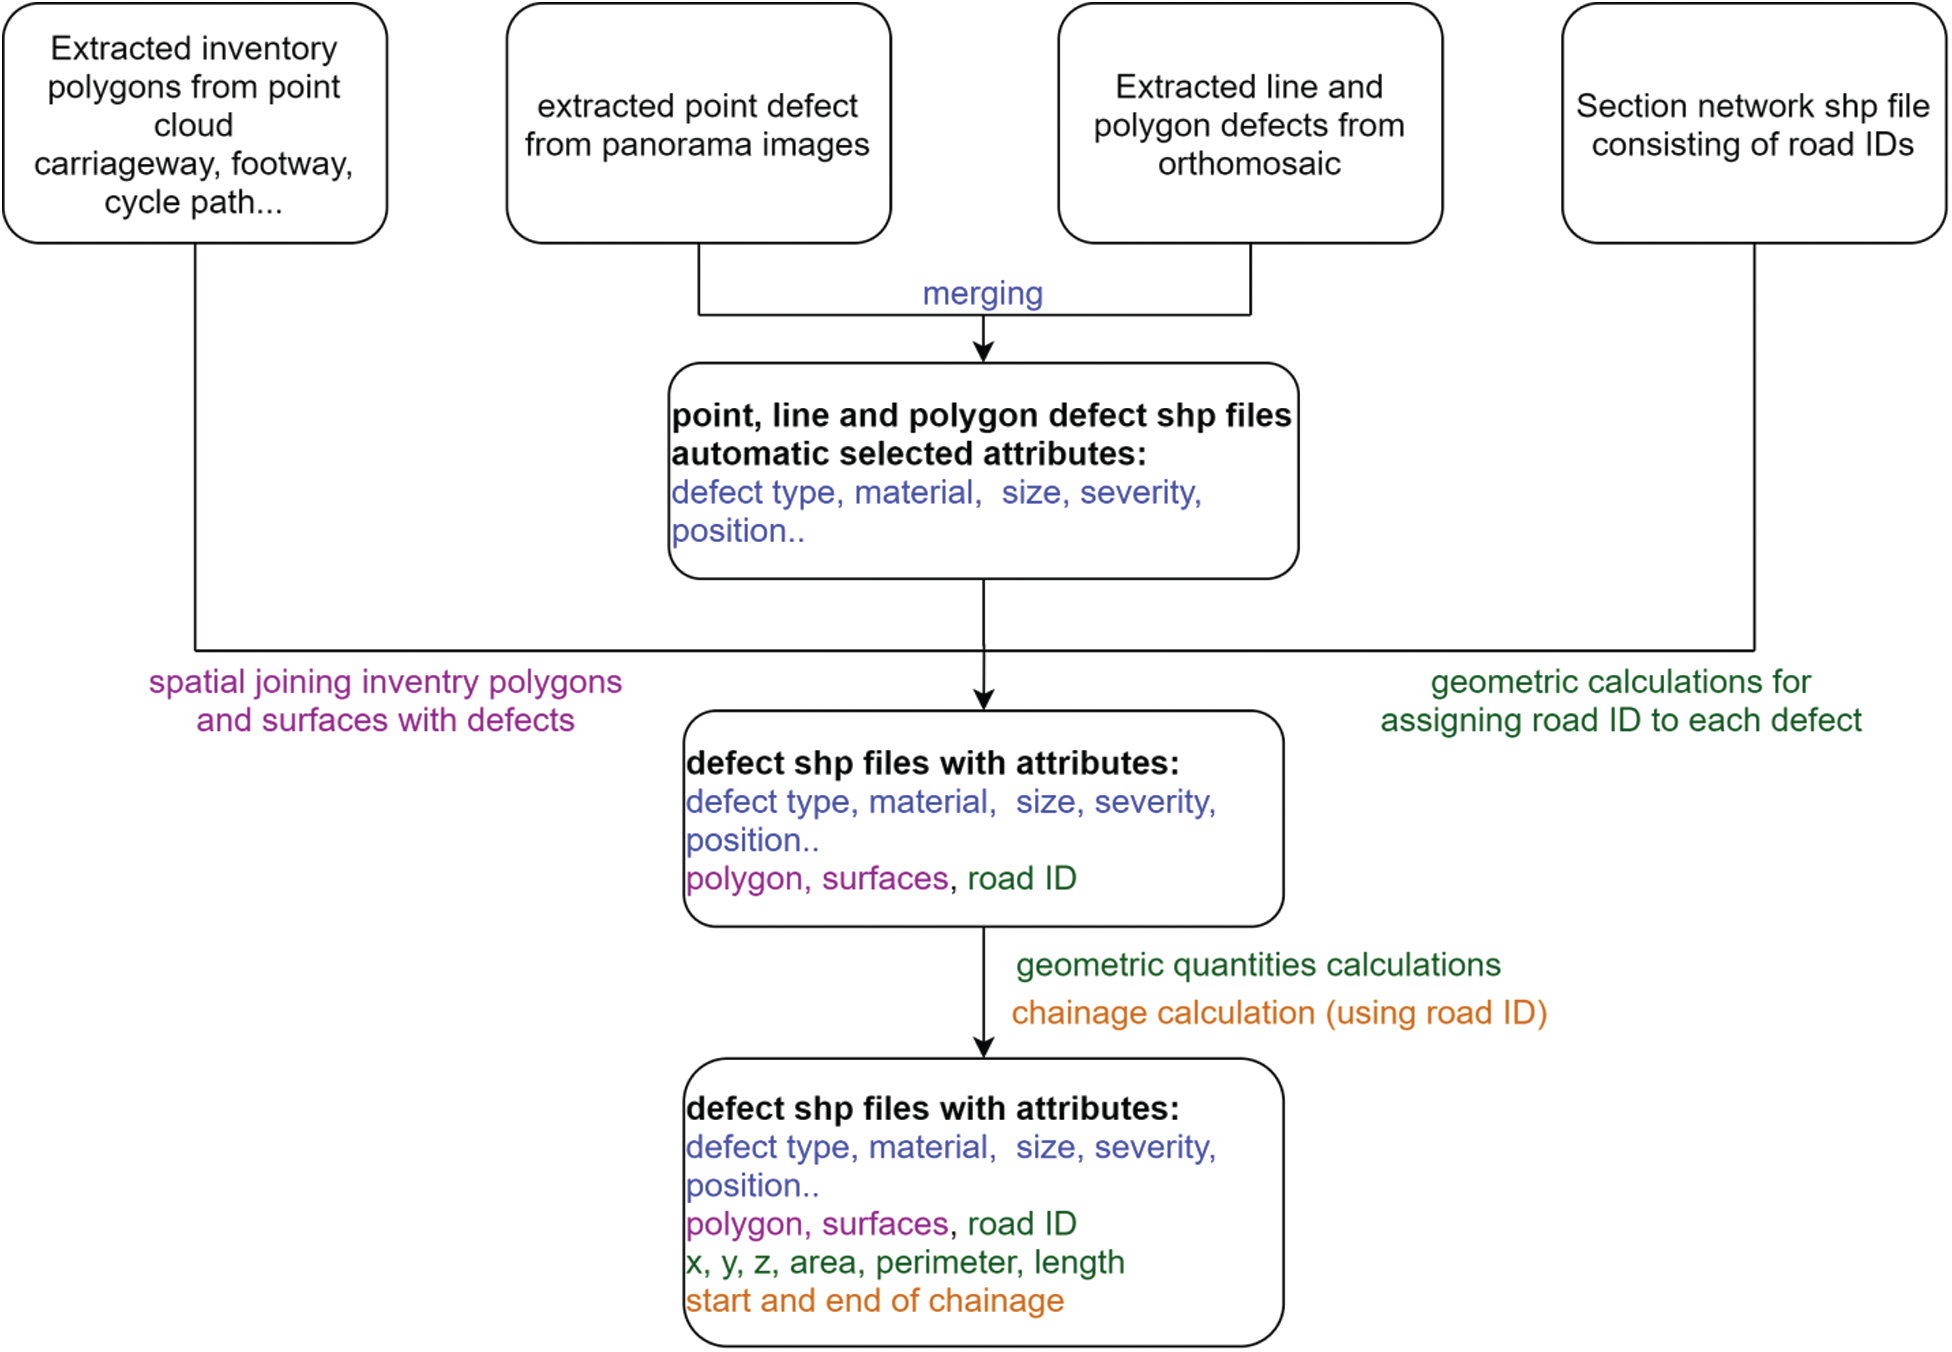
Figure 5: The workflow unites design requirements, captured data, pre-processing and logic to get road defect features with geometry and attributes that an operator can detect in a GIS
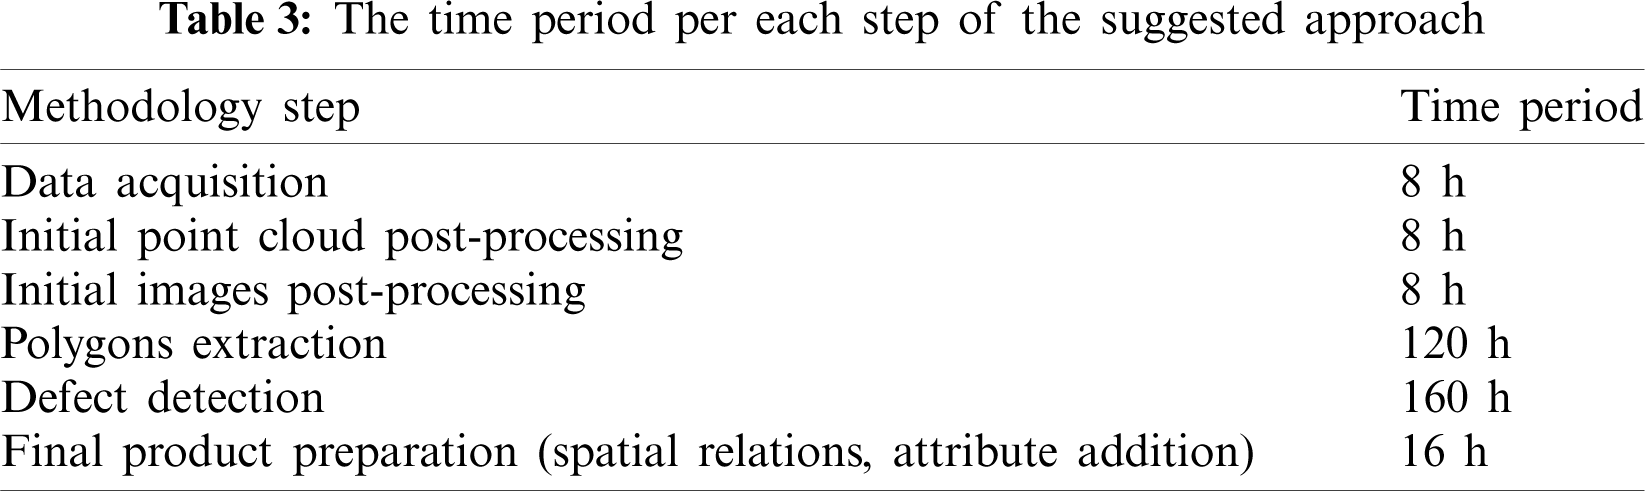
The proposed methodology was tested for 50 km length of roads, surveyed with a Trimble MX9 Mobile Mapping System consisting of two laser scanners, back-down camera and ladybug camera. The obtained point cloud was registered, matched and classified. Then, all photos were matched on the point cloud, and the orthomosaic was produced. Polygons that refer to different areas of road, such as carriageways, footways and cycle paths were extracted from the point cloud with stitched text referring to their material. Then, all photos were matched on the point cloud and the orthomosaic was produced. Simultaneously, panoramic image format suitable for defect detection was created. Afterwards, the defects were detected, extracted and attributes were assigned from the created defects database. Using software processing with different spatial relations and calculations, the final product was prepared. Tab. 3 shows the workflow diagram with time stamps for each step of the process per person. With a large number of sensors, this approach gives the operator the easiest possible access to the situation without being in the field, because it is more comfortable to provide work in the office than in the field. After fast data collection on the site, the operator just has to provide knowledge of road defects, not of surveying techniques or other necessary skills outside this area. That means that the training for operators takes less time comparing to other methods. Currently, there is no a completely automatic defect detection algorithm available. Therefore, using the suggested methodology, the operator can identify everything of relevance to the customer. That makes this methodology widely applicable. There is no need for the operator to think about accuracy because the system already ensures it inherently. There are numerous automatic controls, spatial relations and attribute additions intended for the manual work reduction; moreover, this approach has been proven to be very efficient and fast since it is also possible for more operators to be included and certain steps to be performed in parallel.
The final product of the suggested method is all road defects represented by three shapefiles—polygon DVI, line DVI and point DVI—which can easily be merged in a geodatabase file. They all contain the following information: polygon and surface where they are located, street, start and end of stationary, material, image ID, defect type, severity, defect position, lane number where the defect is located, defect depth and other geometric attributes such as area, length, X, Y, Z coordinates, perimeter.
Part of the area of interest consisting of defects is presented in Fig. 6, while Fig. 7 illustrates one specific polygon defect.

Figure 6: An overview of defects detected on the area of interest: Polygons (red) represent road defects, red lines indicate line defects, blue points symbolize point defects

Figure 7: Polygonal defect (yellow geometry is selected) and the attributes depicted in the table below: Image ID, street ID, start and end of stationary, position, defect type, width, depth, etc.
After this method was conducted on the reference project, the statistcs was calculated. Tab. 4 presents the defect type list with a number of elements for each type. Furthermore, Tab. 4 shows the percentage of defects distribution regarding their geometry type: Most of the cracks have a polygonal structure (82%), followed by a linear signature (17%). The fewest road damages can be represented by point geometry (1%).
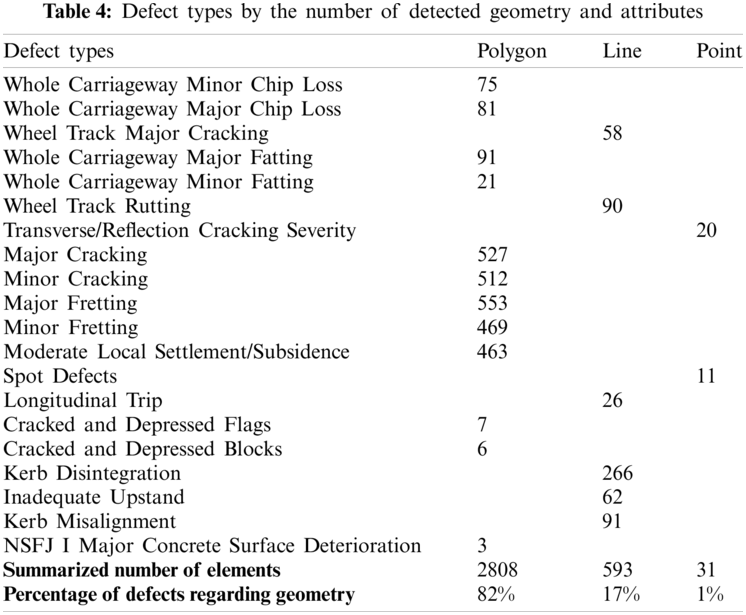
The distribution of defect types regardless of their vector type is given in Fig. 8. Cracking of roads–both major and minor—is frequent: they altogether comprise 30% of all defects, i.e., 1039 detected defects in the example. Major fretting represents 16% of all detected road defects. Surface deterioration was identified to the least extent. Only three defects of this kind were detected in the test area.
The method proposed in the paper allows to easily classify and visualize any attribute of road defects. Even new attributes can be introduced to the presented data structure with ease. The assignment of different colors can be done depending of the corresponding street. Each defect on the same street has been presented in the same color for a better overview.
A great convenience in terms of rich query capabilities is the main advantage. Road defects can be queried as vector types, so a variety of geometric calculations and spatial relations is possible. In addition, each defect has attributes that give more opportunities for sorting the data. Simple but highly relevant queries are easily possible. For instance, to find isolated defects located in the same street, to calculate a distribution of defects positioned just on a footway, to select all major defects in a district with a particular surface type like asphalt, etc. Similarly, taking into account that images are assigned to each defect, every operator can instantly see what the detected defect exactly looks like. This is a huge benefit for maintenance. The classified defects in a vectorized map in QGIS are shown in Fig. 9. Road damage types are labeled inside the detected polygons according to type and severity number. The color indicates a degree of damage - green refers to a slight road damage, whereas red demonstrates a seriously damaged area.

Figure 8: Distribution of road defect types categorized by number of feature attributes

Figure 9: Classified defects in a vectorized map in QGIS
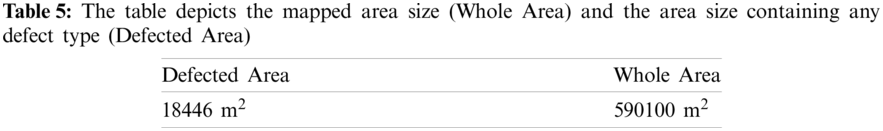
Tab. 5 displays the area of defects on roads comparing to the total area of roads. This example shows why it is necessary to have an optimized process for road defect detection, especailly when the time effort for driving a vehicle equipped with a laser scanner in the suggested methodology is taken into account in comparison to manual classification and geocoding of road defects by road workers in such a large area.
Another segment of importance is the surveying system which provides high-quality data along with the software used for data manipulation. Having this type of data, it is easy to update the road defect database or add photos and point clouds that are obtained after a certain period of time.
A new methodology for combined processing and analysis of point clouds and images to create a database of road defects is presented. To obtain final high-quality results, MMS that enables the combined measurement of point clouds and images from different angles was used. This allows to implement a database containing defects characterized as spatial and non-spatial entities. Visual defect representations in a form of images provide people who deal with maintaining road infrastructure with a fast overview. This method of data collection and analysis has considerable advantages compared to manual approaches of data collection on site by classical land surveying: 1) less time is required for data collection and processing, 2) the data contain more information, 3) the data can be used to extract defects and further information in a periodic or non-periodic reissue. The final result is highly accurate and precise because it is obtained from laser scanning acquisition technology. Compared to other traditional methods, the methodology presented in this paper provides achieving higher work efficiency along with time and resources saving which represent an increasingly important aspect of contemporary life and business. Further research focuses on improved surveying techniques to enhance the overall accuracy and open-source software to make the described processes freely available without the cost of proprietary software. Nevertheless, the proposed approach leads to remarkably accurate and high quality results regarding detected road defects. Further combination of open data, Open Source software and Mobile Mapping data has the potential for detecting even more types of features. It is not only restricted to road defect detection. The findings suggest that this approach can be successfully employed for a number of applications. It has a great potential to be exploited when gathering training data for the new technologies Machine Learning and Deep Learning.
All the obtained information could be used for an acquisition in the Virtual reality of the real scene. For example, an avatar that walks down the road and marks road defects can be created. This would ease the understanding of the scene (i.e., project assignment related to the area of interest) because of all the available information that conveys the impression of the experience in the real world.
Funding Statement: The project presented in the paper is published with kind permission of the contributor. The original data were provided by DataDEV Company, Novi Sad, Republic of Serbia. The paper presents the part of research realized within the project “Multidisciplinary theoretical and experimental research in education and science in the fields of civil engineering, risk management and fire safety and geodesy” conducted by the Department of Civil Engineering and Geodesy, Faculty of Technical Sciences, University of Novi Sad.
Conflicts of Interest: The authors declare that they have no conflicts of interest to report regarding the present study.
1. Mukupa, W., Roberts, G. W., Hancock, C. M., Al-Manasir, K. (2016). A review of the use of terrestrial laser scanning application for change detection and deformation monitoring of structures. Survey Review, 49(353), 99–116. DOI 10.1080/00396265.2015.1133039. [Google Scholar] [CrossRef]
2. Layek, S., Singh, R. K., Villuri, V. G. K., Koner, R., Soni, A. et al. (2020). 3D reconstruction: An emerging prospect for surveying. Applications of geomatics in civil engineering, Lecture notes in civil engineering. Springer, Singapore. [Google Scholar]
3. Kuzmić, T., Ninkov, T., Bulatović, V., Vasić, D., Davidović, M. (2017). Modern geodetic methods with application in the environmental management and its protection. 7th International Symposium on Environmental and Material Flow Management, pp. 59–70. Bor, Serbia. [Google Scholar]
4. Davidović, M., Vasić, D., Batilović, M. (2020). The usage of mobile laser scanning in detail visual inspection. FIG Working Week 2020 Smart Surveyors for Land and Water Management. Amsterdam, Holland: FIG OICRF. [Google Scholar]
5. Mancini, F., Piras, M., Ruotsalainen, L., Vacca, G., Lingua, A. (2020). The impact of innovative and emerging technologies on the surveying activities. Applied Geomatics, 12, 1–2. DOI 10.1007/s12518-020-00302-x. [Google Scholar] [CrossRef]
6. Okine, A., Adarkwa, O. (2013). Pavement condition surveys—Overview of current practices. Pavement Index Methods, 19716(302), 1–71. [Google Scholar]
7. Wang, J., Jin, F. X. (2013). Precision estimation of mobile laser scanning system. Survey Review, 42(317), 270–278. DOI 10.1179/003962610X12747001420302. [Google Scholar] [CrossRef]
8. Wang, Y., Chen, Q., Zhu, Q., Liu, L., Li, C. et al. (2019). A survey of mobile laser scanning applications and key techniques over urban areas. Remote Sensing, 11(13), 1–20. DOI 10.3390/rs11131540. [Google Scholar] [CrossRef]
9. Kukko, A., Kaartinen, H., Chen, Y. (2012). Multiplatform mobile laser scanning: Usability and performance. Sensors, 12, 11712–11733. DOI 10.3390/s120911712. [Google Scholar] [CrossRef]
10. Joerin, F., Musy, A. (2006). Land management with gis and multicriteria analysis. International Transactions in Operational Research, 7, 67–78. DOI 10.1111/j.1475-3995.2000.tb00185.x. [Google Scholar] [CrossRef]
11. Fedra, K. (1999). Urban environmental management: Monitoring, GIS and modeling. Computers, Environment and Urban Systems, 23(6), 443–457. DOI 10.1016/S0198-9715(99)00038-1. [Google Scholar] [CrossRef]
12. Karimipour, F., Delavar, M. R., Kinaie, M. (2005). Water quality management using gis data mining. Journal of Environmental Informatics, 5(2), 61–72. DOI 10.3808/jei.200500047. [Google Scholar] [CrossRef]
13. Robinson, M., Alexander, C., Jackson, C., McCabe, C., Crass, D. (2010). Threatened archaeological, historic, and cultural resources of the Georgia coast: Identification, prioritization and management using GIS technology. Geoarchaeology: An International Journal, 25(3), 312–326. DOI 10.1002/gea.20309. [Google Scholar] [CrossRef]
14. Radopoulou, S. C., Brilakis, I. (2016). Automated detection of multiple pavement defects. Journal of Computing in Civil Engineering, 31(2), 04016057-1–04016057-14. DOI 10.1061/(ASCE)CP.1943-5487.0000623. [Google Scholar] [CrossRef]
15. Hrůza, P., Mikita, T., Tyagur, N., Krejza, Z., Cibulka, M. et al. (2018). Detecting forest road wearing course damage using different methods of remote sensing. Remote Sensing, 10(4), 1–17. DOI 10.3390/rs10040492. [Google Scholar] [CrossRef]
16. Gui, R., Xu, X., Zhang, D., Lin, H., Pu, F. et al. (2018). A component decomposition model for 3D laser scanning pavement data based on high-pass filtering and sparse analysis. Sensors (Switzerland), 18(7), 1–21. DOI 10.3390/s18072294. [Google Scholar] [CrossRef]
17. de Blasiis, M. R., di Benedetto, A., Fiani, M. (2020). Mobile laser scanning data for the evaluation of pavement surface distress. Remote Sensing, 12(6), 1–25. DOI 10.3390/rs12060942. [Google Scholar] [CrossRef]
18. Zhong, M., Sui, L., Wang, Z., Hu, D. (2020). Pavement crack detection from mobile laser scanning point clouds using a time grid. Sensors (Switzerland), 20(15), 1–20. DOI 10.3390/s20154198. [Google Scholar] [CrossRef]
19. Zhang, D., Zou, Q., Lin, H., Xu, X., He, L. et al. (2018). Automatic pavement defect detection using 3D laser profiling technology. Automation in Construction, 96, 350–365. DOI 10.1016/j.autcon.2018.09.019. [Google Scholar] [CrossRef]
20. Tsai, Y. C. J., Li, F. (2012). Critical assessment of detecting asphalt pavement cracks under different lighting and Low intensity contrast conditions using emerging 3D laser technology. Journal of Transportation Engineering, 138(5), 649–656. DOI 10.1061/(ASCE)TE.1943-5436.0000353. [Google Scholar] [CrossRef]
21. Szulwic, J., Tysiąc, P. (2017). Searching for road deformations using mobile laser scanning. MATEC Web of Conference, vol. 122, pp. 1–7. DOI 10.1051/matecconf/201712204004. [Google Scholar] [CrossRef]
22. Gavilán, M., Balcones, D., Marcos, O., Llorca, D. F., Sotelo, M. A. et al. (2011). Adaptive road crack detection system by pavement classification. Sensors, 11(10), 9628–9657. DOI 10.3390/s111009628. [Google Scholar] [CrossRef]
23. Du, Y., Weng, Z., Liu, C., Wu, D. (2020). Dynamic pavement distress image stitching based on fine-grained feature matching. Journal of Advanced Transportation, 2020, 1–15. DOI 10.1155/2020/5804835. [Google Scholar] [CrossRef]
24. Li, W., Huyan, J., Tighe, S. L., Ren, Q. Q., Sun, Z. Y. (2017). Three-dimensional pavement crack detection algorithm based on two-dimensional empirical mode decomposition. Journal of Transportation Engineering Part B Pavements, 143(2), 1–12. DOI 10.1061/JPEODX.0000006. [Google Scholar] [CrossRef]
25. Li, W., Huyan, J., Tighe, S. L. (2018). Pavement cracking detection based on three-dimensional data using improved active contour model. Journal of Transportation Engineering Part B Pavements, 144(2), 1–18. DOI 10.1061/JPEODX.0000028. [Google Scholar] [CrossRef]
26. Ouyang, W., Xu, B. (2013). Pavement cracking measurements using 3D laser-scan images. Measurement Science and Technology, 24(10), 1–9. DOI 10.1088/0957-0233/24/10/105204. [Google Scholar] [CrossRef]
27. Yao, M., Zhao, Z., Yao, X., Xu, B. (2015). Fusing complementary images for pavement cracking measurements. Measurement Science and Technology, 26(2), 1–13. DOI 10.1088/0957-0233/26/2/025005. [Google Scholar] [CrossRef]
28. Liebold, F., Maas, H. (2020). Strategy for crack width measurement of multiple crack patterns in civil engineering material testing using a monocular image sequence analysis. Journal of Photogrammetry, Remote Sensing and Geoinformation Science, 88, 219–238. DOI 10.1007/s41064-020-00103-2. [Google Scholar] [CrossRef]
29. Al-Bayari, O. (2019). Road rehabilitation using mobile mapping system and building information model. Jordan Journal of Earth and Environmental Sciences, 10(2), 113–117. [Google Scholar]
30. Yang, B., Liu, Y., Liang, F., Dong, Z. (2016). Using mobile laser scanning data for features extraction of high accuracy driving maps. The International Archives of the Photogrammetry, Remote Sensing and Spatial Information Sciences-XXIII ISPRS Congress–Prague (Czech Republic), XLI-B3, pp. 433–439. DOI 10.5194/isprs-archives-XLI-B3-433-2016. [Google Scholar] [CrossRef]
31. Abbondati, F., Biancardo, S. A., Veropalumbo, R., Dell’Acqua, G. (2020). Surface monitoring of road pavements using mobile crowdsensing technology. Measurements, 171, 108763. DOI 10.1016/j.measurement.2020.108763. [Google Scholar] [CrossRef]
32. Yang, B., Wei, Z., Li, Q., Li, J. (2012). Automated extraction of street-scene objects from mobile lidar point clouds. International Journal of Remote Sensing, 33(18), 5839–5861. DOI 10.1080/01431161.2012.674229. [Google Scholar] [CrossRef]
33. Kumar, P., McElhinney, C. P., Lewis, P., McCarthy, T. (2013). An automated algorithm for extracting road edges from terrestrial mobile LiDAR data. ISPRS Journal of Photogrammetry and Remote Sensing, 85(2013), 44–55. DOI 10.1016/j.isprsjprs.2013.08.003. [Google Scholar] [CrossRef]
34. González-Jorge, H., Puente, I., Riveiro, B., Martínez-Sánchez, J., Arias, P. (2013). Automatic segmentation of road overpasses and detection of mortar efflorescence using mobile LiDAR data. Optics & Laser Technology, 54, 353–361. DOI 10.1016/j.optlastec.2013.06.023. [Google Scholar] [CrossRef]
35. Yu, Y., Li, J., Guan, H., Wang, C., Yu, J. (2014). Automated detection of road manhole and sewer well covers from mobile LiDAR point clouds. IEEE Geoscience and Remote Sensing Letters, 11(9), 1549–1553. DOI 10.1109/LGRS.2014.2301195. [Google Scholar] [CrossRef]
36. Riveiro, B., González-Jorge, H., Martínez-Sánchez, J., Díaz-Vilariño, L., Arias, P. (2015). Automatic detection of zebra crossings from mobile LiDAR data. Optics & Laser Technology, 70, 63–70. DOI 10.1016/j.optlastec.2015.01.011. [Google Scholar] [CrossRef]
37. Batilović, M., Vasić, D., Kuzmić, T., Davidović, M. (2019). Importance of Image and Point Cloud Matching of Road Infrastructure Feature Extraction. FIG Working Week 2019–Geospatial Information for a Smarter Life and Environmental Resilience, Hanoi, Vietnam: FIG OICRF. [Google Scholar]
38. Trimble Geospatial (2020). https://geospatial.trimble.com/products-and-solutions/trimble-mx9. [Google Scholar]
39. Puente, I., González-Jorge, H., Martínez-Sánchez, J. (2013). Review of mobile mapping and surveying technologies. Measurements, 46(7), 2127–2145. DOI 10.1016/j.measurement.2013.03.006. [Google Scholar] [CrossRef]
40. Gojcic, Z., Zhou, C., Wegner, J. D., Wieser, A. (2019). The perfect match: 3D point cloud matching with smoothed densities. IEEE/CVF Conference on Computer Vision and Pattern Recognition (CVPRpp. 5540–5549. Long Beach, CA, USA. [Google Scholar]
 | This work is licensed under a Creative Commons Attribution 4.0 International License, which permits unrestricted use, distribution, and reproduction in any medium, provided the original work is properly cited. |