| Computer Modeling in Engineering & Sciences |
DOI: 10.32604/cmes.2021.016499
ARTICLE
Evaluation and Forecasting of Wind Energy Investment Risk along the Belt and Road Based on a Novel Hybrid Intelligent Model
1Department of Economic Management, North China Electric Power University, Baoding, 071000, China
2Department of Industrial and Business Management, Chang Gung University, Taoyuan, Taiwan
*Corresponding Author: Liping Yan. Email: ylp20212021@126.com
Received: 11 March 2021; Accepted: 13 May 2021
Abstract: The timely and effective investment risk assessment and forecasting are of great significance to ensure the investment safety and sustainable development of wind energy along the Belt and Road. In order to obtain the scientific and real-time forecasting result, this paper constructs a novel hybrid intelligent model based on improved cloud model combined with GRA-TOPSIS and MBA-WLSSVM. Firstly, the factors influencing investment risk of wind energy along the Belt and Road are identified from three dimensions: endogenous risk, exogenous risk and process risk. Through the fuzzy threshold method, the final input index system is selected. Secondly, the risk evaluation method based on improved cloud model and GRA-TOPSIS is proposed. Thirdly, a modern intelligent model based on MBA-WLSSVM is designed. In modified bat algorithm (MBA), tent chaotic map is utilized to improve the basic bat algorithm, while weighted least squares support vector machine (WLSSVM) adopts wavelet kernel function to replace the traditional radial basis function to complete the model improvement. Finally, an example is given to verify the scientificity and accuracy of the model, which is helpful for investors to make fast and effective investment risk forecasting of wind energy along the Belt and Road. The example analysis proves that the proposed model can provide reference and basis for investment corpus to formulate the investment strategy in wind energy along the Belt and Road.
Keywords: The belt and road; wind power industry; investment risk evaluation; improved cloud model; GRA; TOPSIS; WLSSVM; MBA
COVID-19 triggers a deep reflection on the relationship between man and nature and the sustainable development of human social and economic activities [1]. The future of global climate governance is more concerned. In the face of the challenges of global climate change and sustainable development of mankind, mankind has a common destiny. All countries in the world should work together to cope with difficulties and challenges, jointly promote green energy cooperation to a Higher quality, and contribute more to the inclusive recovery of the world economy and sustainable development of energy production. The Belt and Road Initiative is an important link to bring all countries along the Belt and Road together to meet the above challenges [2]. At the same time, green sustainable development is also an important concept of the Belt and Road [3]. Over the past seven years since the Belt and Road Initiative was proposed, there has been close cooperation in the field of energy, especially the renewable clean energy cooperation represented by wind power. However, the complex and changeable investment environment along the Belt and Road increases the risk of investment in renewable clean energy industry such as wind power [4]. If we fail to identify and evaluate the investment risk of local related industries timely and effectively, it will have a serious negative impact on the sustainable development of these industries. Therefore, how to identify risks in time, analyze risks accurately, evaluate risks scientifically and deal with risks rationally has become the key to the success of investment in these industries [5]. Considering that wind power is a typical representative of renewable clean energy, this paper selects the wind power industry investment risk as the research object, in order to provide reference for the investment risk research of related industries in countries along the Belt and Road.
It is not common to assess the investment risk of wind power industry along the Belt and Road. But already many risk evaluations regarding investment are in other industries. As the risk assessment research, the risk assessment research of wind power industry has many similarities with other industries, such as the common risk sources. Therefore, combing and analyzing the research literature of investment risk evaluation of other industries has reference significance for studying the investment risk evaluation of wind power industry along the Belt and Road. Literature [6] sorts out the main risks thag affect the investment of infrastructure construction projects along the “the Belt and Road” from the aspects of political, economic and legal, and puts forward targeted risk management measures to reduce investment losses, while this study did not quantify the risk. Literature [7] uses the coefficient of variation and fuzzy comprehensive evaluation method to study and evaluate the investment risks of countries in different regions from five aspects: economic foundation, solvency, social elasticity, political risks and relations with China, and gives corresponding investment suggestions, and prompts matters which need high attention, in order to provide suggestions for Chinese enterprises when they invest along the line and reduce investment risks. Literature [8] constructs a comprehensive evaluation model which is based on grey relational grade and ranking method approaching ideal solution to assess the power investment risk. Literature [9] analyzes the life cycle risk factors of thermal power investment projects in Karachi, Pakistan, and evaluates overseas thermal power investment projects by using fuzzy evaluation method and analytic hierarchy process. Literature [10] divides the systematic and non-systematic risks that affect foreign investment of high-speed rail, and comprehensively measures the risk level through the fuzzy comprehensive evaluation model, in order to provide ideas for evaluating and avoiding the risk level of foreign investment about high-speed rail. Literature [11] puts forward the multi-classification fusion technology which is based on SDM, constructs the early warning model of direct overseas investment risk of mineral resources-based enterprises, and puts forward suggestions on management and control strategies. However, the evaluation method used in the above research is slow in calculation and difficult to implement dynamic evaluation. In addition, the methods used in the above studies also make it difficult to make rapid and accurate predictions of risk. We can also find that the research at home and abroad mainly focused on the macro level, and the risk assessment of overall overseas investment may only involve a few industries such as thermal power, high-speed rail and mineral resources, while the research on risk assessment of wind power industry is relatively few. Moreover, some problems such as unclear boundary and incomplete coverage are existed when identifying risk sources. Therefore, it is necessary to comprehensively identify the investment risk indicators of wind power industry.
With regard to evaluation methods, existing research has made important contributions to investment risk evaluation. Literature [12] introduces rough set and fuzzy C-means clustering to evaluate the risk of countries along the line, and obtains the specific investment risk grade distribution in different regions. Literature [13] uses the improved analytic hierarchy process to establish a hierarchical model to evaluate project risks, and puts forward preventive measures and suggestions from six aspects: reducing exchange rate fluctuations, optimizing asset allocation, broadening financing channels, establishing new financing models, reducing decision-making error rates, and improving technical level. Literature [14] fully considers the internal and external factors of engineering investment, decomposes the investment composition based on WBS, and constructs an investment risk evaluation model by optimizing the kernel function parameters and regularization parameters of LSSVM through particle swarm optimization, which can accurately evaluate the engineering investment risk and provide reference basis for engineering investment risk control. Literature [15] assess the distribution network project financing lease risk through constructing a comprehensive evaluation index system and a model based on cloud model and entropy weight method, and the evaluation results are intuitive and realistic. By combing and analyzing the relevant risk evaluation methods, it can be found that evaluation methods mainly include traditional and modern intelligent. The traditional ones include subjective evaluation methods and objective evaluation methods. The subjective ones mainly contain expert evaluation, fuzzy analytic hierarchy process and so on; the objective analysis methods include grey relational analysis, entropy weight method, matter-element extension, cloud model, etc. [16]. Modern intelligent evaluation methods mainly include artificial neural network evaluation method, SVM evaluation method, LSSVM evaluation method, etc. [17]. In view of traditional evaluation methods is more mature, the calculation result is more accurate and the calculation process is more complicated, while modern intelligent evaluation method can deal with massive real-time data quickly and accurately. this paper combines traditional evaluation method and modern intelligent evaluation method to analysis the investment risk of wind power industry in the countries along the line. It improves entropy weight method combined with subjective and objective factors to get the index weight, and uses cloud model to characterize randomness and fuzziness of risks as well as integrates GRA and TOPSIS to comprehensively evaluate and rank multiple schemes, so that the investment risks of wind power industry with different schemes can be effectively evaluated. Among the modern intelligent evaluation methods, the artificial neural network evaluation method is easy to fall into local optimum, moreover, it is training speed is slow [18]. When the SVM is applied to risk assessment, it needs to transform the solving process into a quadratic programming process through the transformation of kernel function. This method reduces the efficiency and the convergence accuracy is not high [19], while the least square support vector machine method uses the least square linear system as the loss function to avoid the quadratic programming process. The evaluation problem is transformed into the solution of equations, and the inequality constraint is transformed into equality constraint, which increases the accuracy and speed of evaluation [20]. However, it should be noted that the traditional Gaussian kernel function in LSSVM model is related, even redundant, and its nonlinear processing ability is poor, while the wavelet kernel function has the excellent characteristics of gradually describing data information [21]. Therefore, this paper uses wavelet kernel function to improve LSSVM model for risk assessment. However, the improved LSSVM still defines penalty coefficient and kernel parameters blindly, so it is necessary to select appropriate intelligent algorithm to optimize it. In 2010, Setiadi et al. [22] proposed a new intelligent bat algorithm, which simulates the predatory behavior of bats to search the solution space. Compared with PSO algorithm, the characteristics of this algorithm has the dual nature, on the one hand it is a simple model with a few control parameters and fast convergence speed, on the other hand it is easy to fall into local optimization and poor population diversity. Therefore, this paper uses tent chaotic map to improve the basic bat algorithm so as to improve the global convergence.
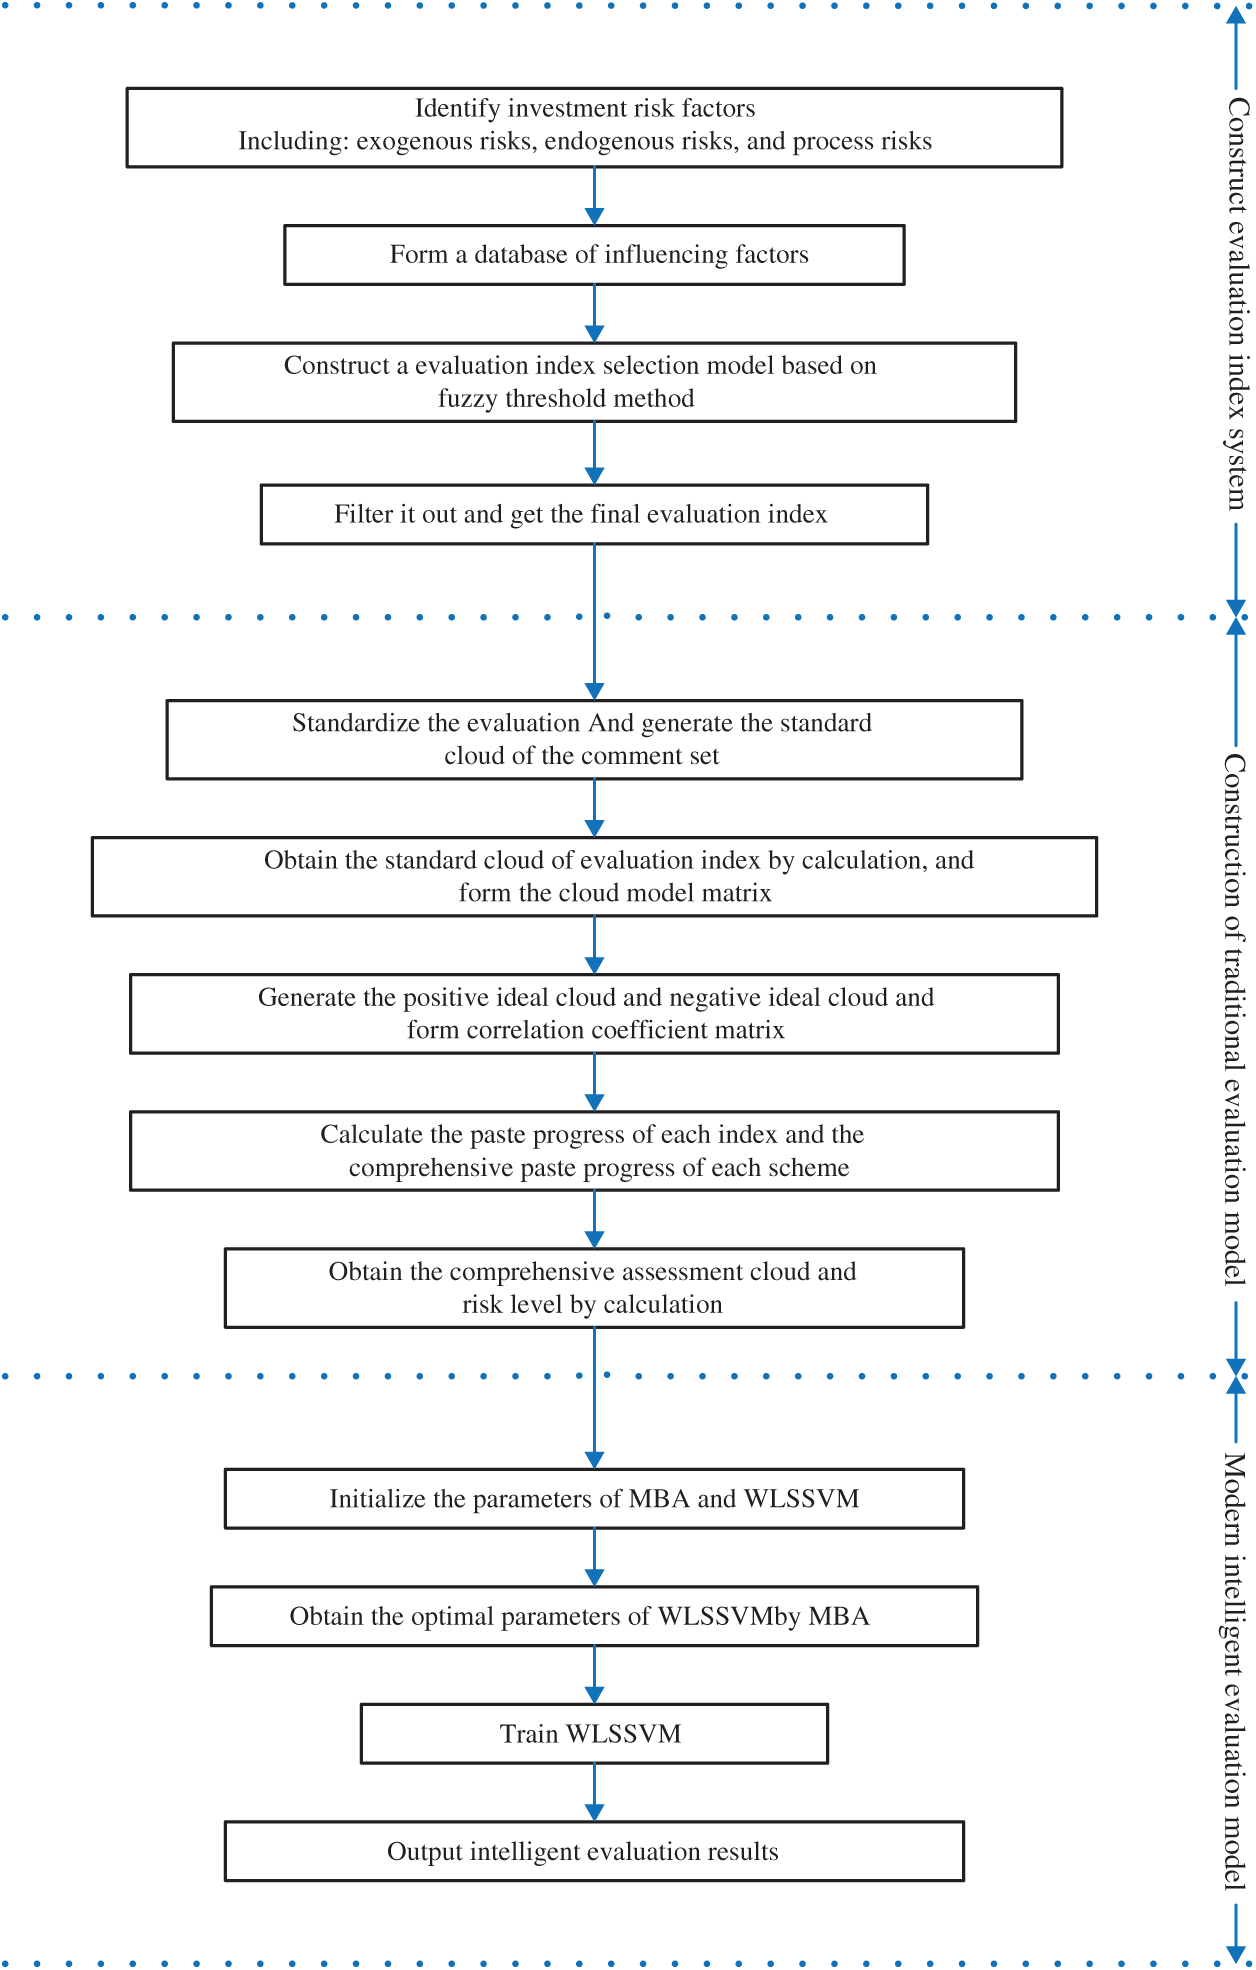
Figure 1: The overall evaluation process of this paper
To sum up, this paper comprehensively identifies the risk factors faced by wind power industry investment, constructs the risk evaluation index system of wind power industry investment of the regions along the line of “the Belt and Road” through the fuzzy threshold method, and a comprehensive risk assessment model based on improved cloud model combined with GRA-TOPSIS (ICM-GRA-TOPSIS) and MBA-WLSSVM is proposed. The overall evaluation process of this paper is shown in Fig. 1. The rest of the paper is arranged as follows: In Section 2, the risk factor database is identified, and the risk assessment index system is built through fuzzy threshold method. In Section 3, the risk assessment model based on traditional evaluation method and modern intelligent evaluation method is constructed. In Section 4, an empirical research is conducted to test the scientificity and availability of the model. Section 5 summarizes the research results.
2 Construction of Investment Risk Evaluation Index System of Wind Power Industry along the Belt and Road
2.1 Identification of Influencing Factors on Investment Risk
With the green energy resources construction along the line of “the Belt and Road,” China has continuously increased its investment in wind power industry in countries along the route. However, from perspective of the overall investment environment of the countries along the line, the political environment of each country is complex, the cultural diversities are obvious, and the economic development foundation is relatively inconsistent. At the same time, as the main body of foreign investment behavior, the internal strategic planning, organizational structure, operation mode and industrial characteristics of enterprises will affect their investment benefits. In the process of investment, the project quality, schedule, cost, etc., will also bring risks to the advancement of the project [23]. To sum up, along the line of “the Belt and Road” the risk source of the wind power industry mainly include three aspects: exogenous risks, endogenous risks, and process risks. The specific contents of the influencing factor library is shown in Fig. 2.
(1) Exogenous risks
1) Political risks
The political risks faced by wind power industry investment of the regions along the line of “the Belt and Road” mainly refer to the risks that damage the safety and benefits of overseas investment when the social order changes and the political form is subverted. Whether the political environment is stable is an significant target to judge the political risk of the invested country. The specific sources are reflected in the political stability, political democracy, political efficiency, influence degree of big country, external conflict, internal conflict and corruption control of host country.
2) Economic risks
Economic risks refer to the macro-economic risks and micro-economic risks that may cause losses to the project or affect the income during the whole life cycle of wind power industry construction. The specific sources are reflected in economic growth rate, inflation index, debt level, financial freedom, trade freedom, exchange rate fluctuation, interest rate risk, tax adjustment, market competition and the proportion of non-performing loans of banks.
3) Social risks
Countries along the Belt and Road are characterized by weak infrastructure construction, great cultural differences and strong religious atmosphere [24], which have a certain impact on China’s foreign investment. The specific sources include religious culture, ethnic conflicts, capital and personnel mobility restrictions, labor market regulation, unemployment, violence and crime costs, commercial regulation and education level.
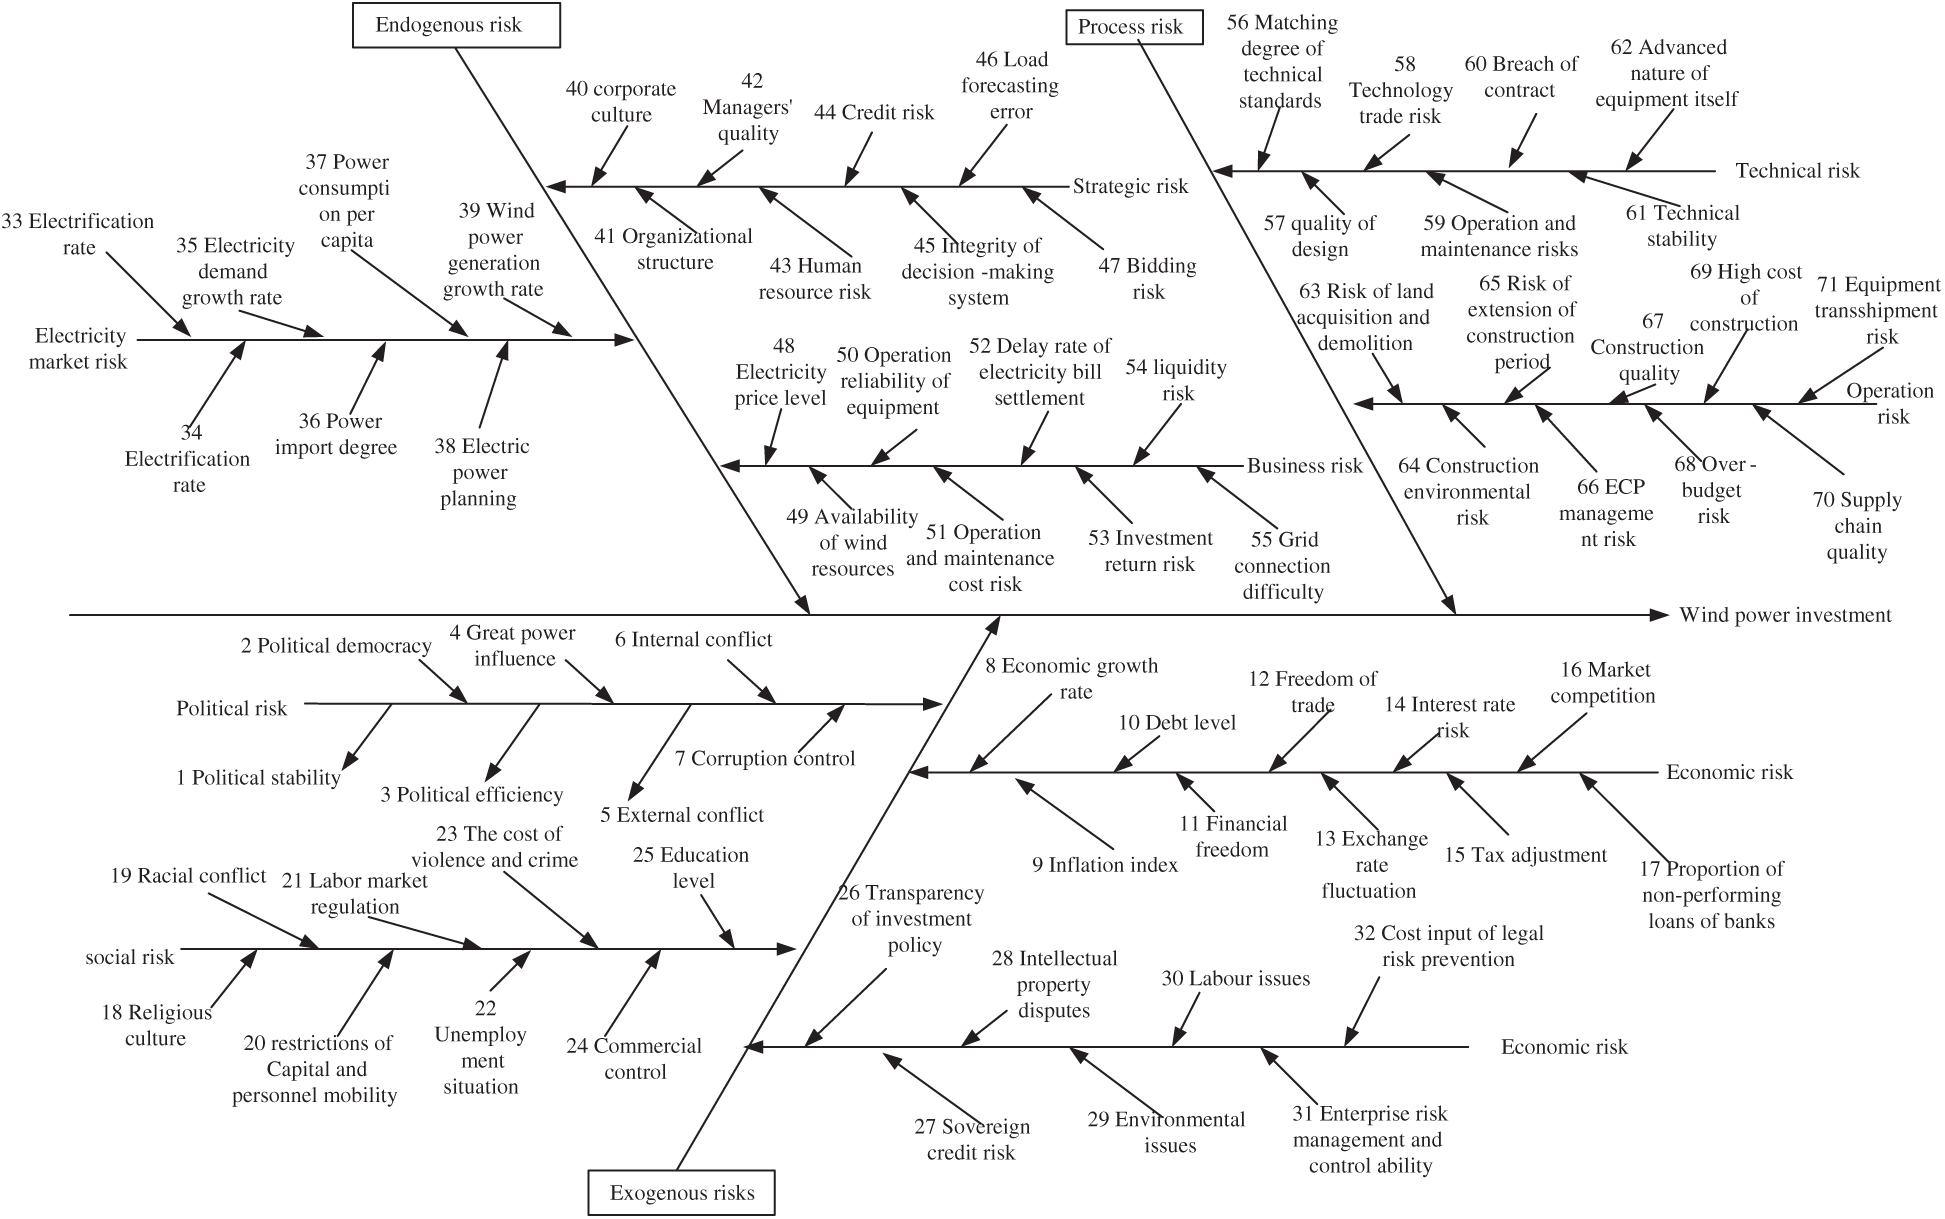
Figure 2: Influencing factors library of investment risk evaluation on wind power industry
4) Legal risks
There are more than 60 countries along the line of “the Belt and Road.” In addition to the different legal systems in the areas along the line [25], the laws and regulations in the fields of business investment, accounting standards, tax laws and taxes, institutional regulations, and infrastructure are very different from those in different countries.
This has brought uncertain legal risks to investors of wind power industry of the regions along the line of “the Belt and Road” it is reflected in the transparency of investment policies and sovereign credit risks, intellectual property disputes, environmental protection issues, labor issues, enterprise risk management and control capabilities, as well as legal risk prevention costs.
(2) Endogenous risks
1) Electricity market risk
Electricity market risk is the uncertainty of investment income which is caused by the fluctuation of supply, demand and market share of electricity. The specific sources include electrification rate, electrification rate, power demand growth rate, power import degree, per capita power consumption, power planning and wind power generation growth rate.
2) Strategic risks
Strategic risks are the risks brought by managers’ mismanagement, management level and other element in the process of management of investment enterprises, management risk is reflected in every link of the management system [26]. The specific sources include corporate culture, organizational structure, manager’s quality, human resource risk, credit risk, perfection of decision-making system, load forecasting error and bidding risk.
3) Operational risks
Operational risk is a risk category that may have an uncertain impact on the cost and benefit of projects in operation abroad. The specific influencing factors include electricity price level, wind resource availability, equipment operation reliability, operation and maintenance cost risk, delay rate of electricity bill settlement, investment return risk, flow risk and difficulty of grid connection.
(3) Process risks
1) Technical risk
Transnational wind power industry has carried out a lot of fruitful exploration and practice in key technology research, equipment manufacturing, engineering construction, planning and scheme formulation, etc. However, due to the differences in technical standards and design concepts in different countries, certain risks often arise. The specific sources are reflected in the matching degree of technical standards, design quality, technical trade risk, operation and maintenance risk, contract breach, technical stability and advanced nature of equipment itself.
2) Construction risk
As the project is located overseas, there are great uncertainties in local land policy, environment, manpower, construction management quality and win-win situation of equipment and materials. These bring certain risks to the construction of the project. The specific sources are land acquisition and demolition risk, construction environment risk, construction period extension problem, ECP management risk, construction quality, over-budget risk, high cost risk and supply chain quality and equipment transshipment risk.
2.2 Construction of Evaluation Index Screening Model
Fuzzy threshold method is based on fuzzy set theory, which evaluates the evaluation object by single factor, and then gives a comprehensive evaluation result by considering the weight of each factor. Firstly, according to all indexes of the evaluation object, establish the evaluation grade. Then, the degree of each index belonging to corresponding grade is calculated to form a membership matrix, which is also a fuzzy relation matrix. Finally, the matrix and the weight vector are fuzzily operated and normalized to obtain the fuzzy recognition value of each index. According to the actual needs, the fuzzy threshold is set. When the fuzzy recognition value is higher than the preset threshold, the corresponding index is the key index of risk assessment. The process of fuzzy threshold method is shown in Fig. 3. The concrete steps are as follows:
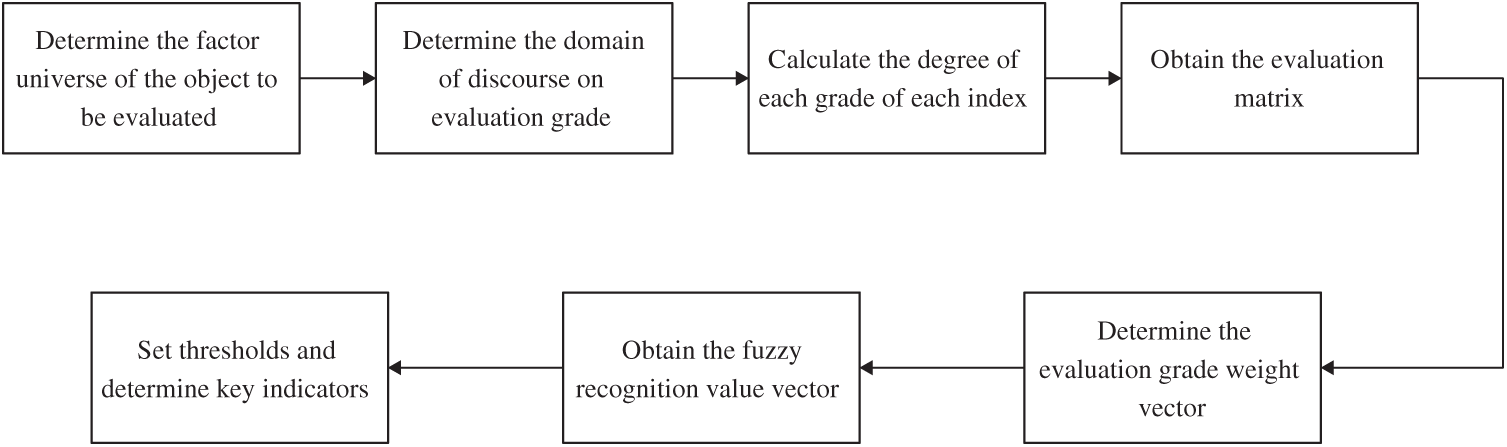
Figure 3: The process of fuzzy threshold method
(1) Determine the factor universe of the object to be evaluated
(2) Determine the domain of discourse on evaluation grade
(3) According to the membership function, calculate the degree of each grade of each index, and obtain the evaluation matrix.
First, N experts are invited to evaluate each index
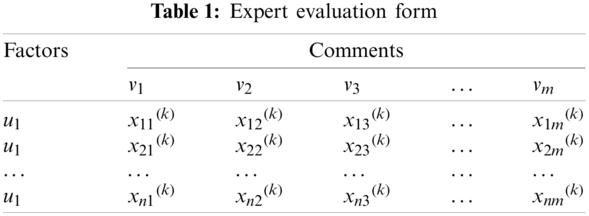
The evaluation matrix R can be obtained as follows:
where
(4) Determine the evaluation grade weight vector:
(5) Obtain the fuzzy recognition value vector by point multiplication of the evaluation matrix and the weight vector
(6) According to experts and practical experience [27], set thresholds and determine key indicators.
2.3 Evaluation Index System Construction Results
The key factors are extracted from 71 main factors by fuzzy threshold method. First of all, each index is judged by expert scoring, and it is assumed that the judgment grades are very important, important, general, unimportant and very unimportant. For each factor, each of six experts scores and uses a ten-point system to determine its importance. The larger the score, the more critical the factor is. For example, on “the political stability of the host country,” six experts need to score it separately, and describe its importance with 8, 9, 10, 7, 8 and 9.
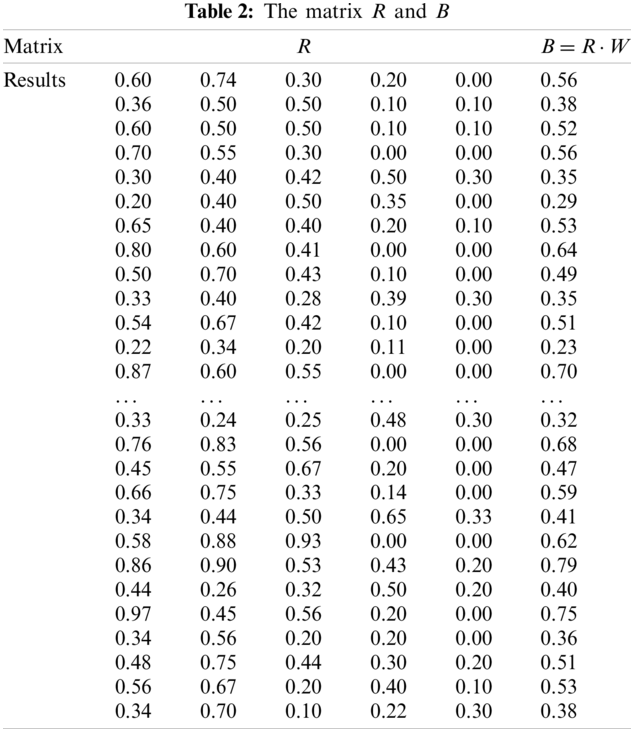
According to the scoring results, the membership degree of each factor to different judgment levels is obtained, and the fuzzy evaluation matrix R (see the left matrix below) is constructed. The index sequence in matrix row vector is determined according to the label in fishbone diagram of Section 2.1. The weight vector is
According to experts and practical experience, the threshold is set at 0.45.
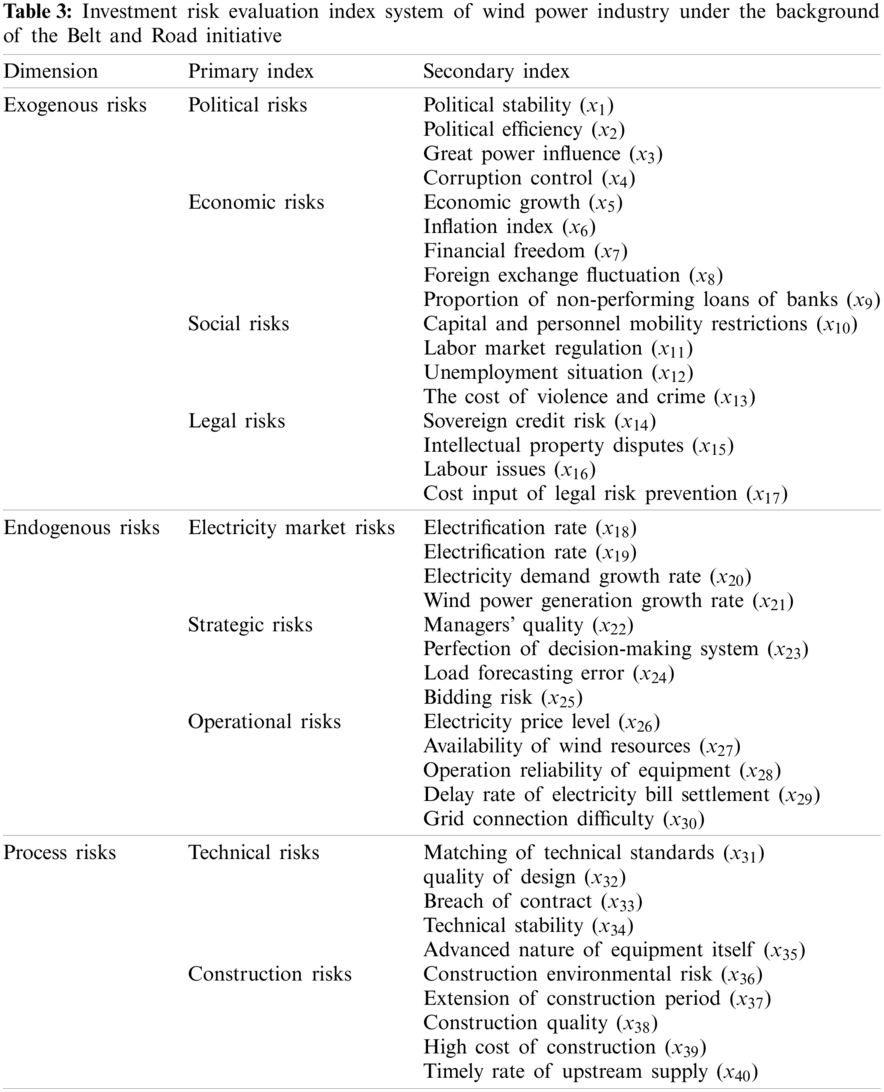
According to the results of fuzzy threshold method, the influence of each factor on the investment risk is different. The factors with threshold greater than 0.45 are selected as key factors, and the investment risk evaluation index system of wind power industry under “the Belt and Road” is obtained. Tab. 3 shows the results. It should be noted that the indicators obtained from the screening in this paper are all comprehensive indicators. For example, indicator x27 has taken the seasonal factors into account, and it has been considered in a comprehensive manner on an annual basis.
3 Construction of Investment Risk Evaluation Model of Wind Power Industry along the Belt and Road
3.1 Standardized Treatment of Evaluation Index
There are three methods of index standardization: linear processing, logarithmic function processing and power function processing.
Linear transformation is suitable for the raw data with infinite terminal value or the data that is obtained indirectly. Mj is the maximum value of the original data of the j-th index; mj is the minimum value of the original data of the j-th index, and the conversion function is as follows:
Logarithmic function is mainly applied to basic data when the extreme values are different orders of magnitude, which means the values are more than three times the quartile difference). Use natural logarithm method to complete the standardization. The conversion function is as follows:
Power function is mainly applied to basic data when extreme values or singular values are same order of magnitude. After this type of data is directly standardized, the discrimination is still small. Therefore, after adopting the natural power exponential function, standardize the obtained function value. Because some raw data have negative numbers, the power exponent we choosed is 1/3. The conversion function is as follows:
x*ij is the dimensionless data obtained after standardization (positive correlation is taken as x*ij and negative correlation is taken as 10 − x*ij), so the numerical range of x*ij is [0, 10]. Get the matrix
3.2 Traditional Risk Assessment Model Based on Improved Cloud Model and GRA-TOPSIS
Cloud model is a model to solve the problem of conversion between qualitative and quantitative. The concept of language has obvious uncertainty. Traditional probability theory and fuzzy mathematics carry out modeling and analysis from the perspective of randomness and fuzziness, respectively [28]. The cloud model can effectively combine the fuzziness and randomness to analyze, so as to have a comprehensive cognition of things [29].
(1) Definition and digital characteristics of cloud
Let
Cloud model includes three digital characteristics: Expectation
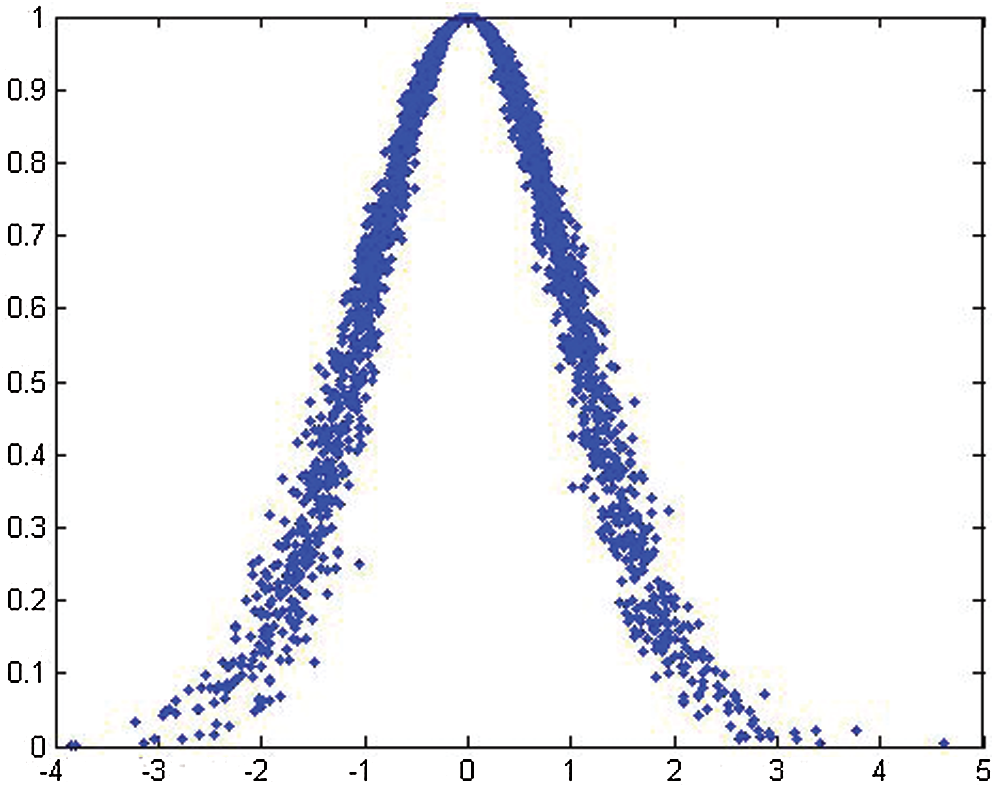
Figure 4: Cloud and its digital characters (Ex = 0, En = 1, He = 0.1)
(2) Cloud generator
Cloud generator is an algorithm for generating cloud drops, it mainly includes forward and reverse cloud generator. The forward cloud generator maps the qualitative information in language values to the quantitative data range and distribution law, which is one of the most commonly used forward generators. Inverse cloud generator effectively converts sample data with precise values into qualitative linguistic values expressed by
a) Generating a normal random number
b) Generate a normal random number
c) Circulate a) and b) until n cloud droplets are generated and then stop.
3.2.2 GRA-TOPSIS Risk Assessment Method
When using TOPSIS method [31] to sort and settle the risk levels, firstly, the indicators are processed by method mentioned in 3.1, so that all indicators are standardized and have the same trend. Secondly, select an ideal solution and a negative ideal solution under each target attribute. In this paper, the ideal solution selects the solution with the highest risk level in 20 countries under each index, and the negative ideal solution is the lowest risk level in 20 countries under each index. Then, the grey correlation coefficient between each index and the highest risk level, and the grey correlation coefficient between each index and the lowest risk level are calculated by using the grey correlation analysis method. Finally, the relative closeness between each index and the index with the highest risk level is calculated. According to the relative closeness degree, the risk degree of each scheme under each index is sorted. The relative closeness is between 0 and 1, and if it is close to 1, the risk level of the scheme is high; and if it is close to 0, the risk level of the scheme is low, so that all the evaluation schemes can be sorted [32].
Among them, in the distance measure of cloud vector distance, 1-norm is used to measure the distance between
3.2.3 Calculation of Index Weight Based on Improved Distance Entropy
Entropy can reduce the influence of subjective factors. This paper uses the concept of distance entropy to obtain the weight of target attributes. Let m is the number of evaluation target, n is the quantity of evaluation index items, the index cloud matrix is obtained by cloud model generation method:
where,
where,
In this paper, the cloud with the greatest expectation is selected, that is, the greatest risk,
According to the extremum property of entropy, the closer the value of
Normalize the distance entropy as
The weight
In which,
3.2.4 Investment Risk Assessment Process of Wind Power Industry Based on Improved Cloud Model and GRA-TOPSIS
Step 1, determine the evaluation index set
Step 2, generate the standard cloud of comment set, and let the interval of comment t be
Step 3, according to expert scoring or actual data statistics, the n sample values of the evaluation index are obtained as follows
(1) Calculate the average value of sample
(2)
(3)
(4)
Step 4, generate the basic cloud of each index. After standardization, the cloud model matrix is obtained:
In this step, the risk level of each index under each scheme can be obtained.
Step 5, get the ideal cloud and negative ideal cloud of each index. Because the standardization process has made the trend of indicators consistent, the ideal cloud is defined as the cloud with the highest expectation among all schemes under each indicator, that is, the cloud with the highest degree of risk; Negative ideal cloud is the cloud with the smallest expected value among all schemes under each index, that is, the cloud with the smallest risk degree [34,35]. The specific calculation formula is as follows:
Step 6, calculate the grey correlation coefficient matrix of each index cloud vector to ideal cloud and negative ideal cloud under each scheme.
where,
Step 7, calculate the closeness of each index under each scheme. According to the index closeness, the risk degree of each investment scheme can be sorted according to the same index [36].
Step 8, Calculate the weight
3.3 Intelligent Risk Assessment Model Based on MBA-WLSSVM
In the basic BA algorithm, each bat represents a feasible solution in all solution. By iteratively updating the frequency, velocity, pulse emissivity and loudness of each bat in the swarm, the optimal solution is searched. The iterative formula of frequency, velocity and position of each bat in BA algorithm is as follows [37]:
where,
Local search is implemented near the current optimal solution to generate
where,
Then, generate random numbers
where,
Compared with PSO algorithm and other swarm intelligence optimization methods, BA algorithm has stronger optimization ability, but at the same time, the disadventages of falling into local optimization and poor population diversity in the late evolution stage are obvious. For the sake of the global convergence of the population, a chaotic bat algorithm based on Tent chaotic mapping is proposed [38].
(1) Tent mapping
The results show that compared with logistic map, Tent mapping has better ergodicity and randomness. The mathematical expression of Tent chaotic mapping is as follows:
(2) Using Tent chaotic mapping to initialize bat position
Compared with the randomly generated initial population, initializing the population by tent chaotic mapping can improve the diversity of bat population, the steps are as follows:
1) Generate
2) According to Eq. (23), a chaotic sequence is generated to form the matrix Z as follows:
where,
3) According to formula (24), the initial bat population
(3) Using Tent chaotic mapping to update pulse emissivity
Pulse frequency enhancement coefficient
where,
(4) Dynamic adaptive update speed
In the basic BA algorithm, the constant rate update coefficient is 1, which makes bats unable to dynamically search for prey, thus reducing the population diversity. Therefore, this paper adopts the following dynamic adaptive speed update method:
where,
3.3.2 Weighted Least Squares Support Vector Machine (WLSSVM)
(1) Least squares support vector machine (LSSVM)
LSSVM is an extension of SVM. It constructs the optimal decision surface, and then applies the principle of risk minimization to transform the inequality operation of SVM into the solution of equations, thus reducing the complexity of calculation and speeding up the operation speed [39].
Set a given sample as
where,
According to solve following functions, the LSSVM’s optimization problem will be overcome:
In the formula,
(2) Improved method of LSSVM
1) Lateral weighting of input vector
Risk intelligence evaluation is a multi input and single output model, and the values in the input vector are distributed horizontally with the number of input indicators. The influence of different evaluation index values on the evaluation results can be reflected, the pecific treatment method is as follows:
where,
2) Longitudinal weighting of training sample set
The results of risk assessment are related to the elements of input vector, in addition, it is related to the sample groups, that is, the close samples have a greater impact on the evaluation results. Therefore, it is necessary to assign different membership values to the current evaluation results to reduce the impact of the close samples on the intelligent evaluation model, and at the same time, increase the impact of the remote samples on the evaluation model. Here, the linear membership degree can be used to calculate the given membership value. The equation is as follows:
where,
Then the input sample set can be changed into:
The determination of
Since the risk assessment model is usually in the form of multi input and single output, this paper makes
(3) Construction of weighted least squares support vector machine (WLSSVM)
The improved method is applied to LSSVM to form WLSSVM. Therefore, the objective function can be described by the following formula:
Then establish lagrange function as follows:
The elimination of
where,
The above equation is solved as follows:
where,
Finally, WLSSVM regression model is obtained:
(4) Construction of wavelet kernel function
Only when the kernel function satisfies the following two theorems can it become the kernel function of LSSVM.
1) Mercer theorem
In this formula,
For all functions
where,
2) Smola and scholkopf theorem
When the kernel function satisfies Mercer theorem, it can be used as the least squares support vector machine by proving that the function
3) Construction of wavelet kernel function
When the wavelet kernel equation meets the conditions:
where,
When
where,
where,
In the above formula,
Thus, the horizontal floating kernel function as follows can be construct:
In LSSVM, kernel equation should satisfy Fourier transform, so wavelet kernel function can be used as kernel equation of LSSVM only when it satisfies Fourier transform. Therefore, it is necessary to prove the following equation:
In order to guarantee the generalization of wavelet kernel function, Morlet wavelet generating function is selected to prove the above equation:
Then
where,
3.3.3 Intelligent Evaluation Process of Wind Power Industry Investment Risk Based on MBA-WLSSVM
This section proposes the mba-wlssvm intelligent evaluation model, that is, using the improved bat algorithm to optimize WLSSVM, so as to obtain the optimal values of
The concrete processes of the proposed intelligent evaluation framework are as follows:
Step 1: select the initial input variables and preprocess the data.form the set of initial input variables of
Step 2: initialize the parameters in the improved bat algorithm and WLSSVM model.
Step 3: get
Step 4: output the intelligent evaluation results and analyze the results. According to the above-mentioned optimal wind power industry investment risk intelligent evaluation model, simulation calculation is carried out, and the results of intelligent evaluation and traditional evaluation model are compared and verified.
In this paper, the basic data of 20 countries along the Belt and Road are selected to carry out empirical analysis and research on investment risk evaluation of wind power industry. Through the risk assessment model of the wind power industry along the Belt and Road constructed above, the corresponding index values are substituted for calculation, and then the risk assessment results are obtained.
4.1 Determine the Evaluation Index Set and Comment Set
Through the investment risk evaluation index identified above, an evaluation index set is established. It mainly includes 40 specific indicators under political risk, economic risk, social risk, legal risk, power market risk, strategic risk, operational risk, technical risk and construction risk. According to the classification slogan of risk level, there are five levels and five standard cloud model of each risk level, as is shown in Tab. 4.
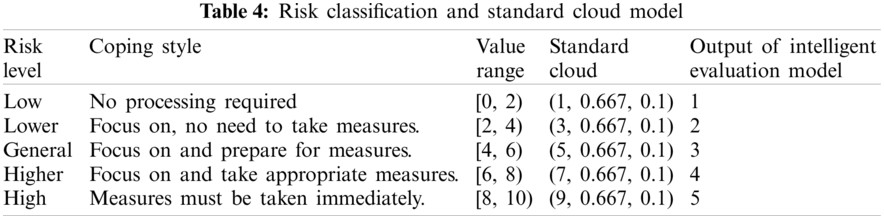
The table above shows the numerical range of all risk levels is controlled within [0, 10]. The standard cloud model is of great significance in the investment risk assessment of wind power industry under the Belt and Road initiative. After the comprehensive evaluation cloud is obtained through the final calculation, it is contrasted with the standard cloud to measure the superior and inferior grades of the results. According to the GRA-TOPSIS risk assessment method, the comprehensive closeness degree is calculated, and the comprehensive risk ranking of 20 countries is obtained.
In order to obtain the intelligent evaluation results based on MBA-WLSSVM model, this paper set country category ID through the characteristics of wind power industry investment risk level of the countries along the line of “the Belt and Road” as 1–5, which respectively represent the low, lower, general, high and high level of investment risk. If the output result of the intelligent evaluation model is 1, it means that the investment risk grade of the evaluated national wind power industry is low; if the output result is 2, the grade is lower; the result of 3 means the grade is general; the result of 4 means the grade is higher; the result of 5 means that the grade is high.
4.2 Risk Assessment of Wind Power Industry Investment Based on Improved Cloud Model and GRA-TOPSIS
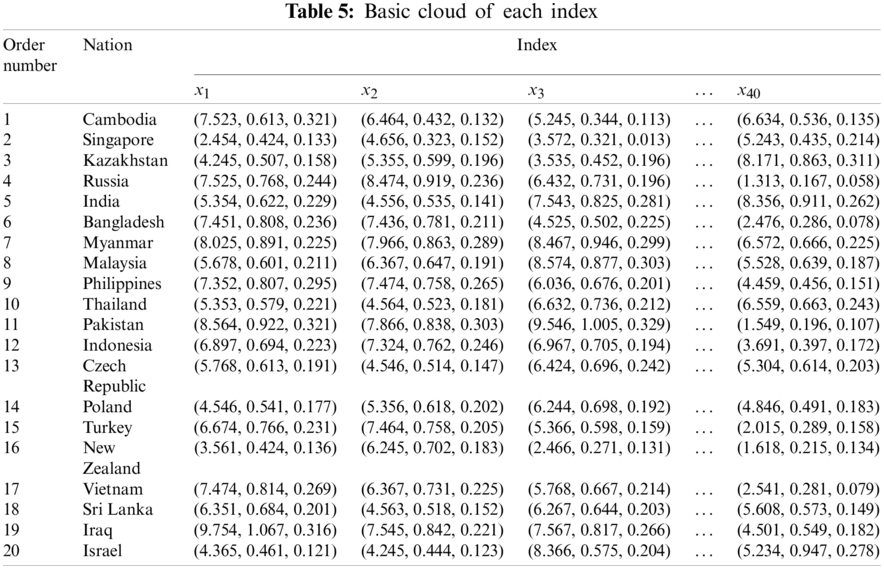
Selecting 20 countries including Cambodia, Singapore, Kazakhstan, Russia, India, etc., combined with expert scoring method and actual data analysis method, the index data are dimensionless. Then the index value is mapped to [0, 10], and the basic cloud of each index is generated. Due to limited space, only some data is shown in Tab. 5.
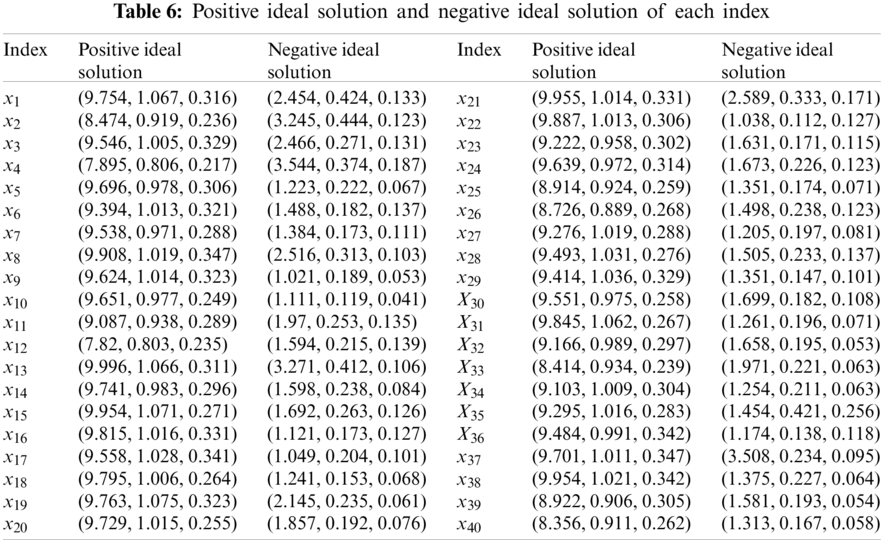
According to the risk index cloud models of different countries mentioned above, the positive and negative ideal solution of each index are obtained, as shown in Tab. 6. In this paper, the positive ideal solution is defined as the cloud model with the greatest risk.
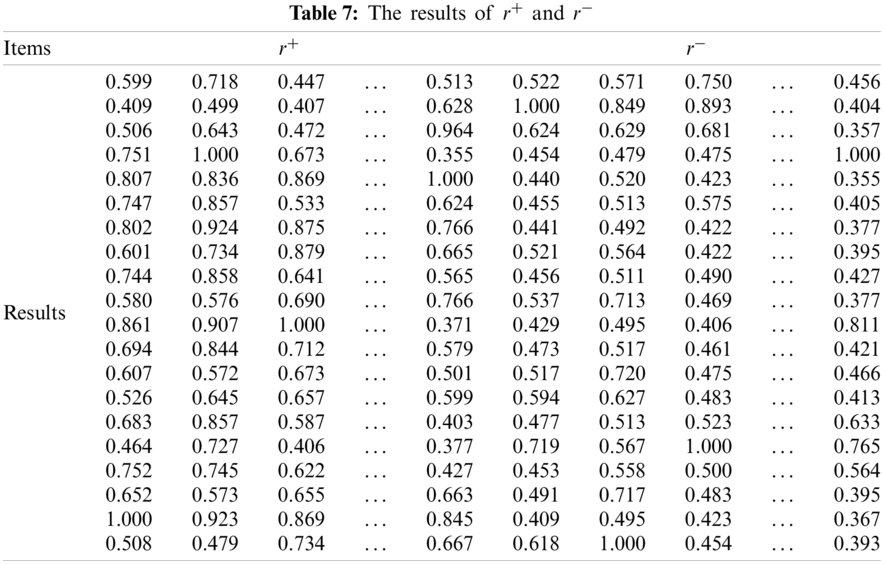
For each country’s investment scheme, the grey correlation coefficient matrix from cloud vector to ideal cloud and negative ideal cloud of each index is shown in r+ and r− respectively. The results are presented in Tab. 7.
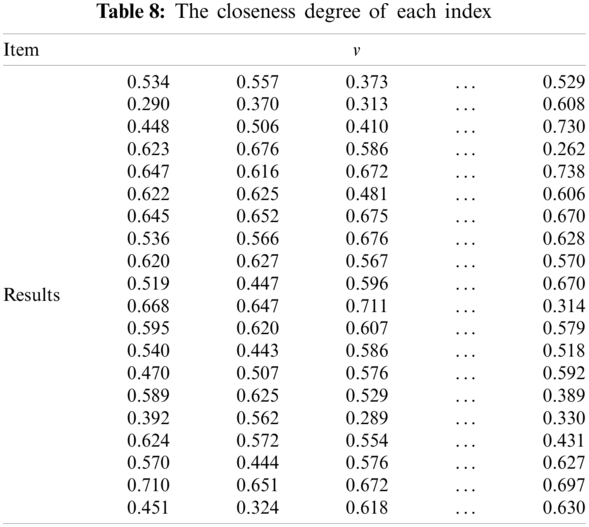
Through calculating, the closeness degree matrix of each index is obtained, as shown in Tab. 8.
According to the improved distance entropy weight calculation method, the preference weight is obtained. The weights are shown in Tab. 9.
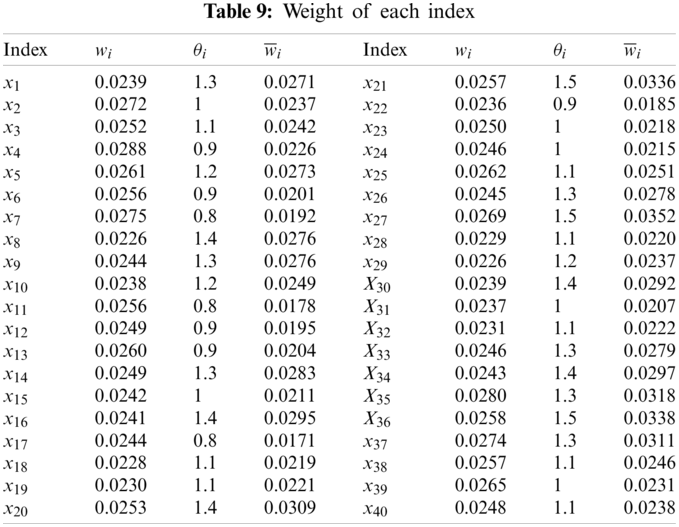
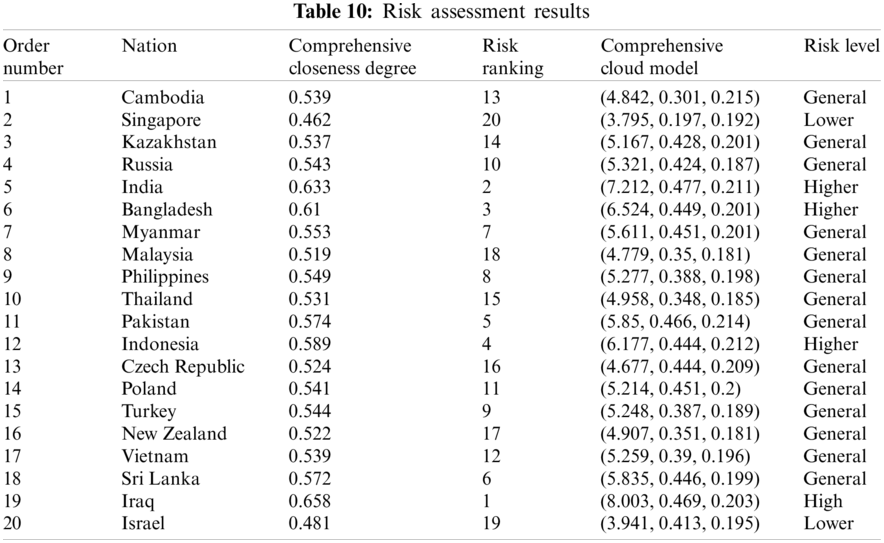
According to the preference weight, obtained by the above method, the comprehensive closeness degree and comprehensive cloud model of each scheme are realized. The comprehensive evaluation results are shown in Tab. 10.
According to the comprehensive cloud model, forward normal cloud generator algorithm and MATLAB simulation, the comprehensive evaluation cloud picture is obtained. Taking Iraq, Indonesia, Malaysia and Singapore as examples, the comparison results between them and the standard cloud images of each comment set are displayed. The specific comparison is shown in Figs. 5–8.
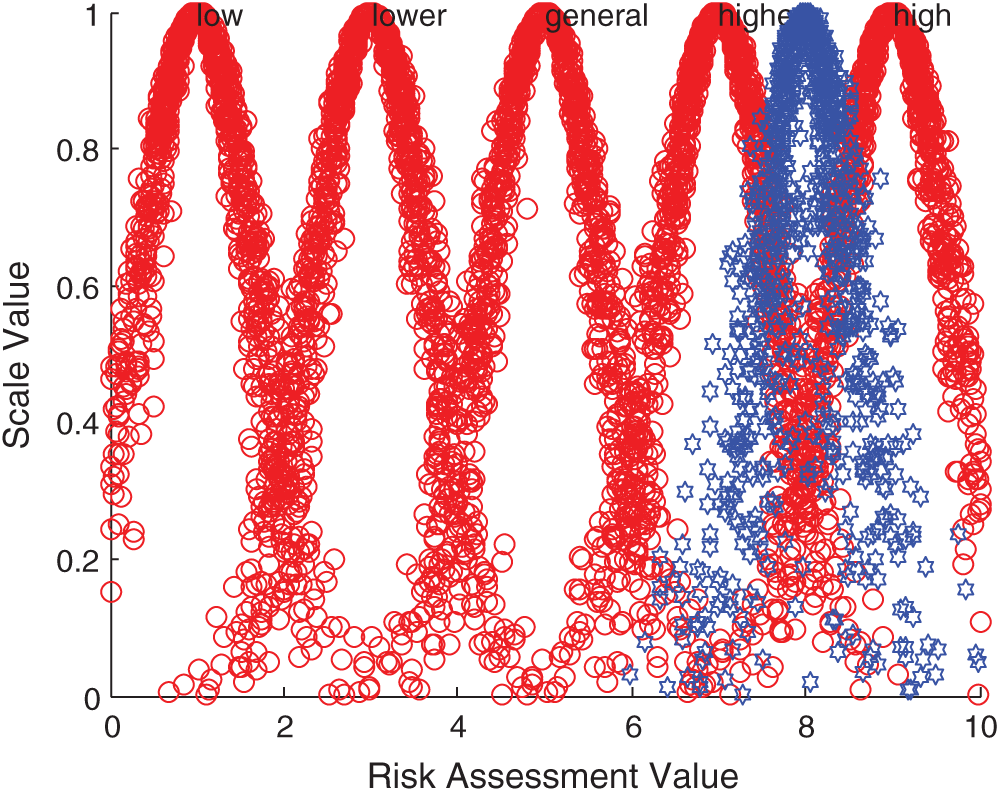
Figure 5: Comparison between Iraqi integrated cloud and standard cloud
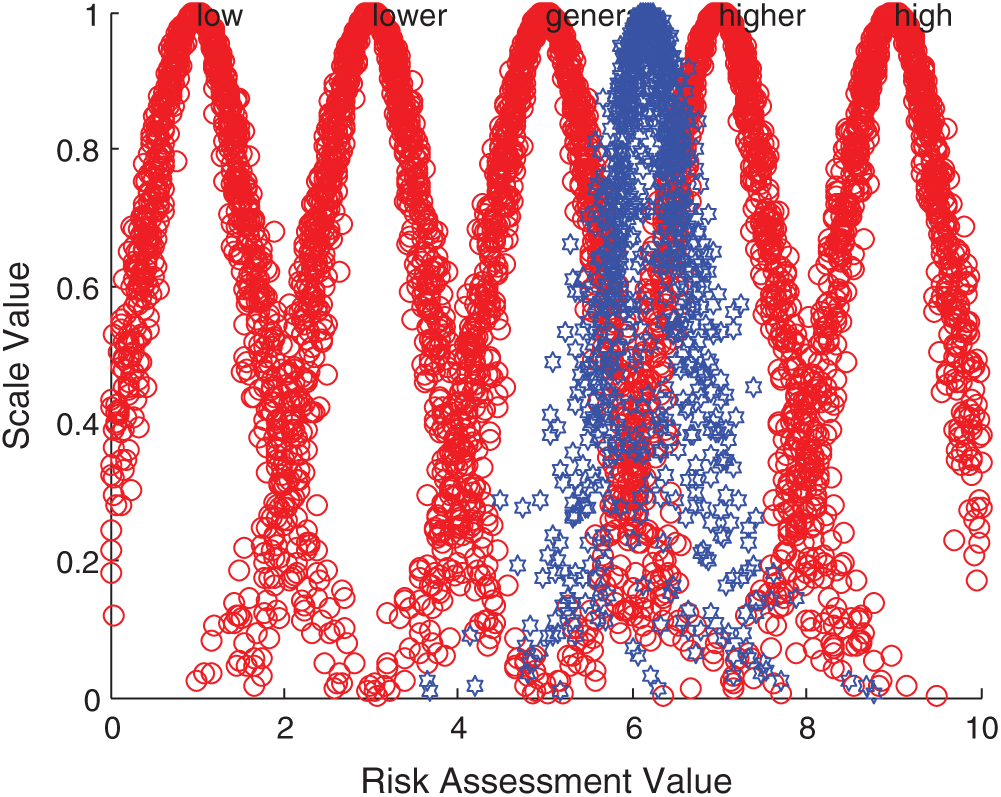
Figure 6: Comparison between Indonesia integrated cloud and standard cloud
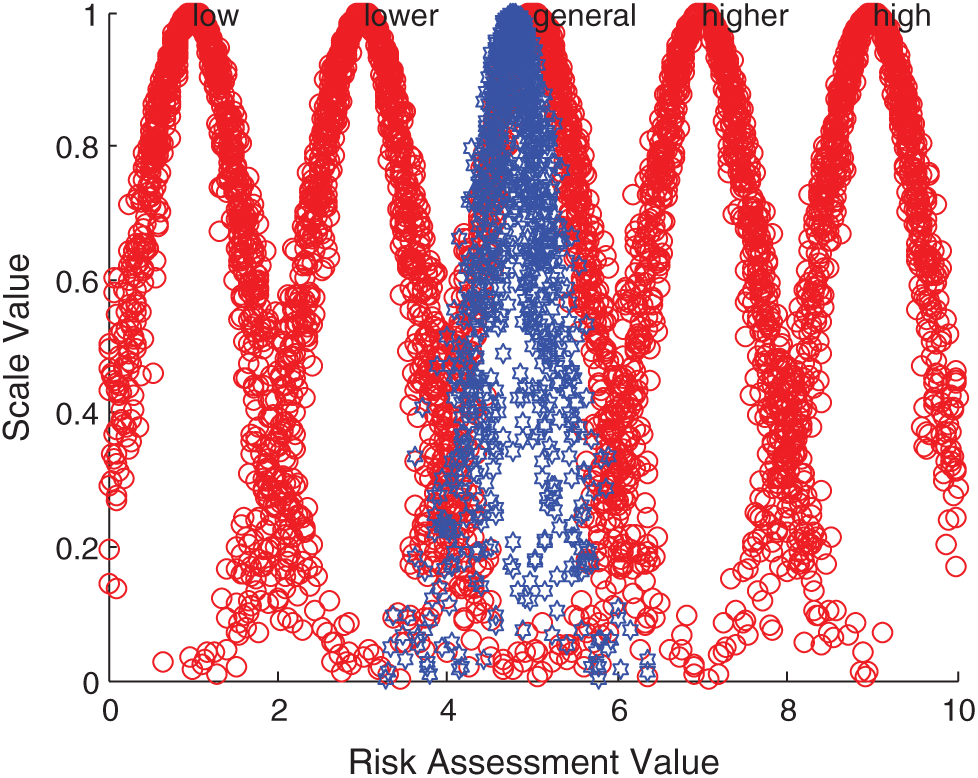
Figure 7: Comparison between Malaysia integrated cloud and standard cloud
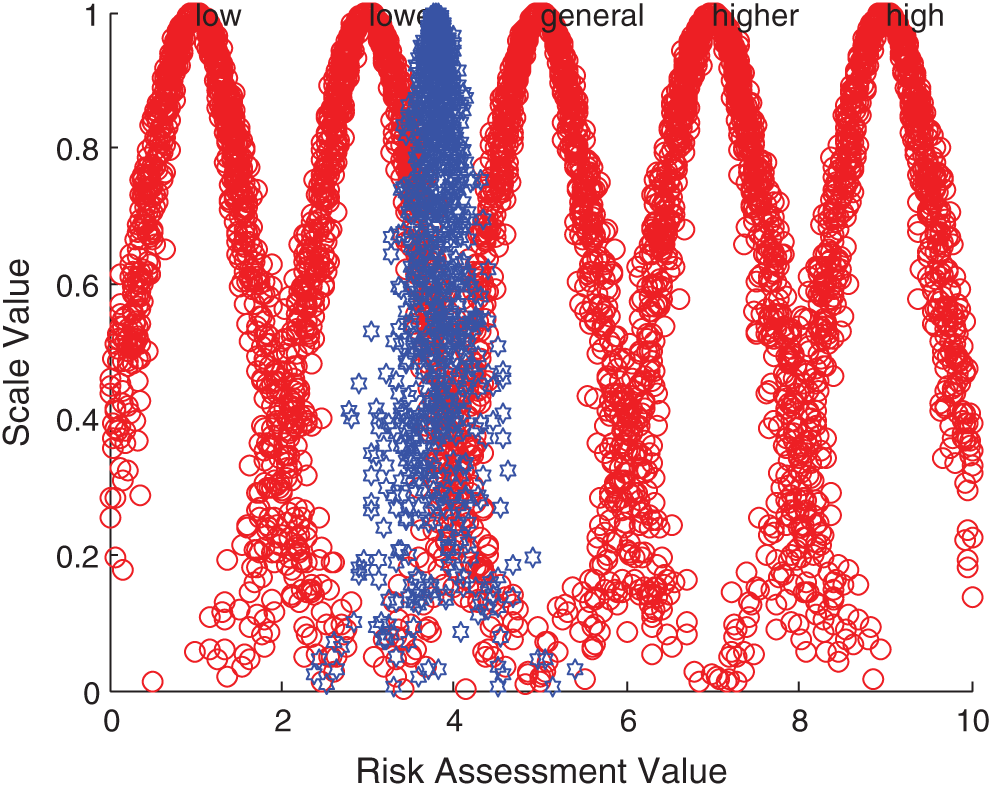
Figure 8: Comparison between Singapore integrated cloud and standard cloud
The above evaluation results show that the comprehensive risk of Iraq is at a high level, while India, Bangladesh and Indonesia are at a higher risk level, and the local security situation has been in an unstable state. On the one hand, there are increasingly sharp contradictions in politics, religion and race; on the other hand, there are violent terrorist attacks. All these make it possible for new conflicts to break out in Iraq at any time, this is a security risk that must be considered for Chinese enterprises in Iraq. In addition, the technology contracts signed between Iraq and foreign companies have a long cycle, and its imperfect laws and regulations and unsupervised supporting legal system greatly increase the uncertainty of the future. Pakistan, Sri Lanka, the Philippines and other 14 countries are at the general risk level, the main influencing factors of these countries are diversity. For example, there are great risks in the business environment in Pakistan. On the one hand, the domestic situation is unstable, and on the other hand, a great quantity of local high-quality talents flow out, these make investment in Pakistan face the risk of labor and technical personnel shortage. The country also has problems such as imperfect infrastructure. These countries need to focus on and prepare for risk management measures in time. Israel and Singapore are at a lower risk level, and these two countries are in the leading position among the 20 countries due to their rapid economic development. Therefore, when Chinese wind power enterprises invest overseas in the economies represented by these countries, the risks brought by economic fluctuations and overall changes are relatively small.
As a result of analysis, the comprehensive risk evaluation model based on improved cloud model and GRA-TOPSIS reflects the risk situation of wind power industry investment in 20 countries objectively and truly. And it also has certain reference significance for investment evaluation in other countries.
4.3 Risk Assessment and Analysis of Wind Power Industry Investment Based on MBA-WLSSVM
By applying the improved cloud model and GRA-TOPSIS, this paper calculates the objective and accurate evaluation result and the rank of the wind power industry of 20 countries along the line of “the Belt and Road” , but the calculation of the model is complex, inefficient and workload. When facing massive and real-time dynamic data of the countries along the line of “the Belt and Road”, it is inevitable that the method is difficult to quickly and effectively calculate the wind power industry investment risk assessment results and the level, and it is also difficult to take timely and effective response measures. Therefore, the paper further completes the risk evaluation of the wind power industry of 20 countries along the line of “the Belt and Road” by the constructed method of intelligent evaluation, and proves the effectiveness of the intelligent evaluation model. This part continues to use the wind power industry investment risk data of the above 20 countries as the test sample, and selects the wind power industry investment risk data of other 20 countries as the training sample.
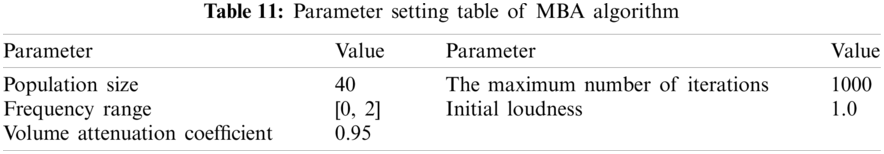
In this paper, the experiment and modeling platform is matlab R2014a, the running environment is Intel Core i5-6300u, 4G memory, 500g hard disk. By setting the population size of MBA algorithm to 40, the maximum number of iterations is 1000, the frequency range is [0, 2], the initial loudness
To test the adventages of the intelligent evaluation model proposed above, the paper uses MBA-WLSSVM model, BA-WLSSVM model, standard LSSVM model and standard SVM model for comparative experiments based on test sample data. The initial pulse emissivity of BA algorithm is 0.75 and the enhancement coefficient of pulse frequency is 0.05. In the standard LSSVM model, the parameter
The constructed evaluation index system is taken as input samples, which are respectively brought into the evaluation model. The results of the test samples are shown in Tab. 12 and Fig. 9. 1–5 in Fig. 9 respectively represent the low, lower, general, higher and high investment risk levels of the wind power industry.
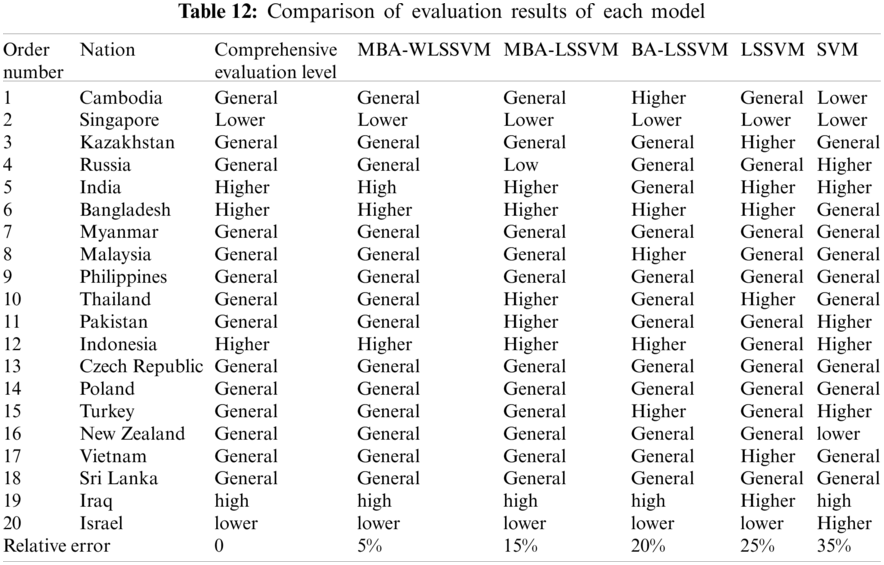
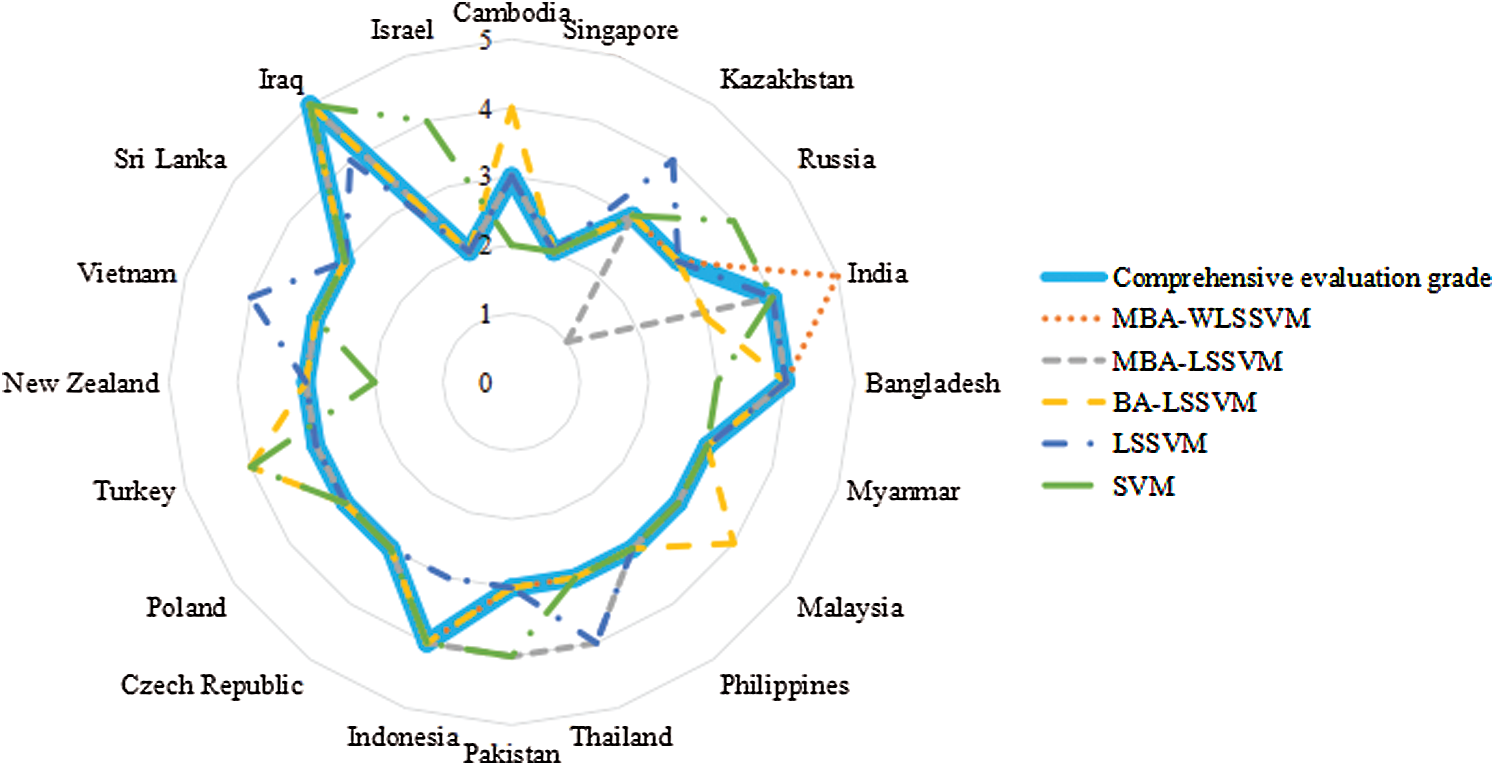
Figure 9: Comparison of evaluation results of test samples
From Tab. 12 and Fig. 9, the relative error of investment risk assessment results of the wind power industry of the countries along the line of “the Belt and Road” evaluated by MBA-WLSSVM model is only 5%, which is the smallest compared with the traditional evaluation model, that is to say, only one of the 20 countries along the route has different evaluation results from the traditional evaluation, while the relative errors of the MBA-LSSVM model, BA-LSSVM model, standard LSSVM model and standard SVM model are 15%, 20%, 25% and 35% respectively, so that the evaluation result error of the proposed model is the smallest and the overall accuracy is the highest. Compared with MBA-LSSVM model, the overall evaluation performance of WLSSVM model improved by wavelet kernel function is better than LSSVM model. Compared with BA-LSSVM model, improved MBA algorithm has better optimization performance for LSSVM model. Compared with LSSVM model, the generalization ability and prediction accuracy can be improved by optimizing the parameters of LSSVM. Compared with SVM model, LSSVM model can use kernel function to transform prediction problem into solving equations, which greatly improves the accuracy of evaluation. Overall, MBA-LSSVM model has the best evaluation performance, followed by MBA-LSSVM model, BA-LSSVM model and LSSVM model, and SVM model has the worst evaluation performance.
Therefore, according to the results of example analysis, the MBA-WLSSVM model can be used to assess the investment risk of wind power industry of the countries along the line of “the Belt and Road” scientifically and effectively. Based on the traditional evaluation method of improved distance entropy cloud model and GRA-TOPSIS, the auxiliary intelligence algorithm is introduced. The expert knowledge is acquired by AI learning. The expert scoring process in the comprehensive evaluation process is generalized, and the results of wind power industry investment risk assessment along the route are obtained through intelligent computation, so as to achieve fast calculation and support for the relevant investor decision.
In order to better identify and guard against the investment risk of wind power industry under the background of the Belt and Road initiative, this paper designs a set of investment risk evaluation index system of wind power industry, and constructs a comprehensive risk evaluation model based on improved cloud model combined with GRA-TOPSIS and MBA-WLSSVM. Firstly, from three dimensions of endogenous risk, exogenous risk and process risk, nine categories are divided, including political risk, economic risk, social risk, legal risk, power market risk, strategic risk, operational risk, technical risk and construction risk. Four to six specific risk indicators are identified under each category, which solves the problem of identifying wind power industry investment risk of the countries along the line of “the Belt and Road.” Then, using the comprehensive risk evaluation model based on cloud model of improved distance entropy and GRA-TOPSIS to evaluate comprehensively after weighting the selected evaluation indexes objectively and subjectively. According to the traditional evaluation model, the objective and accurate evaluation results are obtained. Then, bat algorithm is improved based on tent chaotic map, and LSSVM model is improved by wavelet kernel function. A modern intelligent risk assessment model based on mba- WLSSVM is proposed, and the evaluation results are obtained quickly and accurately through the modern intelligent evaluation model. The evaluation model constructed in this paper is verified to be scientific and accurate through the analysis of example, among which, the traditional evaluation model can get accurate reference results, while the modern intelligent evaluation model can achieve the purpose of fast calculation and support the decision-making of wind power industry investors.
Funding Statement: This work is supported by the Fundamental Research Funds for the Central Universities, China (Project No. 2018MS148).
Conflicts of Interest: The authors declare that they have no conflicts of interest to report regarding the present study.
1. Mpofu, E., James, H. S. (2020). COVID-19 crisis: Time to reflect on how we live and interact with nature. Agriculture and Human Values, 37(11), 542. DOI 10.1007/s10460-020-10046-4. [Google Scholar] [CrossRef]
2. Tao, Y., Liang, H., Celia, M. A. (2020). Electric power development associated with the belt and road initiative and its carbon emissions implications. Applied Energy, 267(6356), 114784. DOI 10.1016/j.apenergy.2020.114784. [Google Scholar] [CrossRef]
3. Jian, J., Fan, X., Zhao, S. (2021). The green incentives and green bonds financing under the belt and road initiative. Emerging Markets Finance and Trade, (in Press). DOI 10.1080/1540496X.2021.1887726. [Google Scholar] [CrossRef]
4. Han, M., Lao, J., Yao, Q., Zhang, B., Meng, J. (2020). Carbon inequality and economic development across the belt and road regions. Journal of Environmental Management, 262(9), 110250. DOI 10.1016/j.jenvman.2020.110250. [Google Scholar] [CrossRef]
5. Cheng, C., Ge, C. (2020). Green development assessment for countries along the belt and road. Journal of Environmental Management, 263, 110344. DOI 10.1016/j.jenvman.2020.110344. [Google Scholar] [CrossRef]
6. Guo, W. (2019). Identification and management of investment risk in infrastructure construction projects along the Belt and Road (Master Thesis). China: Beijing Foreign Studies University. [Google Scholar]
7. Yang, J. Z., Ren, Y. J. (2019). Investment risk analysis of the countries along the belt and road—On the basis of fuzzy and comprehensive evaluation method. Monthly Journal of Accounting, (2), 131–139. DOI 10.19641/j.cnki.42-1290/f.2019.02.016. [Google Scholar] [CrossRef]
8. Yuan, J. H., Zeng, Y. R. (2019). Research on risk evaluation of belt and road country power investment based on entropy weight Topsis and grey relation. Journal of the North China Electric Power University, Social Sciences, 2019(3), 32–40. [Google Scholar]
9. Ma, H. C. (2016). Investment risk assessment and preventive measures of pakistan karachi thermal power plant project (Master Thesis). China: North China Electric Power University. [Google Scholar]
10. Li, F. F. (2016). Risk assessment and elusion of Chinese high-speed railway investment abroad (Master Thesis). China: Shaanxi Normal University. [Google Scholar]
11. Tong, X. (2020). Research on early warning and control strategy of overseas foreign direct investment risks of mineral resource-based enterprises based on muti-classifier fusion (Master Thesis). China: China University of Mining and Technology. [Google Scholar]
12. Chen, J. Q., Zhang, J., Mi, J. (2020). Investment risk assessment of countries along the silk and road economic belt. Exploration of Financial Theory, 2020(2), 32–42. DOI 10.16620/j.cnki.jrjy.2020.02.004. [Google Scholar] [CrossRef]
13. Zhang, X. F., Wang, Y. Q., Han, F. (2020). Research on risk assessment and prevention countermeasures of “one belt and one road” investment projects along the line, based on the improved AHP. Journal of Shenyang Jianzhu University (Social Science), 22(1), 57–62. DOI 10.11717/j.issn.1673-1387.2020.01.09. [Google Scholar] [CrossRef]
14. Tang, B. Q., Han, J., Guo, G. F. (2019). Evaluation model of project investment risk based on particle swarm optimization improved least squares support vector machine. Journal of Civil Engineering and Management, 36(2), 98–103. DOI 10.13579/j.cnki.2095-0985.2019.02.014. [Google Scholar] [CrossRef]
15. Yao, J. H., Cai, D. D., Sheng, J. M., Niu, D. X. (2017). Risk assessment on finance lease in distribution network project based on cloud model and entropy method. Science Technology and Engineering, 17(18), 226–230. DOI CNKI:SUN:KXJS.0.2017-18-035. [Google Scholar]
16. Hu, L. H., Zhang, W. B., Yu, Y., Peng, X. (2020). Accuracy of multimodal image fusion for oral and maxillofacial tumors, a revised evaluation method and its application-ScienceDirect. Journal of Cranio-Maxillofacial Surgery, 48(8), 741–750. DOI 10.1016/j.jcms.2020.05.009. [Google Scholar] [CrossRef]
17. He, F., Li, Y., Xu, T., Yin, L., Zhang, W. et al. (2020). A data-analytics approach for risk evaluation in Peer-to-Peer lending platforms. IEEE Intelligent Systems, 35(3), 85–95. DOI 10.1109/MIS.2020.2971946. [Google Scholar] [CrossRef]
18. Lu, L., Fang, C., Hu, Z., Hu, X., Zhu, Z. (2019). Grade classification model tandem BpNN method with multi-metal sensor for rice eating quality evaluation-ScienceDirect. Sensors and Actuators B, Chemical, 281(59), 22–27. DOI 10.1016/j.snb.2018.10.062. [Google Scholar] [CrossRef]
19. Lu, L., Fang, C., Hu, Z., Hu, X., Zhu, Z. (2020). Quality evaluation of signals collected by portable ECG devices using dimensionality reduction and flexible model integration. Physiological Measurement, 41(10), 105001. DOI 10.1088/1361-6579/abba0b. [Google Scholar] [CrossRef]
20. Song, X., Zhao, J., Song, J., Dong, F., Xu, L. (2020). Local demagnetization fault recognition of permanent magnet synchronous linear motor based on S-transform and PSO-LSSVM. IEEE Transactions on Power Electronics, 35(8), 7816–7825. DOI 10.1109/TPEL.2020.2967053. [Google Scholar] [CrossRef]
21. Nourani, V., Farboudfam, N. (2019). Rainfall time series disaggregation in mountainous regions using hybrid wavelet-artificial intelligence methods. Environmental Research, 168(1), 306–318. DOI 10.1016/j.envres.2018.10.012. [Google Scholar] [CrossRef]
22. Setiadi, H., Mithulananthan, N., Shah, R., Lee, K. Y., Krismanto, A. U. (2019). Resilient wide-area multi-mode controller design based on bat algorithm for power systems with renewable power generation and battery energy storage. IET Generation, Transmission & Distribution, 13(10), 1884–1894. DOI 10.1049/iet-gtd.2018.6384. [Google Scholar] [CrossRef]
23. Fang, H., Song, Y. J. (2019). Host country risk and China’s outward foreign direct investment: A study of 43 countries along the belt and road initiative. Journal of Shanghai University of Finance and Economics, 21(5), 33–52. DOI 10.16538/j.cnki.jsufe.2019.05.003. [Google Scholar] [CrossRef]
24. Nelson, M. M., Sooreea, R., Gokcek, G. (2016). The FDI-political risk nexus: Some new insights. Journal of Business & Retail Management Research, 11(1), 31–41. [Google Scholar]
25. Huang, Y. (2019). Environmental risks and opportunities for countries along the belt and road, location choice of China’s investment. Journal of Cleaner Production, 211(20), 14–26. DOI 10.1016/j.jclepro.2018.11.093. [Google Scholar] [CrossRef]
26. Li, P., Zhang, J. S., Xu, J., Wang, P. (2018). A dynamic approach to measuring China’s provincial energy supply security along the belt and road. Mathematical Problems in Engineering, 2018(5), 1–16. DOI 10.1155/2018/3605024. [Google Scholar] [CrossRef]
27. Xu, K., Pedrycz, W., Li, Z., Nie, W. (2019). Constructing a virtual space for enhancing the classification performance of fuzzy clustering. IEEE Transactions on Fuzzy Systems, 27(9), 1779–1792. DOI 10.1109/TFUZZ.2018.2889020. [Google Scholar] [CrossRef]
28. Cui, T. J., Ma, Y. D. (2016). Risk evaluation of roadway roof fall based on AHP-cloud model. Application Research of Computers, 33(10), 2973–2976. [Google Scholar]
29. Ji, L., Yang, F., Guo, X. (2021). Set-valued mapping cloud model and its application for fusion algorithm selection of dual mode infrared images. IEEE Access, 9, 54338–54349. DOI 10.1109/ACCESS.2021.3070009. [Google Scholar] [CrossRef]
30. Zhang, Q. W., Zhang, Y. Z., Zhong, M. (2014). A cloud model based approach for multi-hierarchy fuzzy comprehensive evaluation of reservoir-induced seismic risk. Journal of Hydraulic Engineering, 45(1), 87–95. DOI 10.13243/j.cnki.slxb.2014.01.012. [Google Scholar] [CrossRef]
31. Li, Y. M., Chen, Z. (2019). Study on regional electric energy substitution potential evaluation based on TOPSIS method of optimized connection degree. Power System Technology, 43(2), 369–377. [Google Scholar]
32. Xu, S. D., Geng, X. L. (2017). Method of multi-attribute group decision-making by combining cloud model and TOPSIS. Application Research of Computers, 2017(10), 2964–2967. [Google Scholar]
33. Li, Y., Chen, Y., Li, Q. (2020). Assessment analysis of green development level based on S-type cloud model of Beijing-Tianjin-Hebei. China Renewable and Sustainable Energy Reviews, 133, 110245. DOI 10.1016/j.rser.2020.110245. [Google Scholar] [CrossRef]
34. Umamaheswarrao, P., Rangaraju, D., Suman, K. N. S., Ravisankar, B. (2021). Application of TOPSIS for multi response optimization of process parameters in dry hard turning of AISI 52100 steel. INCAS Bulletin, 13(1), 211–224. DOI 10.13111/2066-8201. [Google Scholar] [CrossRef]
35. Aslam, M., Fahmi, A., Almahdi, F. A. A., Yaqoob, N. (2021). Extension of TOPSIS method for group decision-making under triangular linguistic neutrosophic cubic sets. Soft Computing, 25(5), 3359–3376. DOI 10.1007/s00500-020-05427-0. [Google Scholar] [CrossRef]
36. Dahooie, J. H., Hajiagha, S. H. R., Farazmehr, S., Zavadskas, E. K., Antucheviciene, J. (2021). A novel dynamic credit risk evaluation method using data envelopment analysis with common weights and combination of multi-attribute decision-making methods. Computers & Operations Research, 129(1), 105223. DOI 10.1016/j.cor.2021.105223. [Google Scholar] [CrossRef]
37. Rajalakshmi, M., Chandramohan, S., Kannadasan, R., Alsharif, M. H., Kim, M. K. et al. (2021). Design and validation of bat algorithm-based photovoltaic system using simplified high gain Quasi boost inverter. Energies, 14(4), 1086. DOI 10.3390/en14041086. [Google Scholar] [CrossRef]
38. Jyoti, K., Sharma, S., Verma, S. (2021). A novel variant of Bat Algorithm inspired from CATD-pursuit strategy & its performance evaluations. International Journal of Advanced Intelligence Paradigms, 1(1), 1. DOI 10.1504/IJAIP.2021.10030248. [Google Scholar] [CrossRef]
39. Li, S., Xu, T., Jiang, N., Yang, H., Wang, S. et al. (2021). Regional zenith tropospheric delay modeling based on least squares support vector machine using GNSS and ERA5 data. Remote Sensing, 13(5), 1004. DOI 10.3390/rs13051004. [Google Scholar] [CrossRef]
 | This work is licensed under a Creative Commons Attribution 4.0 International License, which permits unrestricted use, distribution, and reproduction in any medium, provided the original work is properly cited. |