| Computer Modeling in Engineering & Sciences |
DOI: 10.32604/cmes.2021.015875
ARTICLE
Intelligent Segmentation and Measurement Model for Asphalt Road Cracks Based on Modified Mask R-CNN Algorithm
1School of Water Conservancy Engineering, Zhengzhou University, Zhengzhou, 450001, China
2National Local Joint Engineering Laboratory of Major Infrastructure Testing and Rehabilitation Technology, Zhengzhou, 450001, China
3Collaborative Innovation Center of Water Conservancy and Transportation Infrastructure Safety, Zhengzhou, 450001, China
4Guangzhou Expressway Limited Company, Guangzhou, 510288, China
*Corresponding Author: Niannian Wang. Email: wnnian@163.com
Received: 20 January 2021; Accepted: 19 April 2021
Abstract: Nowadays, asphalt road has dominated highways around the world. Among various defects of asphalt road, cracks have been paid more attention, since cracks often cause major engineering and personnel safety incidents. Current manual crack inspection methods are time-consuming and labor-intensive, and most segmentation methods cannot detect cracks at the pixel level. This paper proposes an intelligent segmentation and measurement model based on the modified Mask R-CNN algorithm to automatically and accurately detect asphalt road cracks. The model proposed in this paper mainly includes a convolutional neural network (CNN), an optimized region proposal network (RPN), a region of interest (RoI) Align layer, a candidate area classification network and a Mask branch of fully convolutional network (FCN). The ratio and size of anchors in the RPN are adjusted to improve the accuracy and efficiency of segmentation. Soft non-maximum suppression (Soft-NMS) algorithm is developed to improve the segmentation accuracy. A dataset including 8,689 images (512 × 512 pixels) of asphalt cracks is established and the road crack is manually marked. Transfer learning is used to initialize the model parameters in the training process. To optimize the model training parameters, multiple comparison experiments are performed, and the test results show that the mean average precision (mAP) value and F1-score of the optimal trained model are 0.952 and 0.949. Subsequently, the robustness verification test and comparative test of the trained model are conducted and the topological features of the crack are extracted. Then, the damage area, length and average width of the crack are measured automatically and accurately at pixel level. More importantly, this paper develops an automatic crack detection platform for asphalt roads to automatically extract the number, area, length and average width of cracks, which can significantly improve the crack detection efficiency for the road maintenance industry.
Keywords: Asphalt road cracks; intelligent segmentation; automatic measurement; deep learning; Mask R-CNN
In recent years, the construction of transportation infrastructure has been developed rapidly, which has greatly promoted the global development and national economy. At present, highway construction is booming, and highway is mainly dominated by asphalt roads. Due to ageing, weathering, the action of road traffic, and other factors, the road surface condition becomes poor, and it is prone to cracks after serving for a period of time. These cracks will reduce the bearing capacity and performance of roads [1,2]. Moreover, they will affect the operational safety of highways. Therefore, if the location of road cracks can be distinguished quickly and accurately, the damaged road can be repaired in time to prevent further deterioration, which can greatly decrease the maintenance costs of the road [3,4]. Based on this, road crack segmentation has been developed in academia, and various advanced methods have been developed [5,6].
Manual detection is the traditional asphalt road crack segmentation and identification method [7], which is both time-consuming and labor-intensive. With the increased processing power of computers and the emergence of tools like artificial intelligence, methods based on image processing and computer vision will be more effective for road crack damage segmentation [8,9]. Common image processing methods include edge detection, threshold segmentation [10], and so forth. The threshold segmentation method distinguishes road surface and crack information by setting a certain threshold [10,11]. Oliveira et al. [12] used Otsu's threshold method to identify road cracks in a two-step crack segmentation process. Sun et al. [13] defined two thresholds to represent the background area and the crack area in order to improve the performance of crack segmentation. However, these methods poorly detected cracks on heavily damaged roads. On the other hand, the edge detection method utilizes the step change of the gray value near the target object to extract information on common road failures such as cracks [14], which requires that the road damage should have a strong edge. This drawback limits the practicality of these segmentation methods. In order to enhance the performance of road crack segmentation, some machine learning methods including neural networks, random forests [15], and support vector machine [16] are employed. Although these methods can better detect road cracks, it was still difficult to accurately detect road cracks when there were uneven distribution of images. Peng et al. [17] proposed a three-threshold road crack segmentation method based on random structured forest. This method realized the effective segmentation of pavement cracks.
With the development of deep learning, an effective and accurate identification method is provided for target image processing [18–23]. Image processing of road cracks based on deep learning includes target detection and target segmentation. Target detection is used to detect the specific position of the crack in the image. Modarres et al. [24] proposed a deep learning model based on CNN, which could well realize the detection and classification of damages. Yu et al. [25] proposed a deep convolutional neural network (DCNN)-based method, which has outstanding generalization capacity and higher identification accuracy. Ma et al. [26] proposed a region-based fully convolutional neural network for intelligent recognition of pavement crack, and achieved high recognition accuracy and outstanding PR curve. Li et al. [27] designed a supervised DCNN and proposed novel training methods to optimize its performance on specific tasks. This network can achieve the classification of damage, but with a moderate detection accuracy, and it is only suitable for concrete roads. Wu et al. [28] proposed a crack detection model based on faster region-based convolutional neural networks (Faster R-CNN) [29] to distinguish cracks of tunnel. This model used region proposal networks (RPN) to generate candidate regions using a sliding window, which improved the detection accuracy. However, their model utilizes region of interest (RoI) Pooling (also known as RoI Pooling), which directly extracted the corresponding feature maps of the region of interest by rounding off RoI Pooling. This procedure can result in a feature map deviating from the original image. Xu et al. [30] proposed a modified Faster R-CNN, which can achieve identification of the multiple type seismic damage of damaged reinforced concrete columns from images. Singh et al. [31] proposed an automatic road damage detection and classification method based on Mask R-CNN. However, the above methods can only detect the pavement damage, but can not extract the specific contour of damages.
Target segmentation is to segment the target area from the image. Shim et al. [32] proposed a multiscale and adversarial learning-based semi-supervised semantic segmentation method for concrete crack. Li et al. [33] proposed a pixel-level segmentation model for multiple concrete damages based on fully convolutional neural networks, which could well realize the segmentation of damages. Qu et al. [34] proposed a concrete pavement crack segmentation method based on the improved VGG16 network model. Hu et al. [35] proposed a pixel-wise crack segmentation model based on Crack U-Net. However, the above models only realized the road damage segmentation, and didn't realize the damage size measurement. Yang et al. [36] raised a crack detection model based on fully convolutional neural networks. This model adopted the novel end-to-end structure and realizes segmentation and measurement. But F1-score needs to be improved. Byunghyun et al. [37] presented an approach to detect cracks using Mask R-CNN and measure concrete crack widths using additional image processing. However, the segmentation accuracy of the above models needs to be further improved.
In summary, the current road crack segmentation method has the following technical problems and challenges: First of all, Existing research on road damage segmentation mostly focuses on concrete road damage, and seldom considers asphalt road damage. In addition, the research on asphalt pavement damage does not take into account the overlap of damage segmentation masks, which results in lower segmentation accuracy, which will further cause larger road damage measurement errors.
Therefore, regarding the problems existing in the above mentioned methods for road crack segmentation and measurement, this paper proposes an intelligent segmentation and measurement model to automatic identify road cracks based on the modified Mask R-CNN [38] algorithm. The model is segmented along the crack boundary and the damage features are extracted. To adapt to cracks of different sizes, the RPN is optimized by adjusting the ratio and size of the anchor. Moreover, the RPN uses soft non-maximum suppression (Soft-NMS) [39] instead of NMS algorithm to retain accurate RoI and improve the accuracy of damage segmentation. The proposed model cannot only segment the crack, but also extract the topological features precisely. In addition, the model can automatically measure the area, length and width of the crack at the pixel level. Furthermore, a real-time asphalt road crack detection platform is developed to automatically extract crack information such as the area, length, and average width. The platform can realize efficient information transmission and provide important reference for engineering practice.
The research contents of each section are introduced as follows. The second section introduces the architecture of the model proposed in this paper. The third section mainly introduces the procedure for generating databases, model parameter configuration and evaluation index. The fourth section introduces modified Mask R-CNN training and testing process, the topological information extraction of cracks, the automatic measurement of crack size, and the development of real-time display module. The last section concludes this paper.
2 Modified Mask R-CNN Segmentation Model
The segmentation of road cracks is mainly analyzing the collected road images to intelligently determine the location of the cracks. In the current paper, in order to facilitate the definition of the question, a collected road image is expressed by:
where, Xi represents the i-th road image, stands for the information value of the n-th pixel in the i-th image.
The label set corresponding to the above i-th road image, i.e., Xi is defined by:
where, Xn is the nth road crack image, Yn represents the label of the road crack image corresponding to Xn. n denotes the number of labels, including n road images and their corresponding crack labels.
The question of the intelligent segmentation of road cracks can be defined as follows: a deep learning prediction model is constructed, and the corresponding crack label Y, is efficiently and accurately predicted according to the input road crack image X.
2.2 Modified Mask R-CNN Model Structure
The intelligent segmentation model structure of road cracks based on modified Mask R-CNN is illustrated in Fig. 1. Firstly, the convolutional layer extracts the feature of the road image. Secondly, the extracted feature is used as an input to the optimized region proposal network to construct a candidate frame of the road crack target area. Thirdly, the candidate frame is classified. Finally, a Mask is generated to realize the segmentation of the road crack. In the following, the network design and working principle of each section are introduced in detail.

Figure 1: Intelligent road crack segmentation model based on modified Mask R-CNN
2.2.1 Convolutional Neural Network
Convolutional neural networks of modified Mask R-CNN are based on more common and pre-trained neural networks such as VGG16 [40], Inception [41], and ResNet101 [42], and so on. After experimental comparison, a ResNet101 network consisting of five convolutional layers, due to a lower loss value, is adopted. The convolutional neural network function is to extract the feature map of the target area of the road image. The convolutional calculation is defined by:
where, W(i, j) represents the convolution kernel, X = (i, j) is the input to the neural network, and * denotes the convolution operation, i represents the i-th row, j represents the j-th column, m represents the largest row of the image, and k represents the largest column of the image.
The input road image to this network has a dimension of 512 × 512 and is convolved by a convolution kernel of size 3 × 3. It is then passed through a nonlinear activation function (ReLU), and is further pooled in the pooling layer to finally obtain 512 feature maps of size 16 × 16. The smallest point on the feature map is called the anchor point, and two adjacent anchor points correspond to 256 pixel pitches on the original image. Then, according to three different aspect ratios, nine bounding boxes (BB for short) are generated for each anchor point. Therefore, a total of 2,304 (9 × 16 × 16) RoIs are generated in each feature map.
2.2.2 Optimized Region Proposal Network
The structure of optimized RPN is depicted in Fig. 2. The main function of the region proposal network distinguishes the multiple RoIs generated in the above convolutional neural network to determine the detected area and perform preliminary corrections on the bounding boxes.

Figure 2: RPN structure
The key idea of RPN is to use the neural network to directly generate the region proposal [43]. The convolutional feature map returned by the convolutional neural network is used as an input to RPN. Firstly, 512 channels and a sliding window with a convolution kernel of size 3 × 3 are used to perform a sliding scan on the road feature map, so that a series of anchors are generated. To adapt to the cracks of different sizes, two sizes 32 × 32 and 64 × 64 are added to the original sizes of 128 × 128, 256 × 256 and 512 × 512. In addition, most of the cracks are spindly, so the ratio of width to height is adjusted from 1:1, 1:2, 2:1 to 1:2, 2:1, 1:3, 3:1. The RPN is optimized to reduce the amount of calculation, improve training speed and segmentation accuracy. Secondly, two convolution kernels of size 1 × 1 are used for parallel convolution operations. The classification layer is utilized to predict the road background and target area. Bounding box regression performs a preliminary correction on the road target boundary box, which is expressed in the following equation:
where, X(P) is the feature vector of the feature map, d(P) represents the predicted region value of the model, and
At present, the common regression loss functions include L1 loss function, L2 loss function [44] and Smooth L loss function [45]. For the L1 loss function, it has a stable gradient and will not cause exploding gradients. However, when the error is very small (less than 1), if the learning rate remains the same, the loss function will fluctuate around the stable value, and it is difficult to converge to a higher accuracy. For the L2 loss function, it is convenient to find the derivative and have a stable solution. However, when the error is large (greater than 1), the robustness is poor at this time, and the phenomenon of exploding gradients may appear. The smooth L loss function can perfectly solve the above problems. Therefore, the loss function of RPN is defined as follows:
where
In RPN, many RoIs are obtained. However, the target area in the actual image is far less than the number of RoIs. In the NMS algorithm, the overlap coefficient between each RoI and the target area is calculated, the RoI with the overlap coefficient less than the threshold is deleted, and that with the highest overlap coefficient is selected. If the overlapping area of the remaining RoI and the region is greater than a certain threshold, the region frame will be deleted.
In this paper, Soft-NMS instead of NMS is used to eliminate redundant RoIs. When the overlapping area is greater than the threshold, the RoI is not deleted, but the original score is multiplied by the attenuation coefficient. The calculation method is shown in Eq. (6):
where, M is the RoI with the largest overlap coefficient, bi is the RoI near M, D is the set of RoIs used to save the final, and σ is the hyperparameter.
The main functions of RoI Align layer are extracting each RoI's corresponding features of the road image, and mapping the extracted features onto a fixed dimension to meet the input requirements of the next layer of the network. The selected fixed dimension is of size 7 × 7, so the RoI Align layer maps the features corresponding to RoI to a 7 × 7 dimension.
Compared with the RoI Pooling layer of Faster R-CNN, the RoI Align layer has considerable advantages. Assuming that the size of the target bounding box is 300 × 300, when the feature map is reduced by 32 times in Faster R-CNN for feature extraction, the target bounding box is also reduced by 32 times, i.e., 300/32 = 9.375, so the RoI pooling is directly rounded down to 9. In order to satisfy the input of the lower layer, the size of the feature map needs to be mapped to a 7 × 7, thus the side length of the anchor point is 9/7 = 1.286, and the RoI pooling must be directly quantized to 1 again as displayed in Fig. 3. After two rounding off and quantization, each RoI deviates obtained from the features affects the accuracy of the target segmentation.

Figure 3: The two quantization operations of the RoI Pooling layer
In order to overcome the above drawbacks, modified Mask R-CNN utilizes RoI Align to replace RoI Pooling in Faster R-CNN. As shown in Fig. 4, by allowing decimal numbers, RoI Align does not apply quantization and rounding off operations. Four sampling pixels in RoI are selected, and bilinear difference is used to calculate the exact value of each position. Since there is a one-to-one correspondence between the regions of interest and the extracted features, they match each other exactly, which can improve the accuracy of road crack segmentation.

Figure 4: RoI Align layer without quantization operation
2.2.4 Region Proposal Classification Network and the Mask Branch
The network mainly aims to classify the RoI of road cracks, and to conduct bounding box regression (BB regression) so as to re-correct the target boundary frame and realize the detection and segmentation of the RoI in the mask branch network. The mask branch is a fully convolutional network (FCN) [46] applied to each RoI to predict a segmentation mask in a pixel-to-pixel manner. After many experiments, the experimental results of Intersection-over-Union (IoU) with critical values of 0.5, 0.6, 0.7, 0.8 are compared, and the results show that when the IoU value is 0.7, there is the best segmentation effect. Therefore, if IoU of the predicted RoI and the actual region is greater than 0.7, the prediction is a positive RoI. When the RoI area agrees with the prediction result in the road crack classification module, the RoI area is the output.
The loss function defined in this work to train the modified Mask R-CNN model is given by:
where, L(ti, Pi) is the loss function of RPN defined in this work. Lcls, Lbox and Lmask, represent the classification loss, the bounding box loss, and the mask segmentation loss, respectively.
3 Dataset and Experiment Configurations
This section details the construction process of the data set and the configuration of the parameters for modified Mask R-CNN model training, validation and testing.
As shown in Fig. 5, the dataset used in the developed intelligent segmentation model of the road cracks is obtained from the high-definition road crack images captured by the charge-coupled device (CCD) on-board camera in Guangzhou Expressway. The collection includes 5,689 crack images and 3000 intact images. The dataset is separated into training set, validation set and testing set at a ratio of 3:1:1, thus 3413 road crack images and 1800 intact images are used for model training, 1138 road crack images and 600 intact images are used for model validation, and the remaining 1,138 images and 600 intact images are employed as the testing dataset, as shown in Tab. 1.

Figure 5: Examples of captured road crack images: (a) transverse crack, (b) longitudinal crack, (c) blurred crack image, (d) complex background image, (e) cross cracks

Some of the road crack images captured by the camera may vary in size and dimension, so they need to be cropped first to achieve a similar image dimension. The size of the road crack images input to the proposed intelligent segmentation model should be 512 × 512, so they need to be cropped uniformly.
Before training the model, the collected and preprocessed datasets should be labeled to meet the requirements of model training. At present, most datasets are manually labeled [47,48], and small errors caused by manual labeling are ignored in the study. Thus, LabelMe, the MIT open annotation tool, is used for manually labeling the datasets. Then, the datasets are converted into a binary mask file. The binary mask file marks the road background area pixel with 0 and the road crack area pixel with 1. The process of manually labeling the datasets is depicted in Fig. 6.

Figure 6: Data labeling process using the LabelMe annotation tool
Firstly, the pre-processed road crack image is imported into the LabelMe annotation tool, and the outline of the road crack is determined by hand drawing. Secondly, the division of the road crack is obtained, and the corresponding JSON file is generated separately. Finally, the JSON file is converted into the mask tag file required for the model. The mask tag file includes the original image, the eight-bit mask tag of the image file, the tag coordinate file, and the tag name file. The above steps are repeated to complete the labeled of the datasets. Some original road crack images and their corresponding labels (outlines) are displayed in Fig. 7.

Figure 7: Original road crack images and their corresponding label images: (a) transverse crack, (b) longitudinal crack, (c) two cracks, (d) cross cracks
In this paper, the method of transfer learning is adopted when training the modified Mask R-CNN model, rather than training the model from scratch. According to the strategy of transfer learning, pre-trained model is used to initialize the weight parameters in modified Mask R-CNN, which can improve the efficiency of model training. In addition, this model uses error back propagation algorithm and stochastic gradient descent method to optimize the weight parameters of the model.
This section introduces the model training and testing in detail and introduces the robustness analysis of the model after training as well. The proposed method is compared with other segmentation models for performance. Then, the procedures of extracting the crack area and calculating the area, length and average width of the crack at the pixel level are introduced. In addition, this section develops a crack automatic detection module for asphalt roads, which can automatically extract the number, area, length and average width of cracks on the road.
The construction, training, and testing of the modified Mask R-CNN intelligent segmentation of road cracks are all performed on Linux operating system. The platform is equipped with 8 GB RAM and Intel® Core™ i9 processors. Moreover, Nvidia 2080Ti GPU with 6 GB memory is used to accelerate and improve the efficiency of the model. The program code for the construction, training, and testing of the proposed intelligent segmentation model is written in Python programming language (Python3.6) and experimented with TensorFlow, an end-to-end open source deep learning platform.
4.1 Hyperparameter Configuration
In deep learning, many hyperparameters that affect the model must be set. Common and important hyperparameters are learning rate, momentum, and weight decay. The learning rate affects the rate of model training and learning. If it is too large, the loss value will increase and the model will not converge. If it is too small, the loss value is almost unchanged, and the model learning speed is too slow. Momentum can improve the learning efficiency, and using a weight decay can effectively protect the model from overfitting. And employing a stochastic gradient descent (SGD) optimizer can minimize the algorithm loss. In order to optimize the model hyperparameters, through multiple experiments, the experimental effects of different hyperparameter combinations are compared, as shown in Tab. 2. The best hyperparameter combination is selected: learning rate, momentum, and weight decay are set to 0.002, 0.9 and 0.0003, respectively.

4.2 Training and Validation the Proposed Model
There are many evaluation indicators for evaluating the accuracy of segmentation methods. Mean average precision (mAP) and F1-score was employed to evaluate the performance of the model in the image segmentation [49,50]. First, the precision is calculated using Eq. (8) and the recall is calculated using Eq. (9) [51]. The precision denotes the correct rate over all the detected objects, while the recall is the rate of completeness of detected objects among all the labeled objects. Second, mAP is calculated by Eq. (10). In addition, F1-score is used to measure the performance of the classifier by calculating the harmonic mean of precision and recall. The F1-score is calculated by Eq. (11):
where, TP is the number of true positives, FP is the number of false positives, and FN is the number of false negatives. The value of mAP is the area of the P-R curve. TP and FP are related to the value of Intersection-over-Union (IoU) of model prediction results and labeling results. When the IoU value is greater than the threshold, it is determined as TP; when the IoU value is less than the threshold, it is determined as FP. Therefore, the choice of the threshold is very important, and the experimental analysis is carried out in Section 4.2.3.
4.2.1 The Influence of Different Convolutional Neural Networks on the Model
Here, we discussed the impact of three different convolutional neural networks on the modified Mask R-CNN. As shown in Tab. 3, three convolutional neural networks including VGG16, Inception and ResNet101 are applied to the experimental results of the modified Mask R-CNN road crack intelligent segmentation model.

After several iterations, whether the model converges is determined by observing the loss change curve. When the model converges, the loss values of VGG16, Inception, and ResNet101 could reach 0.10, 0.09, and 0.04, respectively. In addition, we verify that the loss values could reach 0.11, 0.095, and 0.052, respectively. The lowest loss value of ResNet101 network is ascribed to its deeper convolutional layers and using the residual learning module. Therefore, ResNet101 convolutional neural network is used in the proposed intelligent segmentation model.
4.2.2 The Impact of the Mumber of Epochs on the Model
When training the model, the number of epochs impacts greatly on the accuracy and efficiency of the model. On the one hand, lowering the number of epochs, cutting down the training time may increase the loss value of the segmentation, thereby leading to a lower degree of accuracy of the model. On the other hand, increasing the number of epochs helps the training loss value converge to a minimum value but lengthens the training time. Therefore, in order to find the reasonable number of epochs, the current work examines the effect of model training on the model performance, loss value, and training time at four epochs of 1,000, 3,000, 5,000, and 8,000. Tab. 4 lists the loss value, mAP value, and training time of the model at different epochs.
It can be seen in Tab. 4 that when the number of epochs is 1,000 or 3,000, the loss value is large, the mAP is small, and the training effect is poor. In addition, a comparison between the training effect when the number of epochs is 5,000 and 8,000 reveals that the loss value converges to the minimum value (0.063), but the mAP value can reach its maximum value (0.952) at 5,000. Moreover, the training time required for 5,000 epochs is much shorter than that for 8,000 epochs. Therefore, setting the number of epochs at 5,000 to train the model proposed can effectively improve the recognition accuracy and efficiency of the model, while it reduces the training time. Fig. 8 illustrates some random test results of the model, and the red curve represents the outline of the asphalt road crack. It is obvious that the model can excellently detect the road cracks.

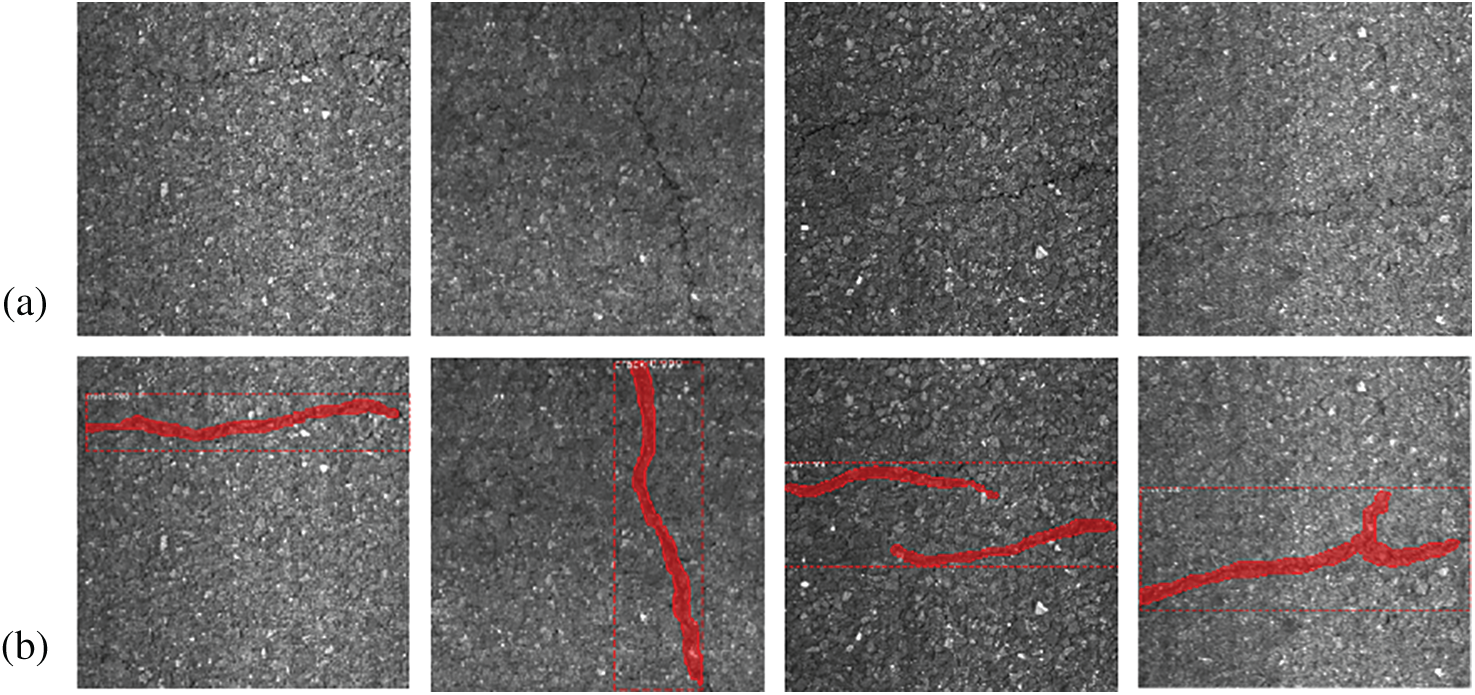
Figure 8: Crack detection of the proposed model: (a) Original road crack images, (b) The corresponding outline
4.2.3 The Impact of the IoU Threshold on the Model
Using 1738 images of the untrained validation set, the segmentation performance of the model is verified by changing the IoU threshold (0.50, 0.60, 0.65, 0.70, 0.80). If the degree of overlap between the model prediction area and the labeling area is greater than the threshold, it is a true positive (TP). Otherwise, it is false positive (FP). Calculate a series of evaluation indicators such as precision, recall, F1-score and mAP, and the results are shown in Tab. 5. Based on the obtained results, when the IoU threshold is 0.65, had a precision of 0.959, recall of 0.927, F1-score of 0.944, and mAP of 0.949. Therefore, it is concluded that 0.65 can be used as the best threshold for effective model segmentation.
4.3 Test of Model Robustness against Noise
To verify the robustness of the developed model against noise when there is noise interference such as blurred images and complex backgrounds, in this paper, 205 blurred images and 151 images with complex backgrounds are selected in the testing set for model testing. Some randomly selected road crack images and their corresponding contours are shown in Fig. 9, where (a) represents the original image of noise cracks, and (b) represents the crack contour images detected by the model. Fig. 10 shows that the proposed model can correctly identify road cracks even with noise, and it is still effective for segmentation effect.


Figure 9: Road crack detection on noisy image: (a) Crack images with noise, (b) Corresponding detected results by the model
In order to show the segmentation effect of the model intuitively, this paper analyzes the evaluation index of the model accuracy. Tab. 6 shows the precision, recall, F1-score, mAP value and test time of 205 blurred images and 151 complex background images for model testing. It can be seen from Tab. 6 that the test mAP value of the blurred images is 0.926, while the mAP value of the complex background image is 0.938. The F1-score values are 0.931 and 0.935, respectively. The average test time of the two types is 23 and 18 s. Therefore, the method proposed in this paper has good noise robustness and wide applicability.
4.4 Evaluation of Different Models
4.4.1 Comparison with Basic Model
In order to well evaluate the effectiveness of the proposed method, we compare the proposed method with other basic semantic segmentation methods. FCN is a pixel-level, end-to-end deep learning algorithm for image segmentation. FCN performs well in the task of image segmentation. Threshold segmentation is the traditional image segmentation method. Under the same environment and settings, by experimenting on the testing set, the experimental results are obtained as shown in Fig. 10. Fig. 10 shows four examples of damage segmentations, (a) transverse cracks, (b) longitudinal cracks, (c) two cracks, and (d) cross cracks.

Figure 10: Comparison results of the proposed model, FCN, and threshold segmentation: (a) transverse crack, (b) longitudinal crack, (c) two cracks, (d) cross cracks

Comparisons of the best results in the validation processes of the modified Mask R-CNN, FCN and the threshold segmentation are listed in Tab. 7. It can be clearly seen in Tab. 7 that the mAP and F1-score of the model proposed can reach 0.952 and 0.944, respectively, which are much higher than that of the two other algorithms. In terms of the recognition time, this model is basically the same as FCN, and both of them are superior to the threshold segmentation. Therefore, according to the above comprehensive analysis, the proposed model is able to be more effectively and quickly identify the road cracks.

4.4.2 Comparison with Advanced Crack Segmentation Model
In order to further prove the segmentation performance of the proposed model, this paper compares with the latest research results. A comparison of some recent research regarding the performance of road crack segmentation is summarized in Tab. 8. It can be seen from Tab. 8 that the algorithm in this paper has a higher F1-score value than the methods proposed in the other four references. It proves that the method in this paper has more effective segmentation performance.

4.5 Extracting Cracks from Images
After training and testing the network, the crack prediction results are accurate, which proves that the proposed method has effective crack segmentation performance. This section intelligently extracts crack damage topological information from the images processed by this model. The successful extraction of crack topological information helps to accurately measure the area, length and average width of the crack at the pixel level.
In this paper, the predicted mask image is firstly extracted, and the mask image is binarized. Then, we completely map the binarized mask image to the original image, which can extract the crack topological information.
Fig. 11 shows extracted images of asphalt road cracks under various conditions. Figs. 11a–11d show the prediction results of normal condition images, blurred images, complex background images, and two crack images. Fig. 11 also shows the extracted results of crack damage area. It can be seen from Fig. 11 that the model proposed can effectively extract the crack topological information under the above four conditions.

Figure 11: Examples of prediction mask image and crack image extraction under four conditions
4.6 Automatic Measurement of Crack Information
To provide a more effective reference in the construction project, this section calculates the damage area, length and average width of the crack at the pixel level. From the topological information extracted in this paper, the crack morphological features like crack area, length and mean width could be calculated at the pixel level.
In the extracted crack image, the damage area of the crack is obtained by counting the number of pixels in the crack using a traversal algorithm [52,53], as shown in Eqs. (12) and (13). In the calculation process of the crack length, this paper firstly uses the edge examination algorithm to extract the crack skeleton. Then the number of pixels of the skeleton and calculate the pixel value of the crack length is counted, as shown in Eq. (14). The way to calculating the pixel value of the average crack width is shown in Eq. (15).
where Wavg represents the pixel value of the average width of the crack, Ap represents the pixel value of the crack area, FindContours() is the contour extraction function, ContourArea() is the calculation function of the contour area, ArcLength() is the calculation function of the contour length, and Lp represents the pixel value of the crack length.
Fig. 12 shows the calculation results of the crack area, length and the average width at the pixel level under the four conditions in Fig. 11, and use the same method to measure the size of the original image. The original size and predicted size information in Fig. 12 are shown in Tab. 9. At the same time, the error rate is calculated.

Figure 12: Examples of measurement results under for four conditions: (a) Normal condition image, (b) Blurred image, (c) Complex background image, (d) Two crack image

In order to further prove the validity of the predicted size in this paper, the predicted size of the damaged area of 1138 test crack images are compared with the original size, as shown in Fig. 13. It can be seen from Fig. 13 that the prediction crack areas essentially agree with the true crack areas. And the average error rate of crack damage is calculated, the value is 4.97%. The error rate results show that the method proposed in this paper is feasible and effective for crack identification and measurement.

Figure 13: True areas and prediction areas of testing images
4.7 Automatic Detection Platform
The road crack automatic detection platform is developed in this paper, which can automatically extract the number, area, length and average width of cracks in the road and display the extracted crack information through the real-time display window as well. A road damage information database is also formed, contributing to road maintenance. The platform can directly collect video data and input the video data to the network. The network can automatically detect the video frame by frame without human intervention. The real-time display window contains the picture number, picture name, number of cracks and crack size information. Moreover, it can also click the view button to view the corresponding picture information and crack image through the window. As shown in Fig. 14, the crack information of the four images in Fig. 12 is displayed.

Figure 14: Real-time display platform
The View button is clicked to view the specific picture information and the corresponding crack image. Fig. 15 shows the information and crack image of picture 1. By developing a road crack automatic detection module, crack information can be extracted automatically. And through the real-time display window, the extracted crack information is effectively displayed to the user, which provides superior assistance for engineering practice.

Figure 15: Example of a specific picture display window
An intelligent crack detection model based on the modified Mask R-CNN was proposed in this paper to automatically segment and measure asphalt road cracks. This paper optimized the region proposal network by adjusting the anchor and using Soft-NMS instead of NMS, thereby improving the accuracy and efficiency of segmentation. The charge-coupled device (CCD) on-board camera was used to collect 8,689 images on the highway, and the collected images were pre-processed and adjusted to the size of 512 × 512 pixels. The dataset was built by labeling and adjusting the collected images.
Then transfer learning technique was leveraged to initialize modified Mask R-CNN model parameters. To find the optimal training model, the best convolutional networks and epochs were selected via trial-and-error. Based on the experiments, the best trained model achieved the highest mAP of 0.952. The robustness of the model was tested using 356 testing images which were not used for training and validation. The testing results showed that the trained model has effective segmentation performance. Subsequently, the comparative experiment between the proposed method, FCN and threshold segmentation basic method was conducted, and the comparative results showed that the modified Mask R-CNN was very effective for road crack segmentation and had more obvious advantages.
Based on the segmentation results, the topological information of cracks was extracted intelligently under four conditions (normal image, blurred image, complex background image, and two crack in one image). The area and length of the crack were calculated at pixel level, and the average width could be further calculated. Then, the comparison study between the predicted crack size and crack truth size was conducted, which proved the effectiveness of the proposed model in crack segmentation and measurement. To provide more timely and effective information, this paper developed a road crack automatic detection platform, which displayed the automatic extraction process of crack information in real time. The platform can realize damage information transmission and provide important effective reference for engineering practice.
In the future studies, we will expand the database, which contains more various types of road damages to realize intelligent segmentation and automatic measurement of asphalt road. In addition, we will focus on the research of crack physical size measurement and 3D point cloud segmentation to realize the physical size measurement of crack length, width, area and depth.
Data Availability Section: Data analyzed during the study are included in the published article. All data are available from the corresponding author.
Funding Statement: This research was funded by the National Key Research and Development Program of China (No. 2017YFC1501204), the National Natural Science Foundation of China (No. 51678536), the Guangdong Innovative and Entrepreneurial Research Team Program (2016ZT06N340), the Program for Science and Technology Innovation Talents in Universities of Henan Province (Grant No. 19HASTIT043), the Outstanding Young Talent Research Fund of Zhengzhou University (1621323001), the Program for Innovative Research Team (in Science and Technology) in University of Henan Province (18IRTSTHN007) and the Research on NonDestructive Testing (NDT) and Rapid Evaluation Technology for Grouting Quality of Prestressed Ducts (Contract No. HG-GCKY-01-002). The authors would like to thank for these financial supports.
Conflicts of Interest: The authors declare that they have no conflicts of interest to report regarding the present study.
1. Fan, R., Liu, Y., Yang, X., Bocus, M., Tancock, S. (2018). Real-time stereo vision for road surface 3-D reconstruction. IEEE International Conference on Imaging Systems and Techniques, pp. 1–6. Kraków, Poland, IEEE. DOI 10.1109/IST.2018.8577119. [Google Scholar] [CrossRef]
2. Yao, Y., Tung, S., Glisic, B. (2014). Crack detection and characterization techniques—An overview. Structural Control & Health Monitorin, 21(12), 1387–1413. DOI 10.1002/STC.1655. [Google Scholar] [CrossRef]
3. Jahanshahi, M., Masri, S. (2013). A new methodology for non-contact accurate crack width measurement through photogrammetry for automated structural safety evaluation. Smart Materials & Structures, 22(3), 35019. DOI 10.1088/0964-1726/22/3/035019. [Google Scholar] [CrossRef]
4. Chen, J., Wu, J., Chen, G., Dong, W., Sheng, X. (2016). Design and development of a multi-rotor unmanned aerial vehicle system for bridge inspection. International Conference on Intelligent Robotics and Applications, pp. 498–510. Hachioji, Japan, Springer International Publishing. DOI 10.1007/978-3-319-43506-0_44. [Google Scholar] [CrossRef]
5. Oliveira, H., Correia, P. (2009). Automatic road crack segmentation using entropy and image dynamic thresholding. 17th European Signal Processing Conference, pp. 622–626. Glasgow, UK, IEEE. INSPEC: 15036481. [Google Scholar]
6. Fan, R., Ai, X., Dahnoun, N. (2018). Road surface 3D reconstruction based on dense subpixel disparity map estimation. IEEE Transactions on Image Processing, 27(6), 3025–3035. DOI 10.1109/TIP.2018.2808770. [Google Scholar] [CrossRef]
7. Gao, J. (2012). Research on automatic pavement distress detection based on image analysis (Ph.D. Thesis). Nanjing University of Science and Technology, China. DOI 10.7666/d.y625525. [Google Scholar] [CrossRef]
8. Cao, W., Liu, Q., He, Z. (2020). Review of pavement defect detection methods. IEEE Access, 8, 14531–14544. DOI 10.1109/ACCESS.2020.2966881. [Google Scholar] [CrossRef]
9. Gavilan, M., Balcones, D., Marcos, O., Llorca, D., Sotelo, M. et al. (2011). Adaptive road crack detection system by pavement classification. Sensors, 11(10), 9628–9657. DOI 10.3390/s111009628. [Google Scholar] [CrossRef]
10. Sun, L., Xing, J., Zhang, X. (2018). An algorithm for concrete crack extraction and identification based on machine vision. IEEE Access, 6, 28993–29002. DOI 10.1109/ACCESS.2018.2844100. [Google Scholar] [CrossRef]
11. Koch, C., Georgieva, K., Kasireddy, V., Akinci, B., Fieguth, P. (2015). A review on computer vision based defect detection and condition assessment of concrete and asphalt civil infrastructure. Advanced Engineering Informatics, 29(2), 196–210. DOI 10.1016/j.aei.2015.01.008. [Google Scholar] [CrossRef]
12. Oliveira, H., Correia, P. L. (2013). Automatic road crack detection and characterization. Intelligent Transportation Systems, IEEE Transactions, 14(1), 155–168. DOI 10.1109/TITS.2012.2208630. [Google Scholar] [CrossRef]
13. Sun, L., Kamaliardakani, M., Zhang, Y. (2015). Weighted neighborhood pixels segmentation method for automated detection of cracks on pavement surface images. Journal of Computing in Civil Engineering, 30(2), 4015021. DOI 10.1061/(ASCE)CP.1943-5487.0000488. [Google Scholar] [CrossRef]
14. Gunawan, G., Heri, N., Sriadhi, S., Achmad, F., Ari, U. (2018). Mobile application detection of road damage using canny algorithm. Journal of Physics Conference Series, vol. 1019, 012035, pp. 1–6. Kuching, Malaysia. DOI 10.1088/1742-6596/1019/1/012035. [Google Scholar] [CrossRef]
15. Radopoulou, S. C., Brilakis, I. (2016). Automated detection of multiple pavement defects. Journal of Computing in Civil Engineering, 31(2), 4016057. DOI 10.1061/(ASCE)CP.1943-5487.0000623. [Google Scholar] [CrossRef]
16. Jahanshahi, M., Masri, S. (2012). Adaptive vision-based crack detection using 3D scene reconstruction for condition assessment of structures. Automation in Construction, 22, 567–576. DOI 10.1016/J.AUTCON.2011.11.018. [Google Scholar] [CrossRef]
17. Peng, C., Yang, M., Zheng, Q., Zhang, J., Wang, D. et al. (2020). A triple-thresholds pavement crack detection method leveraging random structured forest. Construction and Building Materials, 263, 120080. DOI 10.1016/j.conbuildmat.2020.120080. [Google Scholar] [CrossRef]
18. Yang, Y., Duan, J., Yu, H., Gao, Z., Qiu, X. (2018). An image classification method based on deep neural network with energy model. Computer Modeling in Engineering & Sciences, 117(3), 555–575. DOI 10.31614/cmes.2018.04249. [Google Scholar] [CrossRef]
19. Khodabandehlou, H., Pekcan, G., Fadali, M. (2019). Vibration-based structural condition assessment using convolution neural networks. Structural Control & Health Monitoring, 26(2), e2308.1–e2308.12. DOI 10.1002/STC.2308. [Google Scholar] [CrossRef]
20. Choi, W., Cha, Y. (2019). SDDNet: Real-time crack segmentation. IEEE Transactions on Industrial Electronics, 67(9), 8016–8025. DOI 10.1109/TIE.2019.2945265. [Google Scholar] [CrossRef]
21. Deng, X., Shao, H., Shi, L., Wang, X., Xie, T. (2020). A classification–Detection approach of COVID-19 based on chest X-ray and CT by using keras Pre-trained deep learning models. Computer Modeling in Engineering & Sciences, 125(2), 579–596. DOI 10.32604/cmes.2020.011920. [Google Scholar] [CrossRef]
22. Zheng, Q., Tian, X., Jiang, N., Yang, M. (2019). Layer-wise learning based stochastic gradient descent method for the optimization of deep convolutional neural network. Journal of Intelligent and Fuzzy Systems, 37(3), 5641–5654. DOI 10.3233/jifs-190861. [Google Scholar] [CrossRef]
23. Liu, D., Zhao, J., Xi, A., Wang, C., Huang, X. et al. (2020). Data augmentation technology driven by image style transfer in self-driving Car based on End-to-end learning. Computer Modeling in Engineering & Sciences, 122(2), 593–617. DOI 10.32604/cmes.2020.08641. [Google Scholar] [CrossRef]
24. Modarres, C., Astorga, N., Lopez Droguett, E. (2018). Convolutional neural networks for automated damage recognition and damage type identification. Structural Control & Health Monitoring, 25(10), e2230.1–e2230.17. DOI 10.1002/STC.2230. [Google Scholar] [CrossRef]
25. Yu, Y., Wang, C., Gu, X., Li, J. (2018). A novel deep learning-based method for damage identification of smart building structures. Structural Health Monitoring, 18(1),143–163. DOI 10.1177/1475921718804132. [Google Scholar] [CrossRef]
26. Ma, D., Fang, H., Xue, B., Wang, F., Chan, C. et al. (2020). Intelligent detection model based on a fully convolutional neural network for pavement cracks. Computer Modeling in Engineering & Sciences, 123(3), 1267–1291. DOI 10.32604/cmes.2020.09122. [Google Scholar] [CrossRef]
27. Li, R., Yuan, Y., Zhang, W., Yuan, Y. (2018). Unified vision-based methodology for simultaneous concrete defect detection and geolocalization. Computer—Aided Civil and Infrastructure Engineering, 33(1), 527–544. DOI 10.1111/mice.12351. [Google Scholar] [CrossRef]
28. Wu, H., Wang, A., Wang, H. (2019). Crack of tunnel detection based on faster R-CNN. Journal of Taiyuan University of Science and Technology, 173(3), 4–7. DOI CNKI:SUN:TYZX.0.2019-03-001. [Google Scholar]
29. Ren, S., He, K., Girshick, R., Sun, J. (2017). Faster R-CNN: Towards real-time object detection with region proposal networks. IEEE Transactions on Pattern Analysis & Machine Intelligence, 39(6), 1137–1149. DOI 10.1109/TPAMI.2016.2577031. [Google Scholar] [CrossRef]
30. Xu, Y., Wei, S., Bao, Y., Li, H. (2019). Automatic seismic damage identification of reinforced concrete columns from images by a region-based deep convolutional neural network. Structural Control & Health Monitoring, 26(4), e2313.1–e2313.22. DOI 10.1002/STC.2313. [Google Scholar] [CrossRef]
31. Singh, J., Shekhar, S. (2018). Road damage detection and classification in smartphone captured images using mask R-CNN. IEEE International Conference on Big Data, Seattle, WA, USA. http://arxiv.org/abs/1811.04535. [Google Scholar]
32. Shim, S., Kim, J., Cho, G. (2020). Multiscale and adversarial learning-basedSemi-supervised semantic segmentation approach for crack detection in concrete structures. IEEE Access, 8, 170939–170950. DOI 10.1109/ACCESS.2020.3022786. [Google Scholar] [CrossRef]
33. Li, S., Zhao, X., Zhou, G. (2019). Automatic pixel-level multiple damage detection of concrete structure using fully convolutional network. Computer Aided Civil & Infrastructure Engineering, 34(4), 616–634. DOI 10.1111/mice.12433. [Google Scholar] [CrossRef]
34. Qu, Z., Mei, J., Liu, L., Zhou, D. (2020). Crack detection of concrete pavement with cross-entropy loss function and improved VGG16 network model. IEEE Access, 99, 54564–54573. DOI 10.1109/ACCESS.2020.2981561. [Google Scholar] [CrossRef]
35. Hu, Y., Li, W., Tighe, S., Xu, Z. (2020). Cracku-net: A novel deep convolutional neural network for pixelwise pavement crack detection. Structural Control & Health Monitoring, 27(5), e2551. DOI 10.1002/stc.2551. [Google Scholar] [CrossRef]
36. Yang, X., Li, H., Yu, Y., Luo, X., Huang, T. et al. (2018). Automatic pixel-level crack detection and measurement using fully convolutional network. Computer Aided Civil & Infrastructure Engineering, 33(12), 1090–1109. DOI 10.1111/mice.12412. [Google Scholar] [CrossRef]
37. Byunghyun, K., Soojin, C. (2019). Image-based concrete crack assessment using mask and region-based convolutional neural network. Structural Control & Health Monitoring, 26(8), e2381.1–e2381.15. DOI 10.1002/STC.2381. [Google Scholar] [CrossRef]
38. He, K., Gkioxari, G., Dollar, P., Girshick, R. (2017). Mask R-CNN. Proceedings of the IEEE International Conference on Computer Vision, pp. 2980–2988. Venice, Italy. DOI 10.1109/ICCV.2017.322. [Google Scholar] [CrossRef]
39. Bodla, N., Singh, B., Chellappa, R., Davis, L. (2017). Improving object detection with one line of code. Proceedings of the IEEE International Conference on Computer Vision, pp. 5561–5569. Venice, Italy. DOI 10.1109/ICCV.2017.593. [Google Scholar] [CrossRef]
40. Simonyan, K., Zisserman, A. (2014). Very deep convolutional networks for large-scale image recognition. Computer Science. https://arxiv.org/abs/1409.1556. [Google Scholar]
41. Szegedy, C., Liu, W., Jia, Y., Sermanet, P. (2015). Going deeper with convolutions. Proceedings of the IEEE Conference on Computer Vision and Pattern Recognition, pp. 1–9. Boston, MA, USA. DOI 10.1109/CVPR.2015.7298594. [Google Scholar] [CrossRef]
42. He, K., Zhang, X., Ren, S. (2016). Deep residual learning for image recognition. Proceedings of the IEEE Conference on Computer Vision and Pattern Recognition, pp. 770–778. Las Vegas, NV, USA. DOI 10.1109/CVPR.2016.90. [Google Scholar] [CrossRef]
43. Lin, T., Dollár, P., Girshick, R., He, K. (2016). Feature pyramid networks for object detection. IEEE Conference on Computer Vision and Pattern Recognition, pp. 936–944. Honolulu, HI, USA. DOI 10.1109/CVPR.2017.106. [Google Scholar] [CrossRef]
44. Girshick, R., Donahue, J., Darrell, T., Malik, J. (2014). Rich feature hierarchies for accurate object detection and semantic segmentation. IEEE Conference on Computer Vision and Pattern Recognition, pp. 580–587. Columbus, OH, USA. DOI 10.1109/CVPR.2014.81. [Google Scholar] [CrossRef]
45. Girshick, R. (2015). Fast R-CNN. Proceedings of the IEEE International Conference on Computer Vision, pp. 1440–1448. Santiago, Chile. DOI 10.1109/ICCV.2015.169. [Google Scholar] [CrossRef]
46. Long, J., Shelhamer, E., Darrell, T. (2014). Fully convolutional networks for semantic segmentation. IEEE Transactions on Pattern Analysis & Machine Intelligence, 39(4), 640–651. DOI 10.1109/TPAMI.2016.2572683. [Google Scholar] [CrossRef]
47. Xue, Y., Li, Y. (2018). A fast detection method via region-based fully convolutional neural networks for shield tunnel lining defects. Computer—Aided Civil and Infrastructure Engineering, 33(8), 638–654. DOI 10.1111/mice.12367. [Google Scholar] [CrossRef]
48. Zhang, K., Cheng, H., Zhang, B. (2018). Unified approach to pavement crack and sealed crack detection using preclassification based on transfer learning. Journal of Computing in Civil Engineering, 32(2), 4018001. DOI 10.1061/(ASCE)CP.1943-5487.0000736. [Google Scholar] [CrossRef]
49. Wong, A., Famuori, M., Shafiee, M., Li, F., Chwyl, B. et al. (2019). YOLO nano: A highly compact you only look once convolutional neural network for object detection. http://arxiv.org/abs/1910.01271. [Google Scholar]
50. Redmon, J., Farhadi, A. (2018). Yolov3: An incremental improvement. http://arxiv.org/abs/1804.02767. [Google Scholar]
51. Jenkins, M., Carr, T., Igiesias, M., Buggy, T. (2018). A deep convolutional neural network for semantic pixel-wise segmentation of road and pavement surface cracks. 26th European Signal Processing Conference. pp. 2120–2124. Rome, Italy. DOI 10.23919/EUSIPCO.2018.8553280. [Google Scholar] [CrossRef]
52. Tan, M. (2003). An algorithm for ransacking region connection based on three borderling pixels. Journal of Image and Graphics, 8(3), 322–327. DOI 10.1093/jjco/hyg121. [Google Scholar] [CrossRef]
53. Lai, Y., Chung, Y. (2014). An efficient rasterization unit with ladder start tile traversal in 3-D graphics systems. IEEE Transactions on Magnetics, 50(7), 1–4. DOI 10.1109/TMAG.2014.2301880. [Google Scholar] [CrossRef]
 | This work is licensed under a Creative Commons Attribution 4.0 International License, which permits unrestricted use, distribution, and reproduction in any medium, provided the original work is properly cited. |