| Computer Modeling in Engineering & Sciences |
DOI: 10.32604/cmes.2021.015683
ARTICLE
Optimal Control of Slurry Pressure during Shield Tunnelling Based on Random Forest and Particle Swarm Optimization
1Key Laboratory of Urban Underground Engineering of the Education Ministry, Beijing Jiaotong University, Beijing, 100044, China
2School of Civil Engineering, Beijing Jiaotong University, Beijing, 100044, China
3China Railway 14 Bureau Group Co., Ltd., Jinan, 250101, China
*Corresponding Author: Dalong Jin. Email: jindalong@163.com
Received: 04 January 2021; Accepted: 18 March 2021
Abstract: The control of slurry pressure aiming to be consistent with the external water and earth pressure during shield tunnelling has great significance for face stability, especially in urban areas or underwater where the surrounding environment is very sensitive to the fluctuation of slurry pressure. In this study, an optimal control method for slurry pressure during shield tunnelling is developed, which is composed of an identifier and a controller. The established identifier based on the random forest (RF) can describe the complex non-linear relationship between slurry pressure and its influencing factors. The proposed controller based on particle swarm optimization (PSO) can optimize the key factor to precisely control the slurry pressure at the normal state of advancement. A data set from Tsinghua Yuan Tunnel in China was used to train the RF model and several performance measures like R2, RMSE, etc., were employed to evaluate. Then, the hybrid RF-PSO control method is adopted to optimize the control of slurry pressure. The good agreement between optimized slurry pressure and expected values demonstrates a high identifying and control precision.
Keywords: Shield tunnelling; slurry pressure; optimal control; random forest; particle swarm optimization
The slurry pressure balanced (SPB) shield tunnelling method has been widely used in underground space development for its strong geological adaptability, small impact on the surrounding environment and high degree of mechanization [1]. At present, the stability of the tunnel face was usually controlled and adjusted according to the experience of shield operators during SPB shield tunnelling and false decisions were often encountered [2,3]. Large settlement or even face collapse may take place if the slurry pressure is too small while the surface heave or even blow-out accident may happen if the slurry pressure is too large [4,5]. Thus, high precision and control of the slurry pressure are requested during SPB shield tunnelling.
A great number of different factors such as the machine driving state [6], the cutter head [7,8], as well as the environmental conditions [9,10], result in the control face stability to be very complex [11]. So it should be a high dimensional data mining that the theoretical or empirical methods could not figure out. The artificial intelligence method has good non-linear mapping ability and has been widely applied in the prediction [12–14] and optimized control [15,16] of shield tunnelling. In terms of stability control of excavation face, earlier researches mainly focused on EPB (earth pressure balanced) shield [17–20]. Several artificial intelligence models like least squares support vector machine (LSSVM) [21,22], backpropagation (BP) [23,24], artificial neural network (ANN) [25], and adaptive neuro-fuzzy inference strategy (ANFIS) [26,27], etc., were applied in the settlement prediction and optimization of soil pressure control. Liu et al. [21] proposed a predictive control strategy for earth pressure which was balanced by optimizing advance speed and screw conveyor speed based on the least squares support vector machine. Cheng et al. [23] presented an optimal control method that the tunnel face was controlled by an optimal screw conveyor speed derived from particle swarm optimization. Nevertheless, according to the difference of principle between EPB and SPB, slurry pressure control is different from soil pressure control which means the previous models are unsuitable for SPB shield [6]. Thus in recent years, more and more researchers have begun to pay attention to the control of slurry pressure [28,29]. Zhou et al. [30] presented a predictive control system for air chamber pressure in slurry shield tunnelling using ENN neural network model. However, it is the slurry pressure instead of the air chamber pressure in front of the excavation face. Li et al. [31] proposed a controller to keep the earth pressure and slurry circulation system pressure in balance based on the predictive function control method. But it is only suitable for the direct type slurry shield machine which is not proper for more commonly used indirect type slurry shield machine. Li et al. [6] established the complex relationship between slurry pressure and tunnelling parameters based on diagonal recurrent neural network (DRNN) and presented a model predictive control (MPC) system for the slurry pressure balance during construction. Nevertheless, among the input features of the model, some significant factors influencing slurry pressure like the geometry of tunnel or geological conditions were not taken into consideration.
To control the balance between the slurry pressure and the external water and earth pressure during shield tunnelling. Firstly, an identifier needs to be established that can adapt to the changes of environmental conditions and predict the slurry pressure during shield tunnelling. Then, based on the proposed identifier model, a controller should be put forward to optimize the key control factor by minimizing the difference between the slurry pressure and the external water and earth pressure. In terms of the identifier model, random forest (RF) is a pattern recognition method based on a “holistic learning” strategy, which has been increasingly favored by researchers in recent years [32,33]. It was proved that tree-based models have good performance and are superior to network-based models [34]. Many applications of the RF algorithm in related fields of civil engineering can be found such as tunnel-induced ground settlement prediction [14,35,36], control [37], and condition assessment [33] of EPB shield, etc. Generally, the RF algorithm generates many predictor variables and the prediction accuracy is improved by the use of average while the overfitting is controlled by reducing the overall variance. Thus, it’s very stable because the wrong prediction is made only when more than half of the base predictors have errors [38]. Therefore, considering the complex and non-linear relationship between slurry pressure and its influencing factors, the RF was employed to identify the slurry pressure in this study.
In terms of the controller model, particle swarm optimization (PSO) is a powerful optimization algorithm proposed by Kennedy et al. [39] for finding a global optimum in multidimensional searching space. Based on the benchmark comparisons carried out by Elbeltagi et al. [40], the PSO method was generally found to perform better than other algorithms like genetic algorithms (GA) and ant-colony optimization (ACO) in terms of success rate and solution quality. Various works done by Yagiz et al. [41], Hou et al. [42], etc., have also confirmed the good performance of PSO. In previous research, this optimization algorithm was usually applied to search the hyper-parameters of several intelligent models. But in this study, PSO was employed to investigate the optimal parameter to minimize the difference between the slurry pressure and the external water and earth pressure.
The continuation of this paper is organized as follows. In Section 2, we give some preliminaries on the algorithm applied in this paper and then present the methodology of slurry pressure identification and control model. In Section 3, with python language [43], the data from Tsinghua Yuan Tunnel was processed and an identifier, as well as a controller, was established based on the proposed method. Finally, the result was present and the performance of the proposed method was investigated.
2 Hybrid RF-PSO Based Control Method
2.1 Slurry Support System in SPB
During the SPB shield tunnelling, the excavated soil enters the slurry chamber through the opening of the cutter head and was then carried out by slurry. Therefore, different from the EPB shield of which the tunnel face is supported by soil in the soil chamber, the face stability of SPB shield is maintained by the pressurized slurry mixed with soil in the slurry chamber, as shown in Fig. 1. According to the dynamic balance in the slurry chamber, the slurry pressure regulation mechanism is performed by adjusting air pressure and slurry in and outflow, which are also related to the state of shield tunnelling like thrust, torque, etc. Therefore, the stability of excavation face is a complicated soil-slurry-machine interaction process and many factors are involved including soil environmental conditions, shield mechanical driving state, and slurry circulation system.
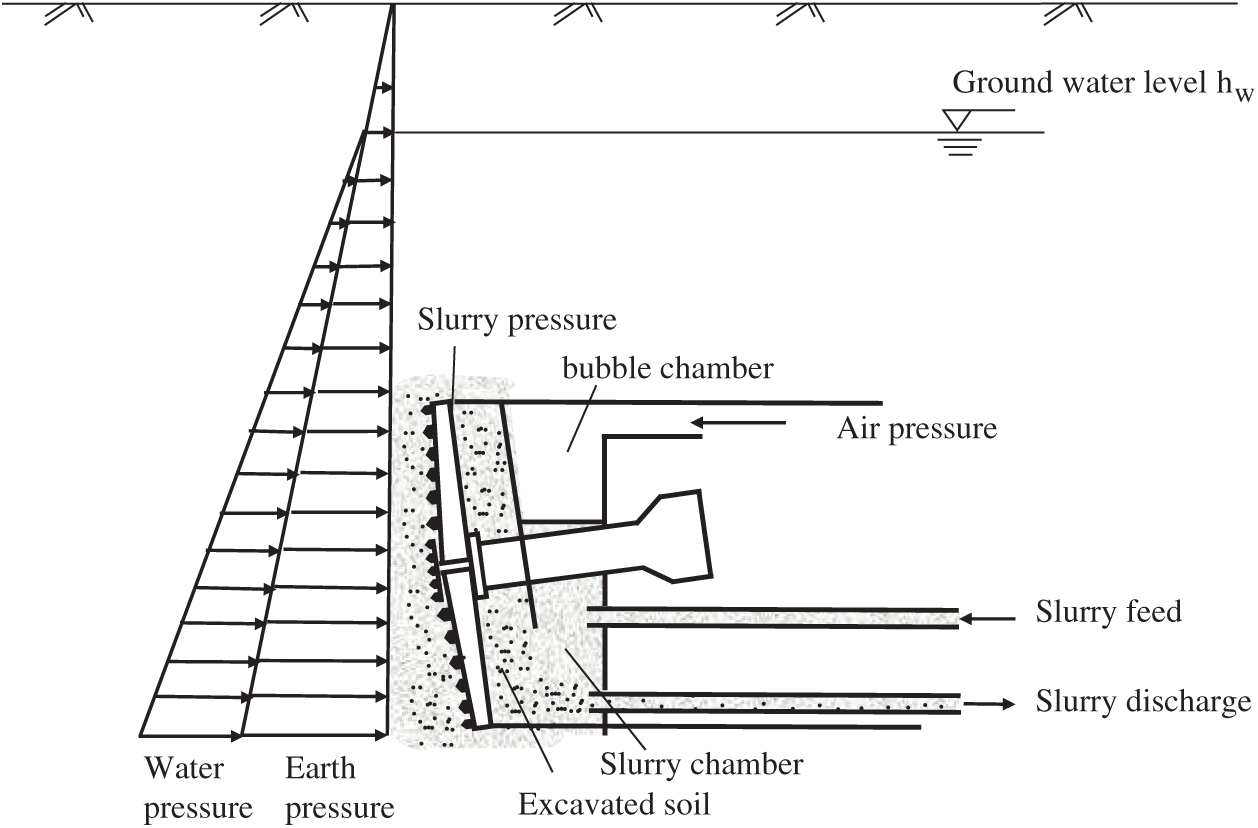
Figure 1: Supporting principle of excavation face in SPB shield
Soil environmental conditions include geometric and geological factors. In terms of geometry, the tunnel diameter and depth have a great influence on slurry pressure. Here, the depth is measured from the tunnel crown to the ground surface. This parameter plays an important role in the control of slurry pressure. As the depth increases (decreases), the slurry pressure has to immediately increase (decrease) otherwise it may cause instability of the excavation face. In terms of geological parameters, many factors such as soil weight and cohesion that has a great influence on the balance of slurry pressure.
The parameters represent the mechanical driving state of shield comprises advance speed (v) and thrust force (F), rotational speed (n), and torque (T). When the formation is harder or heavier, the thrust and torque required are often greater, which means they reflect the difficulty of soil excavation to a certain extent.
The slurry circulation system is the key part of controlling slurry pressure of which the main parameters are air pressure (Pa), the volumes of slurry feeding per ring (Qf), the volumes of slurry discharging per ring (Qd), the different volumes between slurry charging and feeding (Qdif), the specific gravity of slurry feeding (Gf), the specific gravity of slurry discharging (Gd) and the different specific gravity between slurry charging and feeding (Gdif).
Theoretically, according to the supporting principle of excavation face in SPB shield, the desired supporting pressure of the excavation face should be equal to the static earth and water pressure, which can be expressed as [31,44]:
where
2.2 Slurry Pressure Identification via Random Forest
To predict the slurry pressure during shield tunnelling, it is essential to investigate the factors that may affect the slurry pressure and determine which can be used as input parameters of the identification model. According to the analysis in Section 2.1, the specific parameters can be divided into three categories among which the soil environmental factors are cover to diameter ratio(R = Z/D) that comprehensively consider the influence of tunnel geometric conditions. In this study, all the geological parameters are not taken into consideration for the following reasons: 1) The difference of soil weight and coefficient of static lateral earth pressure in this investigated tunnel section is small; 2) Due to the limitation of geological exploration, continuous geological parameters values are unable to be obtained; 3) To a certain extent, shield mechanical drive parameters can reflect the ground conditions. Therefore, through the above analysis, 12 features were taken into consideration in the identifier model. Besides, what we are concerned with is the precise nonlinear relationship between the slurry pressure and its various influencing factors. Thus, the input of this model are the parameters of one step while the output of the model is still the slurry pressure of this step, which is presented as follows:
2.2.2 Random Forest for Slurry Pressure Identification
Random forest (RF) is a pattern recognition method based on a “holistic learning” strategy, which has high nonlinear mapping ability. It is mainly composed of two main components, namely the Decision Tree (DT) algorithm and the bagging algorithm. In DT, the feature space is continuously divided into subspaces to ensure that all samples in the same subspace are as uniform as possible. For regression problems, space division is usually performed by minimizing the following equation:
where S is the sum of squared errors of the tree, mc is the predicted value of the terminal leaf node in the tree; yi is the output value of sample i in the data set.
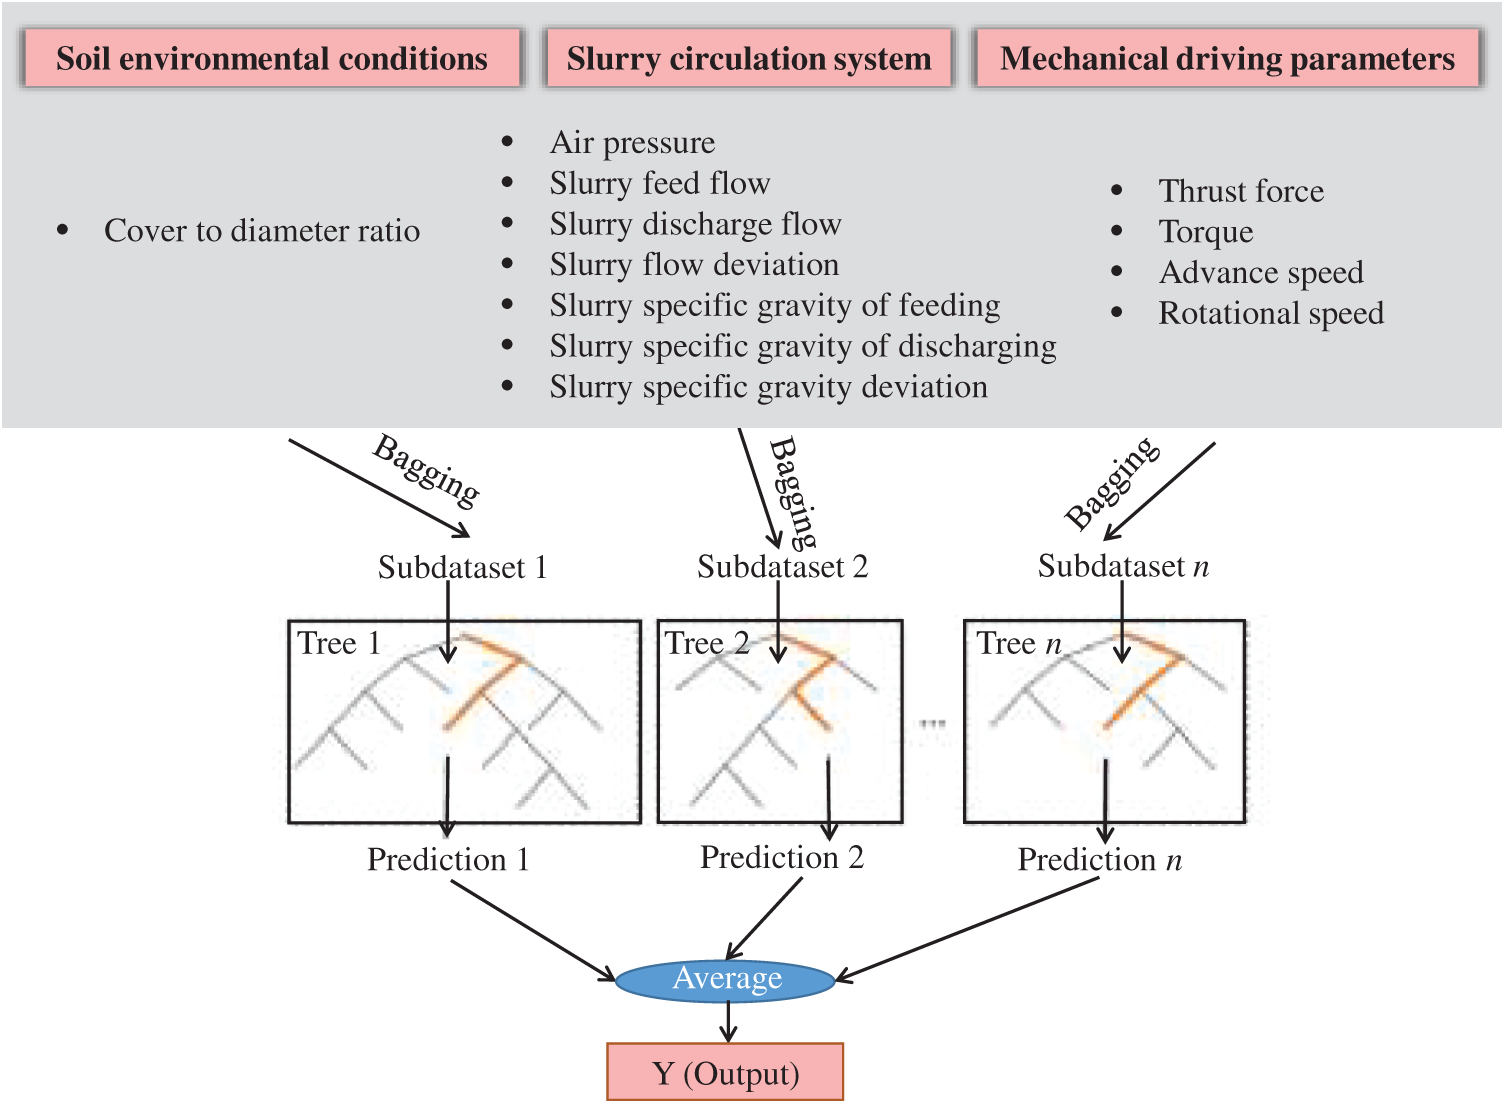
Figure 2: RF-based slurry pressure identification model
Based on the DT algorithm, Breiman [45] proposed a more powerful method, namely the so-called random forest algorithm. It has been proved that “forest” is more robust than “single tree” in many data mining problems and the ability to resist overfitting is stronger. In RF, the training data of each tree is constructed by bagging technology and the results of all decision trees are averaged to improve the modeling accuracy and control over-fitting. Based on the above analysis of input features, Fig. 2 illustrates a general architecture of the RF-based slurry pressure identification model and n represents the number of trees constructed in the random forest. Besides, the relative importance of characteristic variables can also be obtained through impact analysis of features on model predictions.
It is necessary to tune the hyperparameter of the RF model since different hyperparameters result in different performance. The cross-validation method can reduce the overfitting of a model to a certain extent when it was used to evaluate the prediction performance of the model, especially the performance of the trained model on new data [44]. Simple cross-validation is to randomly divide the data set into the training set and test set according to a certain proportion while the data set of the K-fold cross-validation method is divided into k small pieces as illustrated in Fig. 3. The validation set and the test set form a complement to each other and the average is finally obtained.
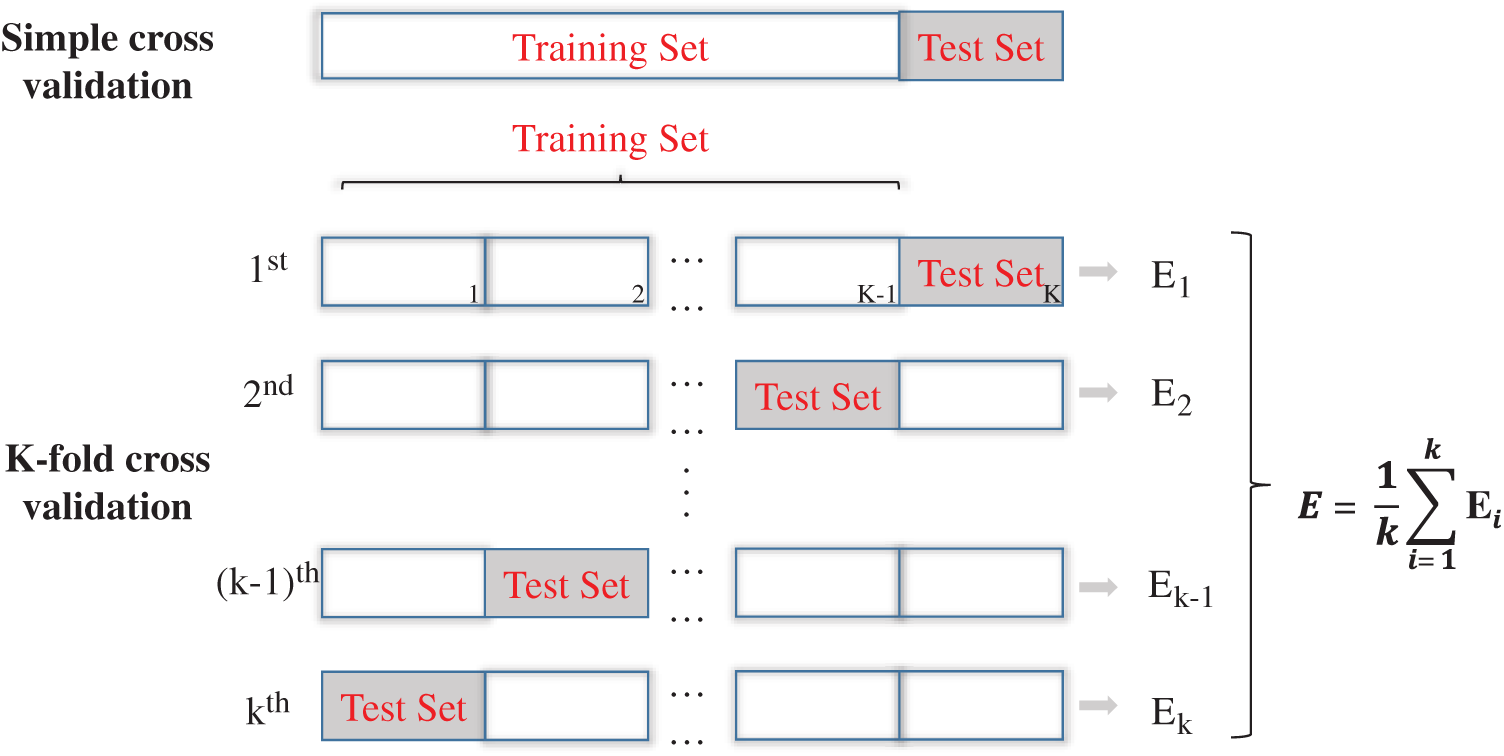
Figure 3: Diagram of the cross-validation method
Usually, the original data set is randomly divided into a training set and a testing set. The training set is used to build a regression model and the test set is used to prove the predictive ability of the model on new data. Generally, the proportions of the training set and the testing set depend on the quality and accuracy of the data as well as the structure of the network itself. If the proportion of the training set is too small, the model will not be able to make predictions; if the proportion of the training set is too large, the model will closely match the results of the training set and will not give good prediction results for new data. According to the optimization analysis, this paper finally uses 70% of the data set for training and the remaining 30% for model testing [44]. As long as a certain range of parameters is entered, multiple parameter combinations will be systematically traversed and the best hyperparameter will be determined through k-fold cross-validation (CV). The calculation time and variance should be considered when determining the k value of CV. According to the suggestion by Friedman et al. [46], set k to 5 is enough for the hyperparameter-tuning, that is, the training set is randomly divided into five subsets, four of which are used to train the RF model and the remaining subsets are used to verify the performance of the RF model. Repeat the training and verification process five times, each time using a different subset for verification. The performance of the random forest model on the training set is obtained by averaging the performance of five rounds of training and verification. The flow chart of RF model development is illustrated in Fig. 4.
To evaluate the performance of the model during the tuning of the model, a scorer which is a metrics is designated to score training results. All score metrics follow the following principle: a higher return value is better than a lower return value. In this paper, the “explained_variance_score” was applied as shown in Eq. (4):
where
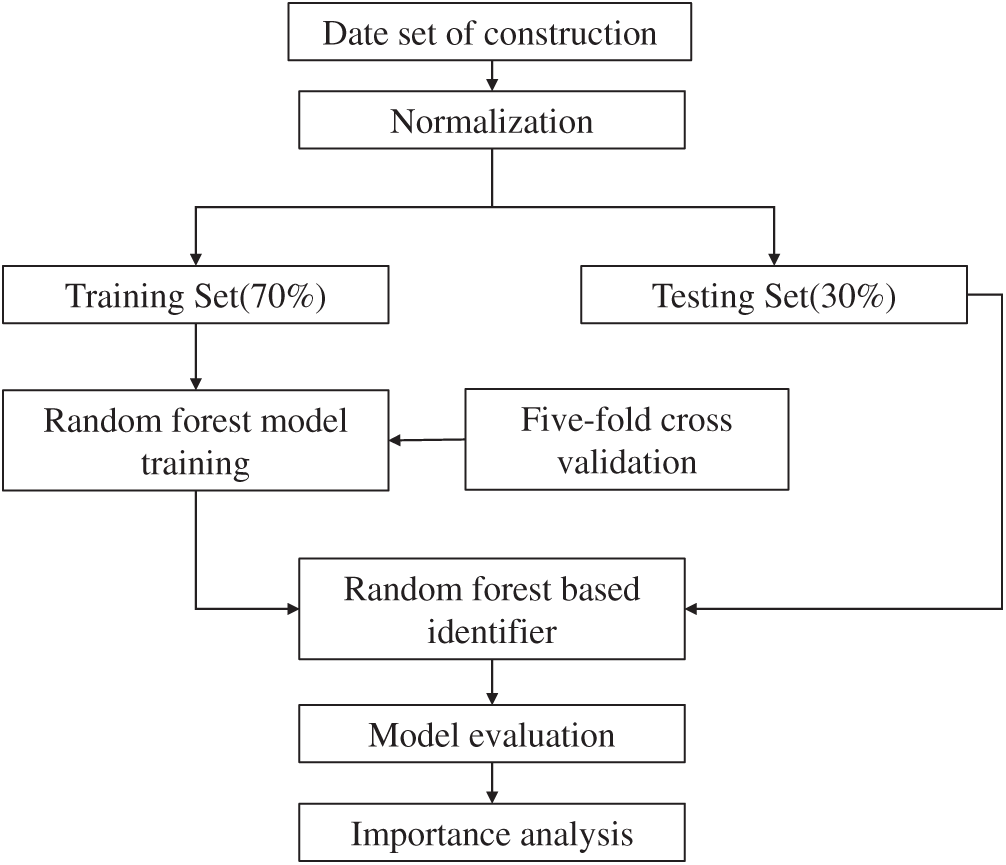
Figure 4: Procedure of random forest model training
2.3 PSO-Based Optimization of Air Pressure
In terms of the slurry pressure control methods, the slurry shield can be divided into two basic types, indirect control type (German-style with bubble chamber) and direct control type (Japanese style without bubble chamber). In the early years of SPB shield development, the excavation chamber only contains a slurry chamber which means stability of the excavation face is maintained by controlling the slurry pressure directly (by the flow of feed or discharge slurry pump). However, the slurry pressure would fluctuate greatly with the change of geological conditions which makes the excavation face stability problem uncontrollable. With the development of shield, the excavation chamber of the current SPB shield machine is usually composed of the slurry chamber and bubble chamber which means the control and adjustment of the excavation face are achieved by the slurry circulation control system and air pressure control system together. Generally speaking, the slurry circulation control system is mainly to adjust the change of slurry flow in and out to keep the slurry level near the axis while the air pressure control system is the major execution module to balance the fluctuation of slurry level and control the slurry pressure indirectly. It should be noted that when the slurry level is beyond the limitation, the operators have to stop driving and regulate the feed or discharge slurry pump to readjust the slurry level [6]. Besides, due to the hysteresis of slurry circulation, it is impossible to control the slurry pressure by the slurry circulation system. Therefore, at the normal state of advancement, the slurry pressure is mainly controlled by the air pressure control system for its high precision and sensitivity. In this paper, only the slurry pressure balance problem in continuous excavation mode was taken into account, thus, the air pressure was optimized in slurry pressure control.
Particle swarm optimization (PSO) is a powerful optimization algorithm based on the swarm behavior of birds or fishes around food, which was applied to search the optimal air pressure in this study. The term “particle” is used here to refer to the individual candidate that defined by velocity (Eq. (5)) and position (Eq. (6)) based on two best fitness values: the best fitness solution of each particle fulfill so far which is pbest and the global best solution gained by any particle in the population which is gbest.
where
PSO starts with a set of particles randomly generated and initialized. Then, according to pbest and gbest values, all particles update their velocities and positions until the optimal solution is finally reached.
The flowchart of the PSO algorithm is demonstrated in Fig. 5.
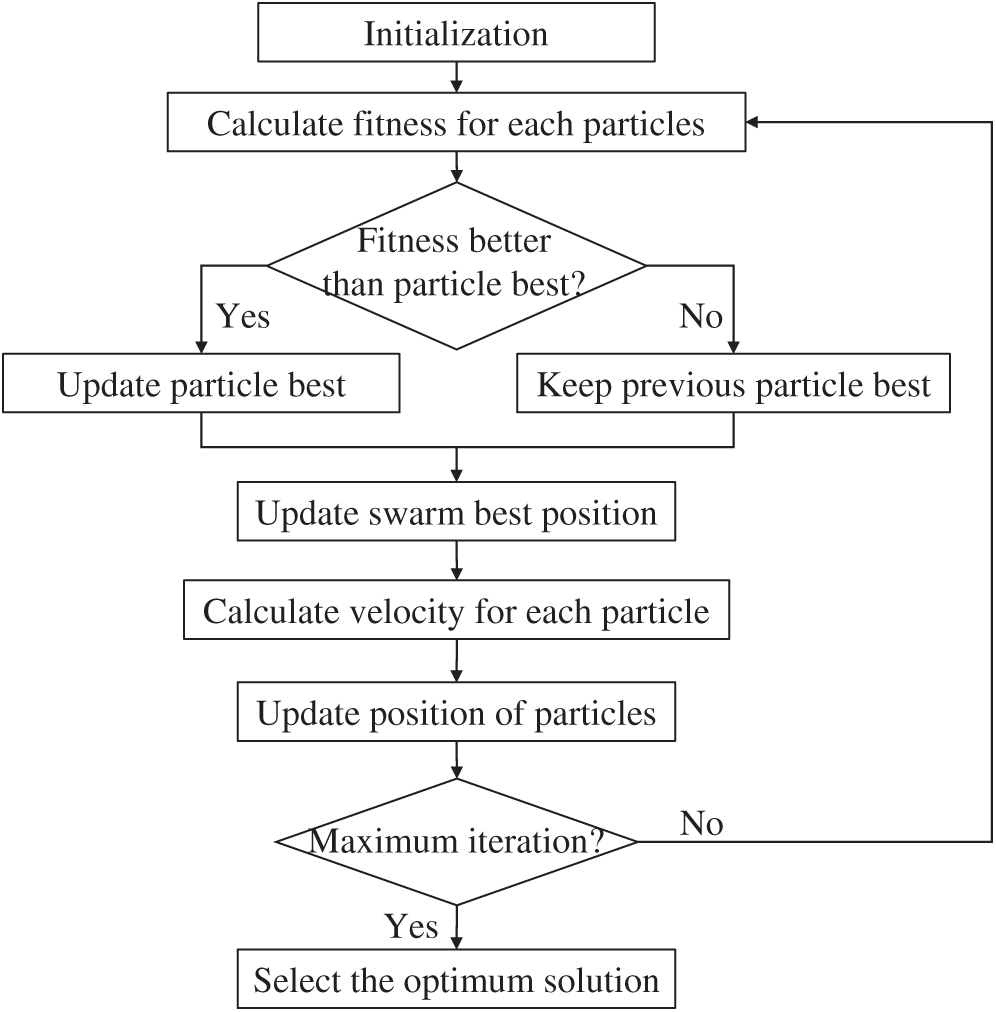
Figure 5: Flowchart of PSO algorithm
2.4 Optimal Control Model of Slurry Pressure
During the shield tunnelling, the most ideal situation for excavation face stability is that the slurry pressure is equal to the desired slurry pressure. However, the environmental conditions and machine statuses change with the advance of excavation which inevitably results in the fluctuation or even mutation of slurry pressure, especially in complex geological conditions. In order to control slurry pressure, it should be identified first. In other words, the slurry pressure needs to be predicted during shield tunnelling and this is the main purpose of the RF model. Then, based on the proposed identifier model, a controller is established to reduce the fluctuation and make the slurry pressure as close to the expected value as possible. Therefore, the optimization function can be described as follows:
where
To control the slurry pressure during shield tunnelling, a control method based on PSO and RF model mentioned above was developed and its procedure is shown in Fig. 6, where Pms is monitored slurry pressure during shield tunnelling. When the slurry pressure on the excavation surface is equal to the expected static water and soil pressure, the shield will continue to move forward. If the slurry pressure is not equal to the expected static water and soil pressure, the optimized value of air pressure will be searched aiming to output the predicted slurry pressure which has the minimum difference from the expected value. Then, the suggested air pressure will be given by the PSO-based optimizer.
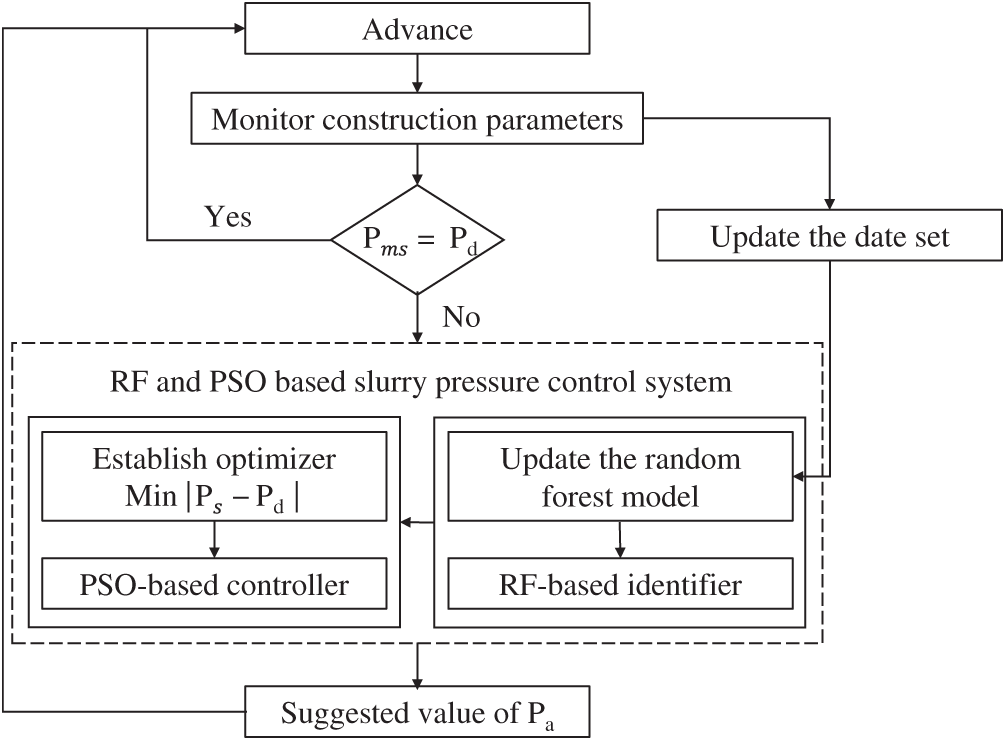
Figure 6: Procedure of slurry pressure control based on RF and PSO
The methodology of the RF-PSO model has been explained above. This section demonstrates the application of the proposed model through a practical tunnel project to validate the performance of it.
Tsinghua Yuan Tunnel is an urban underground tunnel of the Beijing-Zhangjiakou High-speed Railway in Beijing. Two SPB shield with a diameter of 12.64 m was applied and the external and internal radii of the segmental lining of the tunnel are 6.1 and 5.55 m respectively. The 3#~2# section of the shield tunnel was 1741 m long that launched from shaft 3 and ended in shaft 2. The profile of geology is illustrated in Fig. 7, the buried depth of the tunnel is 6.8 m in the area of the 3# launching shaft and then descended with a gradient of 12.9%. When the tunnel reached shaft 2, of which the buried depth increased to 19.18 m.
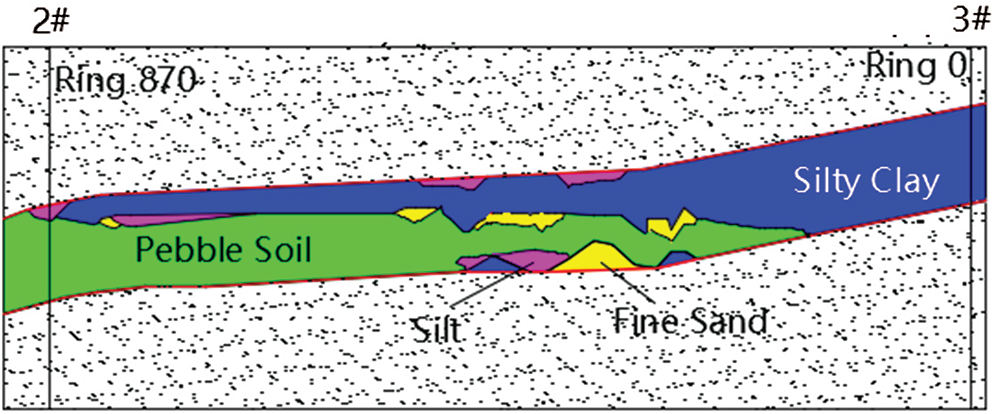
Figure 7: Geological profile of 3 #–2 # interval
In this study, a total of 450 sets of data from ring 0 to ring 449 were investigated. The section from the 0th ring to the 225th ring is almost silty clay while the section from the 225th ring to the 449th ring is an interlayer structure of pebble soil, sand, and silty clay. The frequency histogram of each parameter during shield tunnelling is shown in Fig. 8, most of them have a wide distribution, indicating that the state of the shield machine changes greatly during construction and the parameters have been adjusted frequently.
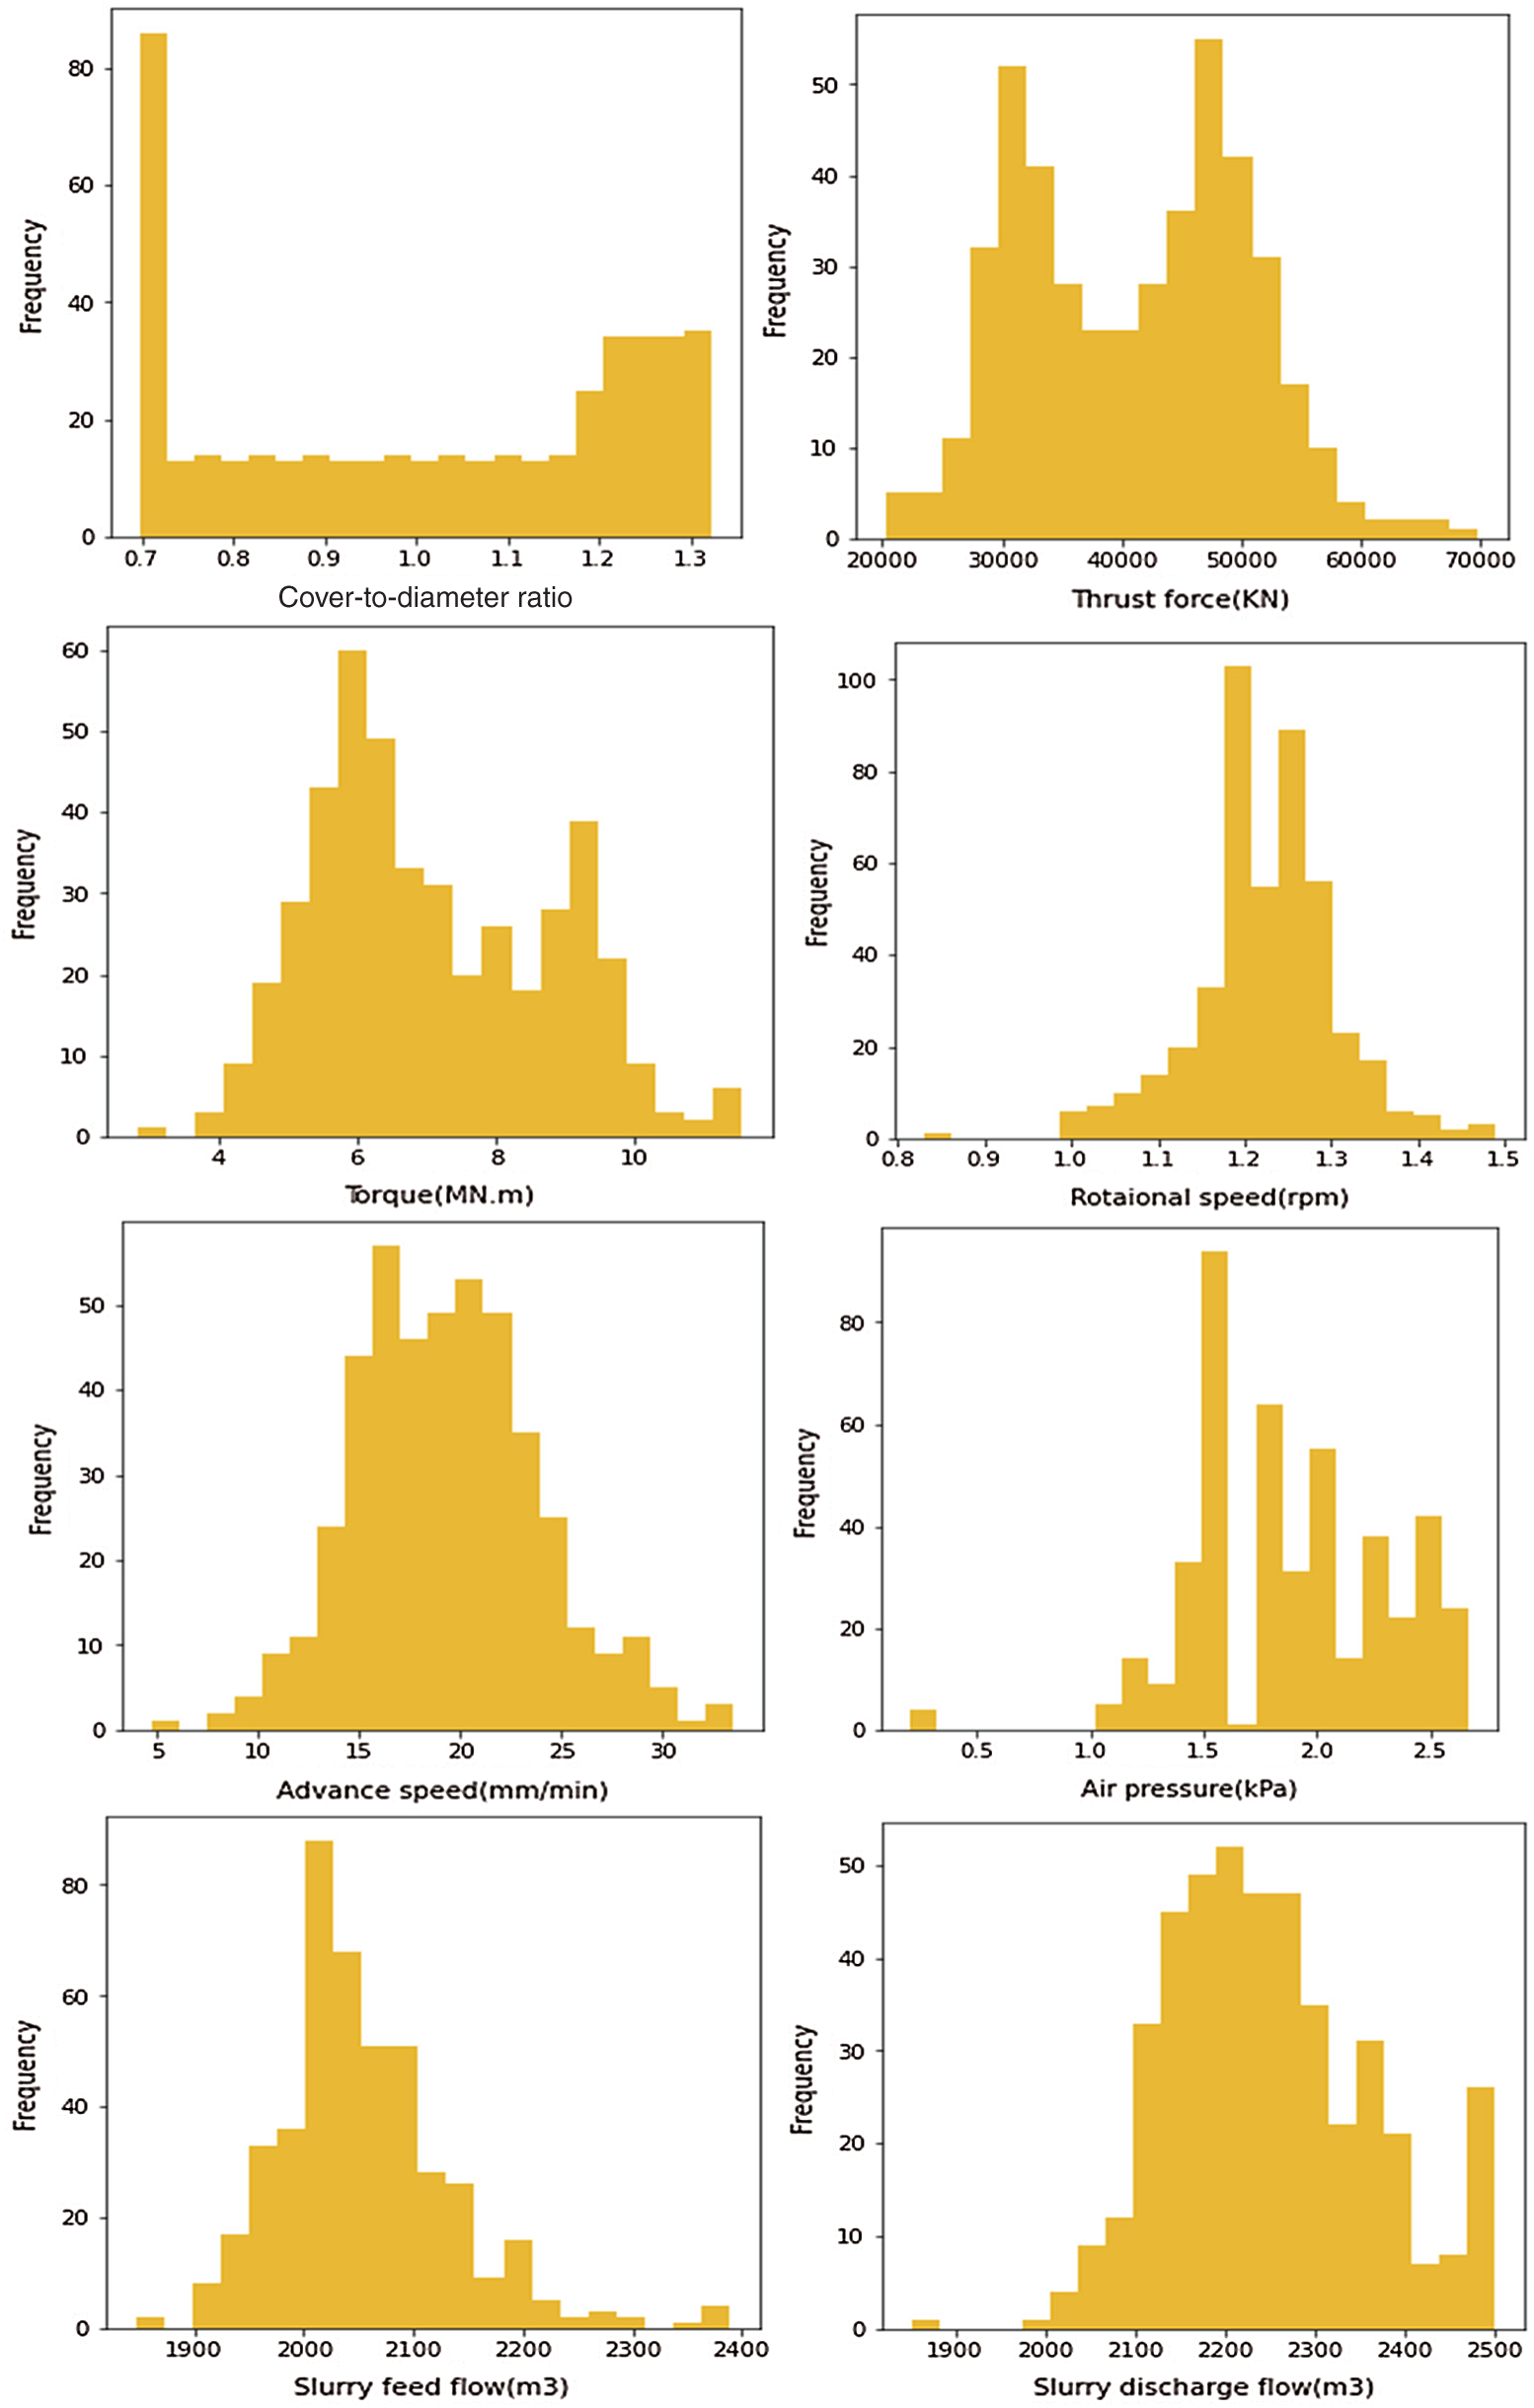
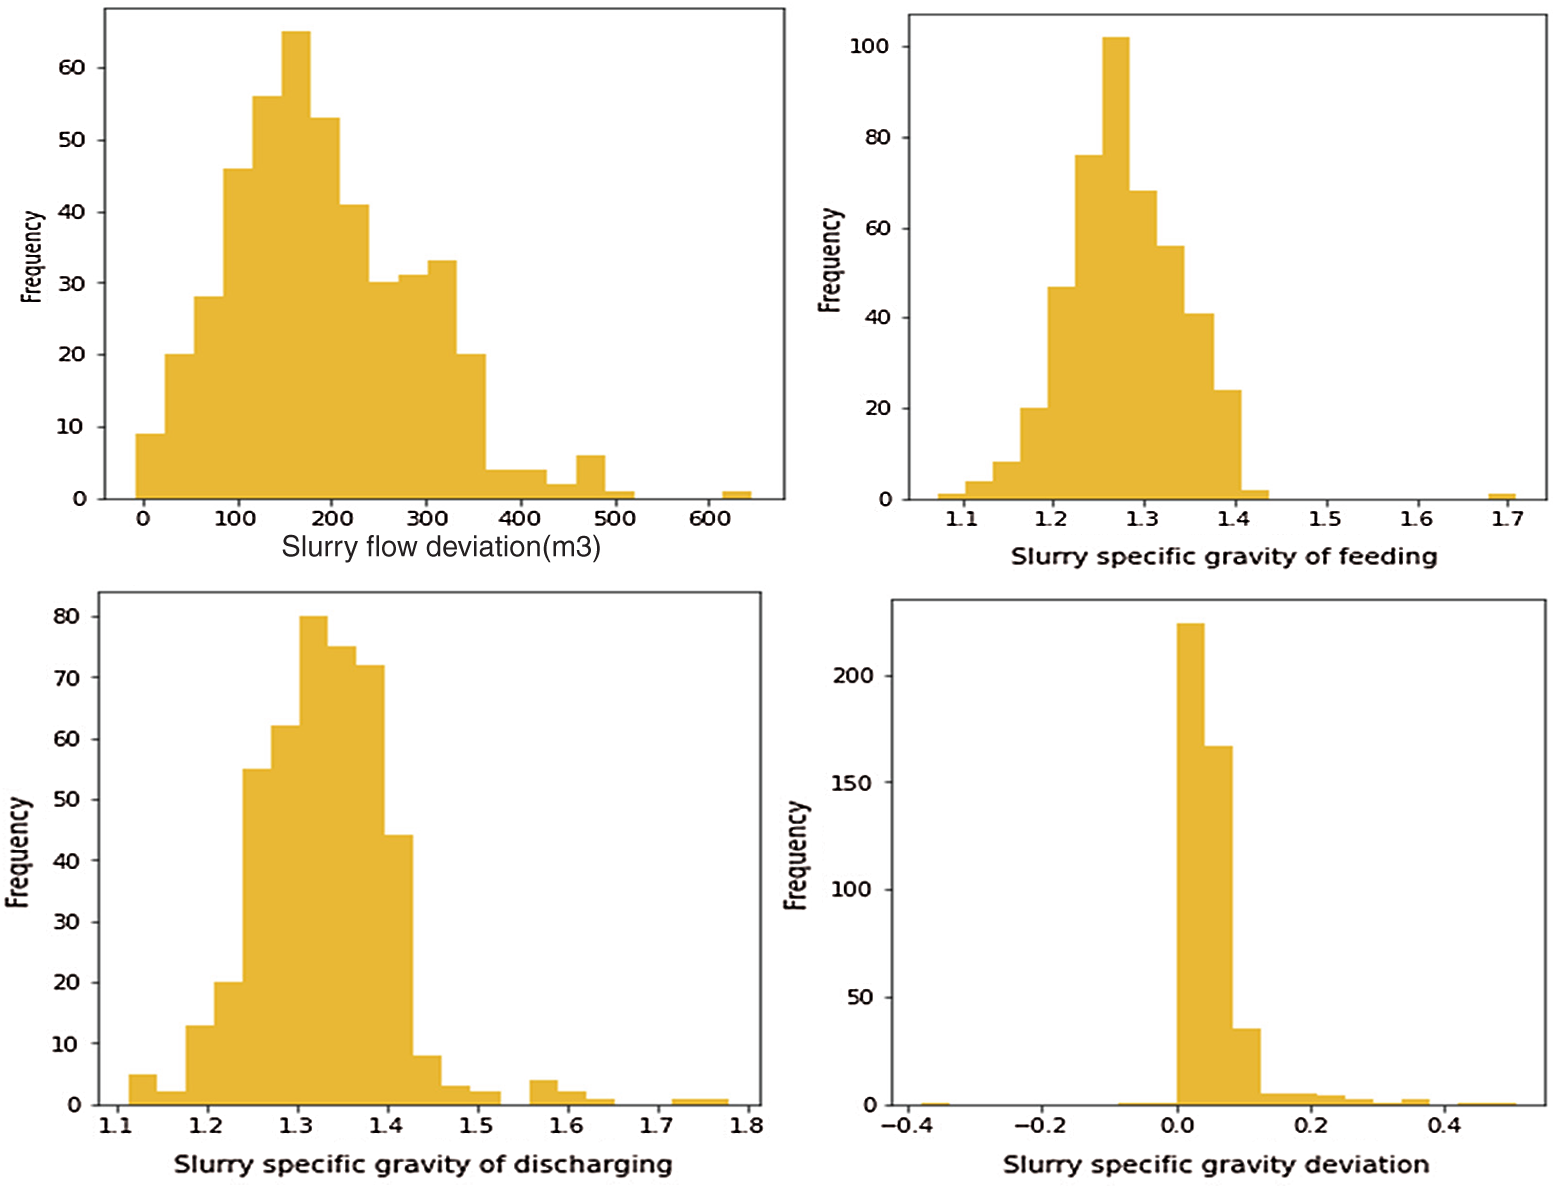
Figure 8: Parameter frequency histogram
Pearson correlation coefficient is an effective index to evaluate the correlation which is shown as Eq. (8). The correlation between all parameters of the model is analyzed through the seaborn library based on python and the correlation heat map is shown in Fig. 9, where the lower-left corner is the heat map mode and the upper right corner is the corresponding correlation value.
where
As can be seen, the input parameters have a strong correlation with slurry pressure especially air pressure, cover to diameter ratio, thrust force and torque, of which the correlation value exceeds 0.5. Furthermore, the correlation between ratio and thrust force, torque respectively were 0.86 and 0.8, which verified that thrust force and torque can reflect the geological conditions to a certain extent. Additionally, if the variance of one feature is much larger than the other, then it may dominate the objective function and result in the model unable to learn from the other features correctly as expected. Therefore, the input data are normalized to the range of [0,1] to speed up the convergence of the RF model. The normalization processing method is as follows:
where
4.1 Performance of the Hybrid RF-PSO Model
According to section 2.2.2, 70% of the data set (315 groups) was used for training and the remaining 30% (135 groups) was for model testing. The optimal hyperparameters of the slurry pressure identifier model are obtained by five-fold cross-validation. Among all hyperparameters, the number of the estimator (tree) has the most influence on the performance of the RF model, followed by the max depth and max features. Thus, the tuning order of the training model is the number of estimators, max depth and max features. Eventually, the value of these hyperparameters is 1100, 15 and 7, respectively, which were tuned by the five-fold cross-validation method. The final performance score of the random forest model on the training set and test set is 0.963 and 0.946, respectively. To illustrate the advantages of the RF model, the backpropagation (BP) neural network and support vector regression (SVR) were also employed to train the data for comparison. To avoid the influence of determination of the hyperparameters on the comparison results, the hyperparameters of these three models were also tuned by the five-fold cross-validation. The comparison of the measured and predicted values of the slurry pressure on the training set and the test set is shown in Fig. 10.
As can be seen, scattered data in both plots are all close to the line of equality (shown as the solid line) in the training set and the testing set, demonstrating the good accuracy of these three models. Furthermore, the width of data of the RF model is narrower than BP and SVR model, which means its deviation from the expected value is smaller and it can also be proved in the following Tab. 1. Additionally, in terms of computational time, the most time-consuming algorithm is BP neural network and followed by SVM and RF between which there is not much difference.
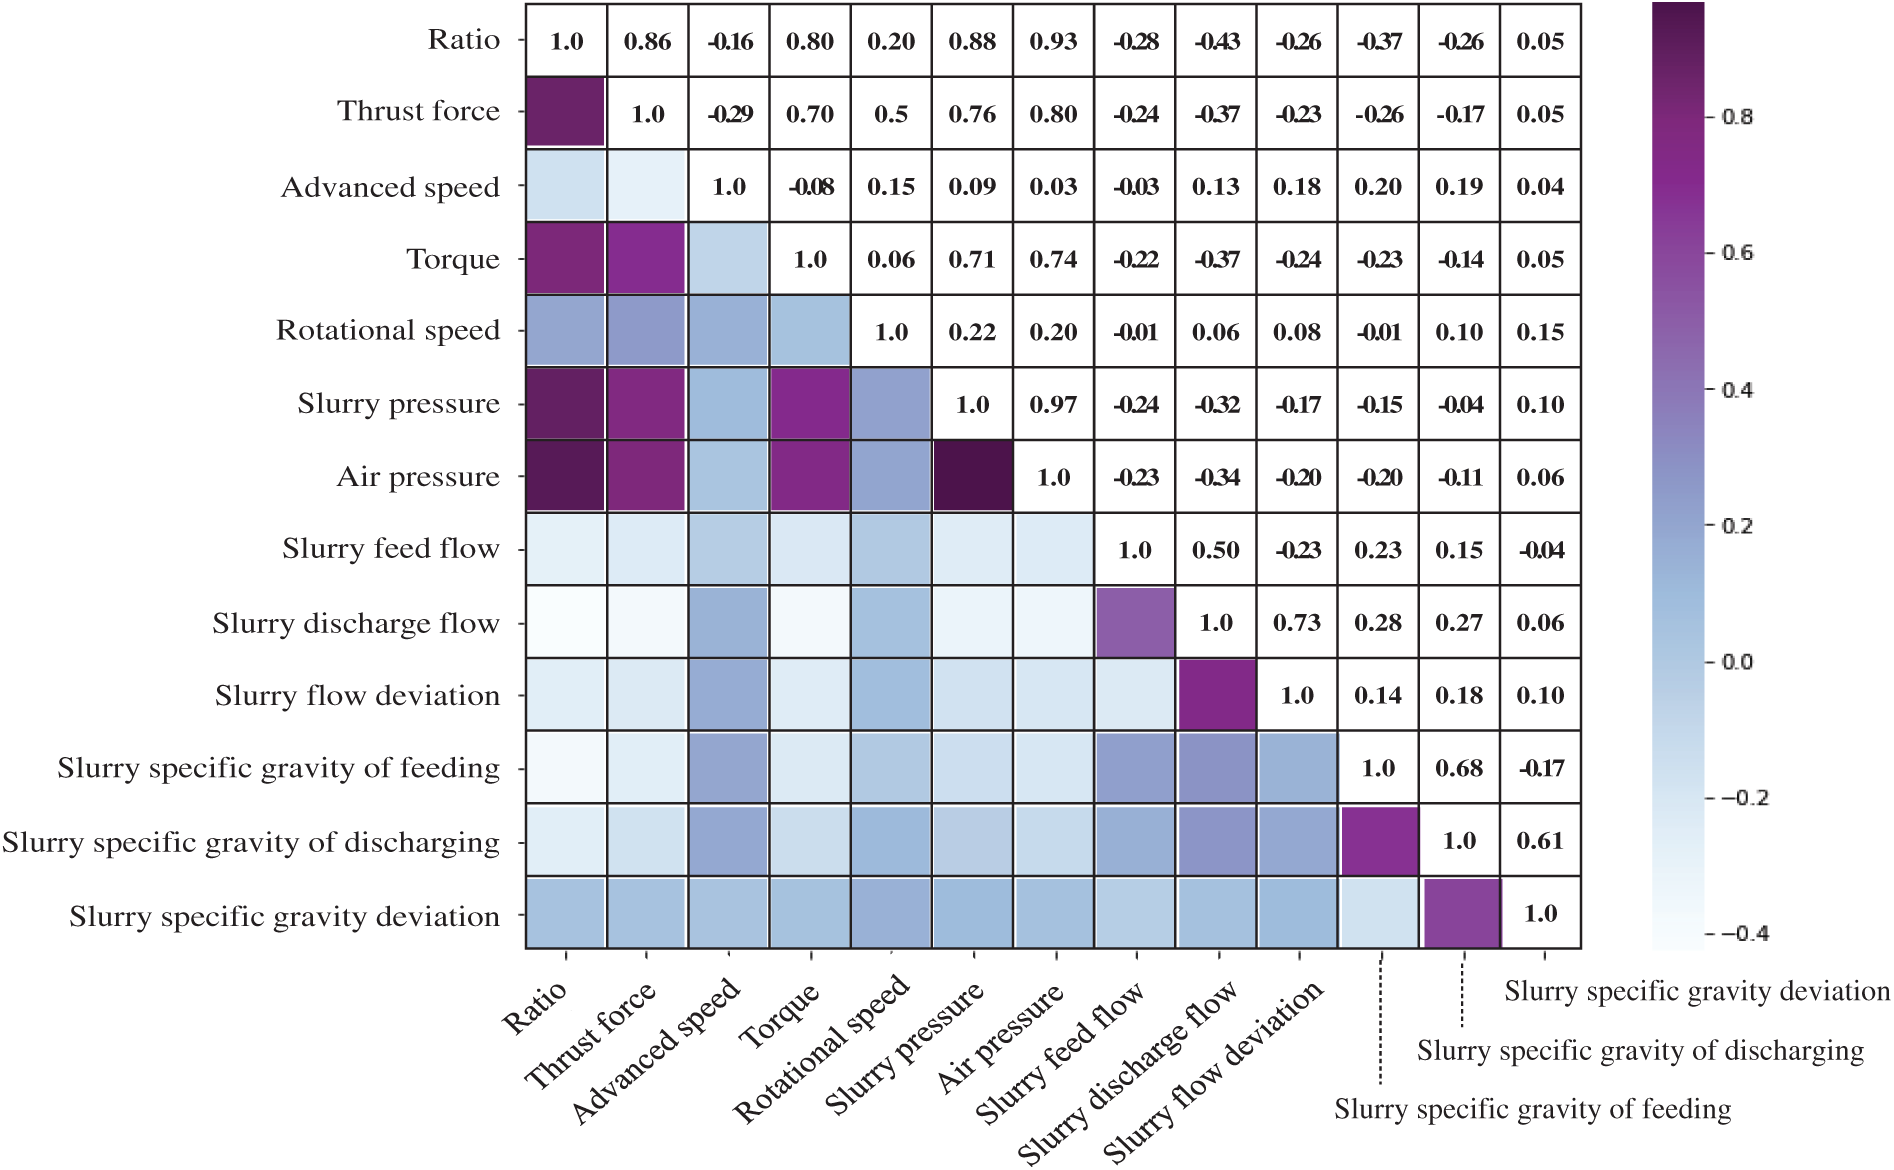
Figure 9: Parameter correlation heatmap
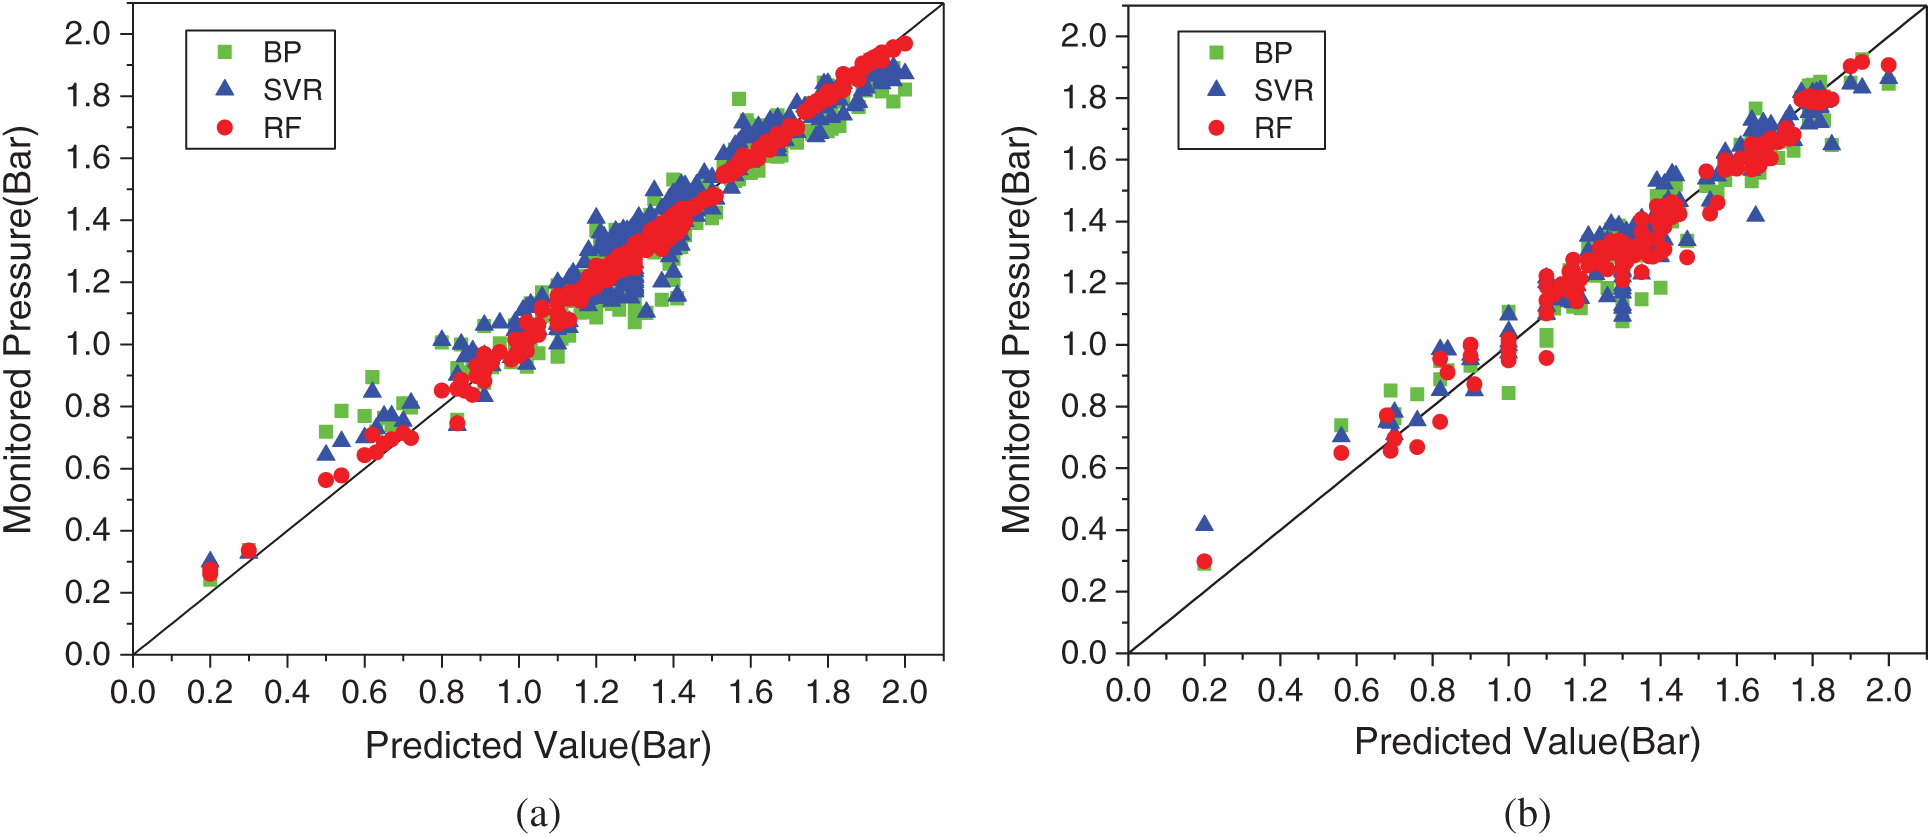
Figure 10: Performance of the selected models. (a) Training Set (b) Testing Set
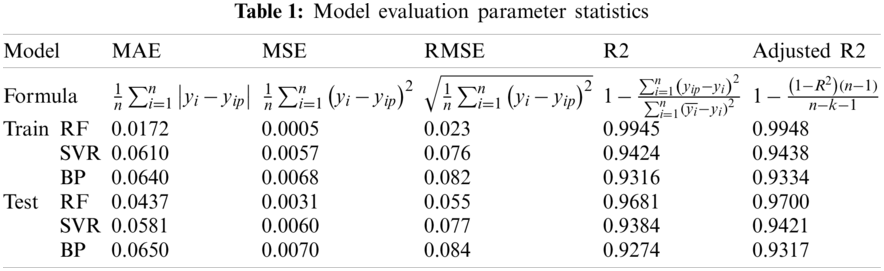
The network performance evaluation indices of each model on the training set and test set are listed in Tab. 1. The mean absolute error (MAE), mean square error (MSE), root mean square error (RMSE), coefficient of determination (R2), adjusted coefficient of determination (Adjusted R2) were calculated. A small value of MAE, MSE, RMSE and great values of R2 and adjusted R2 indicates a good prediction accuracy of the model. The results of the RF model are better than the other two, indicating that the model has high non-linear mapping ability and strong generalization ability. In terms of RMSE, the RF model is 69.7% and 72.0% less than the SVR model and the BP model respectively on the training set while on the test set are 28.6% and 34.5%. In terms of R2, the RF model is 5.4% and 6.6% higher than the SVR model and BP model respectively on the training set while on the test set are 3.0% and 4.1%. The comparative analysis with SVR model and BP model elucidates that the RF model can predict the slurry pressure with reasonable accuracy.
where
Based on the proposed RF model, a control model that keeps the slurry pressure in line with the desired one as much as possible during shield tunnelling was established. The tuning parameters of PSO including the maximum number of iterations (IterMax), the population size (PopSize), the lower and upper boundaries of a variable (VarMin and VarMax) have been selected as follows: IterMax = 1000, PopSize = 100, VarMin = 0, and VarMax = 1.5. The two parameters of the personal learning coefficient (c1) and the global learning coefficient (c2) are set to be 1.5 and 1.5, respectively, which were determined by several trial and error runs. The optimization results are illustrated in Fig. 11, the slurry pressure after the optimization by PSO can consistently conform to the desired values represented by the blue dotted line, which means the control model has a good tracking ability to the expected value. Furthermore, the fluctuation of the optimized slurry pressure is much smaller throughout the 450-ring section while the monitored slurry pressure fluctuated significantly, To quantify the performance of the optimization, the index MAE was applied to measure the difference between the expected slurry pressure before and after optimization. The MAE between the monitored and desired slurry pressure is 48.06 while it is 17.10 between the optimized and desired, which proves the good performance of the control model.
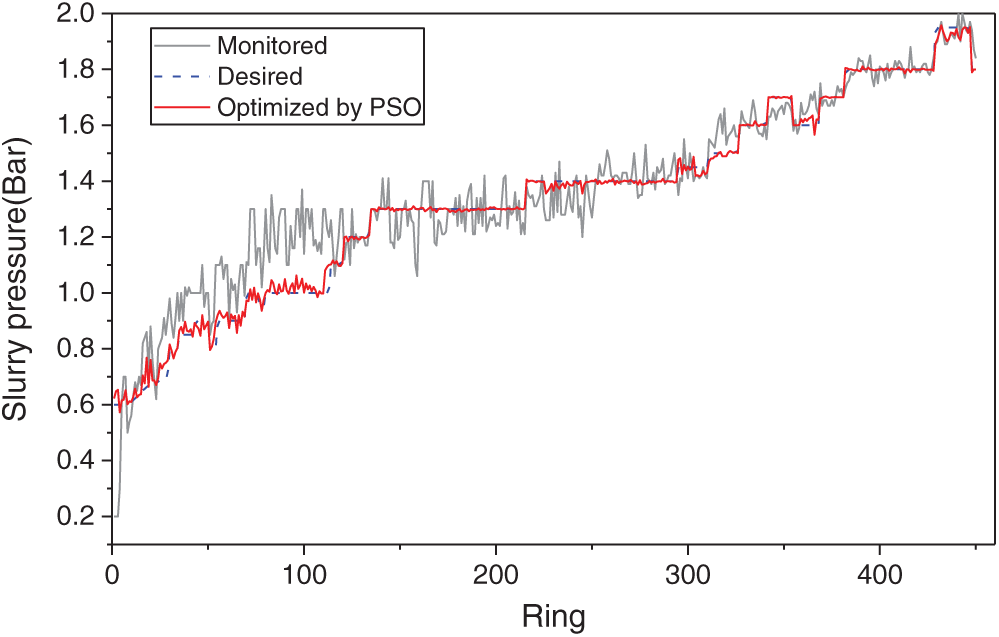
Figure 11: Slurry pressure solved by PSO
The main job of the controller model is to minimize the difference between slurry pressure and desired support pressure of excavation face by searching for the optimal air pressure. The suggested air pressures solved by PSO are shown in Fig. 12. The air pressure was relatively stable before the optimization. The optimized results indicate the air pressure should be dynamically adjusted to provide an accurate slurry pressure. The proposed control strategy in this paper can effectively control the fluctuation of slurry pressure at the normal of advancement.
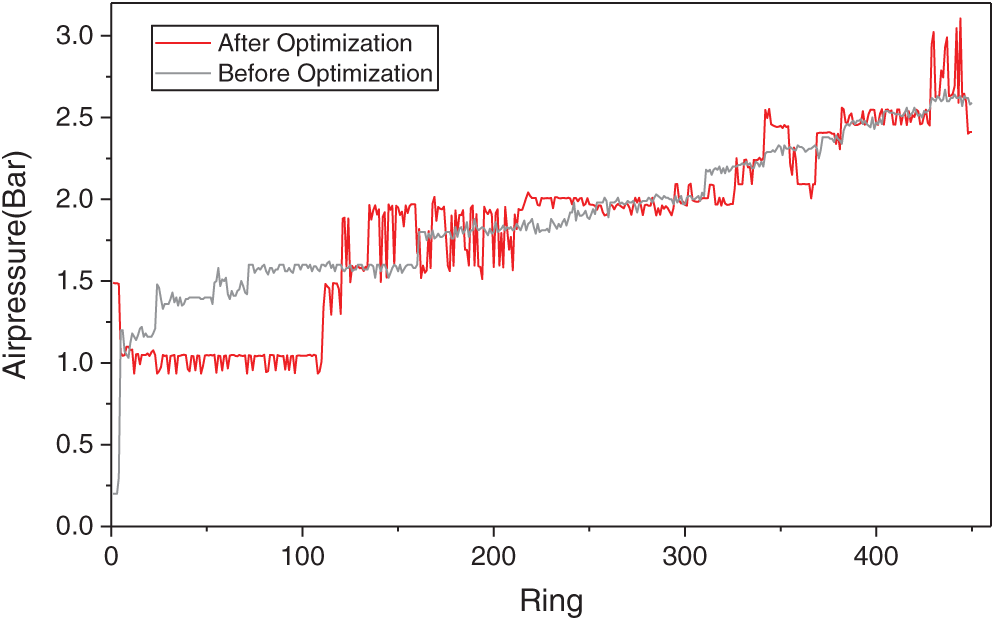
Figure 12: Comparison between the air pressure before and after optimization by PSO
As mentioned before, the impact of features on model predictions can be obtained based on the importance analysis of RF. Generally, in the random forest regression model, the statistic R2 is used to characterize the relative importance. The importance score of the feature is normalized (the sum of all importance scores is 1) and the result is shown in Fig. 13 below. It shows that the soil environmental parameters, shield mechanical driving parameters and slurry circulation parameters account for the total importance of 0.342, 0.143 and 0.515, respectively, indicating that the slurry parameters have the greatest impact on the prediction results. Among them, the parameter that has the greatest influence on the slurry pressure is certainly the air pressure, which accounts for almost half of its importance. Hence, that is why the air pressure is usually selected to control the slurry pressure in engineering practice. Furthermore. the most influential mechanical driving parameter is thrust and followed by torque. It should be noted that the results of importance analysis and correlation analysis keep basic consistency, which indicates that a higher correlation with slurry pressure means greater importance on it.
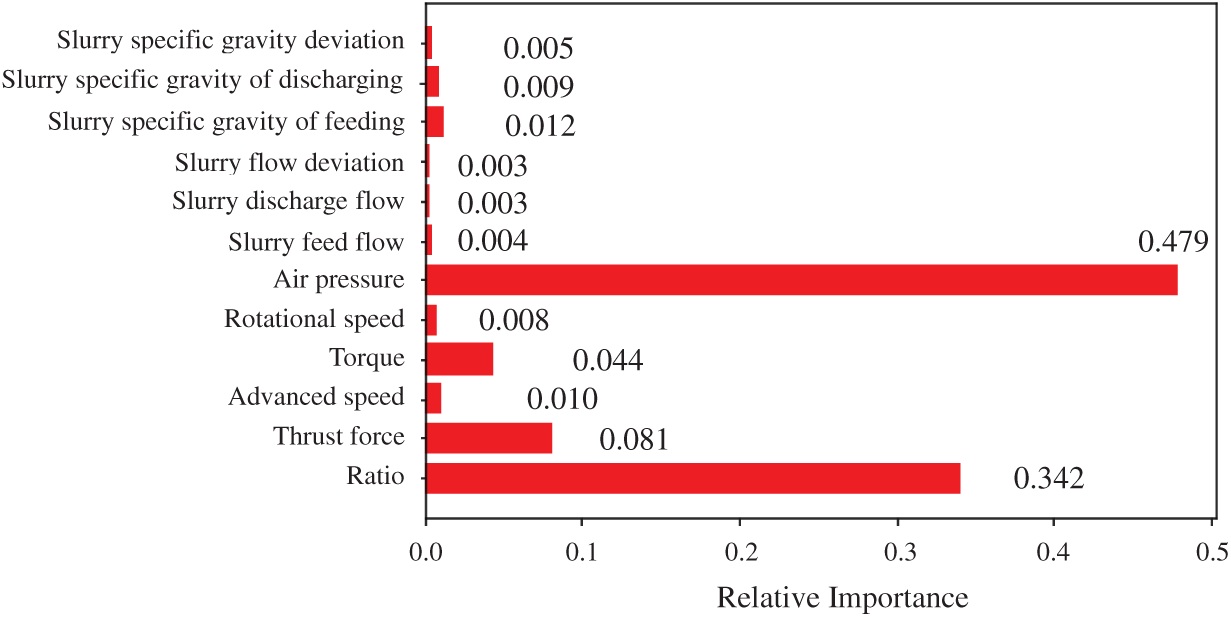
Figure 13: Relative importance of the input variables selected in the RF model
In practical applications, the proposed model can provide initial estimations of slurry pressure. With the prediction model of slurry pressure, control factors can be optimized and the suggested value will be given. Briefly, the improved model in this research is expected to provide insightful suggestions to support operators in the control of face stability during slurry shield tunneling. However, in this research, only air pressure is considered which means the given suggestion is limited during slurry shield tunneling and slurry parameters should also be taken into consideration in the future study. Besides, more data should be trained to improve the accuracy of the proposed model.
In this study, with python language, a dynamic identifier is constructed based on RF to perform the complex relationship between slurry pressure and its affecting factors. Then, combined with the trained RF model, a PSO-based controller was designed to optimize the air pressure to control slurry pressure during shield tunnelling. The proposed model is applied to a case study of Tsinghua Yuan Tunnel in Beijing. To illustrate the advantages of the RF model, the SVR model and BP model were also employed for comparison. Finally, the hybrid RF-PSO control method was applied in the optimization of slurry pressure. Major conclusions are obtained as follows:
1. Based on the RF algorithm, a reasonable relationship between slurry pressure and three main aspects including soil environmental factors, shield mechanical driving state and slurry circulation system was obtained. The performance of this identifier model on the training set and test set were 0.963 and 0.946, respectively, indicating the high nonlinear mapping ability and strong generalization ability of this model.
2. Through comparative analysis with the BP model and SVR model, the RF model has smaller RMSE and greater R2, which indicates that the RF model demonstrates better prediction accuracy of slurry pressure than the SVR model and BP model.
3. According to the importance analysis, the soil environmental parameters, shield mechanical driving parameters and slurry circulation parameters account for the total importance of 0.342, 0.143 and 0.515, respectively. Among them, air pressure has the greatest influence on slurry pressure, which accounts for almost half of its importance and is followed by the cover to diameter ratio, which accounts for 0.342.
4. The optimized slurry pressure shows good agreement with the target support pressure, which means the proposed model has great performance in the control of slurry pressure during shield tunnelling. Compared with the field data in Tsinghua Yuan Tunnel project, the fluctuation of optimized slurry pressure was significantly reduced.
5. The proposed method is recommended as a useful tool to provide suggestions for slurry pressure control during shield tunnelling. Further work is needed to enlarge the database and promote the applicability of the hybrid RF-PSO-based control model for slurry pressure.
Funding Statement: This work was supported by the Fundamental Research Funds for the Central Universities (2020YJS141), the Key Project of High-speed Rail Joint Fund of National Natural Science Foundation of China under Grant No. U1834208.
Conflicts of Interest: The authors declare that they have no conflicts of interest to report regarding the present study.
1. Yuan, D. J., Huang, Q. F., Wang, Y. (2009). Risk analysis and countermeasures of Nanjing Yangtze River tunnel during large diameter slurry shield tunneling. Proceedings of 2009 International Symposium on Risk Control and Management of Design, Construction and Operation in Underground Engineering, pp. 190–193. Dalian, China. [Google Scholar]
2. Zhou, C., Ding, L. Y., Skibniewski, M. J., Luo, H. B., Zhang, H. T. (2018). Data based complex network modeling and analysis of shield tunneling performance in metro construction. Advanced Engineering Informatics, 38, 168–186. DOI 10.1016/j.aei.2018.06.011. [Google Scholar] [CrossRef]
3. Zhou, C., Kong, T., Zhou, Y., Zhang, H., Ding, L. (2019). Unsupervised spectral clustering for shield tunneling machine monitoring data with complex network theory. Automation in Construction, 107(15), 102924. DOI 10.1016/j.autcon.2019.102924. [Google Scholar] [CrossRef]
4. Liu, X. Y., Yuan, D. J. (2014). An in-situ slurry fracturing test for slurry shield tunneling. Journal of Zhejiang Universityence A, 15(7), 465–481. DOI 10.1631/jzus.A1400028. [Google Scholar] [CrossRef]
5. Jin, D., Yuan, D., Liu, S., Li, X., Luo, W. (2018). Performance of existing subway tunnels undercrossed by four closely spaced shield tunnels. Journal of Performance of Constructed Facilities, 33(1), 4018099. DOI 10.1061/(ASCE)CF.1943-5509.0001230. [Google Scholar] [CrossRef]
6. Li, X., Gong, G. (2019). Predictive control of slurry pressure balance in shield tunneling using diagonal recurrent neural network and evolved particle swarm optimization. Automation in Construction, 107(4), 102928. DOI 10.1016/j.autcon.2019.102928. [Google Scholar] [CrossRef]
7. Jin, D., Zhang, Z., Yuan, D. (2021). Effect of dynamic cutterhead on face stability in EPB shield tunneling. Tunnelling and Underground Space Technology, 110(1), 103827. DOI 10.1016/j.tust.2021.103827. [Google Scholar] [CrossRef]
8. Jin, D., Yuan, D., Li, X., Su, W. (2020). Probabilistic analysis of the disc cutter failure during TBM tunneling in hard rock. Tunnelling and Underground Space Technology, 109(11), 103744. DOI 10.1016/j.tust.2020.103744. [Google Scholar] [CrossRef]
9. Fang, X. Q., Zhang, T. F., Li, B. L., Yuan, R. J. (2020). Elastic-slip interface effect on dynamic stress around twin tunnels in soil medium subjected to blast waves. Computers and Geotechnics, 119(5), 103301. DOI 10.1016/j.compgeo.2019.103301. [Google Scholar] [CrossRef]
10. Li, B. L., Fang, X. Q., Zhang, T. F., Yang, S. P. (2020). Elastic-slip interface effect on dynamic response of underwater convey tunnel in saturated poroelastic soil subjected to plane waves. Tunnelling and Underground Space Technology, 103(2), 103468. DOI 10.1016/j.tust.2020.103468. [Google Scholar] [CrossRef]
11. Zhu, H., Wang, X., Chen, X., Zhang, L. (2020). Similarity search and performance prediction of shield tunnels in operation through time series data mining. Automation in Construction, 114(1), 103178. DOI 10.1016/j.autcon.2020.103178. [Google Scholar] [CrossRef]
12. Moghaddasi, M. R., Noorian-Bidgoli, M. (2018). ICA-ANN, ANN and multiple regression models for prediction of surface settlement caused by tunneling. Tunnelling and Underground Space Technology, 79(2), 197–209. DOI 10.1016/j.tust.2018.04.016. [Google Scholar] [CrossRef]
13. Zhou, C., Ding, L. Y., Zhou, Y., Zhang, H. T., Skibniewski, M. J. (2019). Hybrid support vector machine optimization model for prediction of energy consumption of cutter head drives in shield tunneling. Journal of Computing in Civil Engineering, 33(3), 4019019. DOI 10.1061/(ASCE)CP.1943-5487.0000833. [Google Scholar] [CrossRef]
14. Zhang, P., Li, H., Ha, Q. P., Yin, Z. Y., Chen, R. P. (2020). Reinforcement learning based optimizer for improvement of predicting tunneling-induced ground responses. Advanced Engineering Informatics, 45, 101097. DOI 10.1016/j.aei.2020.101097. [Google Scholar] [CrossRef]
15. Li, X., Jiang, J., Su, H., Chu, J. (2009). Identification of abnormal operating conditions and intelligent decision system for earth pressure balance shield machine. International Conference on Intelligent Robotics and Applications, pp. 433–442, Berlin, Heidelberg: Springer. [Google Scholar]
16. Shen, X., Lu, M., Chen, W. (2011). Tunnel-boring machine positioning during microtunneling operations through integrating automated data collection with real-time computing. Journal of Construction Engineering and Management, 137(1), 72–85. DOI 10.1061/(ASCE)CO.1943-7862.0000250. [Google Scholar] [CrossRef]
17. Yeh, I. C. (1997). Application of neural networks to automatic soil pressure balance control for shield tunneling. Automation in Construction, 5(5), 421–426. DOI 10.1016/S0926-5805(96)00165-3. [Google Scholar] [CrossRef]
18. Li, S. J., Shangguan, Z. C., Sun, W., Duan, H. X.Soc, I. C. (2009). Controlling earth pressure of shield machine with optimization algorithm. 2009 International Conference on Environmental Science and Information Application Technology, vol. 3, pp. 656–659. Wuhan, China. [Google Scholar]
19. Liu, C., Qu, F. Z., Li, S. J., Meng, Q. L. (2012). Optimal arrangement for pressure measurement points in working chamber of earth pressure balance shield. Journal of Central South University, 19(7), 1883–1891. DOI 10.1007/s11771-012-1222-z. [Google Scholar] [CrossRef]
20. Gao, M. Y., Zhang, N., Shen, S. L., Zhou, A. (2020). Real-time dynamic earth-pressure regulation model for shield tunneling by integrating GRU deep learning method with GA optimization. IEEE Access, 8, 64310–64323. DOI 10.1109/ACCESS.2020.2984515. [Google Scholar] [CrossRef]
21. Liu, X., Shao, C., Ma, H., Liu, R. (2011). Optimal earth pressure balance control for shield tunneling based on LS-SVM and PSO. Automation in Construction, 20(4), 321–327. DOI 10.1016/j.autcon.2010.11.002. [Google Scholar] [CrossRef]
22. Liu, X., Zhang, K. (2019). Earth pressure balance control of shield tunneling machine based on nonlinear least squares support vector machine model predictive control. Measurement and Control, 52(1–2), 3–10. DOI 10.1177/0020294018811333. [Google Scholar] [CrossRef]
23. Cheng, S., Lan, D. (2014). Optimal control of an earth pressure balance shield with tunnel face stability. Automation in Construction, 46(2), 22–29. DOI 10.1016/j.autcon.2014.07.005. [Google Scholar] [CrossRef]
24. Boubou, R., Emeriault, F., Kastner, R. (2010). Artificial neural network application for the prediction of ground surface movements induced by shield tunnelling. Canadian Geotechnical Journal, 47(11), 1214–1233. DOI 10.1139/T10-023. [Google Scholar] [CrossRef]
25. Li, S. J., Yu, S., Qu, F. Z. (2014). Modeling approaches to pressure balance dynamic system in shield tunneling. Journal of Central South University, 21(3), 1206–1216. DOI 10.1007/s11771-014-2055-8. [Google Scholar] [CrossRef]
26. Li, K., Shao, C. (2015). Optimal control for a shield machine subject to multi-point earth pressure balance. Systems Science & Control Engineering, 3(1), 397–403. DOI 10.1080/21642583.2015.1053004. [Google Scholar] [CrossRef]
27. Fattahi, H., Bayatzadehfard, Z. (2019). Application of artificial intelligence methods for estimation of maximum surface settlement caused by EPB shield tunneling. Journal of Engineering Geology, 12. [Google Scholar]
28. Song, Y. (2011). Research on design of excavating face balance control for large slurry shield. 2011 IEEE International Conference on Computer Science and Automation Engineering, pp.~664–668. Shanghai, China, IEEE. [Google Scholar]
29. Zhang, Y., Gong, G., Yang, H., Li, W., Liu, J. (2020). Precision versus intelligence: Autonomous supporting pressure balance control for slurry shield tunnel boring machines. Automation in Construction, 114, 103173. DOI 10.1016/j.autcon.2020.103173. [Google Scholar] [CrossRef]
30. Zhou, C., Ding, L. Y., He, R. (2013). PSO-based Elman neural network model for predictive control of air chamber pressure in slurry shield tunneling under Yangtze River. Automation in Construction, 36(7), 208–217. DOI 10.1016/j.autcon.2013.03.001. [Google Scholar] [CrossRef]
31. Li, X., Zhang, H., Xue, Y., Shao, C. (2015). Pressure balance control system for slurry shield based on predictive function control. In: Liu, H., Kubota, N., Zhu, X., Dillmann, R., Zhou, D. (Eds.Intelligent robotics and applications, pp. 501–510. [Google Scholar]
32. Zhou, J., Shi, X. Z., Du, K., Qiu, X. Y., Li, X. B. et al. (2017). Feasibility of random-forest approach for prediction of ground settlements induced by the construction of a shield-driven tunnel. International Journal of Geomechanics, 17, 12. DOI 10.1061/(ASCE)GM.1943-5622.0000817. [Google Scholar] [CrossRef]
33. Zhu, M., Zhu, H., Guo, F., Chen, X., Ju, J. W. (2021). Tunnel condition assessment via cloud model-based random forests and self-training approach. Computer-Aided Civil and Infrastructure Engineering, 36(2), 164–179. DOI 10.1111/mice.12601. [Google Scholar] [CrossRef]
34. Zounemat-Kermani, M., Stephan, D., Barjenbruch, M., Hinkelmann, R. (2020). Ensemble data mining modeling in corrosion of concrete sewer: A comparative study of network-based (MLPNN & RBFNN) and tree-based (RF, CHAID, & CART) models. Advanced Engineering Informatics, 43(1), 101030. DOI 10.1016/j.aei.2019.101030. [Google Scholar] [CrossRef]
35. Chen, R., Zhang, P., Wu, H., Wang, Z., Zhong, Z. (2019). Prediction of shield tunneling-induced ground settlement using machine learning techniques. Frontiers of Structural and Civil Engineering, 13(6), 1363–1378. DOI 10.1007/s11709-019-0561-3. [Google Scholar] [CrossRef]
36. Wang, J., Yan, W., Wan, Z., Wang, Y., Lv, J. et al. (2020). Prediction of permeability using random forest and genetic algorithm model. Computer Modeling in Engineering & Sciences, 125(3), 1135–1157. DOI 10.32604/cmes.2020.014313. [Google Scholar] [CrossRef]
37. Zhang, P., Chen, R. P., Wu, H. N. (2019). Real-time analysis and regulation of EPB shield steering using random forest. Automation in Construction, 106(4), 102860. DOI 10.1016/j.autcon.2019.102860. [Google Scholar] [CrossRef]
38. Lee, Y. Y. R., Samad, H., Goh, Y. M. (2020). Perceived importance of authentic learning factors in designing construction safety simulation game-based assignment: Random forest approach. Journal of Construction Engineering and Management, 146(3), 4020002. DOI 10.1061/(ASCE)CO.1943-7862.0001779. [Google Scholar] [CrossRef]
39. Kennedy, J., Eberhart, R. (1995). Particle swarm optimization. Proceedings of ICNN'95-International Conference on Neural Networks, pp. 1942–1948. Perth, Australia, IEEE. [Google Scholar]
40. Elbeltagi, E., Hegazy, T., Grierson, D. (2005). Comparison among five evolutionary-based optimization algorithms. Advanced Engineering Informatics, 19(1), 43–53. DOI 10.1016/j.aei.2005.01.004. [Google Scholar] [CrossRef]
41. Yagiz, S., Karahan, H. (2011). Prediction of hard rock TBM penetration rate using particle swarm optimization. International Journal of Rock Mechanics and Mining Sciences, 48(3), 427–433. DOI 10.1016/j.ijrmms.2011.02.013. [Google Scholar] [CrossRef]
42. Hou, G. Y., Xu, Z. D., Liu, X., Jin, C. (2019). Improved particle swarm optimization for selection of shield tunneling parameter values. Computer Modeling in Engineering & Sciences, 118(2), 317–337. DOI 10.31614/cmes.2019.04693. [Google Scholar] [CrossRef]
43. van Rossum, G., Drake, Jr., F. L. (1995). Python reference manual. Amsterdam: Centrum voor Wiskunde en Informatica. [Google Scholar]
44. Luo, W. P., Yuan, D. J., Jin, D. L., Lu, P. (2020). Prediction and analysis of slurry pressure at the shield cut in composite strata based on random forest. China Civil Engineering Journal, 53, 43–49. DOI 10.15951/j.tmgcxb.2020.s1.008. [Google Scholar] [CrossRef]
45. Breiman, L. (2001). Random forests. Machine Learning, 45(1), 5–32. DOI 10.1023/A:1010933404324. [Google Scholar] [CrossRef]
46. Friedman, J., Hastie, T., Tibshirani, R. (2001). The elements of statistical learning. Springer Series in Statistics. New York: Springer. [Google Scholar]
 | This work is licensed under a Creative Commons Attribution 4.0 International License, which permits unrestricted use, distribution, and reproduction in any medium, provided the original work is properly cited. |