Engineering & Sciences
| Computer Modeling in Engineering & Sciences |
DOI: 10.32604/cmes.2021.015300
ARTICLE
Self-Driving Algorithm and Location Estimation Method for Small Environmental Monitoring Robot in Underground Mines
Department of Energy Resources Engineering, Pukyong National University, Busan, 48513, Korea
*Corresponding Author: Yosoon Choi. Email: energy@pknu.ac.kr
Received: 07 December 2020; Accepted: 10 March 2021
Abstract: In underground mine environments where various hazards exist, such as tunnel collapse, toxic gases, the application of autonomous robots can improve the stability of exploration and efficiently perform repetitive exploratory operations. In this study, we developed a small autonomous driving robot for unmanned environmental monitoring in underground mines. The developed autonomous driving robot controls the steering according to the distance to the tunnel wall measured using the light detection and ranging sensor mounted on the robot to estimate its location by simultaneously considering the measured values of the inertial measurement unit and encoder sensors. In addition, the robot autonomously drives through the underground mine and performs environmental monitoring using the temperature/humidity, gas, and particle sensors mounted on the robot. As a result of testing the performance of the developed robot at an amethyst mine in Korea, the robot was found to be able to autonomously drive through tunnel sections with
Keywords: Underground mine; environmental monitoring; autonomous driving; geographic information system
There are various risk factors in underground mine sites, such as rockfall, tunnel collapse, collision between workers and equipment, toxic gases, and many human accidents. According to statistics from the Centers for Disease Control and Prevention (CDC), between 2010 and 2015, approximately 12,230 safety accidents have occurred at the U.S. underground mine sites, of which 121 include deaths [1,2]. In the mining industry, various efforts are being adopted to prevent these risk factors. Goodman et al. [3] suggested a tunnel design method that considers the effects of jointed rock masses in underground mine tunnels. Abdellah et al. [4] performed a stability evaluation of the intersection point during the development process of an underground mine. Wang et al. [5] analyzed toxic gas accidents that occur in underground coal mines.
Recently, various studies on information communication technology (ICT)-based underground mine safety management systems are being conducted. There have been studies to prevent collisions between workers and equipment using Bluetooth beacons [6–9], radio-frequency identification (RFID) [10,11], and wireless access points (APs) [12,13] in an underground mine environment. In addition, there have been studies to measure environmental factors in underground mines using open-source hardware such as Arduino [14–17] and Raspberry Pi [18,19]. Studies have also been conducted to vividly visualize the workplace of underground mines or perform safety training using augmented reality (AR) [20,21] or virtual reality (VR) [22–26] technologies. A safety management system using artificial intelligence (AI) technology such as machine learning has also been developed [27,28].
Recently, studies have been conducted using autonomous driving robots to explore workplaces, transport roads, and accident sites in underground mines. Autonomous driving robots are used to perform exploration tasks while recognizing their own location in underground mine tunnels [29–33], or to perform tunnel mapping tasks to evaluate the shape and geological stability of the tunnels [34,35]. Representatively, Bakambu et al. [36] developed an autonomous driving robot that can perform path planning and obstacle avoidance in an underground mine environment, and created a 2D map for the underground mine shaft. Ghosh et al. [37] created a three-dimensional tunnel map for underground mines using a rotating light detection and aging (LiDAR) sensor and verified its performance through field experiments. Kim et al. [38] developed a LiDAR sensor-based autonomous driving robot and quantitatively evaluated the driving accuracy through driving tests at an underground mine site. Neumann et al. [39] developed an autonomous driving robot based on a robot operating system (ROS) equipped with inertial measurement unit (IMU), LiDAR, and camera sensors, and performed 3D mapping work of underground tunnels.
Various studies have also been conducted to measure environmental factors in underground mines using autonomous robots and environmental sensors. Baker et al. [40] developed ‘Groundhog’, an autonomous robot equipped with LiDAR sensors, camera sensors, gyro sensors, and gas sensors, and carried out environmental monitoring work at abandoned underground mines. Zhao et al. [41] developed an autonomous driving robot “MSRBOTS” that can detect toxic gases such as methane gas, carbon monoxide, and hydrogen sulfide in an underground mine environment, and conducted field experiments on underground mines. Günther et al. [42] developed a system that can measure temperature, humidity, and gas concentration in underground mine shafts using autonomous robots and transmit them remotely.
However, previous environmental monitoring studies using autonomous robots in underground mines have limitations in that autonomous driving functions can be used only in some areas, and the robots need to be controlled remotely in most areas. In addition, environmental factors of underground mines cannot be identified because no analysis or visualization of the acquired environmental data was performed. In particular, it is difficult to predict the location of the environmental data because the environmental data and location information of robots were not used together [42]. As such, in previous studies, there has never been a case where autonomous driving, location estimation, and environmental monitoring work were conducted simultaneously.
In this study, we developed an unmanned environmental monitoring system using an autonomous robot and environmental sensors for underground mines and created an environmental map for underground mines using the location information of the autonomous robot, the environmental monitoring data, and the geographic information system (GIS). Location information of the autonomous driving robot was obtained using IMU, LiDAR, and encoder sensors, and the temperature, humidity, and concentration of gas in the atmosphere were measured using environmental sensors. This paper details the development of an environmental monitoring system for an autonomous driving robot and the results of a field experiment conducted using the developed system.
2.1 Hardware Configuration for Environmental Monitoring System
Fig. 1 shows the hardware configuration of the autonomous driving robot for environmental monitoring developed in this study. The autonomous driving robot measures environmental factors using three types (temperature/humidity, gas, and particle) of environmental sensors, and performs autonomous driving and position estimation using three types (LiDAR, IMU, Encoder) of distance and angle sensors. All the sensors are connected to the laptop PC that acts as the main controller. In addition, a remote controller, a motor controller, and a driving platform are also connected to the main controller.
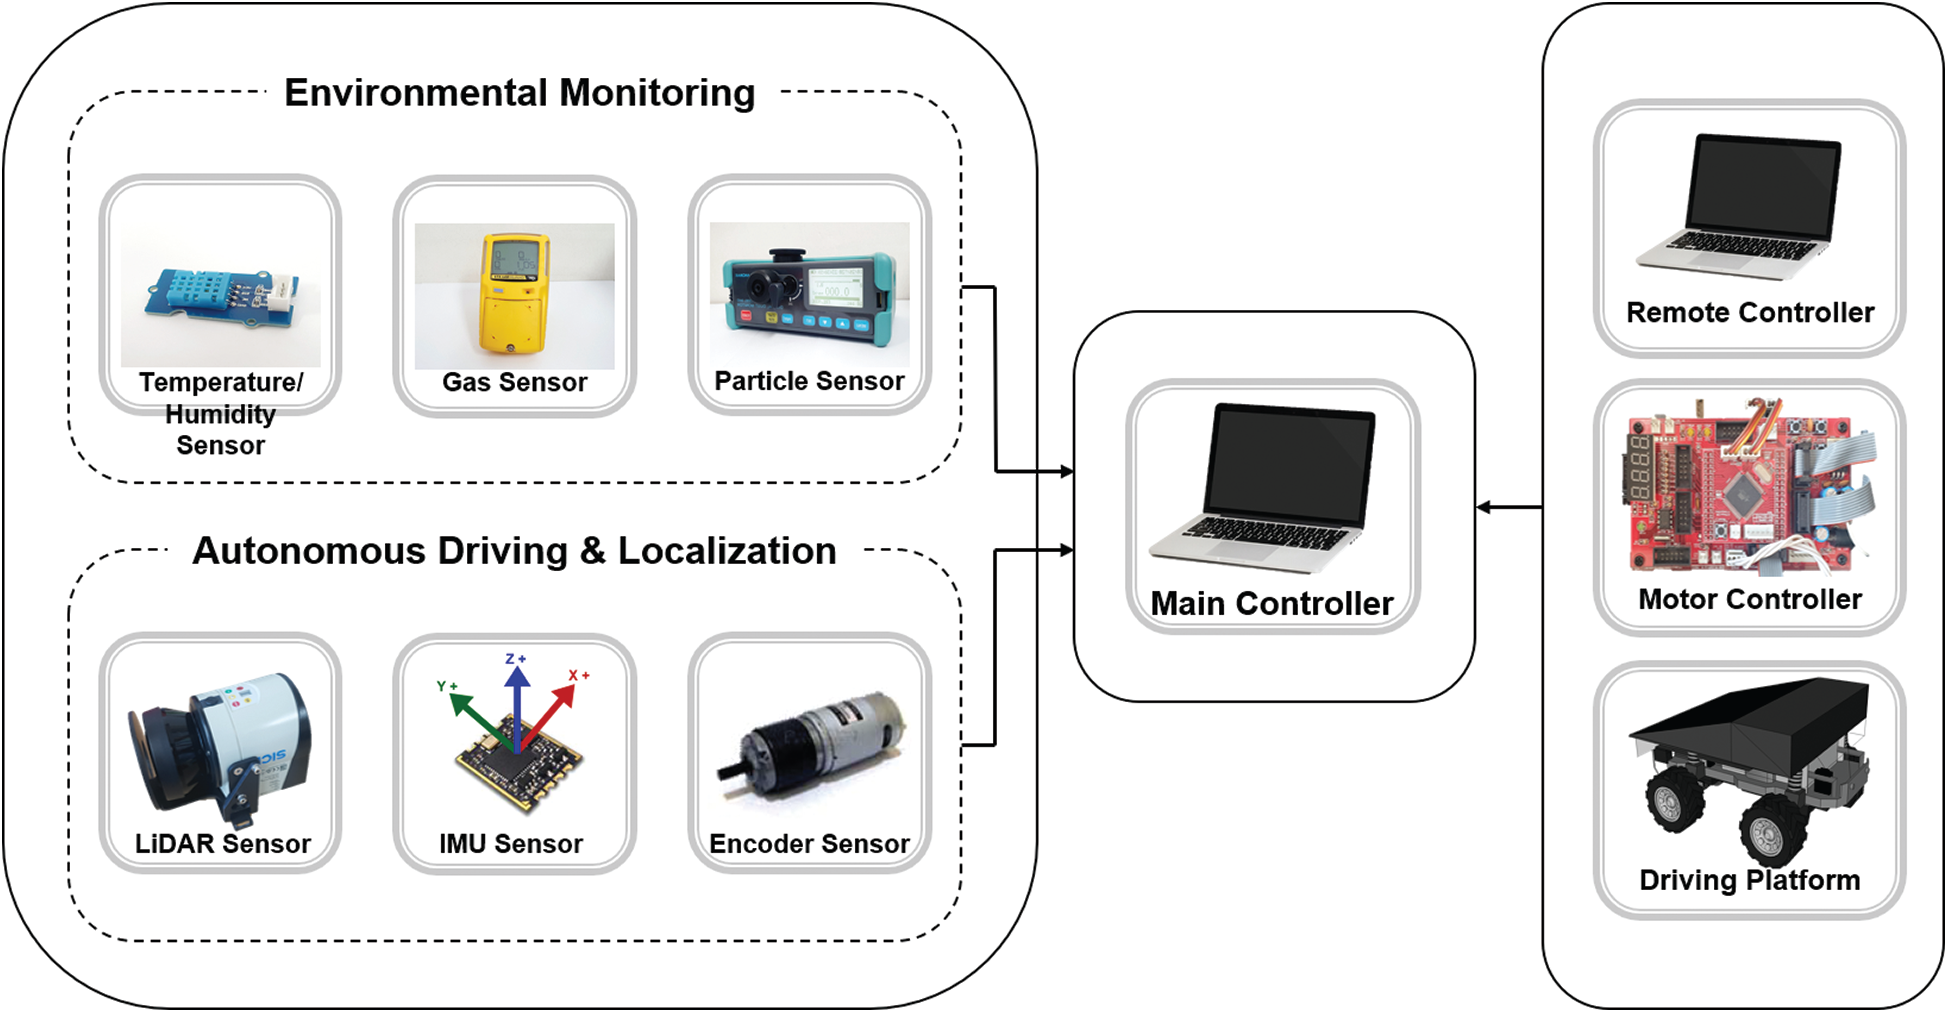
Figure 1: Overall structure of autonomous driving robot developed in this study
2.1.2 Mobile Robot Platform and Sensors
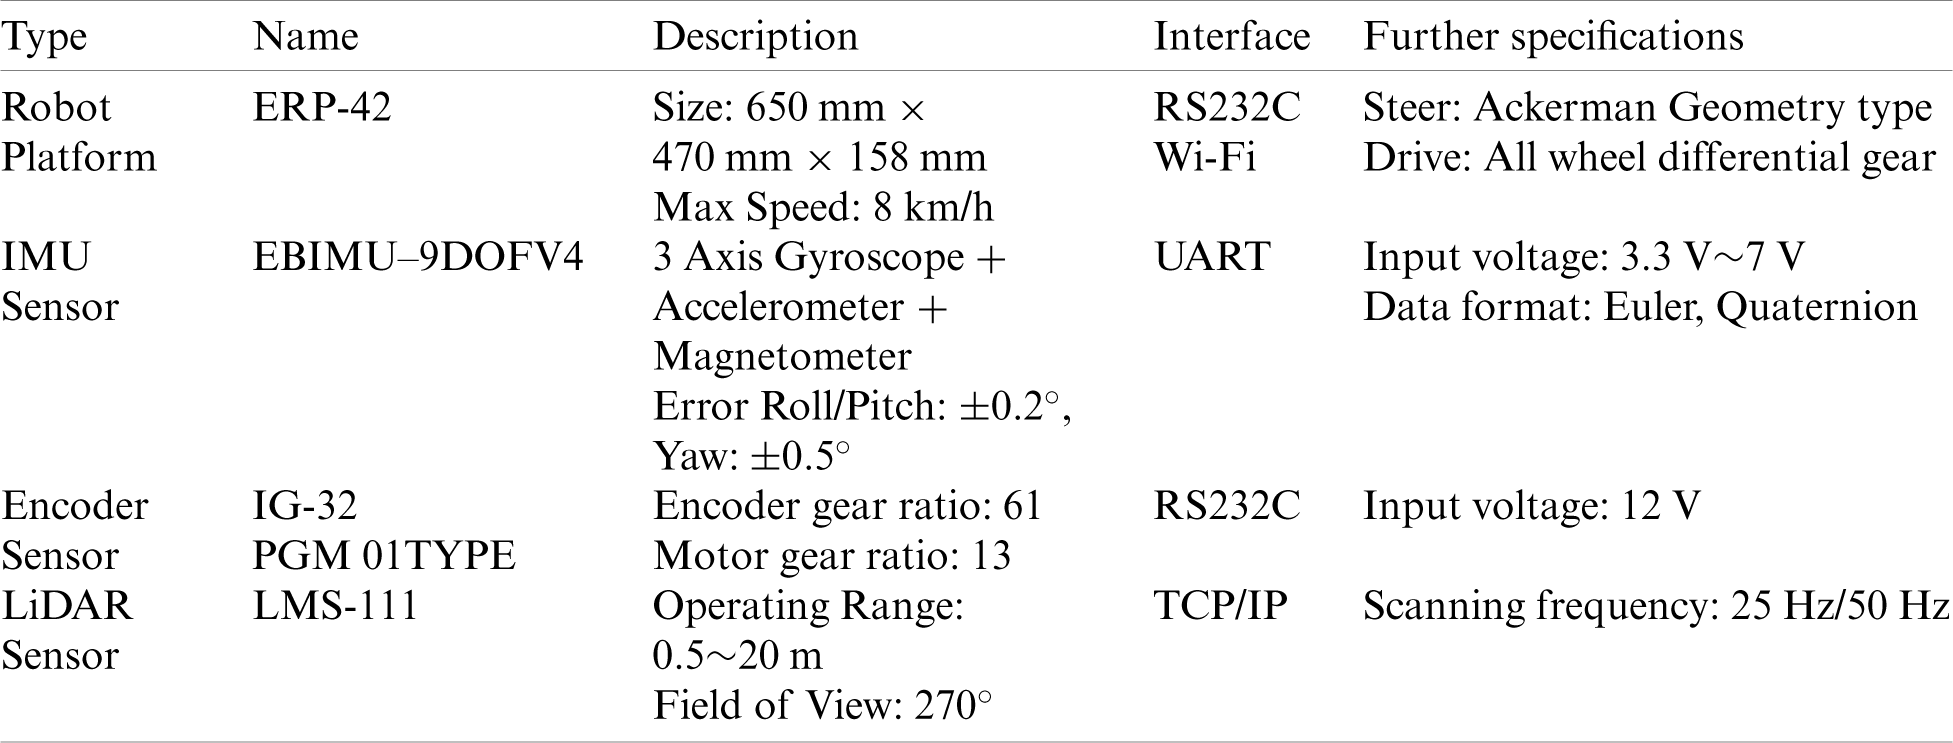
Tab. 1 shows the sensors and the mobile robot platform used in the autonomous robot developed in this study. The ERP-42 robot was used as the mobile robot platform [43]. The ERP-42 robot controls speed and steering using four wheels, connects the remote controller and Wi-Fi communication, and communicates with the driving motor through RS232C. The autonomous driving robot utilizes three types of sensors (IMU, Encoder, LiDAR) to perform autonomous driving and location estimation. To measure the robot’s three-axis pose, an IMU sensor that combines the acceleration sensor, geomagnetic sensor, and gyroscope sensor with a Kalman filter was used. The IMU sensor was used after performing the correction work, and it outputs the pose data in the form of Euler angles of roll, pitch, and yaw. The driving distance of the robot was measured using the encoder sensor, and it was calculated by applying the encoder and motor gear ratio to the pulse output according to the rotation of the robot motor.
Table 1: Specifications of sensors and robot platform used in this study
In addition, the autonomous driving robot’s main controller comprised an Intel core i7-9750H CPU 4.50 GHz, 16 GB RAM, a notebook PC with Windows 10 specifications, and a remote-control device with an Intel CPU N2600 1.60 GHz, 2 GB RAM, and a Windows 7 notebook PC. ATMega128 was used as the lower controller, and the video of the webcam installed on the front of the robot was transmitted to and recorded on a notebook PC. Fig. 2 shows the exterior view of the autonomous driving robot used in this study. Three types of environmental detection sensors (temperature/humidity, gas, and particle) and a webcam were placed in front of the robot, and LiDAR sensors were placed on the top of the robot.
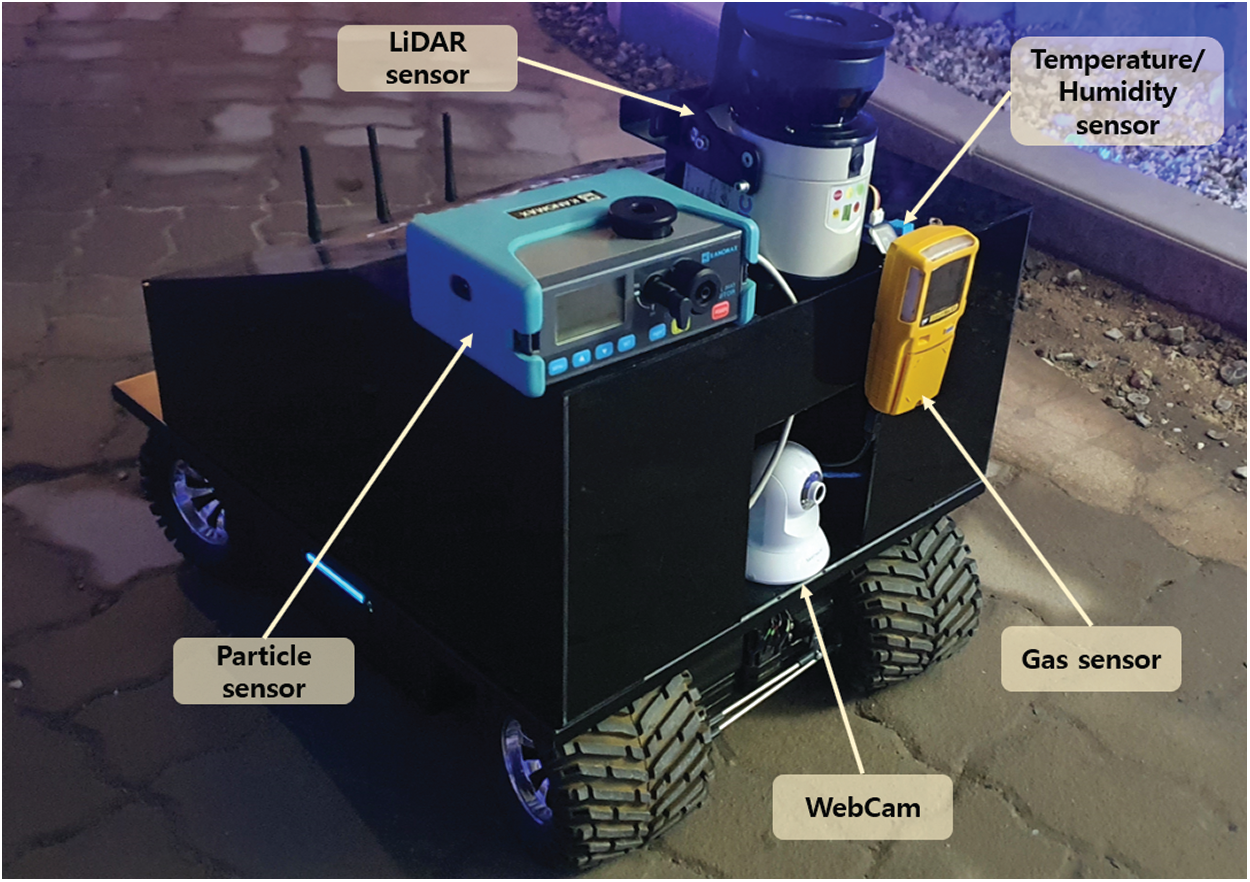
Figure 2: View of autonomous driving robot and sensors used in this study
2.1.3 Sensor Configuration for Environmental Monitoring
Fig. 3 shows the temperature and humidity sensor (Fig. 3a), gas sensor (Fig. 3b), and particle sensor (Fig. 3c) used in this study. To measure temperature and humidity, an Arduino DHT-11 sensor-based SEN11301P module, an open-source hardware, was used [44], and an Arduino Uno board was used to connect the SEN11301P module to the PC. Honeywell’s GasAlertMax XT II model was used to measure hydrogen sulfide (H2S), carbon monoxide (CO), oxygen (O2), and combustible gases [lower explosion limit (LEL)] [45]. To measure the particle concentration in the air, a digital dust monitor 3443 model of KANOMAX was used [46]. Tab. 2 shows the detailed specifications of the environmental sensors used in this study. Each environmental measurement sensor uses its own dedicated software to calibrate and interpolate noise and missing data (gas sensor: BW technologies fleet manager II software [47], dust sensor: digital dust monitor 3443 software [48], and temperature and humidity sensor: Arduino IDE software designed for pre-calibration [49]).
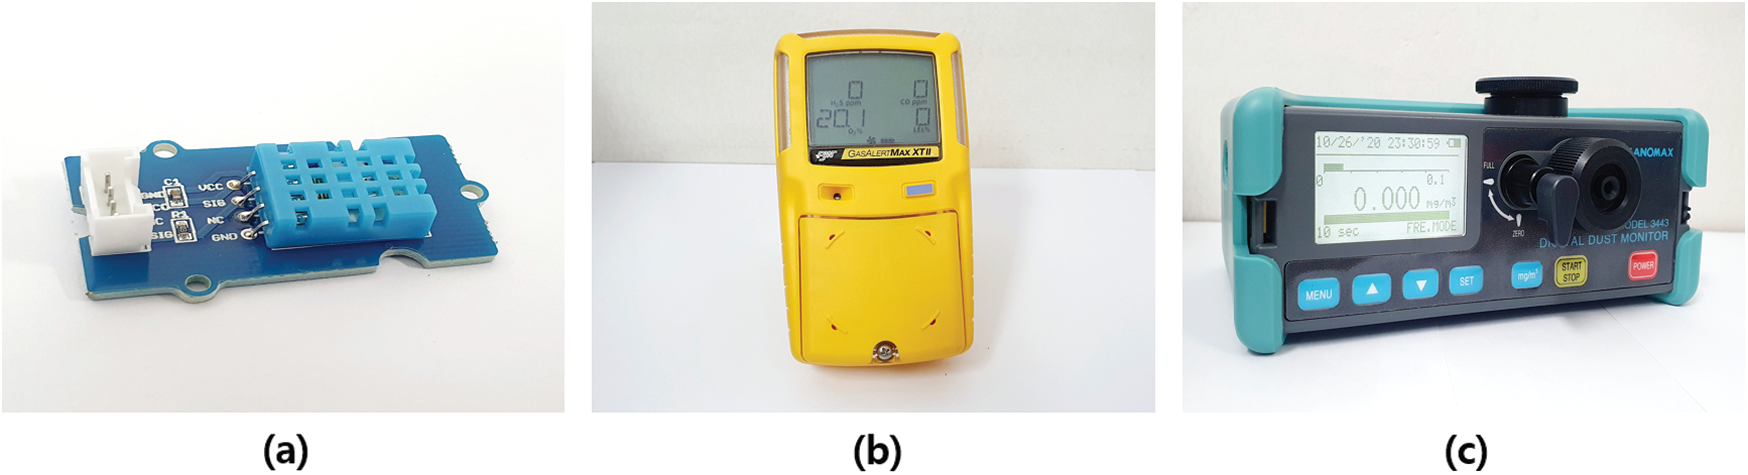
Figure 3: Environmental sensors used in this study. (a) Temperature & humidity sensor, (b) Gas sensor, (c) Particle sensor
Table 2: Specifications of environmental sensors used in this study
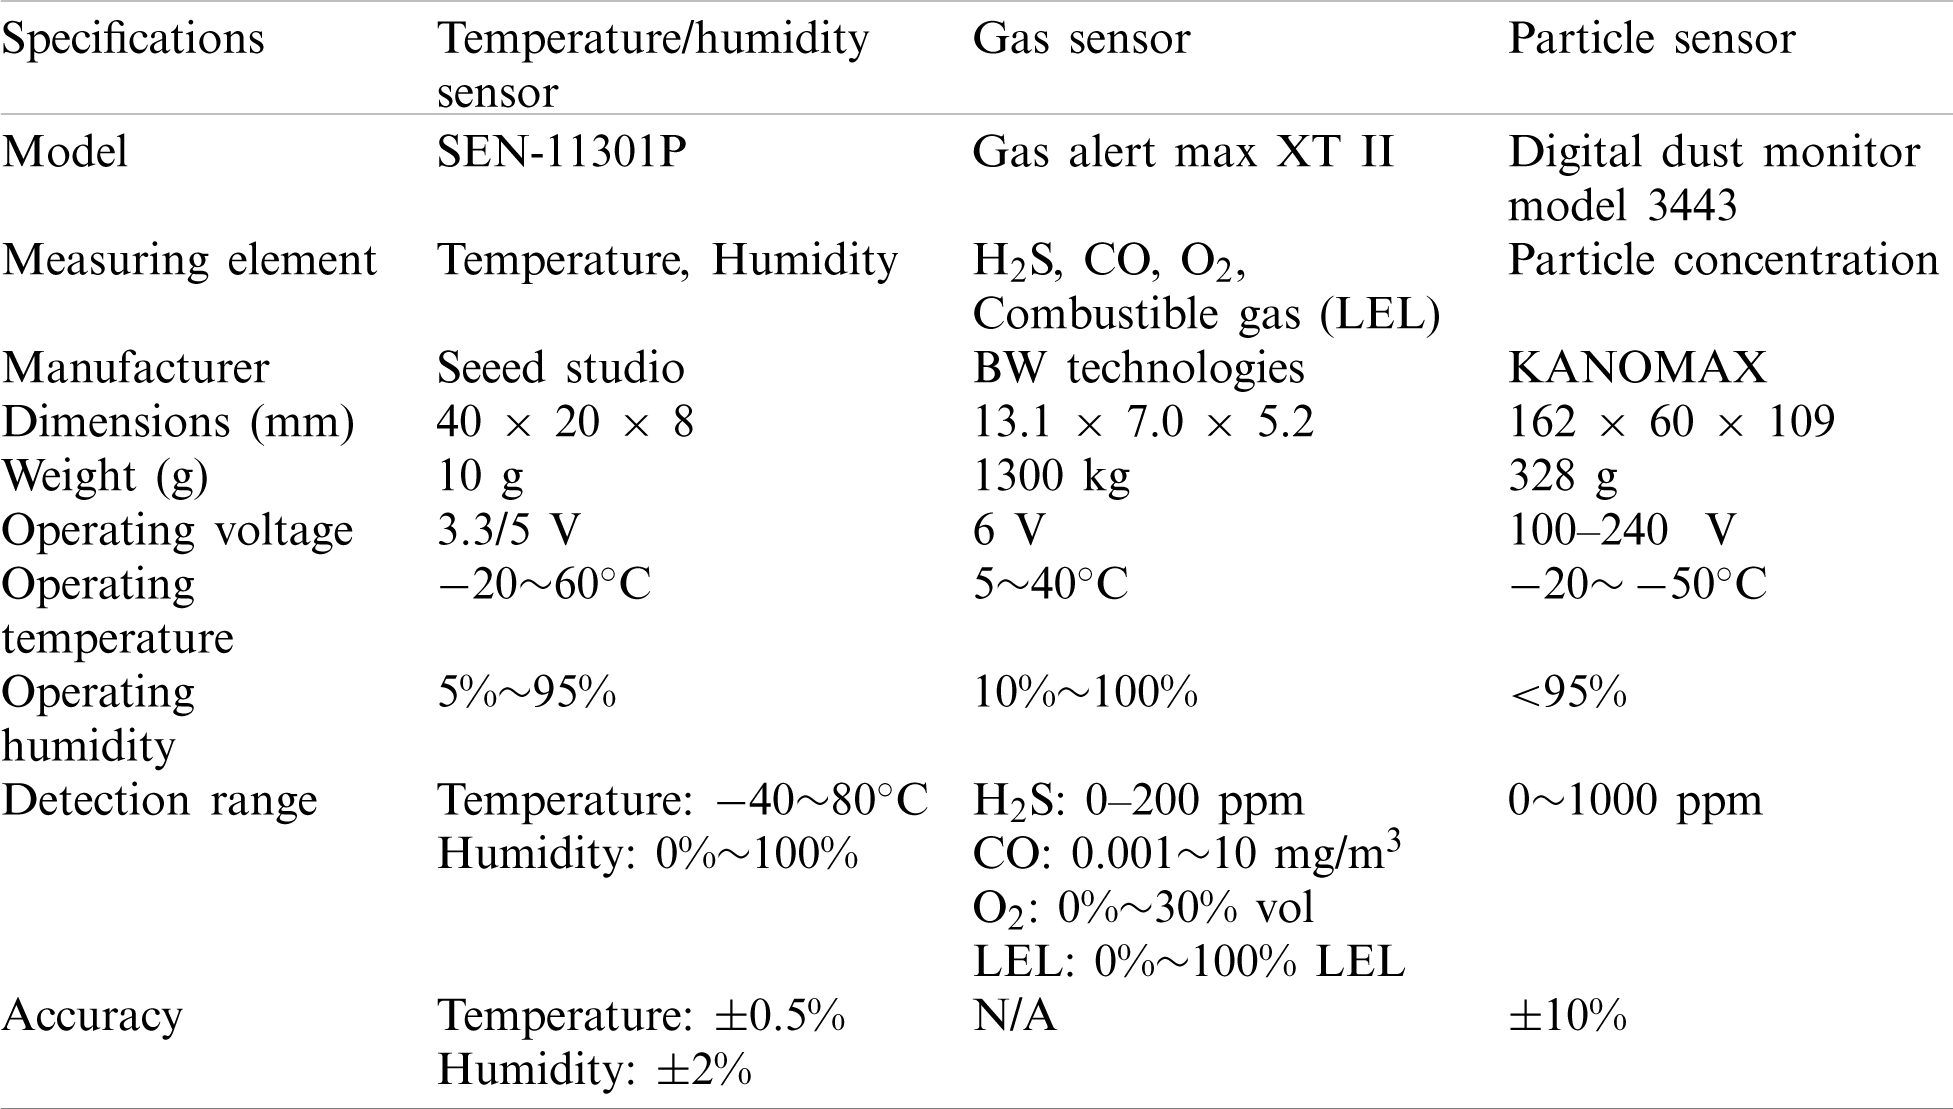
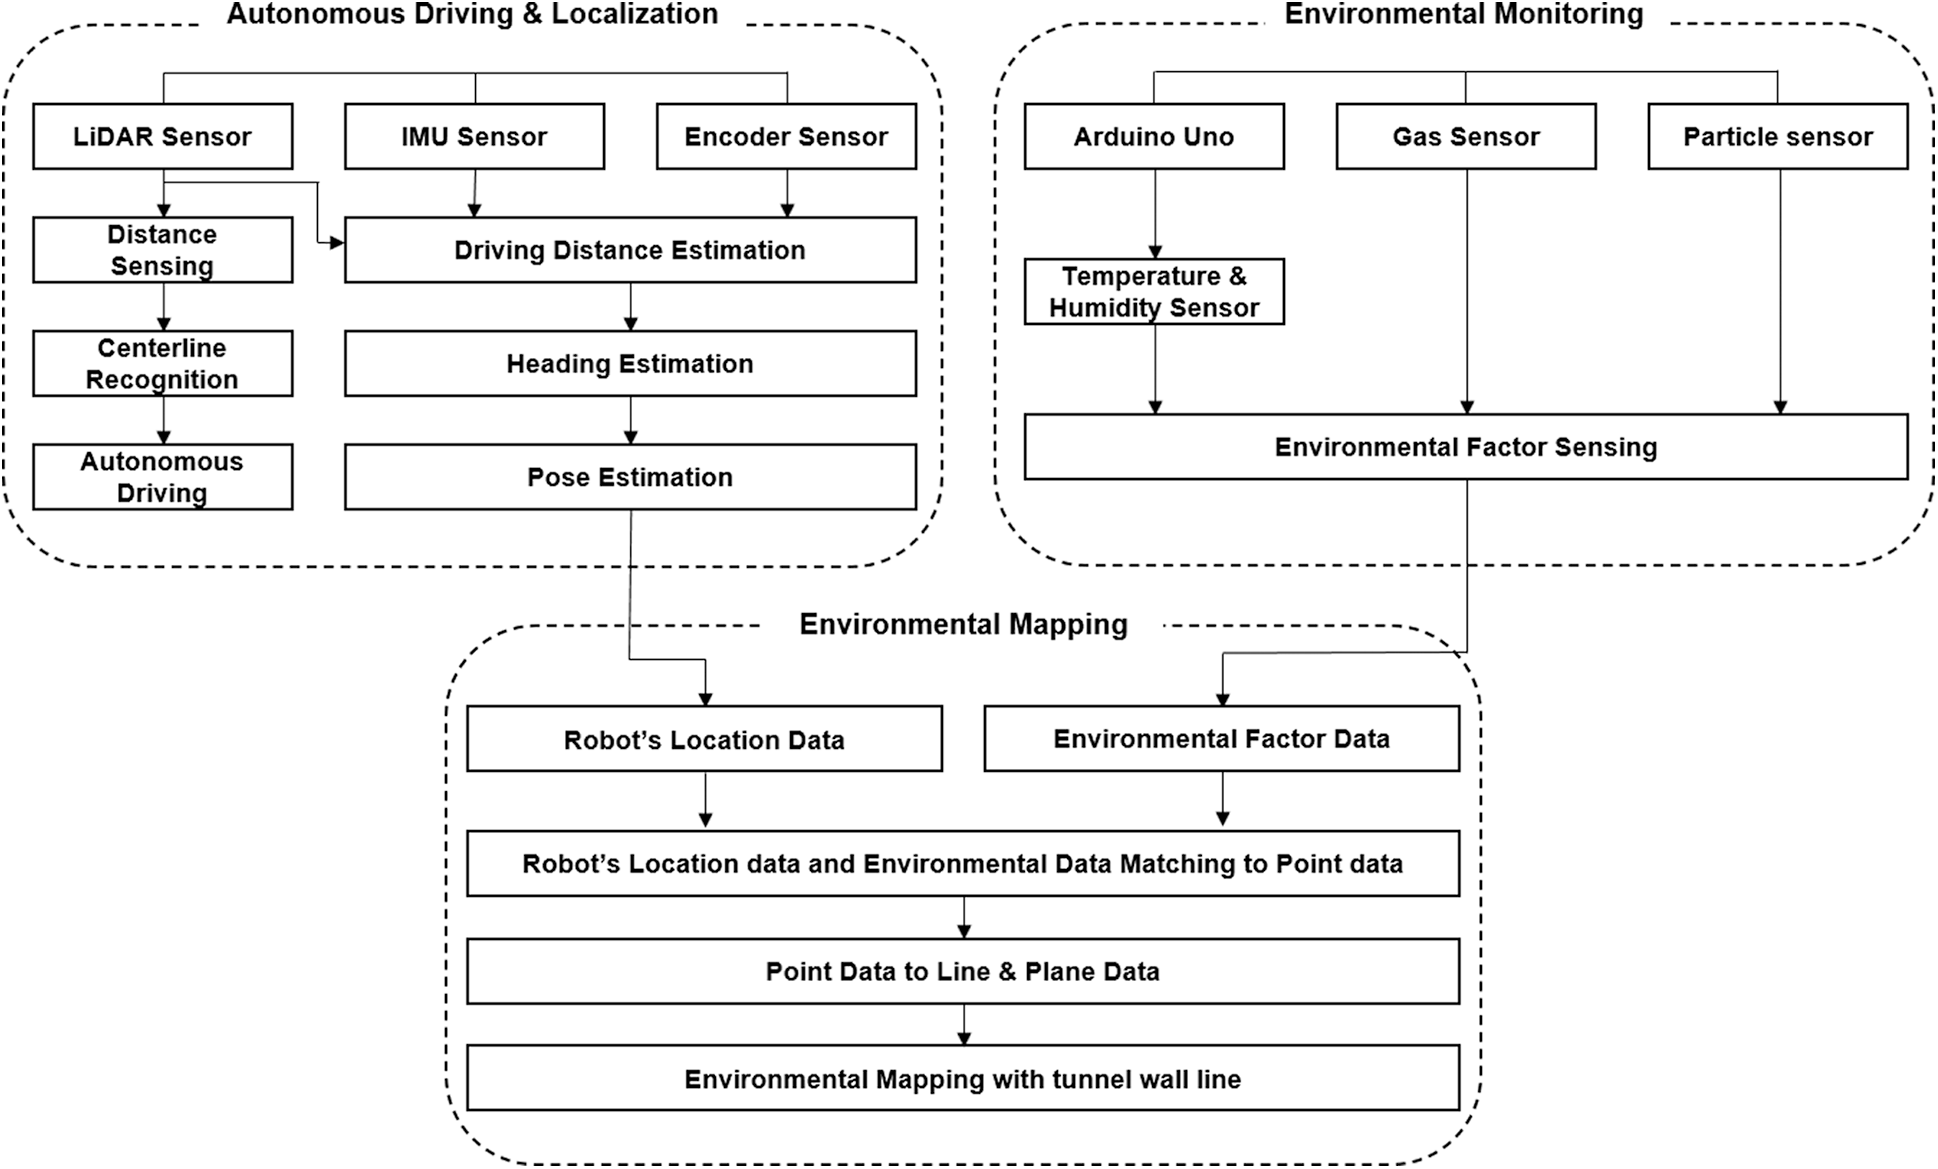
Figure 4: System architecture of environmental mapping system developed in this study
2.2 Software Configuration for Environmental Monitoring System
The environmental sensors used in this study are connected to the main controller, a notebook PC via USB communication, and store the robot’s location information and environmental data in 1 s using LabVIEW software. Fig. 4 shows the overall structure of the autonomous driving robot-based environment mapping system developed in this study. This system performs autonomous driving and location estimation using LiDAR, IMU, and encoder sensors, and calculates the robot’s pose and location information in real time. In addition, it measures environmental factors using temperature/humidity, gas, and particle sensors, and stores data. The location information of the robot calculated using the location estimation sensors and the environmental data measured using the environmental sensors are sorted according to time and converted into one-point data that is sequentially converted into line and surface data to create an environment map.
2.2.2 Autonomous Driving and Location Estimation Method
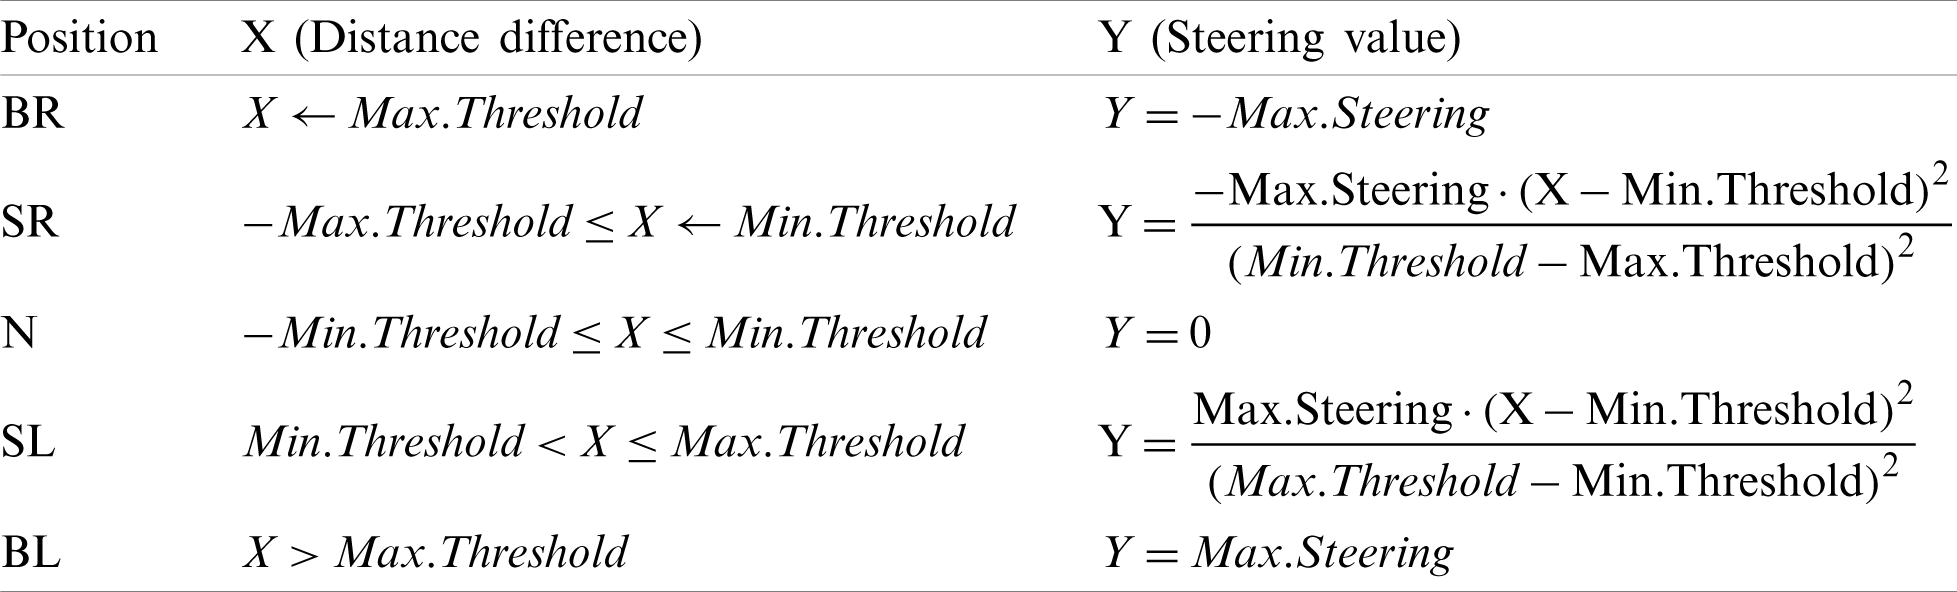
Fig. 5 shows the flowchart of the autonomous driving algorithm. The autonomous driving robot measures the distance to the front using the LiDAR sensor and determines the obstacles in the direction of driving. It also calculates the distance difference between the left- and right-side tunnel walls to recognize the centerline of the road and recognizes the robot’s driving position using two driving threshold values (Min.Threshold, Max.Threshold). According to distance difference thresholds, robot’s driving states are classified as BR (Big Right), SR (Small Right), N (Normal), SL (Small Left), and BL (Big Left). Fig. 6 shows the classification of states according to the robot’s driving position. The robot measures the distances to the left and right walls, calculates the difference, and determines the state class. For example, when the robot is driving close to the right wall, the distance to the left wall is measured to be considerably greater than that to the right wall, which is then determined as BR. The robot automatically drives along the centerline of the road through classified driving positions and distance differences. Tab. 3 shows the calculation of the steering angle for returning from the current robot’s driving position to the centerline of the road, depending on the distance between the left- and right-side tunnel walls [38].
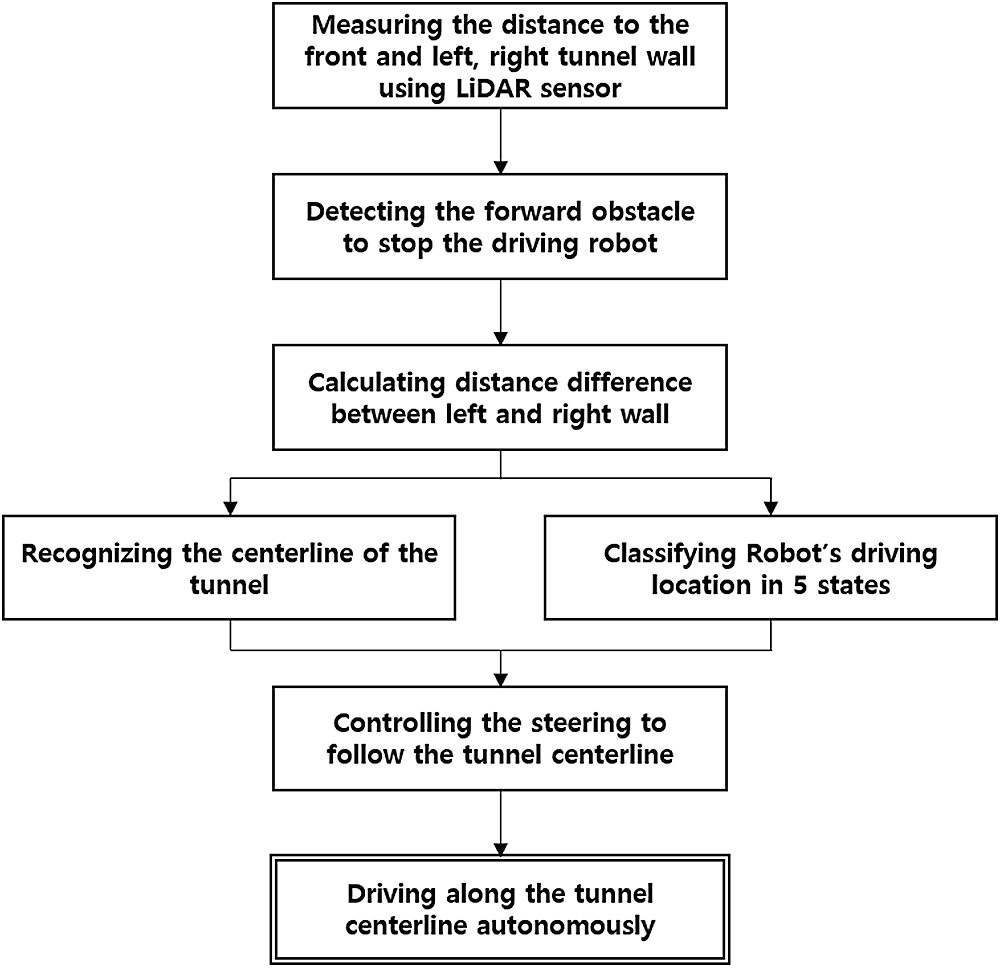
Figure 5: Procedure for controlling the autonomous driving robot’s steering and stop functions in underground mines
Fig. 7 shows the dynamic model of the autonomous driving robot developed in this study. In the xy-plane, the robot has a velocity of
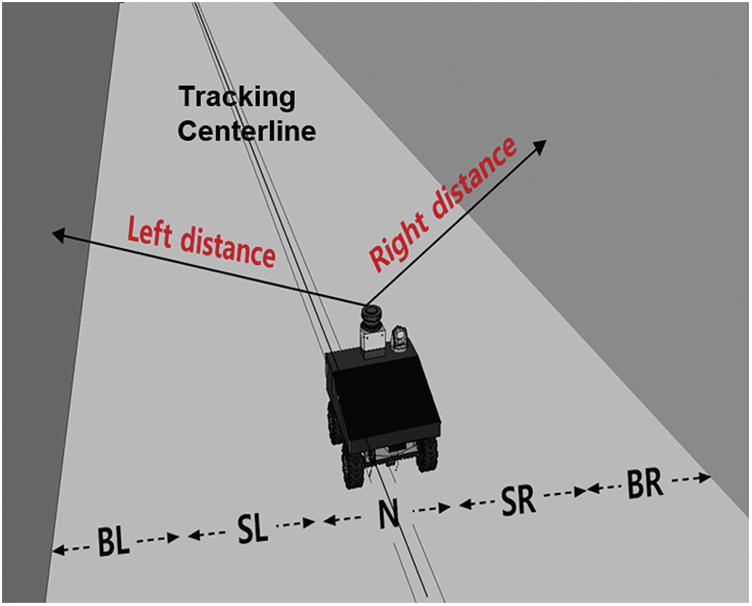
Figure 6: Conceptual diagram of the robot’s driving states determined by the difference between distances to the left and right walls
Table 3: Equations for calculating the steering value (Y) according to the distance difference (X) at five positions
IMU, encoder, and LiDAR sensors were used to estimate the location of the autonomous robot in the underground mines. Fig. 8 shows the overall system architecture of the location estimation algorithm for the autonomous driving robot. Raw data received from the accelerometer, gyroscope, and magnetometer were fused using a Kalman filter to calculate the robot’s three-dimensional pose of the robot. The robot’s heading value was calculated by recognizing the wall of the tunnel with the distance data measured using the LiDAR sensor and calculating the rotation angle of the robot. The robot’s 3D pose calculated using the IMU sensor and the robot’s heading angle calculated using the LiDAR sensor were fused according to the rotation angle of the robot, and then applied together with the travel distance input from the encoder sensor to estimate the location of the autonomous robot.
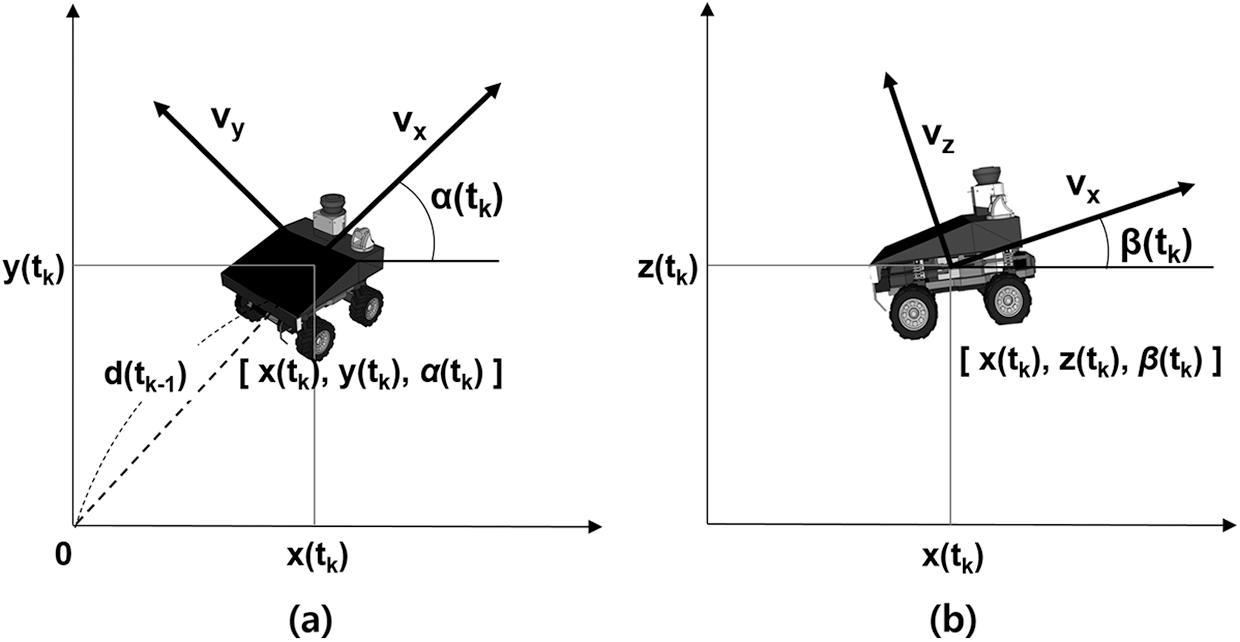
Figure 7: Dynamic model of the autonomous driving robot used in this study in the (a) xy-plane and (b) xz-plane
Fig. 9 represents the processing diagram of the data processing algorithm of the IMU sensor. Gyroscope, magnetometer, and accelerometer are processed with Kalman filter and converted to orientation matrix. U, V, and W are fixed frames of the IMU sensor in x, y, and z axes. g represents gravity acceleration, while aUgravity, aVgravity, aWgravity represents gravity acceleration vectors in the U, V, and W axes. aUcentripetal, aVcentripetal, aWcentripetal denotes centripetal in the direction of U, V, and W, wU, wV, wW, and
To perform autonomous driving, data acquisition from sensors, and location estimation, LabVIEW2018 software (National Instruments) was used, which is a graphical programming language that enables intuitive programming; therefore, it is effectively used in robot control and signal instruments. Fig. 10 shows a part of the block diagram of the programming code for the autonomous driving algorithm and data acquisition from the IMU sensor. The autonomous driving robot’s position is classified into five driving states, with Max.Threshold and Min.Threshold as the boundaries. In each driving state, the distance to the left and right walls is calculated, and the steering angle, which enables driving along the center line of the tunnel, is output (Fig. 10a). When an obstacle is detected, the robot is set to stop, and the autonomous driving mode is switched to the remote-control mode through a remote controller. In addition, for the IMU sensor, 3-axis raw data and pre-calibrated roll, pitch, and yaw data received from the gyroscope, accelerometer, and magnetometer are output in 0.005 s increments (Fig. 10b).
2.3 Creating Environmental Map Using GIS
In this study, ArcGIS, a geographic information system (GIS) software, was used to create an environmental map. Fig. 11 shows the flowchart used to create an environment map in ArcGIS software using the robot’s location information and environmental data. First, the position of the robot and the acquired data were matched by sorting the robot’s location information and environmental data according to the acquisition time. The matched data were merged into one data using the [Join] function. Using the [XY to Line] function, the environmental data values, including location information, were converted from point data into line data having a range, and using the [Buffer] function, line data were converted into plane data having a range. When converting line data into plane data, each side was extended by 1.5 m to the left and right by reflecting the width of the underground mine shaft. Because each plane data represented the robot’s driving path, the robot’s heading could also be reflected when implementing the [Buffer] function.
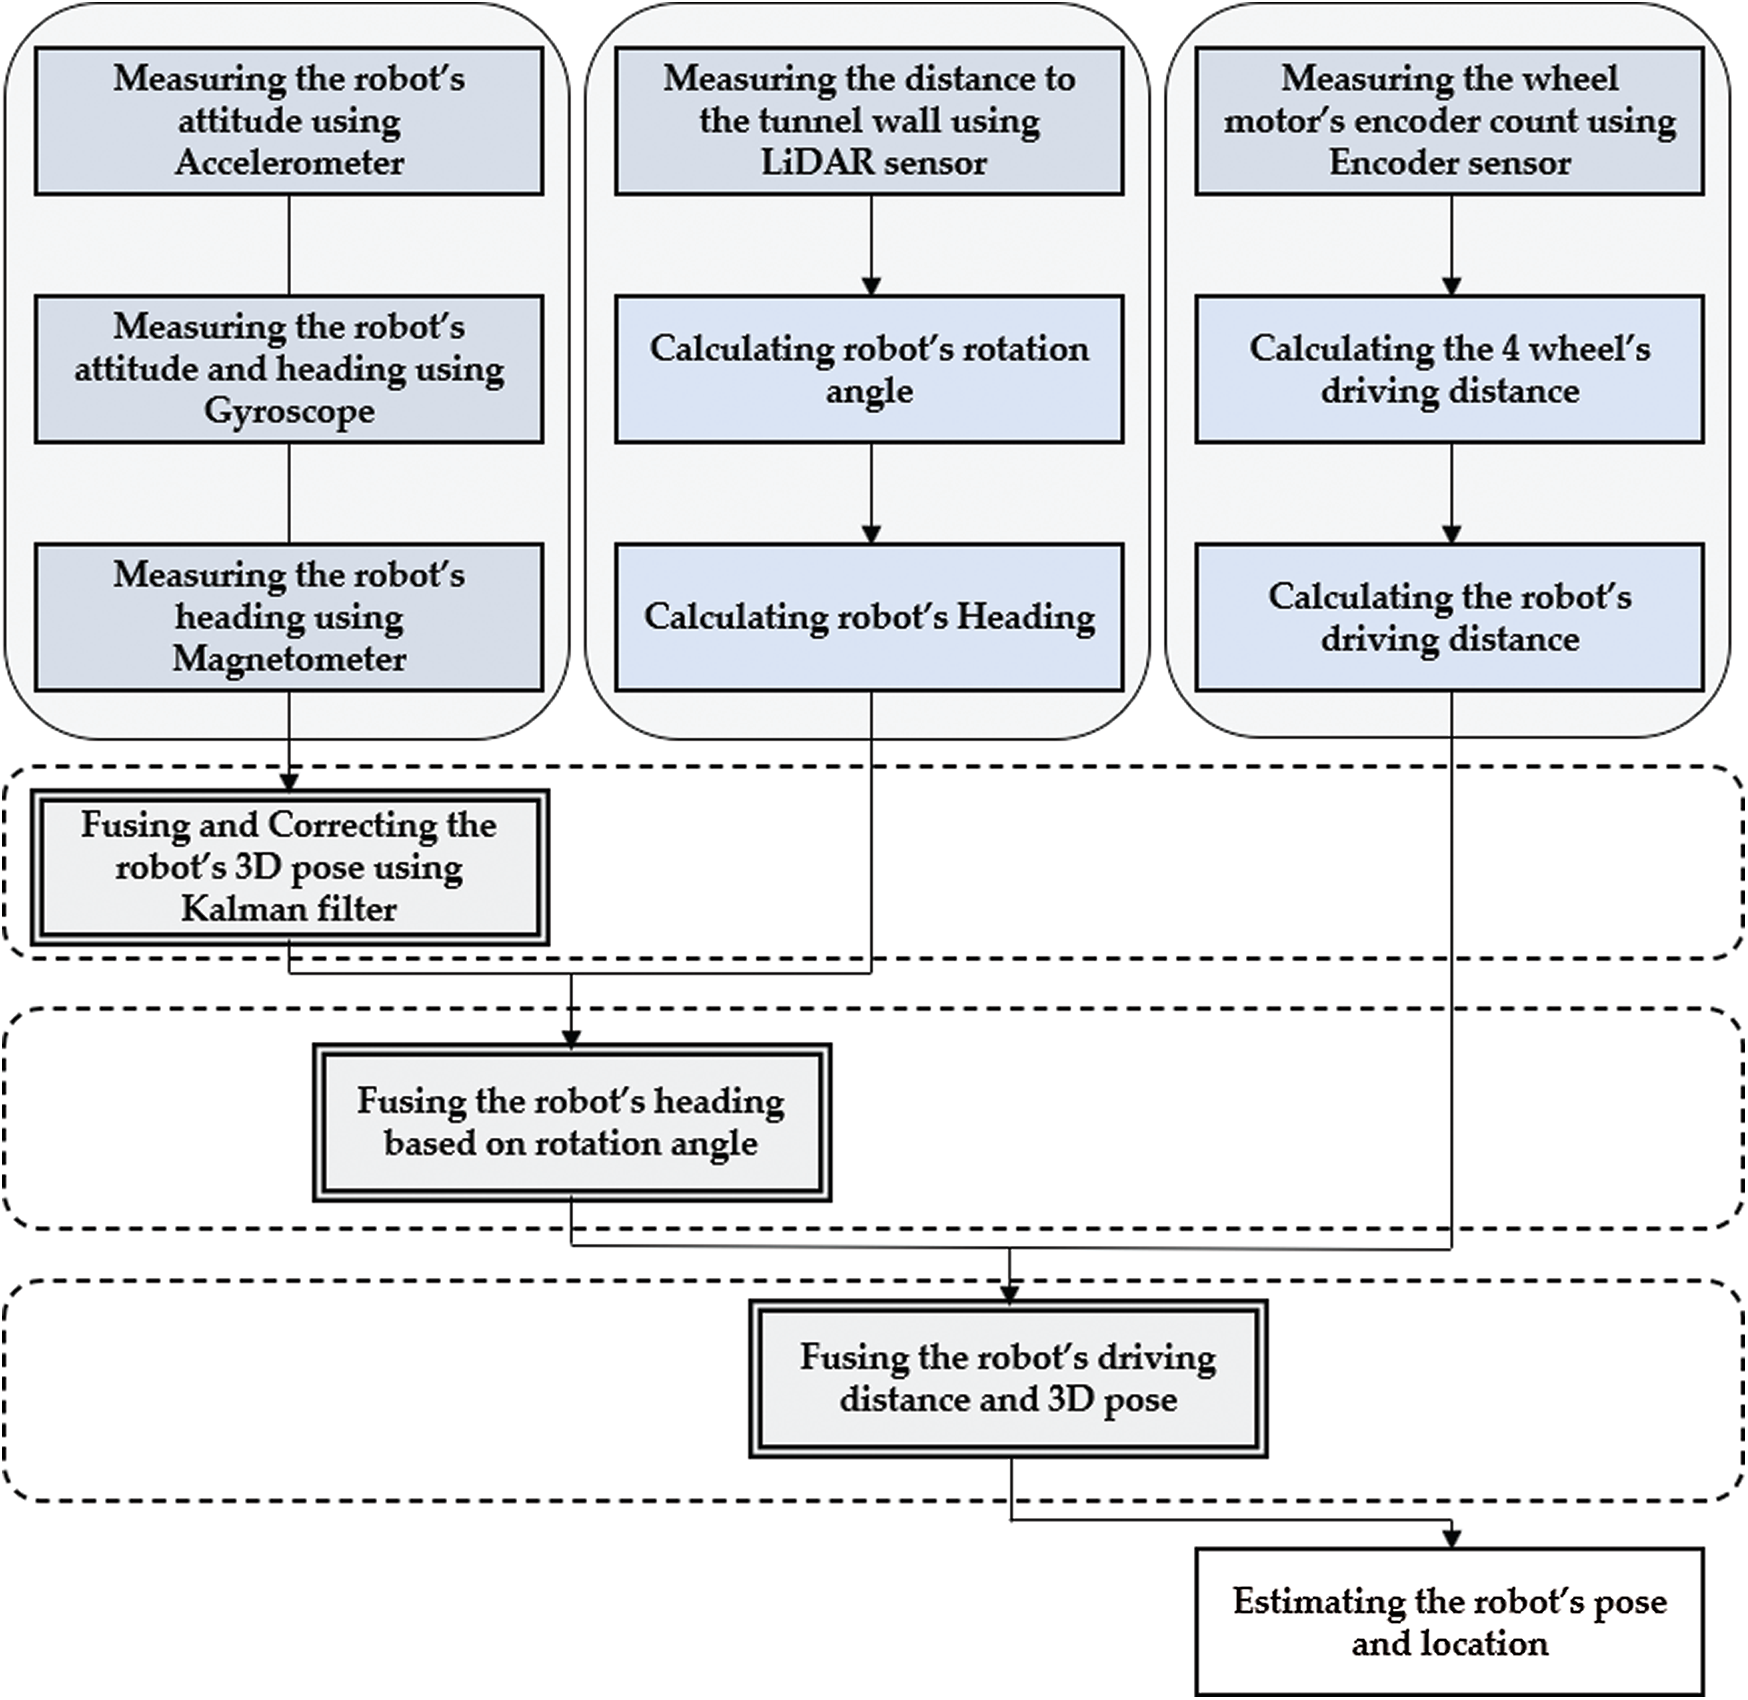
Figure 8: Overall system architecture of the data processing algorithm for location estimation
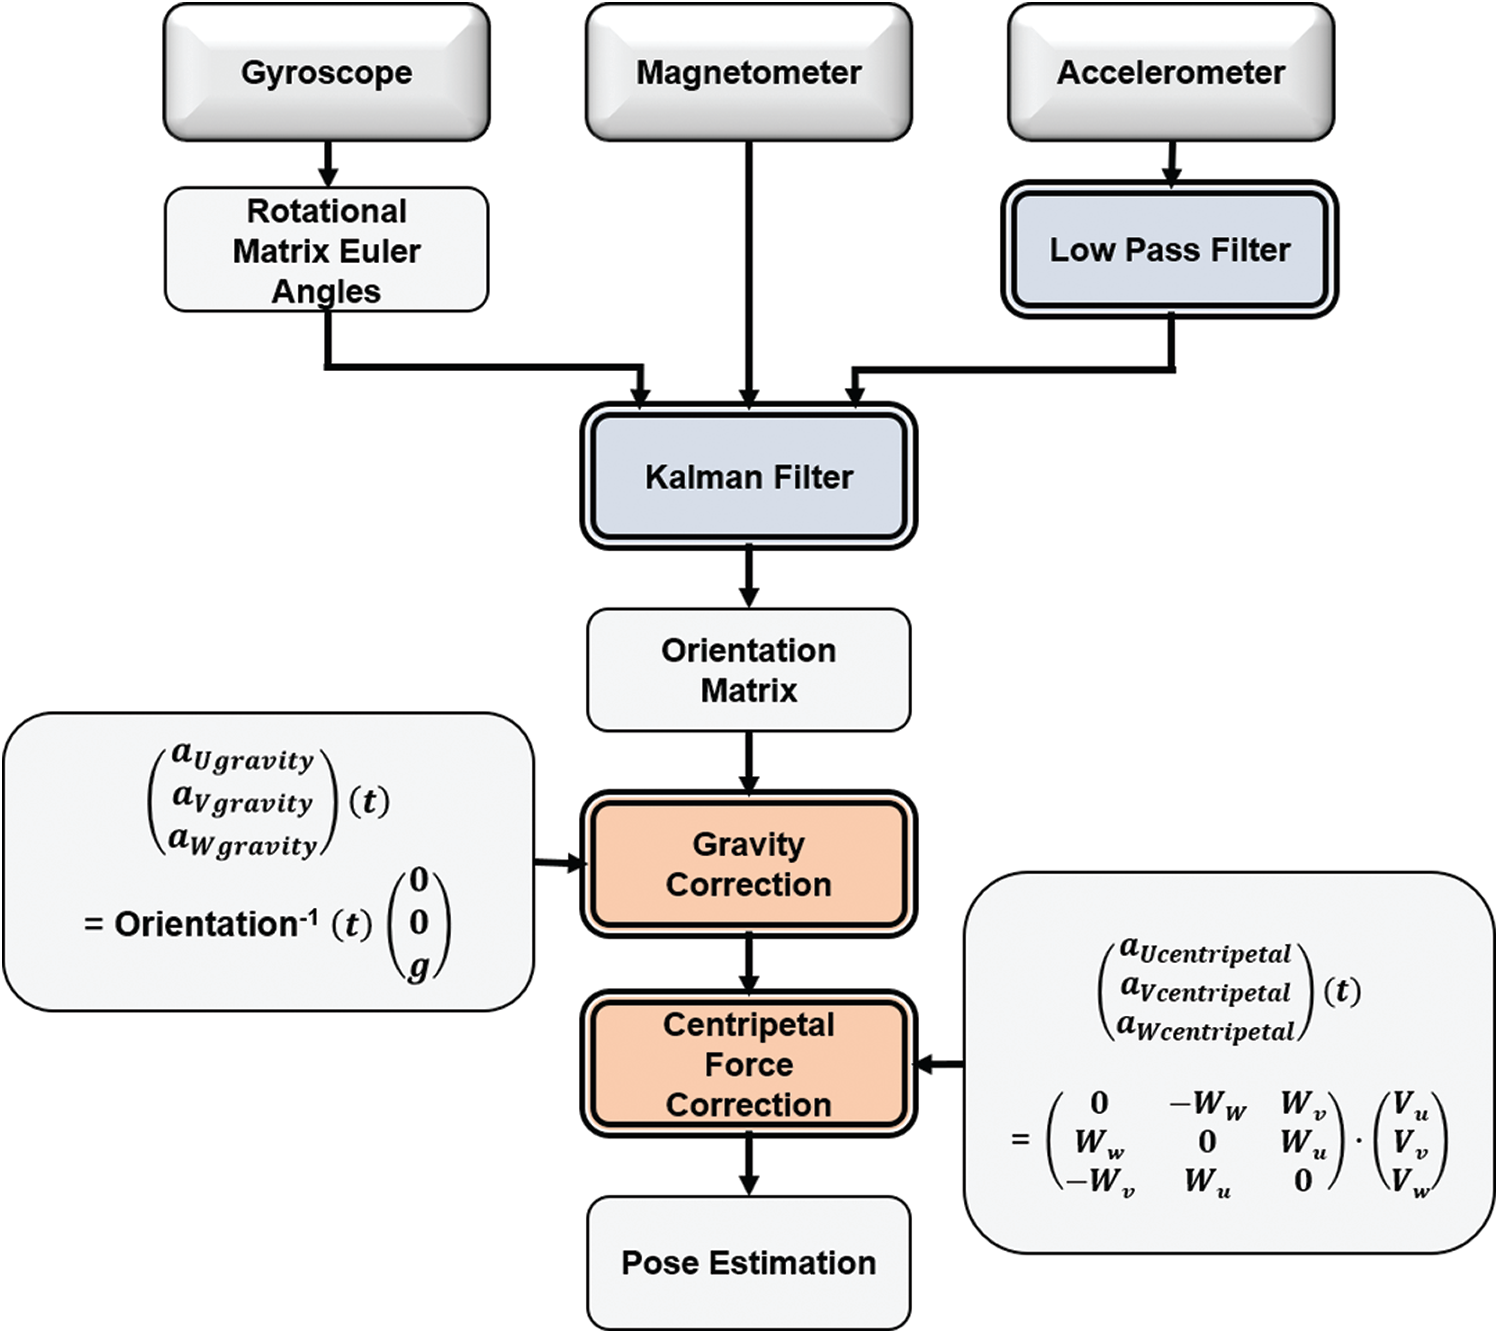
Figure 9: Processing diagram of IMU sensor’s data to estimate the robot’s pose and location
In this study, the buffer function was used instead of the spatial interpolation technique because the autonomous driving robot acquired data at close intervals. Additionally, environmental factors were expressed in different colors according to the range to visualize changes and distributions in environmental factors. A 2D map of the underground mine shaft surveyed with a 2D LiDAR sensor was visualized simultaneously.
In this study, field experiments were conducted on an abandoned amethyst mine located in Korea (35
When the autonomous driving robot starts by receiving a start signal from a remote controller, it performs autonomous driving and location estimation using IMU, LiDAR, and encoder sensors. It also measures the temperature, humidity, and concentration of hydrogen sulfide, carbon monoxide, oxygen, combustible gases, and particles using environmental sensors. The exterior driving image of the robot and the screen of the notebook PC were recorded. The estimated location, pose data, and environmental factor data were saved in units of 1 s. After the experiment was completed, the stored location and environmental data were sorted over time to match the environmental factor values according to the robot’s location. In addition, we measured the actual coordinates and driving paths of real robots by recording and analyzing the appearance of the robot’s driving path and evaluated the accuracy of the location estimation method by comparing them with estimated location coordinates. The actual location and estimated location are calculated using the root mean square error (RMSE) method, as shown in Eq. (4).
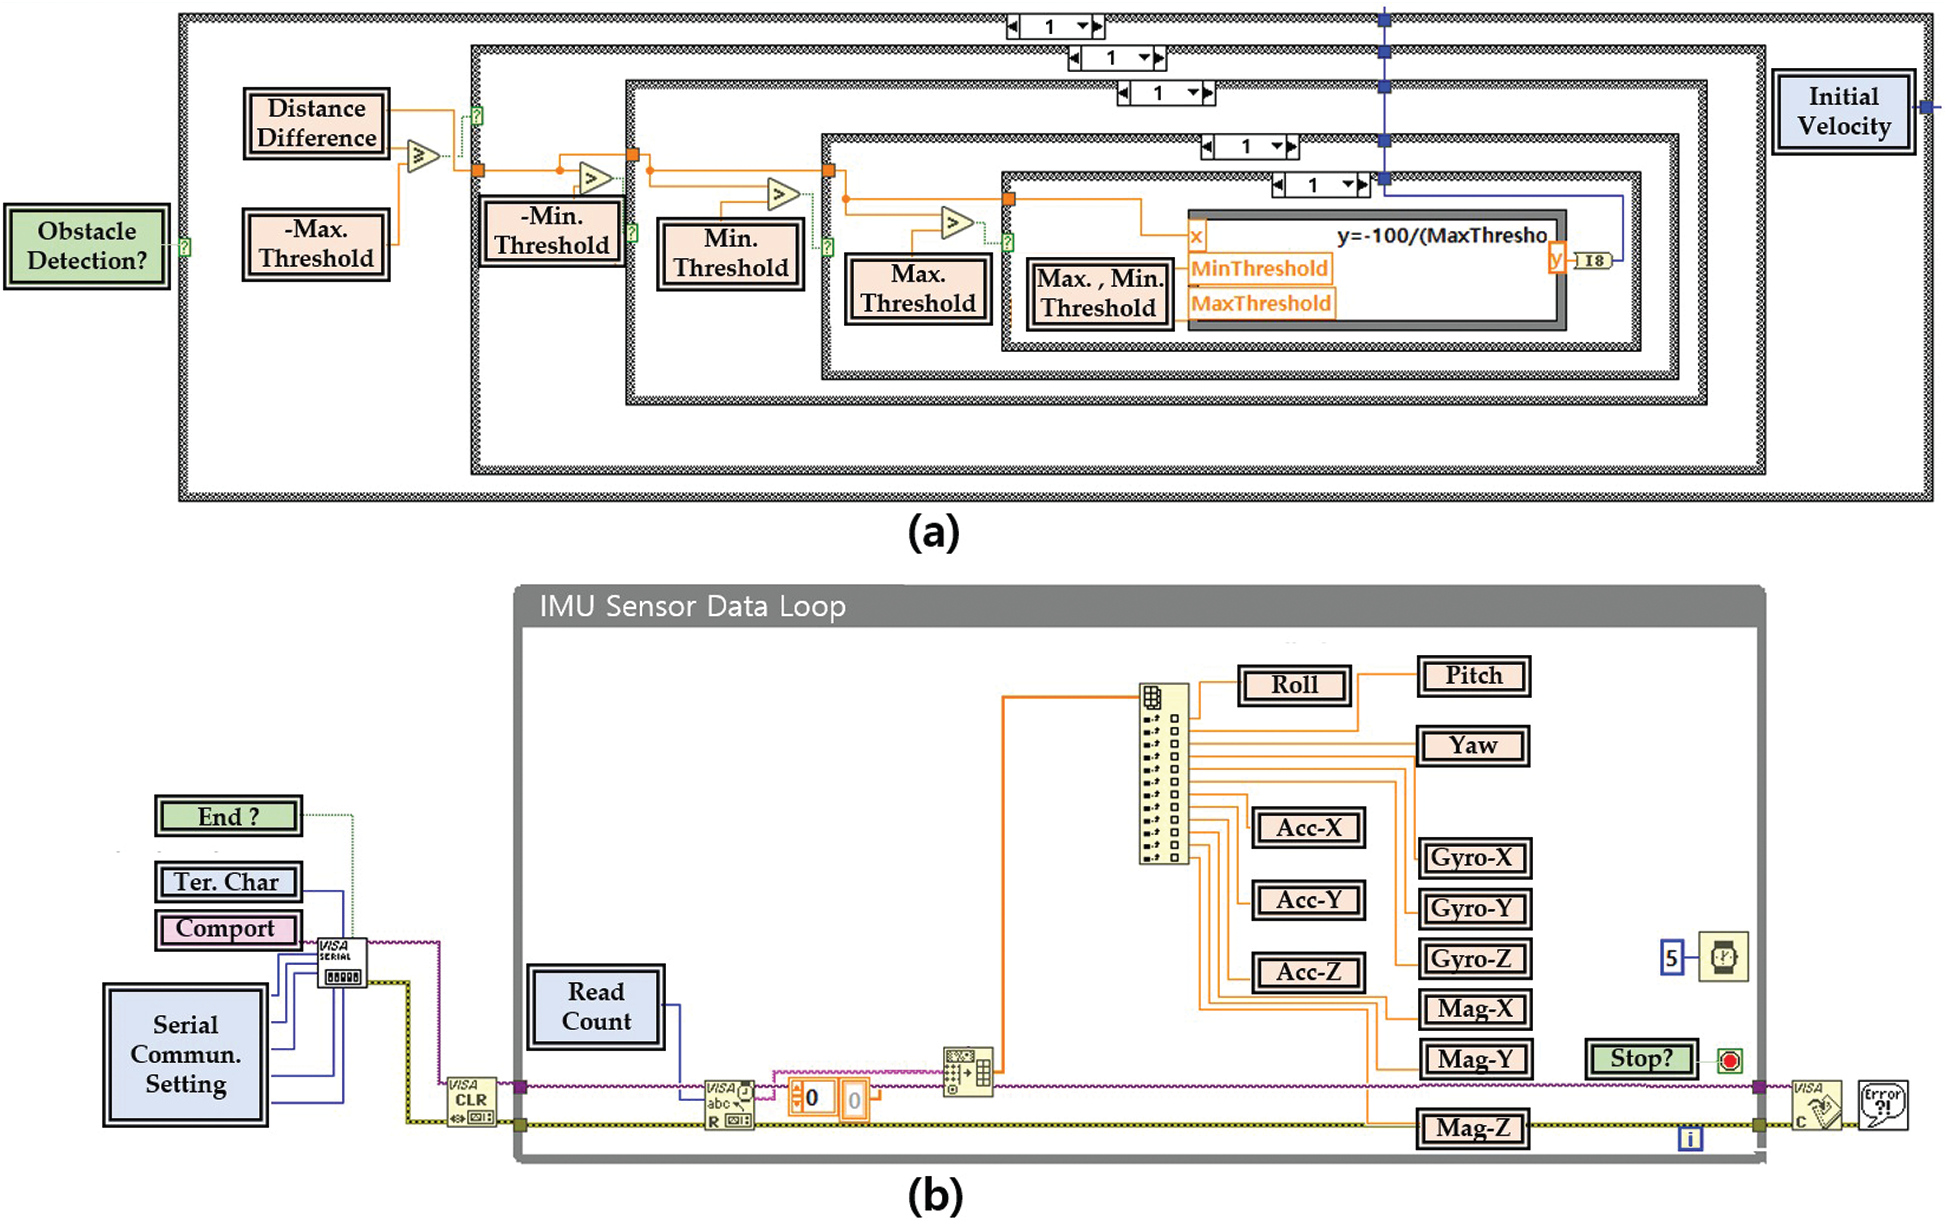
Figure 10: Block diagram of the programming code for (a) autonomous driving and (b) IMU sensor data acquisition
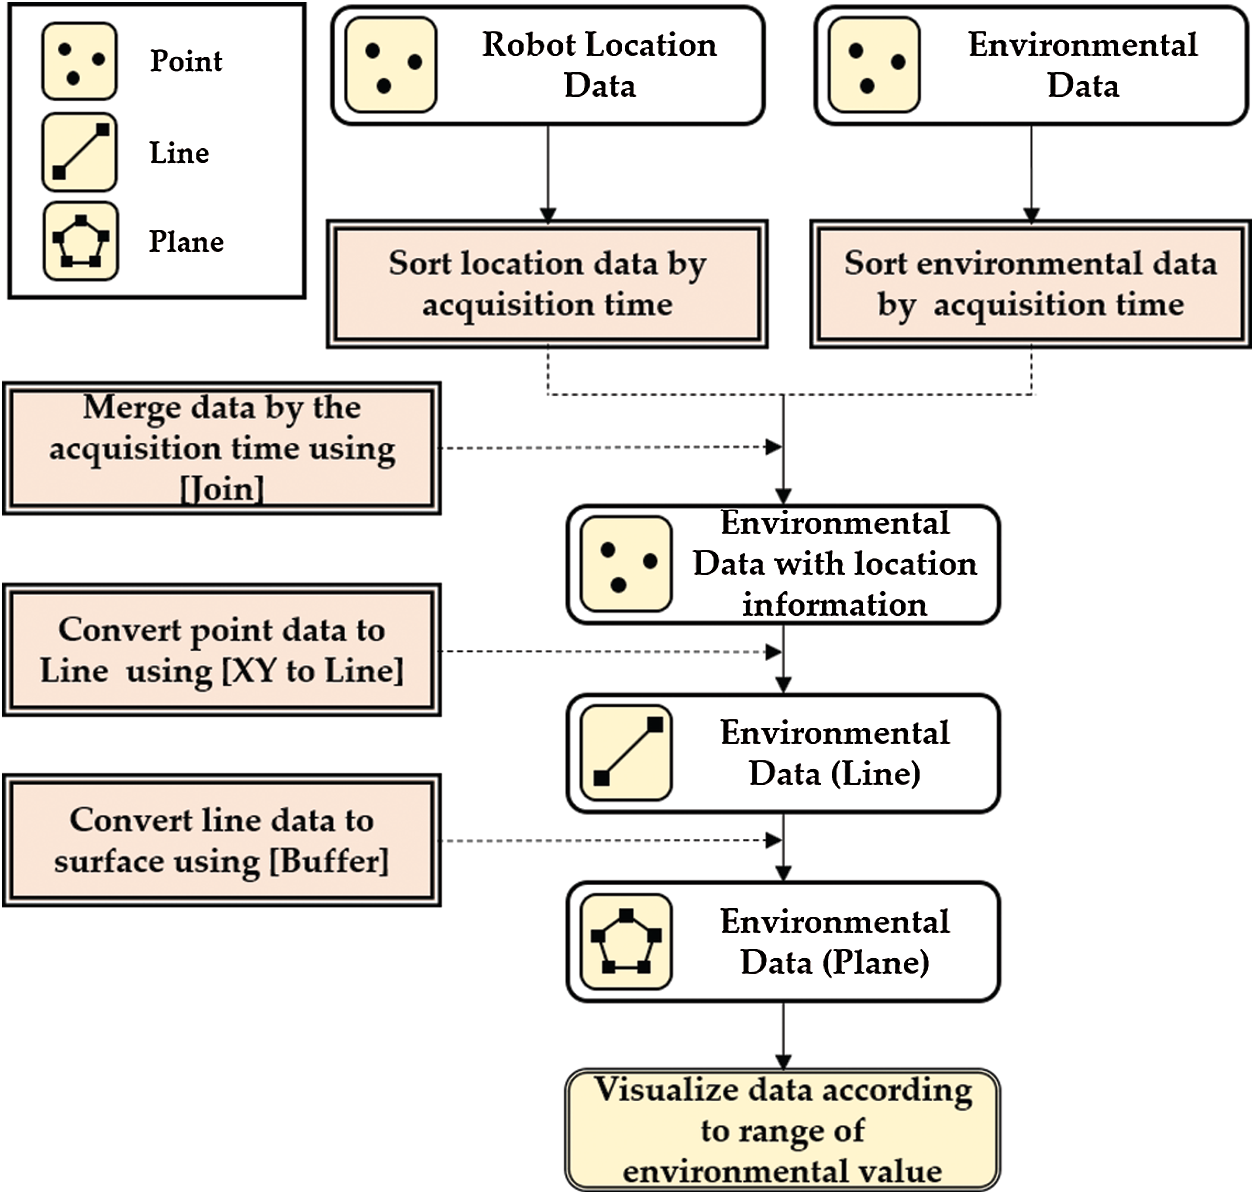
Figure 11: System architecture of environmental mapping system developed in this study
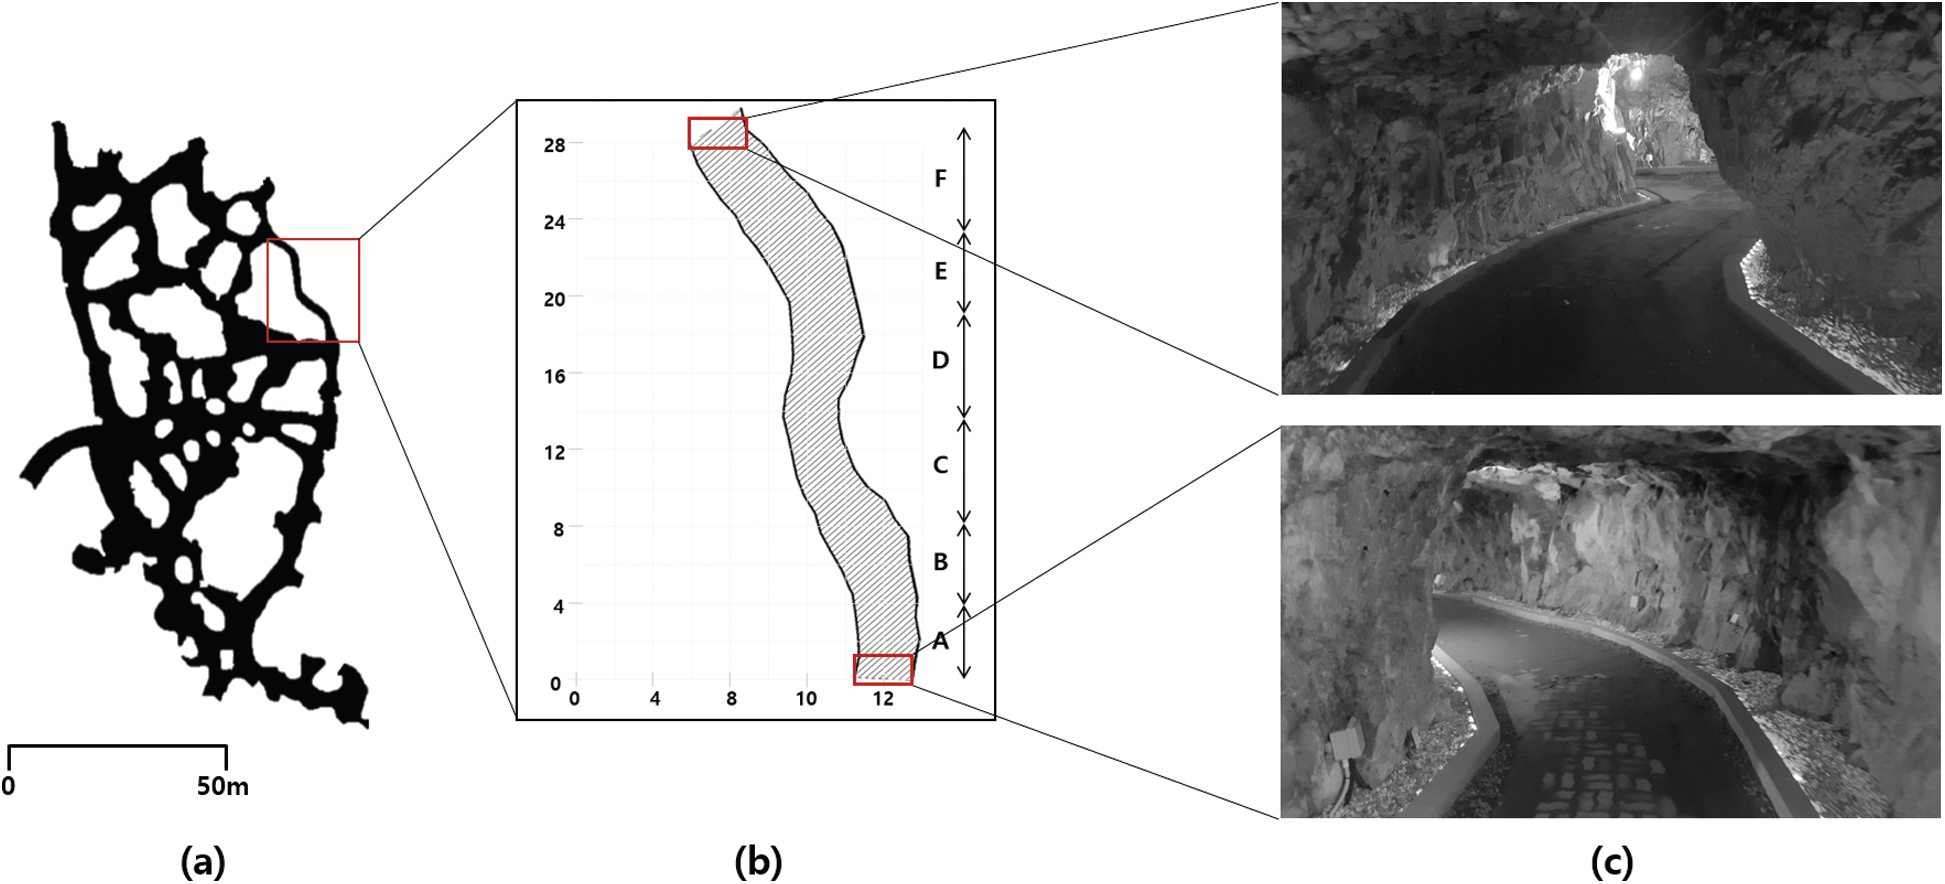
Figure 12: Conceptual diagram of the field experiment area (a) in an underground mine environment, (b) classified driving section, and (c) the start and end points
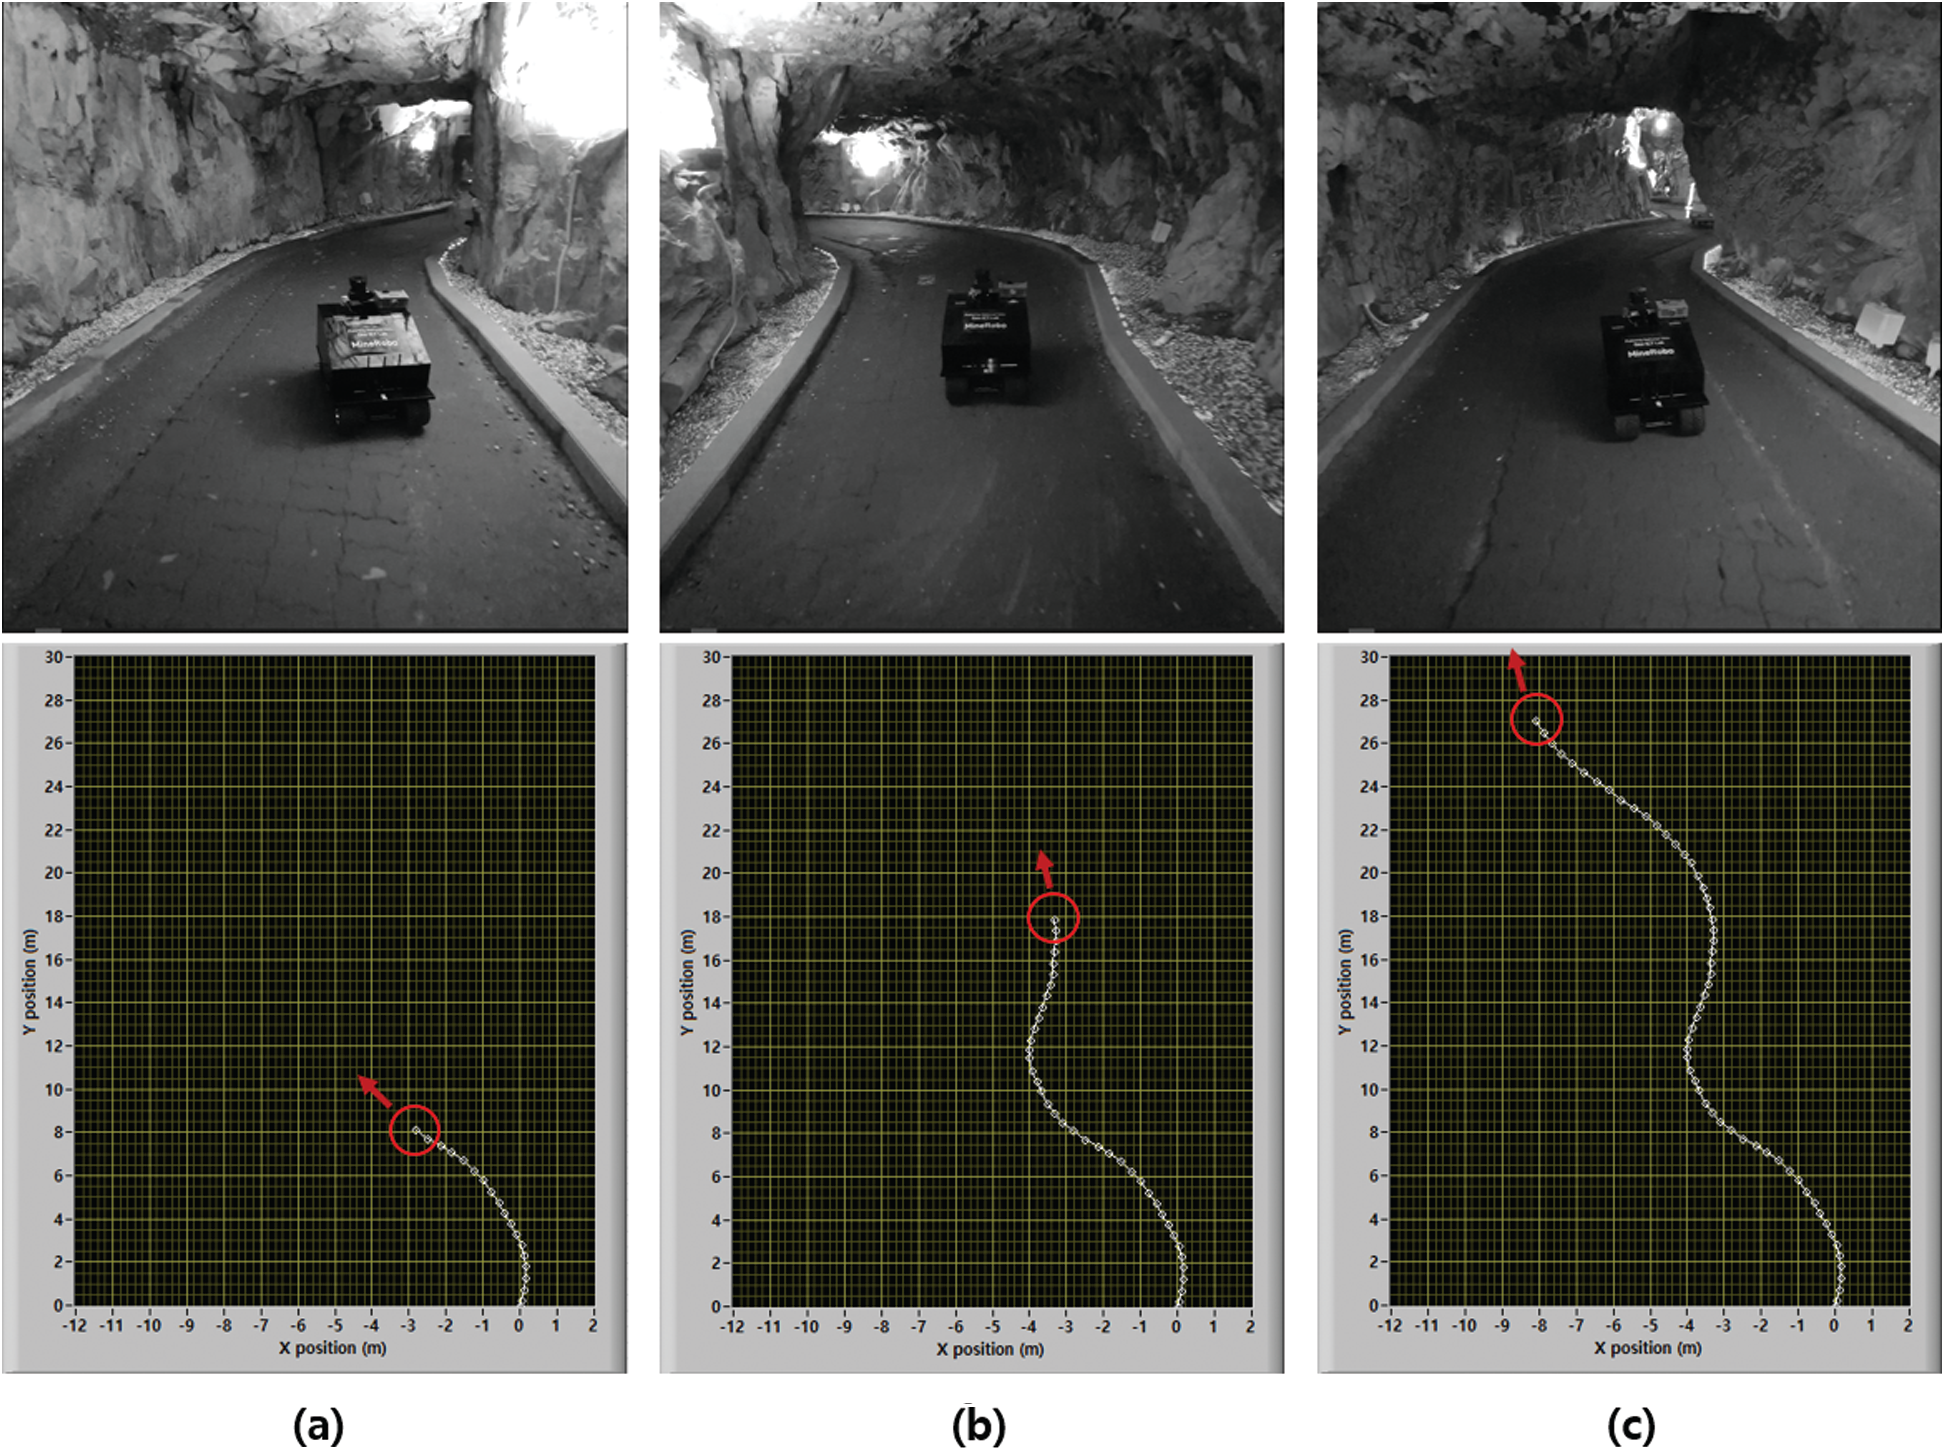
Figure 13: Field experiment scenes and estimated driving path of the autonomous driving robot at (a) 20 s (b) 40 s, and (c) 60 s
Table 4: Measured robot location and environmental data from the field experiment
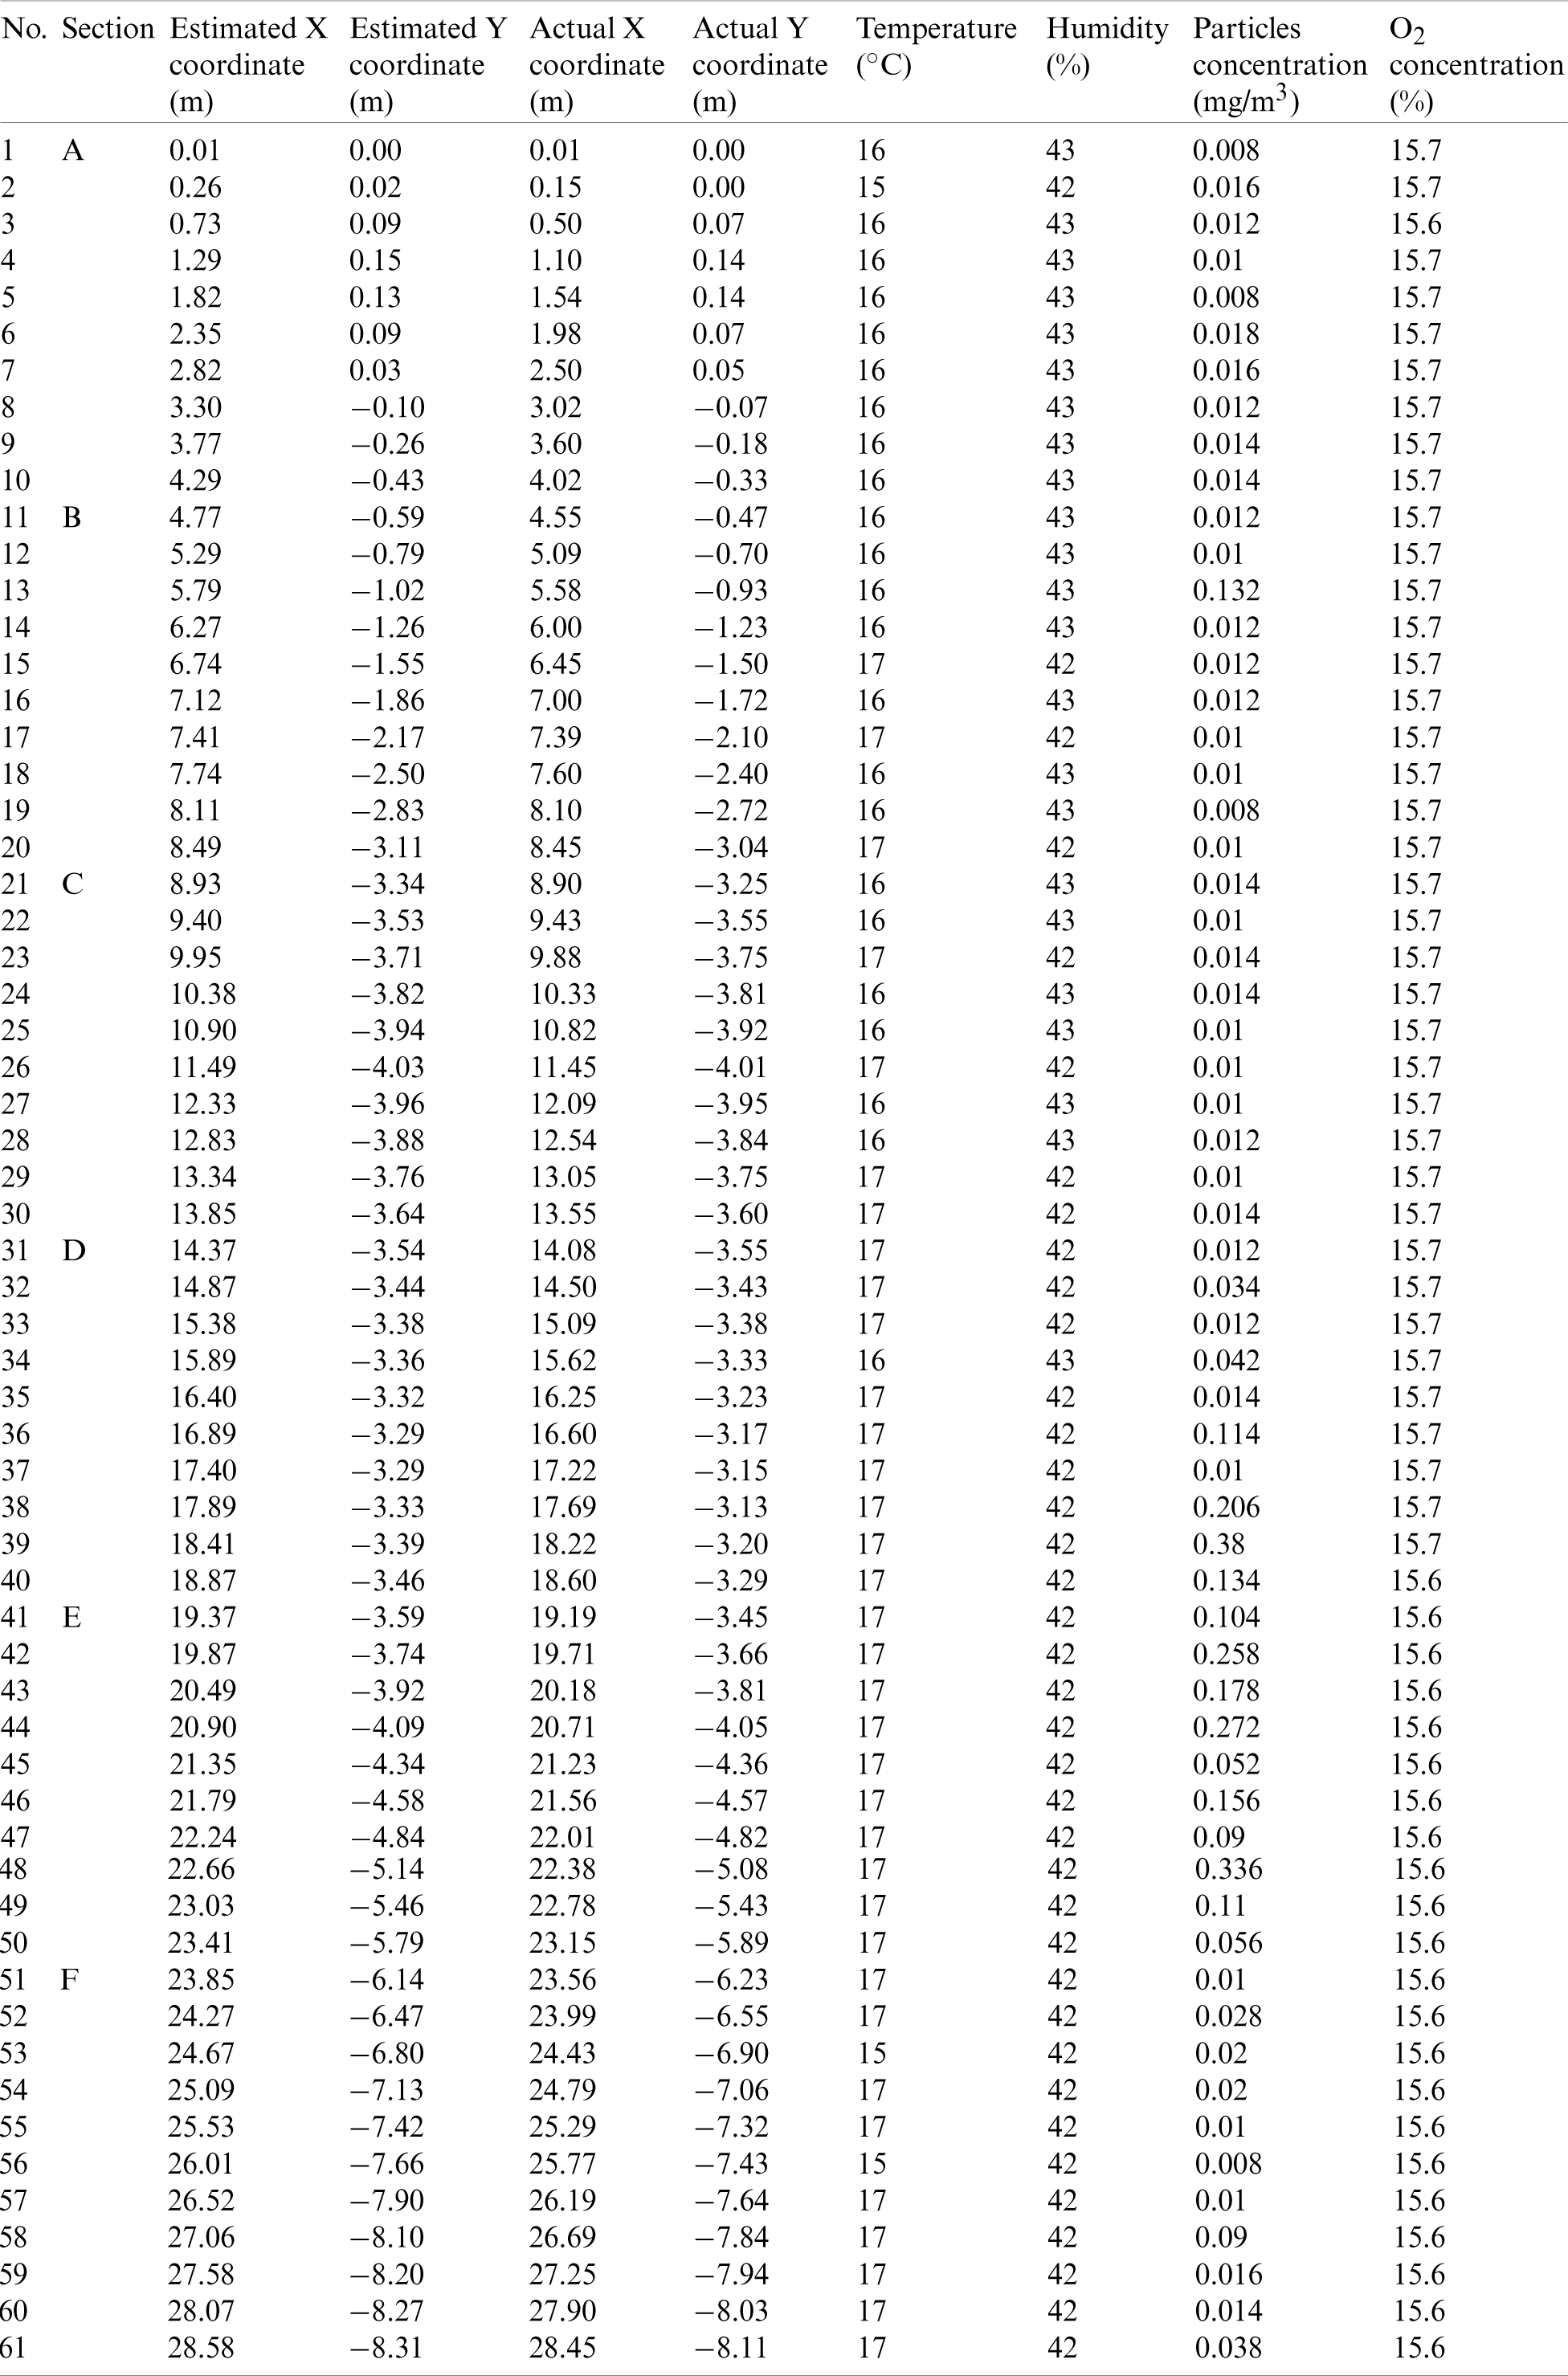
Fig. 13 shows the developed autonomous driving robot estimating the location and measuring environmental data and its driving directions while autonomous driving through the underground mine shafts at 20, 40, and 60 s. It was confirmed that the robot successfully performed autonomous driving in all sections, and it took approximately 61 s to drive through the experimental area. The autonomous driving robot was able to visualize the robot’s driving path by performing location estimation using sensors in real time.
Tab. 4 shows the robot’s estimated and actual x- and y-coordinates and the environmental data measured while the robot is driving through the field experiment area. While the autonomous robot drove approximately 30 m, 61 locations and environmental data were measured and stored.
The underground mine where the field experiments were conducted was measured at temperatures of approximately 15–16
The particle concentration of 0.293 mg/m3 was measured at approximately 38 to 51 s after the robot’s departure, and the relative concentration was 190 when the lowest particle concentration generated in the experimental area was converted to 1. It was expected that smoke or particles from the movement of people or equipment would have occurred at that time. The O2 concentration graph (Fig. 14d) shows a change of approximately 1
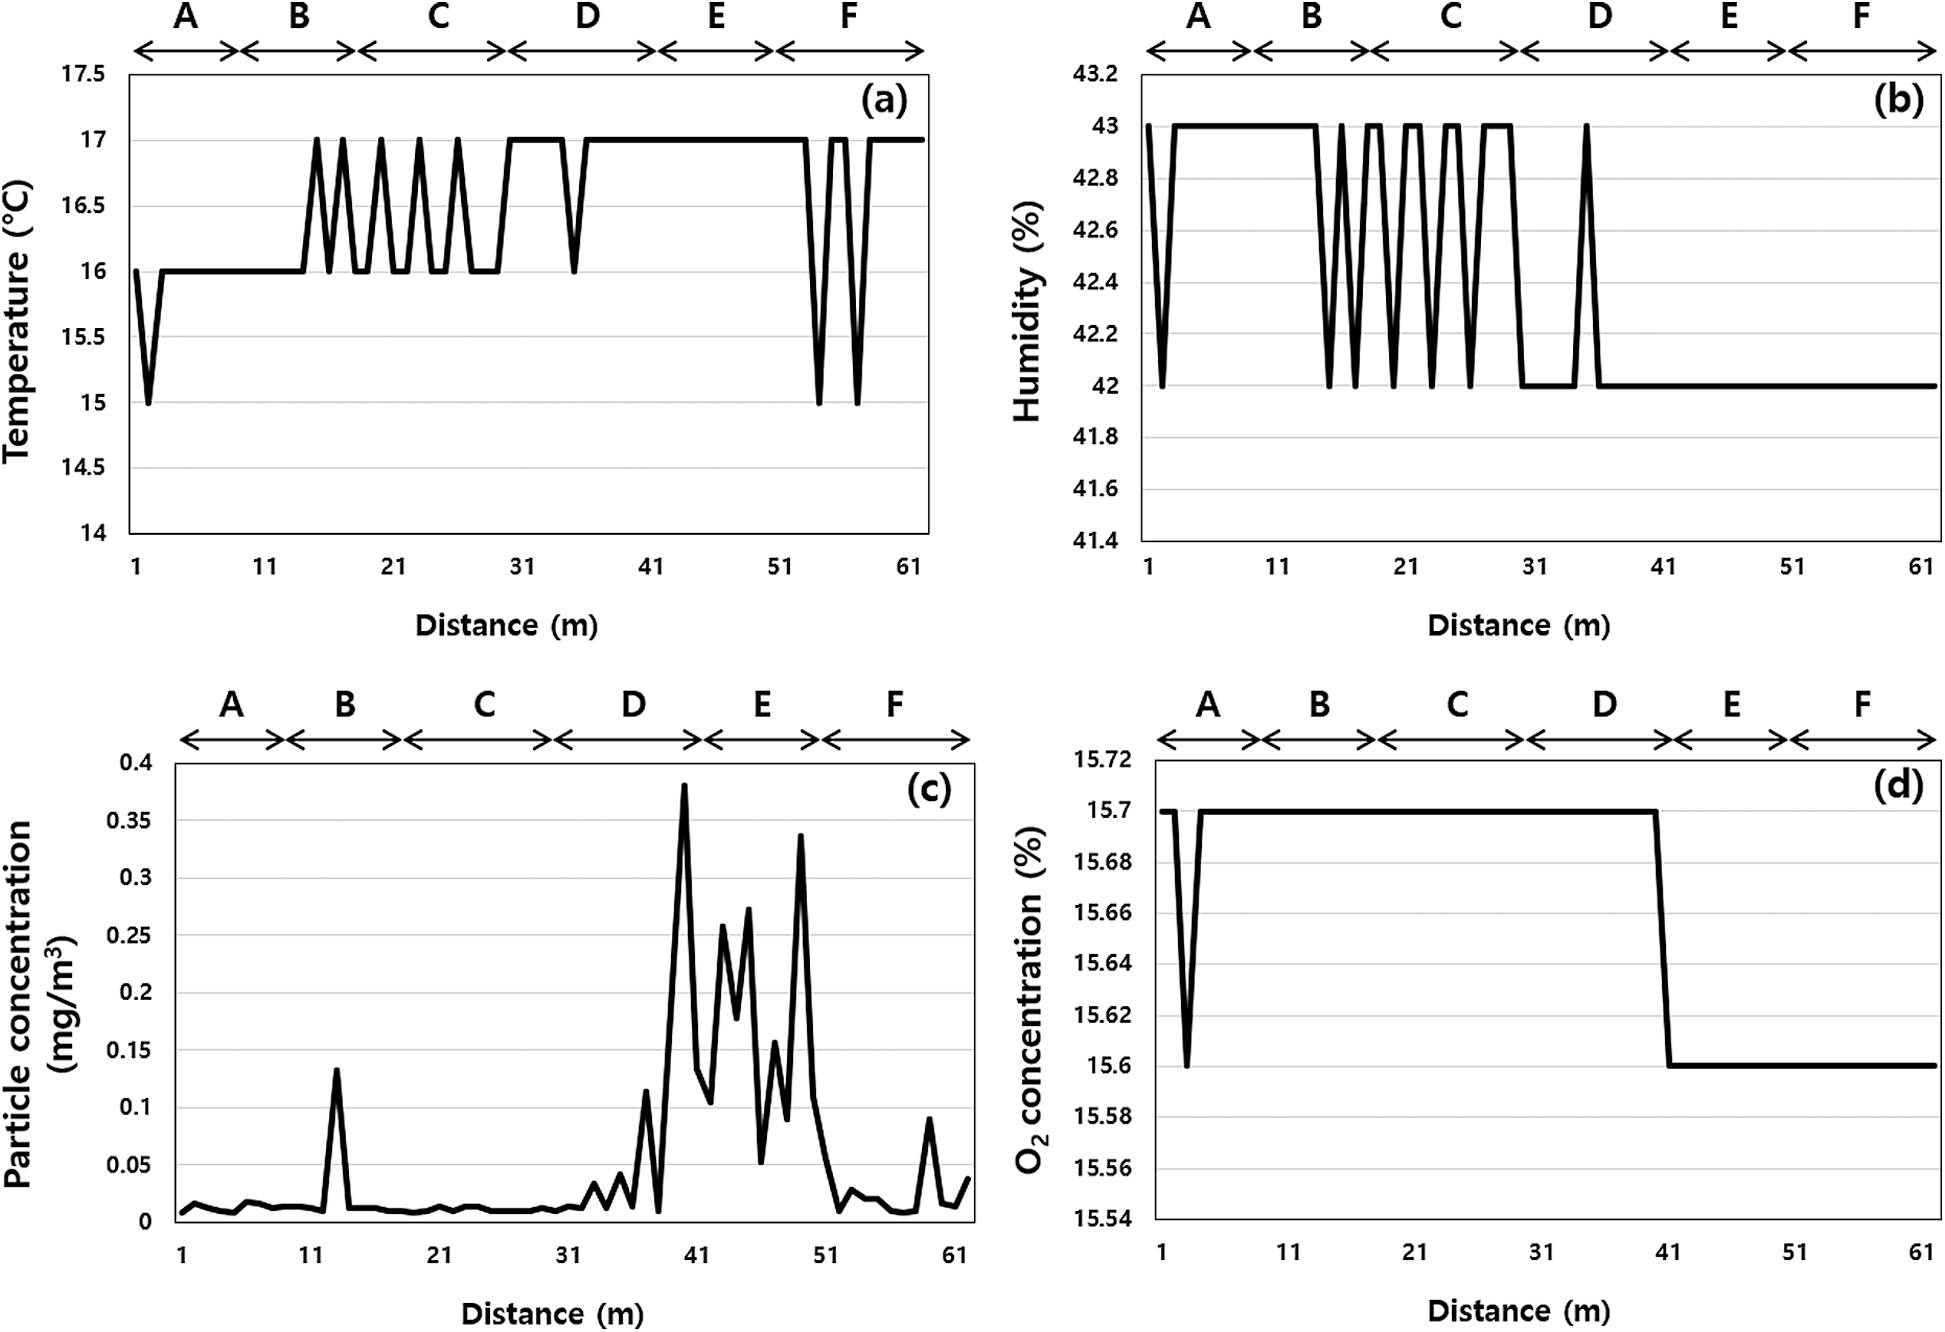
Figure 14: Graphs showing environmental data. (a) Temperature, (b) Humidity, (c) Particle concentration, (d) O2 concentration
In this study, the location of the autonomous driving robot was measured in real time using LiDAR, IMU, and encoder sensors, and the driving path was estimated by storing these data over time. In addition, the actual driving path of the robot was assessed by recording the appearance of the robot driving from the outside and analyzing it. Fig. 15 compares the estimated driving path and the actual driving path of the robot while driving through the field experiment area for unmanned environmental monitoring. The autonomous driving robot showed a relatively large error in some sections where the rotation angle was large, but the overall accuracy of location estimation was high. When compared quantitatively, RMSEs of approximately 0.11 m along the x-axis and 0.22 m along the y-axis were noted. Tab. 5 shows the RMSEs of location estimation and the average, standard deviation of environmental data at each section.
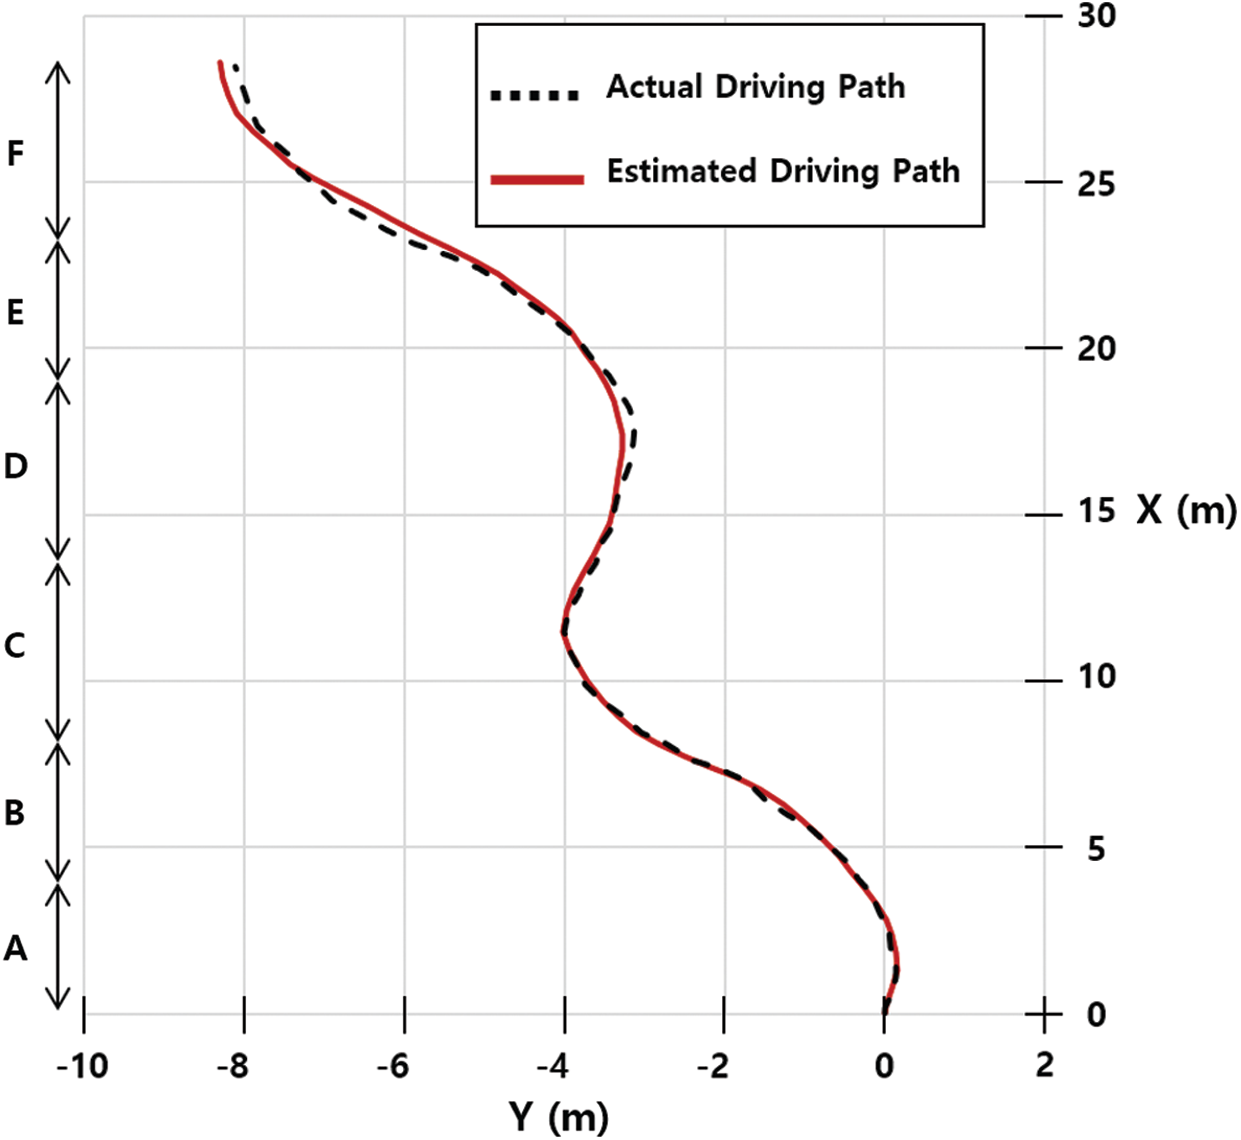
Figure 15: Comparison of the driving path created by the autonomous driving robot’s location estimation method and the actual driving path
Table 5: Location estimation accuracy and environmental data of field experiment at each section
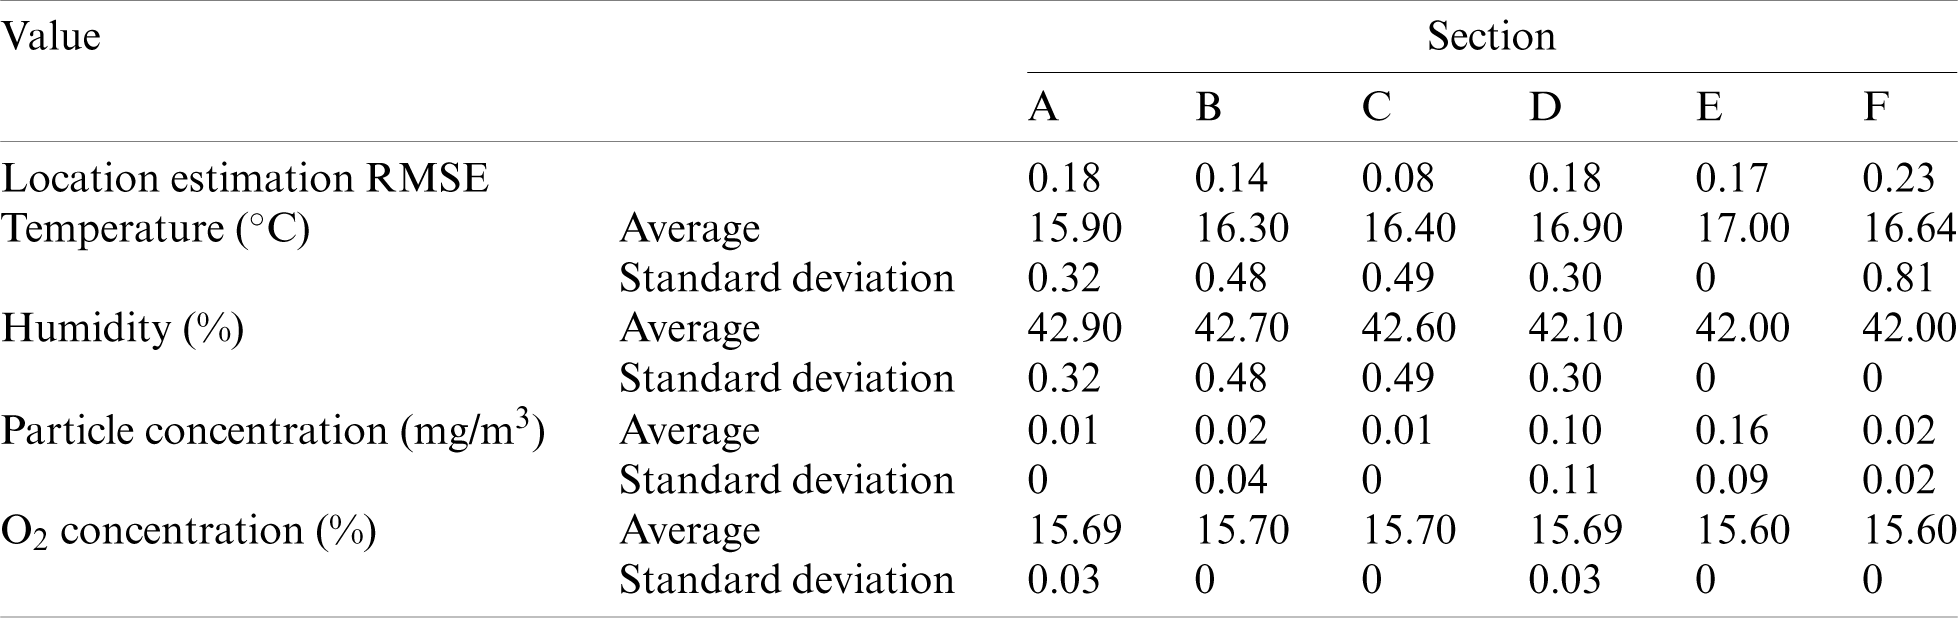
Fig. 16 shows the environment map created using the environmental data and GIS while the autonomous driving robot is driving. Because the location information and particle concentration of the autonomous driving robot were visualized simultaneously, it was possible to intuitively check the change in the particle concentration according to the driving path of the robot.
It was confirmed that the particle concentration partially increased in the area of 5 m along the Y-axis of the experimental area, and the particle concentration gradually increased from approximately 18 m to the maximum in the area of 19 m, and remained at a high concentration until the area of 24 m.
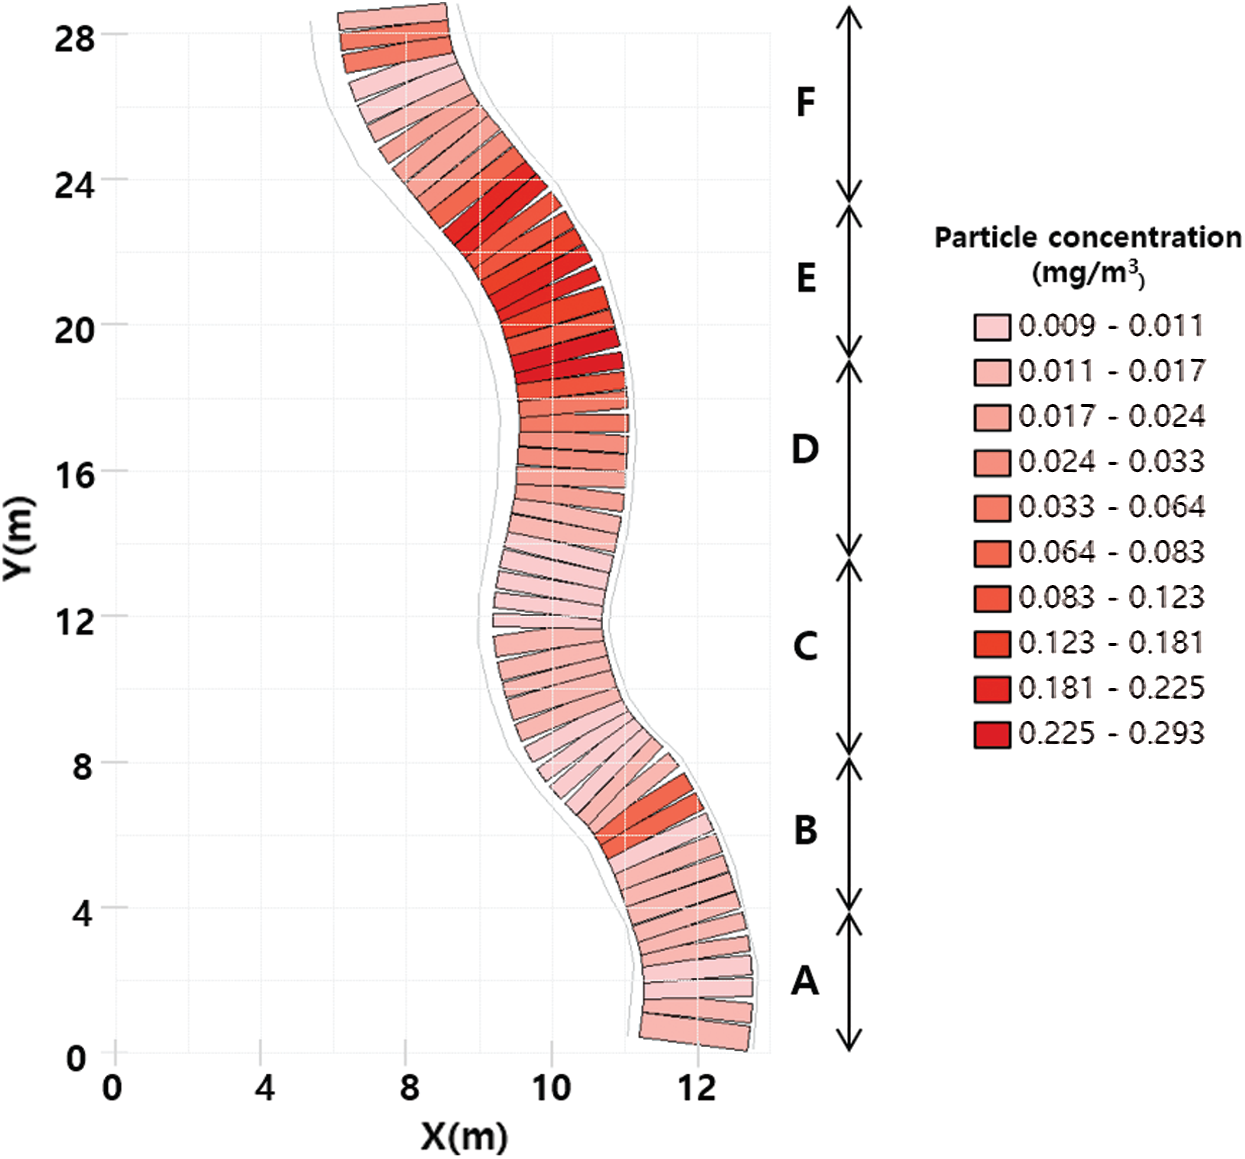
Figure 16: Particle concentration map at the study area created using the measured data and GIS
In this study, a small autonomous driving robot that can perform unmanned environmental monitoring in underground mines was developed using location estimation sensors and environmental detection sensors. Three types of sensors (IMU, LiDAR, and encoder) were used to estimate the location of the robot, and three types (temperature/humidity, gas, and particle) of environmental sensors were used to measure environmental factors. As a result of conducting field experiments on underground mines using the developed system, the location estimation method showed errors of approximately 0.22 m along the x-axis and 0.11 m along the y-axis. Temperature, humidity, O2, and particle concentration were measured to be almost constant, and the concentration of harmful gases was not measured. In the case of particle concentration, it was measured at a maximum of 0.293 mg/m3; it was confirmed from the created environmental map that a large number of particles were generated in the 18–24 m section of the experimental section.
Because the global positioning system (GPS) cannot be used in underground mine environments, it is difficult to recognize the location, and the communication environment for remotely operating devices is also limited. However, the autonomous driving robot developed in this study could efficiently collect location information from the measurement points of environmental data by using location estimation sensors and also conduct exploration autonomously without intervention by workers. In addition, because the location information and environmental data were used together to create an environmental map, the environmental information of the underground mine could be effectively visualized.
The developed small autonomous driving robot can be used in areas where road conditions are relatively stable. However, in the case of an actual underground mine environment, as there exist areas where the road conditions are not stable, its utilization is limited. Therefore, to expand the utilization of the autonomous driving system developed in this study, it would need to be applied to large-scale equipment such as mining transport trucks and loaders [51–54].
Funding Statement: This work was supported by the National Research Foundation of Korea (NRF) grant funded by the Korea government (MSIT) (2021R1A2C1011216).
Conflicts of Interest: The authors declare that they have no conflicts of interest to report regarding the present study.
1. Centers for Disease Control and Prevention (2016). Mining facts-2014. https://www.cdc.gov/niosh/mining/works/statistics/factsheets/miningfacts2014.html. [Google Scholar]
2. Centers for Disease Control and Prevention (2013). All mining disasters: 1839 to present. https://www.cdc.gov/niosh/mining/statistics/content/allminingdisasters.html. [Google Scholar]
3. Goodman, R. E., Shi, G. H. (1985). Block theory and its application to rock engineering. USA: Prentice Hall. [Google Scholar]
4. Abdellah, W., Raju, G. D., Mitri, H. S., Thibodeau, D. (2014). Stability of underground mine development intersections during the life of a mine plan. International Journal of Rock Mechanics % Mining Sciences, 72(5), 173–181. DOI 10.1016/j.ijrmms.2014.09.002. [Google Scholar] [CrossRef]
5. Wang, L., Cheng, Y. P., Liu, H. Y. (2014). An analysis of fatal gas accidents in Chinese coal mines. Safety Science, 62, 107–113. DOI 10.1016/j.ssci.2013.08.010. [Google Scholar] [CrossRef]
6. Baek, J., Choi, Y., Lee, C., Suh, J., Lee, S. (2017). BBUNS: Bluetooth beacon-based underground navigation system to support mine haulage operations. Minerals, 7(11), 228. DOI 10.3390/min7110228. [Google Scholar] [CrossRef]
7. Baek, J., Choi, Y. (2018). Bluetooth-beacon-based underground proximity warning system for preventing collisions inside tunnels. Applied Sciences, 8(11), 2271. DOI 10.3390/app8112271. [Google Scholar] [CrossRef]
8. Jung, J., Choi, Y. (2017). Measuring transport time of mine equipment in an underground mine using a bluetooth beacon system. Minerals, 7(1), 1. DOI 10.3390/min7010001. [Google Scholar] [CrossRef]
9. Baek, J., Choi, Y., Lee, C., Jung, J. (2018). Performance comparison of bluetooth beacon and reverse RFID systems as potential tools for measuring truck travel time in open-pit mines: A simulation experiment. Geosystem Engineering, 21(1), 43–52. DOI 10.1080/12269328.2017.1370616. [Google Scholar] [CrossRef]
10. Jung, J., Choi, Y. (2016). Collecting travel time data of mine equipments in an underground mine using reverse RFID systems. Tunnel and Underground Space, 26(4), 253–265. DOI 10.7474/TUS.2016.26.4.253. [Google Scholar] [CrossRef]
11. Jung, J., Choi, Y. (2017). Analysis of tag recognition ranges and rates according to reader transmission power levels when tracking machines by RFID in underground mines: An indoor experiment. Geosystem Engineering, 20(2), 81–87. DOI 10.1080/12269328.2016.1224985. [Google Scholar] [CrossRef]
12. Baek, J., Choi, Y. (2019). Simulation of truck haulage operations in an underground mine using big data from an ICT-based mine safety management system. Applied Sciences, 9(13), 2639. DOI 10.3390/app9132639. [Google Scholar] [CrossRef]
13. Song, M., Qian, J. (2020). Underground coal mine fingerprint positioning based on the MA-VAP method. Sensors, 20(18), 1–21. DOI 10.1109/JSEN.2020.3010656. [Google Scholar] [CrossRef]
14. Jo, B. W., Khan, R. M. A. (2018). An internet of things system for underground mine air quality pollutant prediction based on azure machine learning. Sensors, 18(4), 930. DOI 10.3390/s18040930. [Google Scholar] [CrossRef]
15. Mardonova, M., Choi, Y. (2019). Toward open-source hardware and software for the mining industry: A case study of low-cost environmental monitoring system for non-metallic underground mines. Mining, Metallurgy & Exploration, 36(4), 657–674. DOI 10.1007/s42461-019-0093-3. [Google Scholar] [CrossRef]
16. Sujitha, S., Shajilin Loret, J. B., Gethsy, M. D. M. (2020). Iot based smart mine safety system using arduino. International Journal of Computer Science and Mobile Computing, 9(5), 141–145. [Google Scholar]
17. Jha, A., Tukkaraja, P. (2020). Monitoring and assessment of underground climatic conditions using sensors and GIS tools. International Journal of Mining Science and Technology, 30(4), 495–499. DOI 10.1016/j.ijmst.2020.05.010. [Google Scholar] [CrossRef]
18. Pravin, S., Percis, E. S., Nalini, A., Rama, M. S. T. (2018). Raspberry pi based coal mine safety system. International Journal of Pure and Applied Mathematics, 118(24), 1–9. [Google Scholar]
19. Borkar, S. P., Baru, V. B. (2018). IoT based smart helmet for underground mines. International Journal of Research in Engineering, Science and Management, 1(9), 52–56. [Google Scholar]
20. Suh, J., Lee, S., Choi, Y. (2017). UMineAR: Mobile-tablet-based abandoned mine hazard site investigation support system using augmented reality. Minerals, 7(10), 198. DOI 10.3390/min7100198. [Google Scholar] [CrossRef]
21. Eiris, R., Gheisari, M., Esmaeili, B. (2018). Pars: Using augmented 360-degree panoramas of reality for construction safety training. International Journal of Environmental Research and Public Health, 15(11), 2452. DOI 10.3390/ijerph15112452. [Google Scholar] [CrossRef]
22. Kim, H., Choi, Y. (2019). Performance comparison of user interface devices for controlling mining software in virtual reality environments. Applied Sciences, 9(13), 2584. DOI 10.3390/app9132584. [Google Scholar] [CrossRef]
23. Tecknotrove (2020). Virtual reality training solutions. https://tecknotrove.com/virtual-reality-training-solutions/. [Google Scholar]
24. Ora, T. J., Mallet, L. G., Margolis, K. A. (2009). Enhanced fire escape training for mine workers using virtual reality simulation. Mining Engineering, 61(11), 41–44. [Google Scholar]
25. van Wyk, E., de Villiers, R. (2009). Virtual reality training applications for the mining industry. Proceedings of AFRIGRAPH 2009: 6th International Conference on Computer Graphics, Virtual Reality, Visualisation and Interaction in Africa, pp. 53–63. New York, USA. [Google Scholar]
26. Kerridge, A. P., Kizil, M. G., Hancock, M. G. D. (2004). Use of virtual reality in mining education. Proceedings of the 2004 CRCMining Research and Effective Technology Transfer Conference, Noosa Head, pp. 1–7. Queensland, Australia. [Google Scholar]
27. Baek, J., Choi, Y. (2019). Deep neural network for ore production and crusher utilization prediction of truck haulage system in underground mine. Applied Sciences, 9(19), 4180. DOI 10.3390/app9194180. [Google Scholar] [CrossRef]
28. Gallwey, J., Eyre, M., Coggan, J. (2020). A machine learning approach for the detection of supporting rock bolts from laser scan data in an underground mine. Tunnelling and Underground Space Technology, 107, 103656. DOI 10.1016/j.tust.2020.103656. [Google Scholar] [CrossRef]
29. Thrun, S., Thayer, S., Whittaker, W., Baker, C., Burgard, W. et al. (2004). Autonomous exploration and mapping of abandoned mines: Software architecture of an autonomous robotic system. IEEE Robotics and Automation Magazine, 11(4), 79–91. DOI 10.1109/MRA.2004.1371614. [Google Scholar] [CrossRef]
30. Kim, H., Choi, Y. (2020). Comparison of three location estimation methods of an autonomous driving robot for underground mines. Applied Sciences, 10(14), 4831. DOI 10.3390/app10144831. [Google Scholar] [CrossRef]
31. Larsson, J., Broxvall, M., Saffiotti, A. (2006). A navigation system for automated loaders in underground mines. Proceedings of the 5th International Conference on Field and Service Robotics, pp. 129–140. Berlin/Heidelberg, Germany. [Google Scholar]
32. Chi, H., Zhan, K., Shi, B. (2012). Automatic guidance of underground mining vehicles using laser sensors. Tunnelling and Underground Space Technology, 27(1), 142–148. DOI 10.1016/j.tust.2011.08.007. [Google Scholar] [CrossRef]
33. Marshall, J., Barfoot, T., Larsson, J. (2008). Autonomous underground tramming for center-articulated vehicles. Journal of Field Robotics, 25(6–7), 400–421. DOI 10.1002/rob.20242. [Google Scholar] [CrossRef]
34. Losch, R., Grehl, S., Donner, M., Buhl, C., Jung, B. (2018). Design of an autonomous robot for mapping, navigation, and manipulation in underground mines. 2018 IEEE/RSJ International Conference on Intelligent Robots and Systems, pp. 1407–1412. Madrid, Spain. [Google Scholar]
35. Nüchter, A., Surmann, H., Lingemann, K., Hertzberg, J., Thrun, S. (2004). 6D SLAM with an application in autonomous mine mapping. Proceedings of the 2004 IEEE International Conference on Robotics and Automation, pp. 1998–2003. LA, USA. [Google Scholar]
36. Bakambu, J. N., Polotski, V. (2007). Autonomous system for navigation and surveying in underground mines. Journal of Field Robotics, 24(10), 829–847. DOI 10.1002/rob.20213. [Google Scholar] [CrossRef]
37. Ghosh, D., Samanta, B., Chakravarty, D. (2017). Multi sensor data fusion for 6D pose estimation and 3D underground mine mapping using autonomous mobile robot. International Journal of Image and Data Fusion, 8(2), 173–187. DOI 10.1080/19479832.2016.1226966. [Google Scholar] [CrossRef]
38. Kim, H., Choi, Y. (2020). Field experiment of a LiDAR sensor-based small autonomous driving robot in an underground mine. Tunnel and Underground Space, 30(1), 76–86. DOI 10.7474/TUS.2020.30.1.076. [Google Scholar] [CrossRef]
39. Neumann, T., Ferrein, A., Kallweit, S., Scholl, I. (2014). Towards a mobile mapping robot for underground mines. Proceedings of the 2014 Pattern Recognition Association of South Africa RobMech and AfLaI International Joint Symposium. Cape Town, South Africa. [Google Scholar]
40. Baker, C., Morris, A., Ferguson, D., Thayer, S., Whittaker, C. et al. (2004). A campaign in autonomous mine mapping. Proceedings of the IEEE International Conference on Robotics and Automation. New York, USA. [Google Scholar]
41. Zhao, J., Gao, J., Zhao, F., Liu, Y. (2017). A search-and-rescue robot system for remotely sensing the underground coal mine environment. Sensors, 17(10), 2426. DOI 10.3390/s17102426. [Google Scholar] [CrossRef]
42. Günther, F., Mischo, H., Lösch, R., Grehl, S., Güth, F. (2019). Increased safety in deep mining with iot and autonomous robots. Proceedings of the 39th International Symposium ‘Application of Computers and Operations Research in the Mineral Industry, pp. 603–611. Wroclaw, Poland. [Google Scholar]
43. Unmanned Solution (2020). ERP-42 mobile robot platform. https://wego-robotics.com/erp42/. [Google Scholar]
44. Mouser (2020). SEN11301P. https://www.mouser.com/ProductDetail/Seeed-Studio/SEN11301P?qs=Oo40KB9lBTl6M9Qf387m0Q==. [Google Scholar]
45. Honeywell (2020). GasAlertMax XT II. https://www.honeywellanalytics.com/en-gb/products/GasAlertMax-XT-II. [Google Scholar]
46. Kanomax (2020). Digital Dust Monitor Model 3443. https://www.kanomax-usa.com/product/digital-dust-monitor-model-3443/. [Google Scholar]
47. Honeywell (2020). Fleet Manager II Operator Manual. https://www.honeywellanalytics.com/ /media/honeywell-analytics/products/fleet-manager-ii/documents/omenfmii.pdf?la=en. [Google Scholar]
48. Kanomax (2020). Model 3443 Operation Manual. https://kanomax.biz/asia/about/pdf/3443_softmanual.pdf. [Google Scholar]
49. Mouser (2020). DHT11 Humidity & Temperature Sensor. https://www.mouser.com/datasheet/2/758/DHT11-Technical-Data-Sheet-Translated-Version-1143054.pdf. [Google Scholar]
50. Torres, J., O’Flynn, B., Angove, P., Murphy, F., Mathuna, C. O. (2007). Motion tracking algorithms for inertial measurement. Proceedings of the ICST 2nd International Conference on Body Area Networks, pp. 1–8. Florence, Italy. [Google Scholar]
51. Larsson, J., Broxvall, M., Saffiotti, A. (2010). An evaluation of local autonomy applied to teleoperated vehicles in underground mines. 2010 IEEE International Conference on Robotics and Automation, pp. 1745–1752. Anchorage, USA. [Google Scholar]
52. Larsson, J., Broxvall, M., Saffiotti, A. (2008). Flexible infrastructure free navigation for vehicles in underground mines. 2008 4th IEEE International Conference Intelligent Systems, pp. 45–50. Varna, Bulgaria. [Google Scholar]
53. Tang, J., Lu, X., Ai, Y., Tian, B., Chen, L. (2019). Road detection for autonomous truck in mine environment. 2019 IEEE Intelligent Transportation Systems Conference, pp. 839–845. Auckland, New Zealand. [Google Scholar]
54. Dong, L., Sun, D., Han, G., Li, X., Hu, Q. et al. (2020). Velocity-free localization of autonomous driverless vehicles in underground intelligent mines. IEEE Transactions on Vehicular Technology, 69(9), 9292–9303. DOI 10.1109/TVT.2020.2970842. [Google Scholar] [CrossRef]
 | This work is licensed under a Creative Commons Attribution 4.0 International License, which permits unrestricted use, distribution, and reproduction in any medium, provided the original work is properly cited. |