Engineering & Sciences
| Computer Modeling in Engineering & Sciences |
DOI: 10.32604/cmes.2021.016019
ARTICLE
Discrete Particle Simulation of Gas-Solid Flow in Air-Blowing Seed Metering Device
1Jiangxi Provincial Key Laboratory for Simulation and Modelling of Particulate Systems, Jiangxi University of Science & Technology, Ganzhou, 341000, China
2Energy Materials Computing Center, Jiangxi University of Science & Technology, Nanchang, 330013, China
*Corresponding Author: Zhengquan Li. Email: zhengquan.li@jxust.edu.cn
Received: 31 January 2021; Accepted: 03 March 2021
Abstract: In this paper, the gas and seed flow characters in the air-blowing seed metering device are investigated by using the coupled computational fluid dynamics and discrete element method (CFD-DEM) in three dimensions (3D). The method of establishing boundary model based on the computer-aided design (CAD) drawing, has been used to build the boundary model of seed metering device. The 3D laser scanning technique and multi-element method are adopted to establish the particle model. Through a combined numerical and experimental effort, using 3D CFD-DEM software, which is based on the in-house codes, the mechanisms governing the gas and solid dynamic behaviors in the seed metering device have been studied. The gas velocity field and the effect of different rotational speeds and air pressures on the seeding performance and particle velocity have been studied, similar agreements between numerical and experimental results are gained. This reveals that the 3D CFD-DEM model established is able to predict the performance of the air-blowing seed metering device. It can be used to design and optimize the air-blowing seed metering device and other similar agriculture devices.
Keywords: Seed metering device; CFD-DEM; CAD; simulation; gas-solid flow
Seed metering device is one of the core components of sowing machinery. The quantity and quality of harvested crops are closely related to the quality of sowing. A good seed metering device can make seeds and gas move as expected, little damage for seeds and high efficiency. Until now, the number of seed metering device which has high performance is still few. This is because that it is a lengthy process from idea, design, sample making, testing, to market. The process from design to testing usually needs to be repeated many times. The long cycle of improving the performance of the seed metering device restricts further increase in crop yields. The numerical simulation can overcome this problem.
Recent years, numerical approaches have become indispensable in studies on single-/multi-phase flows. Discrete element methods (DEM) which developed initially by Cundall et al. [1] was the first granular dynamics simulation technique published in the open literature. DEM has been extensively used in studies of various areas, such as particle packing, particle flows, and particle-fluid flow [2–4]. For agriculture, there are many applications. A hybrid model of FEM and DEM has been developed for studying the flow velocities and stresses of a bulk solid material stored in and discharging from bins and silos [5]. Soybeans flowing down an inclined chute with a bumpy bottom was studied by using DEM with one improved tangential force-displacement model [6]. Soil deformation and resistance were studied by conducting a bar penetration test and the DEM simulation [7]. A 2D DEM model was developed for numerical simulation of the shaking separation of paddy and brown rice [8]. The soil loosening process when the soil is cut with a pendulum-type blade was studied by using DEM, and the dynamic behavior of soil was researched too [9]. The seed-solid contact characteristics were simulated using DEM, and the influence of soil particle stiffness and the press wheel was also studied [10]. The flow characteristics of black pepper seeds in a cryo-grinding system: a precooler and a grinder such as a hammer mill was investigated using DEM [11].
But it is important to note that in agricultural production, such as seeding [12,13], cleaning & drying process, etc, there are not only collisions among particles, between particles and mechanical parts, but also particle-gas/fluid, particle-gas-fluid interactions under various conditions, even mass transfer and heat transfer. High-performance equipment should let particles, gas or fluid move as expected, little damage for particles. On this point, it is necessary to research the mechanisms governing particle-particle, particle-gas/fluid interactions at microscopic and macroscopic levels. With the development of the coupled discrete element method and computational fluid dynamics (CFD-DEM), a way out was found for this problem.
CFD-DEM has been widely used in numerous research areas, since it can be used to analyze the discontinuous movement of individual particles, as well as the continuous movement, such as the velocity fields and air pressure fields, etc. The most common applications are for industry, like the fluid bed [14–18], impact pulveriser [19], pneumatic conveying [20–22], blast furnace [23–25], cyclone separator [26], drying process [27], etc. For agriculture, the related reports are still few. This is especially true for the application of 3D CFD-DEM.
In this paper, based on the air-blowing seed metering device and soybean seeds, the gas is treated as a continuous medium. The motion information of the gas phase is obtained through solving governing equations of the continuous medium. The soybean seeds are treated as the discrete medium. The movement of seeds and the interaction between seeds and gas are obtained through solving Newton’s second and third laws of motion. The complex gas-solid two-phase flow in the air-blowing seed metering device is studied.
In the CFD-DEM method [28], the solid phase is treated as a discrete phase while the gas phase is treated as a continuum phase. The governing equations for solid phase are as follows:
and
where mi, Ii,
The governing equations of gas phase are as follows:
and
where
To analyze the air-blowing seed metering device using CFD-DEM, the boundary model of the seed metering device should be established firstly. The air-blowing seed metering device is a relatively complicated mechanical part. How to build the boundary model of this kind of part has been deeply concerned.
There are three reported strategies [29]. The first one is based on continuous formulation [30]. For some simple mechanical parts, for instance, the cylinder, its boundary model can be established directly through a mathematical expression. The second one is based on an assemblage of particles, the size and the position of which are chosen to mimic as accurately as possible the boundary of the mechanical part [31]. The drawback of these two strategies is that it will be very difficult to build the boundary model if the boundary is very complicated. The third one is called the finite wall method [32]. The finite wall method is based on surface triangulation similar to that used in finite element surface representations. A triangulated surface is considered to be comprised of a number of rigid planar triangular wall elements connected at their vertices. Although this method is the most common method used to establish a complicated boundary model, there are still some drawbacks: 1) it is an approximate solution, the point of interaction and overlap between seed and boundary are approximate; 2) in order to raise the accuracy, the boundary needs to be composed of thousands of small triangles, which increases the calculation work.
In this work, establishing boundary model based on its computer-aided design (CAD) drawing [33], is used. The boundary model is built through the following steps: 1) the 3D CAD design drawing (Fig. 1) of the seed metering device is made by CAD software; 2) the information of graphics elements in the CAD design drawing, such as the surface of flat, the surface of pillar or cylinder, etc., which contact with seeds or gas is read and saved into the database through the secondary development of CAD software; 3) the motion and material information for graphics elements are appended and save into the database; 4) the boundary model (Fig. 2) is established based on the information in the database using self-made 3D DEM-CFD software.
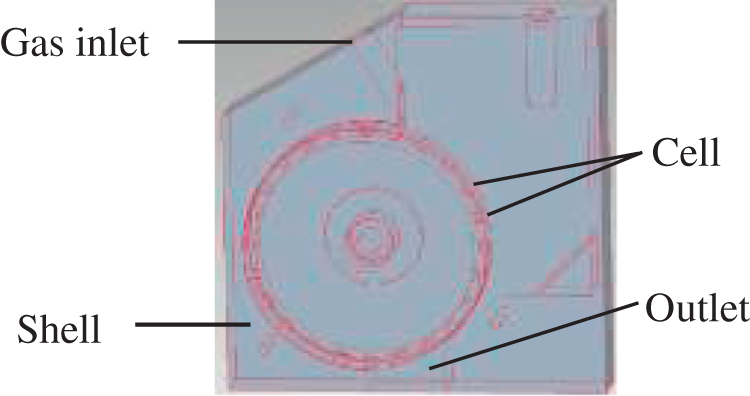
Figure 1: 3D CAD drawing
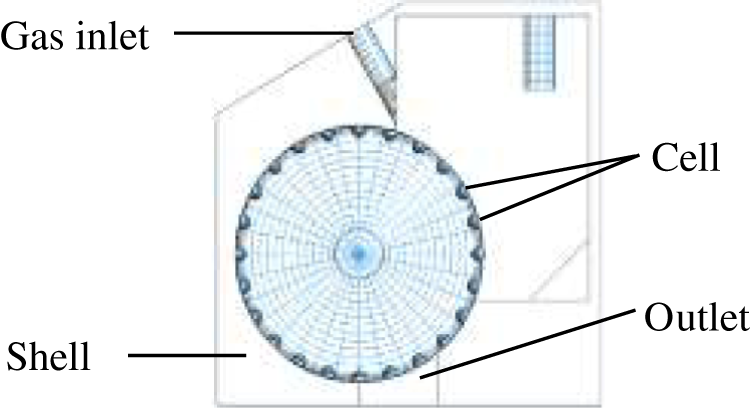
Figure 2: 3D DEM-CFD boundary model
The research on the method of establishing particle model has contributed to the development and use of the DEM simulation technique. With the development of particle models from discs and spheres, which Cundall et al. [1] adopted to arbitrary shape at present, the application field of DEM has been extended from rock-mechanics to almost every aspect of industry and agriculture. For establishing a 3D particle model, the reported methods may be classified into three types. First are those using mathematical expression to establish relatively simple spherical or ellipsoidal particle models, or using super-quadrics for more complicated particle models [34]. The filling method or multi-element method [35] is the next one. Based on the shape of the particle, the particle models are made up of a cluster of spheres with different or equal radius [36] or overlapped spheres. The third method is similar to the finite wall method, which is used to establish a boundary model. The shape of a particle is composed of thousands of small triangles [37].
The shape of soybean seed is not standard spherical or ellipsoidal. The 3D laser scanning technique and multi-element method are adopted to establish the particle model in this work. The seed is scanned using 3D laser scanner, and the particle model of the soybean seed is transmitted to the CAD software via some format (STL, etc.) firstly (Fig. 3). Through human-software interaction, the seed model is represented with overlapped spheres. Then the information of each sphere is read and saved into the database. The seed model can be established using self-made 3D DEM-CFD software based on the information in the database (Fig. 4).
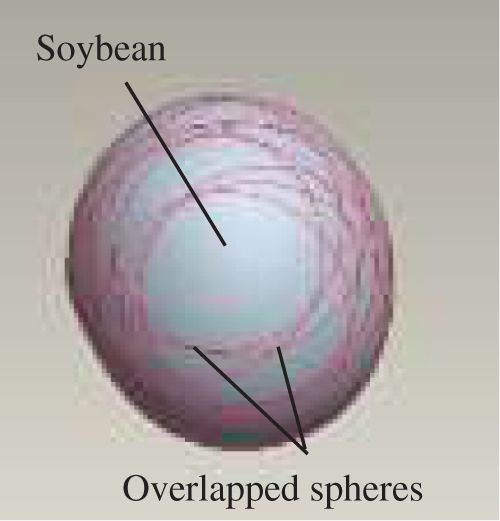
Figure 3: Solid model of seed and overlapped spheres
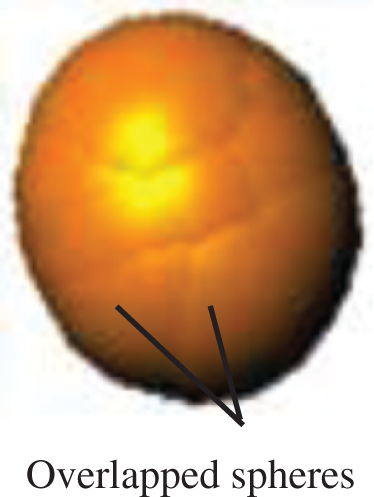
Figure 4: 3D soybean seed model
The linear-viscoelastic contact model is adopted to calculate the contact forces among seeds and between seed and seed metering device. Tabs. 1 and 2 list the calculation parameters used. The 3D sizes of seeds are obtained through experiments. The seed density
Table 1: Parameters of solid phase for simulation
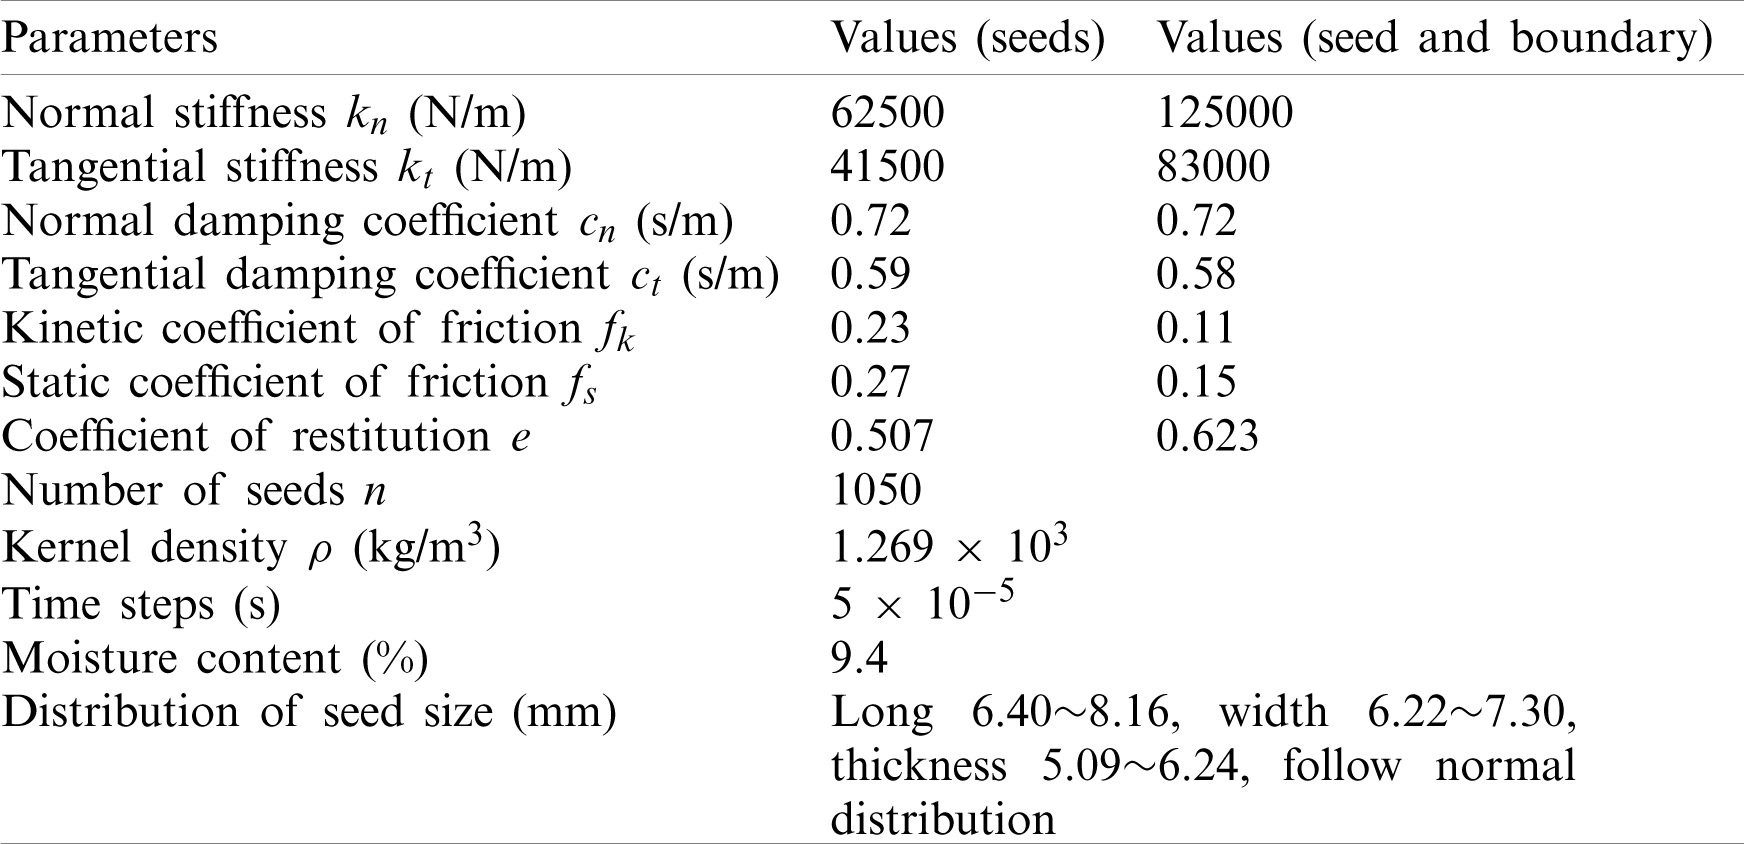
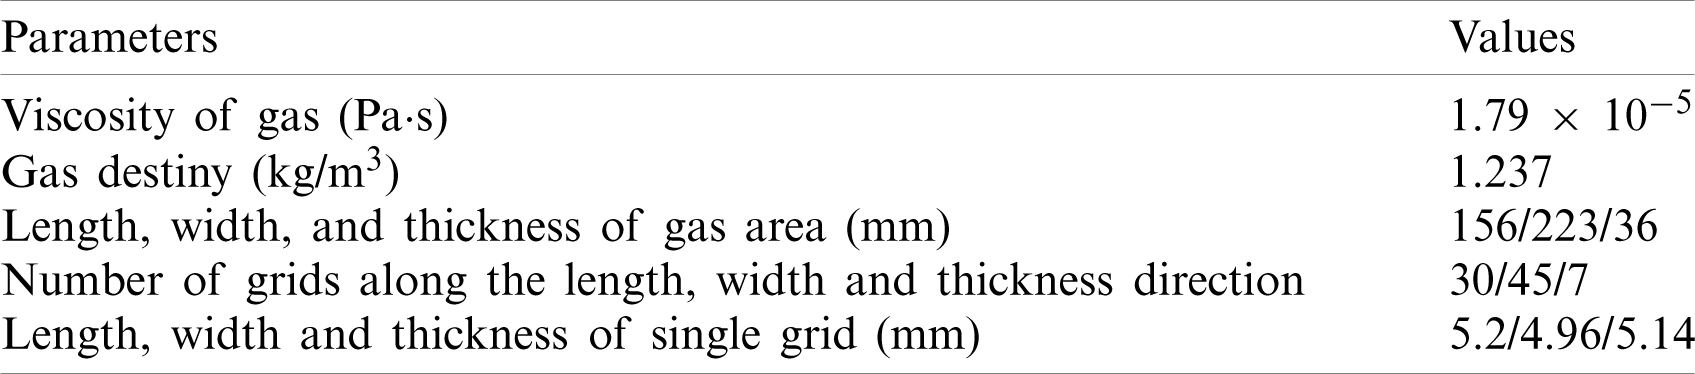
Table 2: Parameters of gas phase for simulation
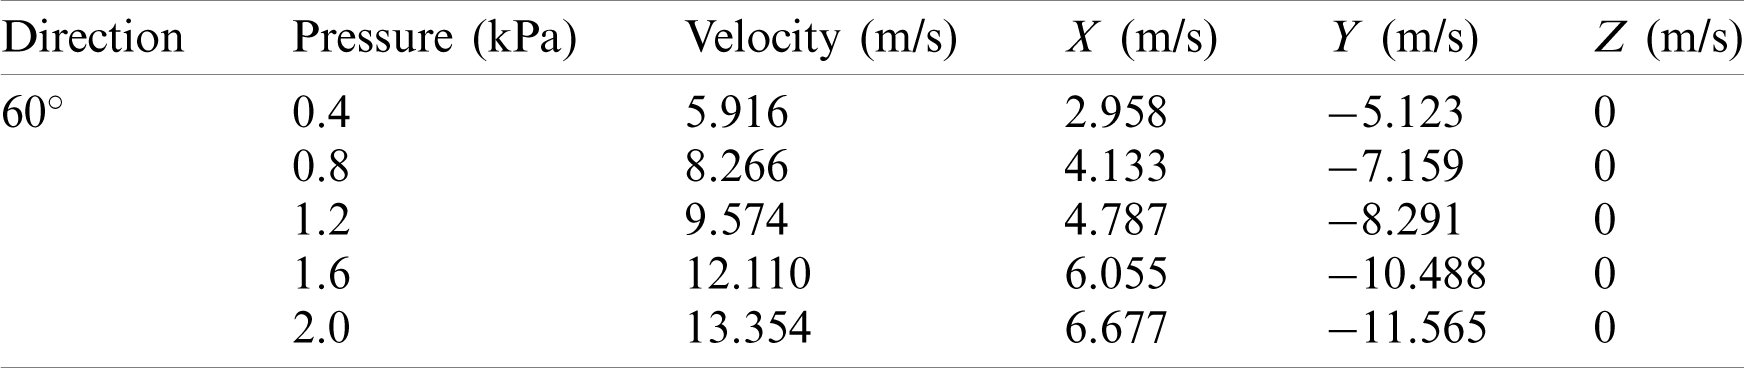
The air-blowing seed metering device is made of plexiglass in the proportion 1:1. The bench tests are conducted in similar field conditions according to the international standard ISO 7256/1: Sowing equipment–Test methods. Part 1: Single seeds drills (precision drills). The experimental results are analyzed by using the high-speed video system and blaster’s motion analysis software. The rotational speeds of the seed metering wheel are 13.99, 20.33, 26.67, 33.01, and 39.35 r/min, respectively. The pressures and velocities of gas are shown in Tab. 3.
Table 3: Pressure and velocity of gas
There are so many factors affecting the movement of the seeds and gas in the seed metering device. The movement of seeds is random sometimes. With this in mind, the results are all analyzed 6 to 10 times under respective conditions. The outliers are removed, and the mean is taken as the analysis result.
The seeding performance (single seed rate, multi-seeds rate, and empty cell rate) is one of the most important parameters to judge whether the seed metering device is good or not. Based on the international standard ISO 7256/1, the rates of single seed, multi-seeds, and empty cell in 250 times discharging seeds process are adopted for analysis. The comparison of seeding performance with different rotational speeds and air pressures between simulation (Sim.) and experiment (Exp.) are shown in Figs. 5–10.
Fig. 5 shows the effect of rotational speed on the single seed rate with different air pressure. It can be seen that the single seed rate is above 85%, which means that the performance of the seed metering device is good. Because the higher the single seed rate, the less work it takes to thin the seedlings. The single seed rate goes down with the increase of the rotational speed. This is because the lower the rotation speed, the easier it is for the seeds to enter the cell by their own gravity and gas force. The higher the speed, the more noticeable this phenomenon. Fig. 5 also shows that the single seed rate has a small fluctuation in the experiment when the speed is below 26.67 r/min. When the rotation speed is greater than 26.67 r/min, the single seed rate reduction rate increases. The simulation results are in good agreement with the experimental results. When the speed is 26.67 r/min, the error reaches the maximum value, but the maximum error is still less than 3%.
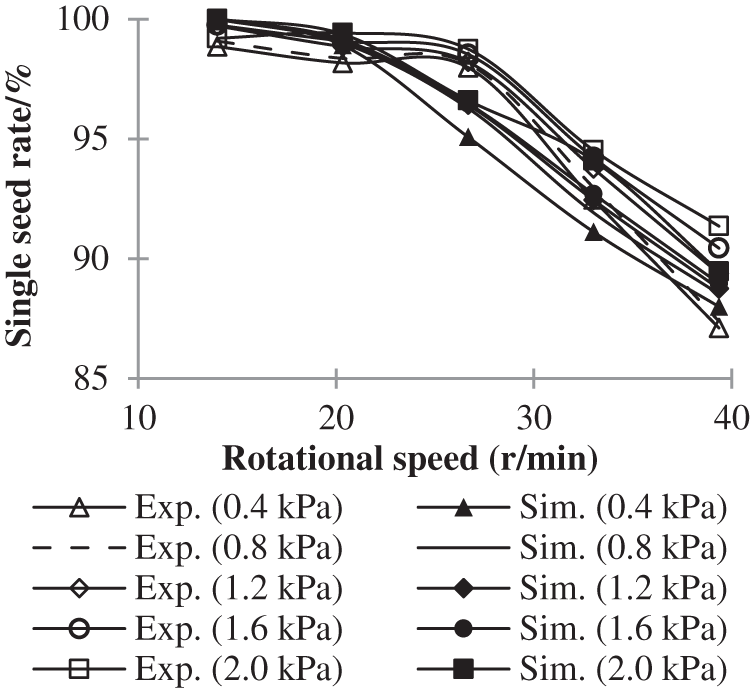
Figure 5: Effect of rotational speed on single seed rate
The effect of air pressure on the single seed rate with different rotational speeds can be seen in Fig. 6. Single seed rate rises with increasing air pressure. This is because the greater the air pressure, the greater the drag force, and the particles are easier to fill into the cell. It can also be seen that the higher the speed, the greater the rate of single seed rate increases with the increase in air pressure. This is due to the fact that the single seed rate is high enough at low speeds, and the upside is limited.
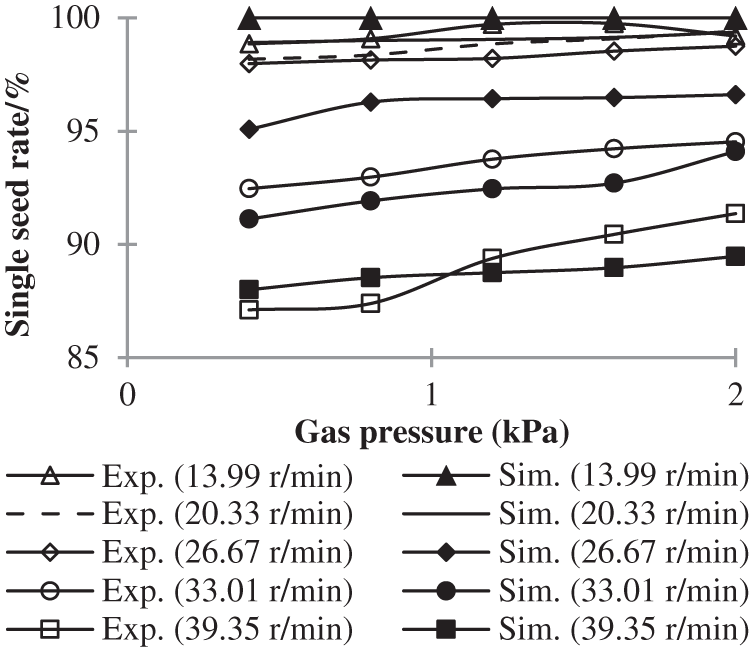
Figure 6: Effect of air pressure on single seed rate
Figs. 7 and 8 show the effect of rotational speed on empty cell rate with different air pressure, the effect of air pressure on empty cell rate with different rotational speeds, respectively. Since the multi-seeds rate of the seed metering device is below 1%, the changing trend of the empty cell rate with different rotational speed and air pressure is almost exactly the opposite of the changing trend of the single seed rate.
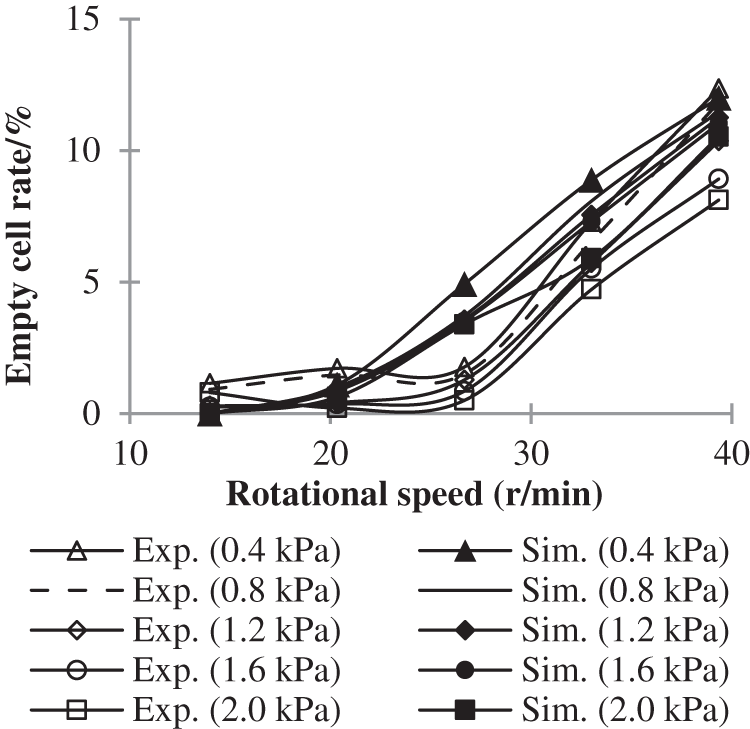
Figure 7: Effect of rotational speed on empty cell rate
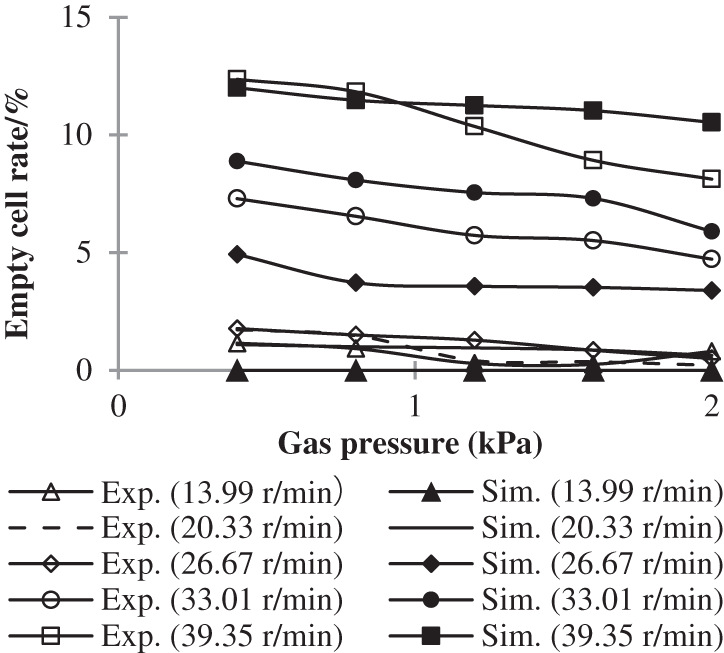
Figure 8: Effect of air pressure on empty cell rate
The effect of rotational speed on multi-seeds rate can be known from Fig. 9. It can be seen that under relatively low air pressure, 0.4 and 0.8 kPa, the multi-seeds rate increases with rotational speed increasing. As the air pressure increases to 1.2 kPa and above, the regularity becomes weaker. When the air pressure remains unchanged at 1.2 kPa, the multi-seeds rate goes up while the rotational speed increases from 13.99 to 20.33 r/min, and then the rate goes down when the speed is greater than 20.33 r/min. When the air pressure is stable at 1.6 kPa, the multi-seeds rate goes up when the rotational speed increases from 13.99 to 26.67 r/min and from 33.01 to 39.35 r/min, while the rate goes down when the speed increases from 26.67 to 33.01 r/min. When the air pressure remains unchanged at 2.0 kPa, the multi-seeds rate goes up while the rotational speed increases from 13.99 to 26.67 r/min, and then the rate goes down when the speed is greater than 26.67 r/min. The irregularity is more obvious in Fig. 10, which shows the effect of air pressure on the multi-seeds rate.
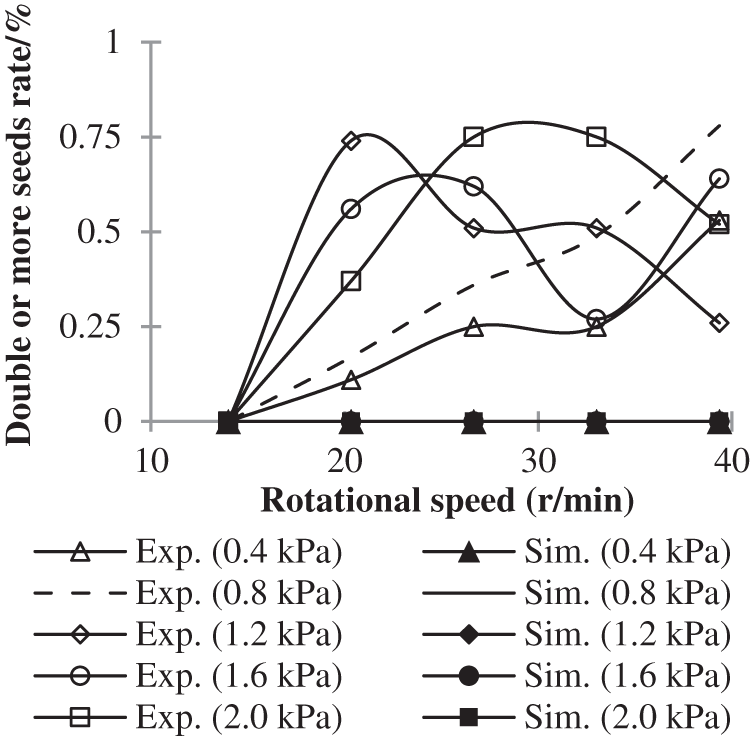
Figure 9: Effect of rotational speed on multi-seeds rate
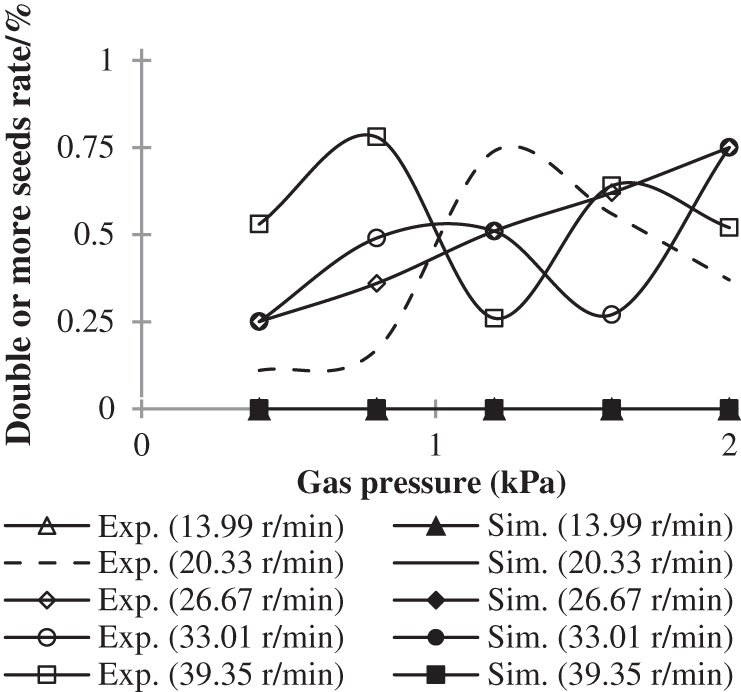
Figure 10: Effect of air pressure on multi-seeds rate
It can also be known from Figs. 9 and 10 that the multi-seeds rate is unchanged at zero in simulation. This is because that each cell of the air blowing seed metering device is designed to only hold one seed, unless the seed is deformed due to excessive squeezing force. Although it is random, there are indeed occasions when the seeds are deformed, and two or more seeds appear in one cell during the experiment. But the particle deformation has not been considered in the simulation at this stage, so this phenomenon appeared.
Fig. 11 is the gas velocity field and its partially enlarged view. It can be seen that near the cell in the area III, part of the gas enters the seeding wheel through the small holes at the bottom of the cells, promoting the seeds to enter the cells better under the drag force. That is the reason for the results shown in Fig. 6. The single seed rate goes up slightly with the air pressure increasing. In the area III, the gas trajectory is spiral. This will cause the excess seeds to be carried away by the airflow under the drag force in the area I, so as to ensure that only one seed is retained in each cell. And this is the internal mechanism that this precision seed metering device can maintain high performance.
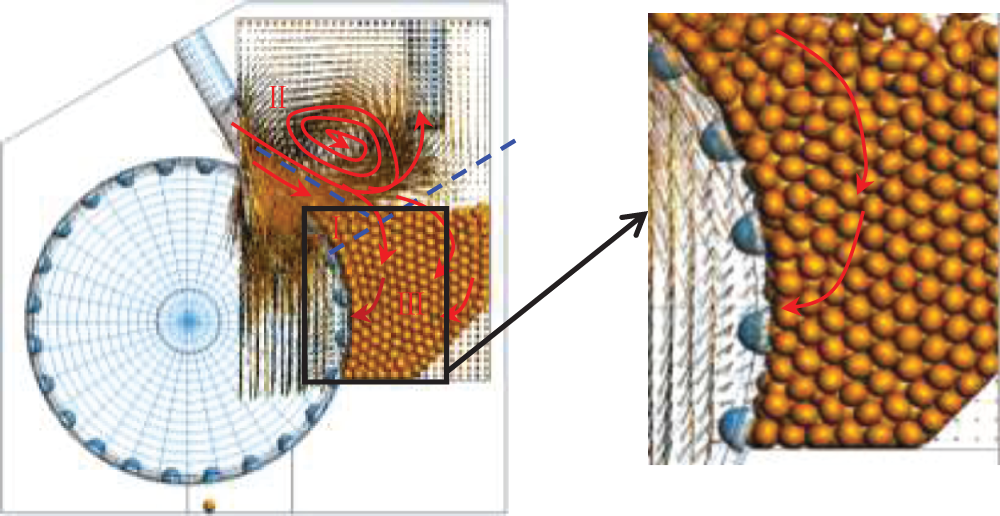
Figure 11: Gas velocity field and its partially enlarged view
The mechanism governing the gas-solid flow in the seed metering device can be better explored through the seed velocity study. To analyze the velocity of seed, when the angle between the horizontal line and the line connecting the seed center and point O is 22
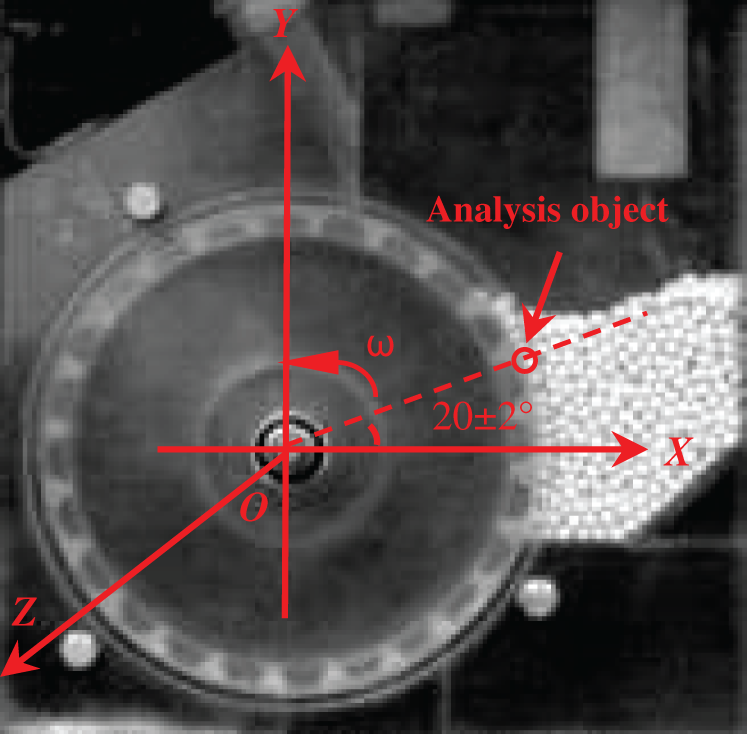
Figure 12: Analysis object in experiment result
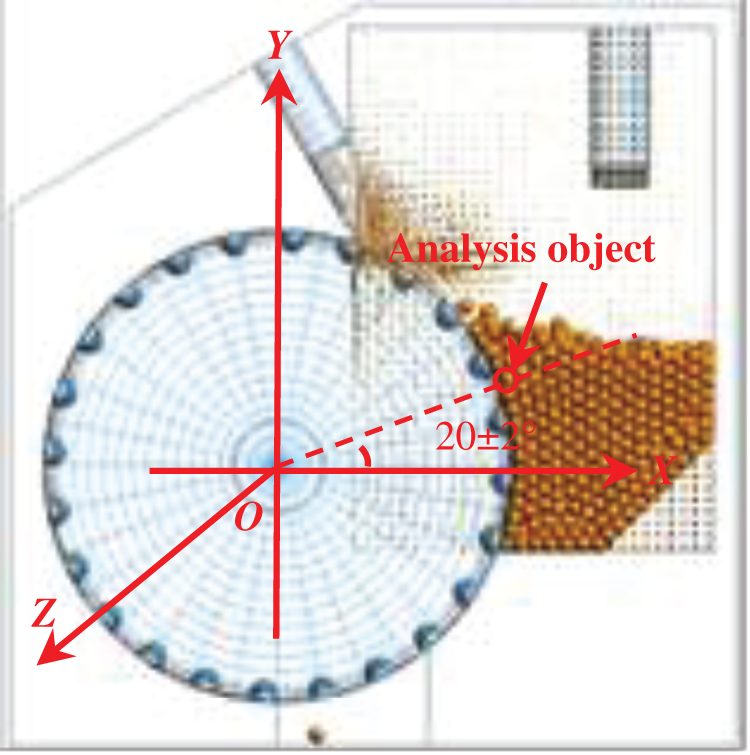
Figure 13: Analysis object in simulation result
The comparison of velocities of seeds with different rotational speeds and air pressures between simulation and experiment are shown in Figs. 14 and 15. Fig. 14 shows that the seed velocity increases with the increasing rotational speed. Fig. 15 shows that the seed velocity decreases with the increasing air pressure. The same changing trend can be seen in experimental and simulation results. The low speed of the particles facilitates the particles to enter the cells, and then conducive to increase single seed rate. This is consistent with the results shown in Figs. 5 and 6.
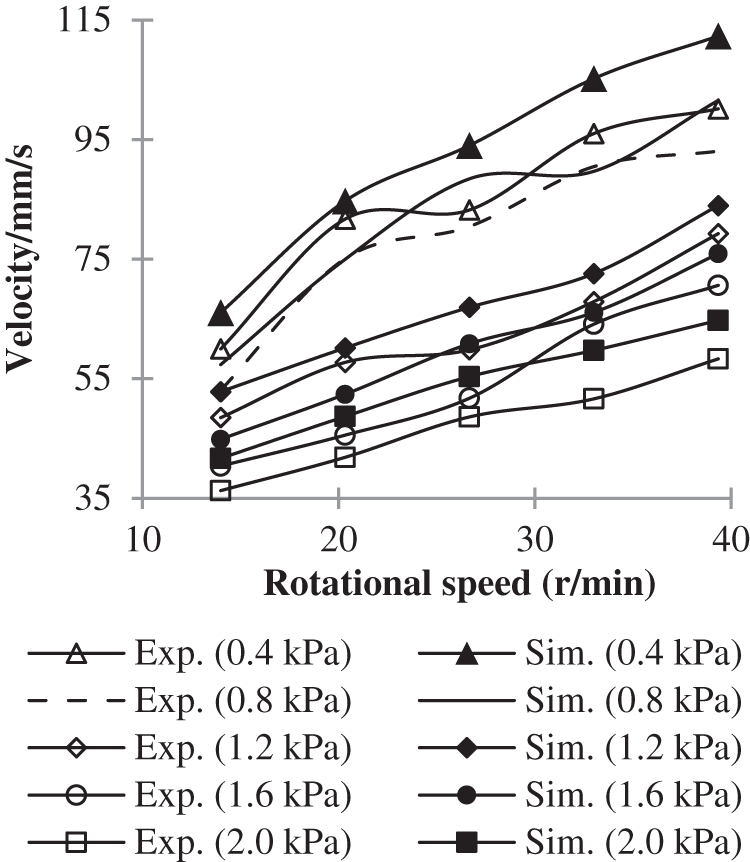
Figure 14: Effect of rotational speed on velocities of seeds
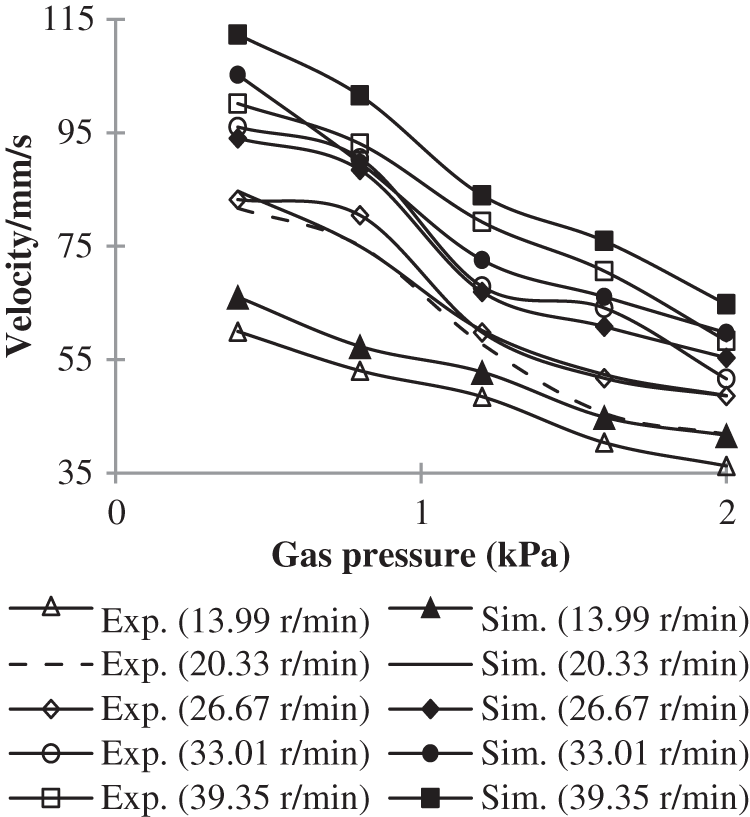
Figure 15: Effect of air pressure on velocities of seeds
The reason for the results shown in the figures is that the greater the rotation speed, the greater the seeding wheel’s friction force on the seeds, resulting in increased seed movement. And based on Fig. 11, it can also infer that the greater the air pressure, the greater the drag force, which is opposite to the direction of the seed wheel’s friction force, acting on the particles, the more stable the seeds are.
In this paper, the gas and seeds behaviors and the performance of air-blowing seed metering device have been studied at microscopic and macroscopic levels using 3D DEM-CFD. A similar agreement between simulation result and experiment result indicated that it is feasibility and validity of using this 3D DEM-CFD software to analyze the air-blowing seed metering device. Lots of useful information, from the detailed dynamic information of individual seed to the mechanisms governing gas-solid interactions, are obtained using this method. The main conclusions are summarized as follows:
(1) The simulation results are in good agreement with the experimental results. The single seed rate goes down with the increase of the rotational speed. The higher the speed, the more noticeable this phenomenon. Single seed rate rises with increasing air pressure. The higher the speed, the greater the ratio of single seed rate increases with the increase in air pressure.
(2) Under relatively low air pressure, 0.4 and 0.8 kPa, the multi-seeds rate increases with rotational speed increasing. As the air pressure increases to 1.2 kPa and above, the regularity becomes weaker.
(3) Part of the gas enters the seeding wheel through the small holes at the bottom of the cells, promoting the seeds to enter the cells better under the drag force.
(4) The seed velocity increases with the increasing rotational speed, and decreases with the increasing air pressure.
Funding Statement: The authors would like to express appreciation for the support of Australia Research Council (IH140100035), Nature Science Foundation of China (51675218), Doctor Starting Foundation of Jiangxi University of Science and Technology (JXXJBS17078), Science and Technology Project of the Education Department of Jiangxi Province (GJJ180426).
Conflicts of Interest: The authors declare that they have no conflicts of interest to report regarding the present study.
1. Cundall, P. A., Strack, O. D. L. (1979). A discrete numerical model for granular assemblies. Geotechnique, 29(1), 47–65. DOI 10.1680/geot.1979.29.1.47. [Google Scholar] [CrossRef]
2. Li, Z. Q., Yu, J. Q., Feng, Z. R., Fu, H., Zhang, L. N. et al. (2013). Simulation and performance analysis of a soybean seed metering device using discrete element method. Sensor Letters, 11(6), 1217–1222. DOI 10.1166/sl.2013.2897. [Google Scholar] [CrossRef]
3. Kuang, S. B., Li, K., Yu, A. B. (2020). CFD-DEM simulation of large-scale dilute-phase pneumatic conveying system. Industrial & Engineering Chemistry Research, 59(9), 4150–4160. DOI 10.1021/acs.iecr.9b03008. [Google Scholar] [CrossRef]
4. Kuang, S. B., Zhou, M. M., Yu, A. B. (2020). CFD-DEM modelling and simulation of pneumatic conveying–A review. Powder Technology, 365, 186–207. DOI 10.1016/j.powtec.2019.02.011. [Google Scholar] [CrossRef]
5. Lu, Z., Negi, S. C., Jofriet, J. C. (1997). A numerical model for flow of granular materials in silos, Part 1: Model development. Journal of Agricultural Engineering Research, 68(3), 223–229. DOI 10.1006/jaer.1997.0196. [Google Scholar] [CrossRef]
6. Zhang, X., Vu-Quoc, L. (2000). Simulation of chute flow of soybeans using an improved tangential force displacement model. Mechanics of Materials, 32(2), 115–129. DOI 10.1016/S0167-6636(99)00043-5. [Google Scholar] [CrossRef]
7. Tanaka, H., Momozu, M., Oida, A., Yamazaki, M. (2000). Simulation of soil deformation and resistance at bar penetration by the distinct element method. Journal of Terramechanics, 37(1), 41–56. DOI 10.1016/S0022-4898(99)00013-0. [Google Scholar] [CrossRef]
8. Sakaguchi, E., Suzuki, M., Favier, J. F., Kawakami, S. (2001). PH—Postharvest Technology: Numerical simulation of the shaking separation of paddy and brown rice using the discrete element method. Journal of Agricultural Engineering Research, 79(3), 307–315. DOI 10.1006/jaer.2001.0706. [Google Scholar] [CrossRef]
9. Momozu, M., Oida, A., Yamazaki, M., Koolen, A. J. (2002). Simulation of a soil loosening process by means of the modified distinct element method. Journal of Terramechanics, 39(4), 207–220. DOI 10.1016/S0022-4898(03)00011-9. [Google Scholar] [CrossRef]
10. Zhou, H. B., Chen, Y., Sadek, M. A. (2014). Modelling of soil-seed contact using the discrete element method (DEM). Biosystems Engineering, 121(1), 56–66. DOI 10.1016/j.biosystemseng.2014.02.006. [Google Scholar] [CrossRef]
11. Ghodki, B. M., Goswami, T. K. (2017). DEM simulation of flow of black pepper seeds in cryogenic grinding system. Journal of Food Engineering, 196, 36–51. DOI 10.1016/j.jfoodeng.2016.09.026. [Google Scholar] [CrossRef]
12. Li, Z. Q., Yu, J. Q., Zhang, W. L., Fu, H. (2011). Simulation analysis of working process and performance of inside-filling seed metering device by discrete element method. Transactions of the Chinese Society of Agricultural Engineering, 27(11), 32–36. DOI 10.3969/j.issn.1002-6819.2011.11.006. [Google Scholar] [CrossRef]
13. Li, Z. Q., Yu, J. Q., Zhang, P., Xiong, D. L. (2019). Application of non-spherical DEM numerical simulation in drilling machinery. Journal of Jiangxi University of Science and Technology, 40(5), 72–79. DOI 10.13265/j.cnki.jxlgdxxb.2019.05.011. [Google Scholar] [CrossRef]
14. Xu, B. H., Yu, A. B. (1997). Numerical simulation of the gas–solid flow in a fluidized bed by combining discrete particle method with computational fluid dynamics. Chemical Engineering Science, 52(16), 2785–2809. DOI 10.1016/S0009-2509(97)00081-X. [Google Scholar] [CrossRef]
15. van Willigen, F. K., Demirbas, B., Deen, N. G., Kuipers, J. A. M., van Ommen, J. R. (2008). Discrete particle simulations of an electric-field enhanced fluidized bed. Powder Technology, 183(2), 196–206. DOI 10.1016/j.powtec.2007.07.022. [Google Scholar] [CrossRef]
16. Limtrakul, S., Rotjanavijit, W., Vatanatham, T. (2007). Lagrangian modelling and simulation of effect of vibration on cohesive particle movement in a fluidized bed. Chemical Engineering Science, 62(1–2), 232–245. DOI 10.1016/j.ces.2006.08.020. [Google Scholar] [CrossRef]
17. Tsuji, T., Yabumoto, K., Tanaka, T. (2008). Spontaneous structures in three-dimensional bubbling gas-fluidized bed by parallel DEM-CFD coupling simulation. Powder Technology, 184(2), 132–140. DOI 10.1016/j.powtec.2007.11.042. [Google Scholar] [CrossRef]
18. Liu, D. Y., Chen, X. P., Zhou, W., Zhao, C. S. (2011). Simulation of char and propane combustion in a fluidized bed by extending DEM-CFD approach. Proceedings of the Combustion Institute, 33(2), 2701–2708. DOI 10.1016/j.proci.2010.06.070. [Google Scholar] [CrossRef]
19. Takeuchi, H., Nakamura, H., Iwasaki, T. (2012). Numerical modeling of fluid and particle behaviors in impact pulverizer. Powder Technology, 217, 148–156. DOI 10.1016/j.powtec.2011.10.021. [Google Scholar] [CrossRef]
20. Chu, K. W., Yu, A. B. (2008). Numerical simulation of complex particle-fluid flows. Powder Technology, 179(3), 104–114. DOI 10.1016/j.powtec.2007.06.017. [Google Scholar] [CrossRef]
21. Kuang, S. B., Chu, K. W., Yu, A. B., Zou, Z. S., Feng, Y. Q. (2008). Computational investigation of horizontal slug flow in pneumatic conveying. Industrial & Engineering Chemistry Research, 47(2), 470–480. DOI 10.1021/ie070991q. [Google Scholar] [CrossRef]
22. Li, Z. Q., Chu, K. W., Pan, R. H., Yu, A. B., Yang, J. Q. (2019). Computational study of gas-solid flow in a horizontal stepped pipeline. Mathematical Problems in Engineering, 2019, 1–15. DOI 10.1155/2019/2545347. [Google Scholar] [CrossRef]
23. Dong, X. F., Yu, A. B., Yagi, J. I., Zulli, P. (2007). Modelling of multiphase flow in a blast furnace: Recent developments and future work. ISIJ International, l47(11), 1553–1570. DOI 10.2355/isijinternational.47.1553. [Google Scholar] [CrossRef]
24. Zhou, Z. Y., Zhu, H. P., Wright, B., Yu, A. B., Zulli, P. (2011). Gas–solid flow in an iron making blast furnace-II: Discrete particle simulation. Powder Technology, 208(1), 72–85. DOI 10.1016/j.powtec.2010.12.005. [Google Scholar] [CrossRef]
25. Kuang, S. B., Li, Z. Y., Yu, A. B. (2018). Review on modelling and simulation of blast furnace. Steel Research International, 89(170071), 1–25. DOI 10.1002/srin.201700071. [Google Scholar] [CrossRef]
26. Chu, K. W., Wang, B., Xu, D. L., Chen, Y. X., Yu, A. B. (2011). CFD-DEM simulation of the gas-solid flow in a cyclone separator. Chemical Engineering Science, 66(5), 834–847. DOI 10.1016/j.ces.2010.11.026. [Google Scholar] [CrossRef]
27. Li, J. T., Mason, D. J. (2002). Application of the discrete element modelling in air drying of particulate solids. Dry Technology, 20(2), 255–282. DOI 10.1081/DRT-120002542. [Google Scholar] [CrossRef]
28. Tsuji, Y., Tanaka, T., Ishida, T. (1992). Lagrangian numerical-simulation of plug flow of cohesionless particles in a horizontal pipe. Powder Technology, 71(3), 239–250. DOI 10.1016/0032-5910(92)88030-L. [Google Scholar] [CrossRef]
29. Bertrand, F., Leclaire, L. A., Levecque, G. (2005). DEM-based models for the mixing of granular materials. Chemical Engineering Science, 60(8–9), 2517–2531. DOI 10.1016/j.ces.2004.11.048. [Google Scholar] [CrossRef]
30. Yamane, K., Nakagawa, M., Altobelli, S. A., Tanaka, T., Tsuji, Y. (1998). Steady particulate flows in a horizontal rotating cylinder. Physics of Fluids, 10(6), 1419–1427. DOI 10.1063/1.869858. [Google Scholar] [CrossRef]
31. Hirshfeld, D., Radzyner, Y., Rapaport, D. C. (1997). Molecular dynamics studies of granular flow through an aperture. Physical Review E, 56(4), 4404–4415. DOI 10.1103/PhysRevE.56.4404. [Google Scholar] [CrossRef]
32. Kremmer, M., Favier, J. F. (2001). A method for representing boundaries in discrete element modelling-part I: Geometry and contact detection. International Journal for Numerical Methods in Engineering, 51(12), 1407–1421. DOI 10.1002/nme.184. [Google Scholar] [CrossRef]
33. Fu, H., Dong, J. N., Yu, J. Q. (2005). Method based on CAD model for DEM boundary modeling. Journal of Jilin University (Engineering and Technology Edition), 35, 626–631. DOI 10.3969/j.issn.1671-5497.2005.06.013. [Google Scholar] [CrossRef]
34. Williams, J. R., Pentland, A. P. (1992). Surperquadrcs and model dynamics for discrete elements in interactive design. Engineering Computations, 9(2), 115–127. DOI 10.1108/eb023852. [Google Scholar] [CrossRef]
35. Favier, J. F., Abbaspour-Fard, M. H., Kremmer, M., Raji, A. O. (1999). Shape representation of axi-symmetrical, non-spherical particles in discrete element simulation using multi-element model particles. Engineering Computations, 16(4), 467–480. DOI 10.1108/02644409910271894. [Google Scholar] [CrossRef]
36. Wang, L. B., Park, J. Y., Fu, Y. R. (2007). Representation of real particles for DEM simulation using X-ray tomography. Construction & Building Materials, 21(2), 338–346. DOI 10.1016/j.conbuildmat.2005.08.013. [Google Scholar] [CrossRef]
37. Latham, J. P., Munjiza, A., Garcia, X., Xiang, J. S., Guises, R. (2008). Three-dimensional particle shape acquisition and use of shape library for DEM and FEM/DEM simulation. Minerals Engineering, 21(11), 797–805. DOI 10.1016/j.mineng.2008.05.015. [Google Scholar] [CrossRef]
 | This work is licensed under a Creative Commons Attribution 4.0 International License, which permits unrestricted use, distribution, and reproduction in any medium, provided the original work is properly cited. |