Engineering & Sciences
| Computer Modeling in Engineering & Sciences |
DOI: 10.32604/cmes.2021.014727
ARTICLE
Fatigue Crack Propagation Analysis of Orthotropic Steel Bridge with Crack Tip Elastoplastic Consideration
1Jiangsu Key Laboratory of Engineering Mechanics, Southeast University, Nanjing, 211189, China
2China Railway Major Bridge Reconnaissance and Design Institute Co., Ltd., Wuhan, 430056, China
*Corresponding Author: Ying Wang. Email: civil_wangying@seu.edu.cn
Received: 24 October 2020; Accepted: 08 February 2021
Abstract: Due to the complex structure and dense weld of the orthotropic steel bridge deck (OSBD), fatigue cracks are prone to occur in the typical welding details. Welding residual stress (WRS) will cause a plastic zone at the crack tip. In this paper, an elastoplastic constitutive model based on the Chaboche kinematic hardening model was introduced, and the extended finite element method (XFEM) was used to study the influence of material elastoplasticity and crack tip plastic zone on the law of fatigue crack propagation. By judging the stress state of the residual stress field at the crack tip and selecting different crack propagation rate models to investigate the crack propagation law when plastic deformation was considered, the propagation path and propagation rate of fatigue crack of the OSBD were obtained. The results show that, whether the residual stress field is considered or not, the plastic deformation at the crack tip will not cause the obvious closure of the fatigue crack at the U-rib toe during the crack propagation process, but will significantly affect the crack propagation path. When material plasticity is considered, the propagation angle of fatigue crack at the U-rib toe basically remains unchanged along the short-axis direction of the initial crack, but is going up along the long-axis direction, and the crack tip plastic zone inhibits the propagation of the crack tip on one side. Compared with linear elastic materials, the crack propagation law considering material plasticity is more consistent with that in actual bridge engineering. In terms of the propagation rate, if the residual stress field is not considered, the fatigue crack propagation rate at U-rib toe with plasticity considered is slightly higher than that without plasticity considered, because plastic deformation will affect the amplitude of energy release rate. When considering the WRS field, the fatigue crack propagation rate at U-rib toe is increased due to the combined actions of plastic deformation and stress ratio R.
Keywords: Extended finite element; fatigue crack propagation; orthotropic steel bridge deck; welding residual stress; plastic deformation
Due to its characteristics of light deadweight and high strength-to-weight ratio, orthotropic steel bridge deck (OSBD) have been widely used in large and medium span bridges [1,2]. Due to the complex structure and dense weld, fatigue cracks are easy to occur in typical welding details. With the increase of traffic flow and vehicle weight year by year, coupled with the influence of welding residual stress (WRS) in welding details, the cracks continue to propagate until the bridge deck breaks. At present, finite element method, crack propagation software (NASGRO, AFGROW, ABAQUS, etc.) and energy release rate theory are mainly used for numerical simulation of fatigue crack and crack propagation of bridge deck [3–9]. In view of the influence of WRS on the fatigue crack propagation of OSBD, Wang et al. [10] introduced the WRS field into the segment model of steel bridge deck, and based on the extended finite element method (XFEM), studied the cracking mechanism and propagation law of typical fatigue crack of OSBD under the coupling effect of vehicle load and WRS. Zhou et al. [11] established the finite element model of fatigue crack at the butt weld of top deck, longitudinal rib, transverse diaphragm, and obtained the stress intensity factor of the crack front by combining the interaction integral and finite element method.
The results show that the stress intensity factor KI of open type crack (type I crack) is equivalent to the equivalent stress intensity factor Keff in the propagation process of fatigue crack in longitudinal rib butt weld, and the type I (open type) cracking mode is dominant in the process of fatigue crack propagation. KI has been in the trend of increasing. Since stress intensity factor is the main parameter of crack propagation rate, fatigue crack rate increases gradually with crack propagation. The above researches rarely consider the plastic restraint effect or crack closure effect in the crack tip plastic region during crack propagation. In fact, when considering the WRS at the weld, the stress in the weld zone of the OSBD may reach the yield strength of the material, indicating that the material has entered plasticity at this time. Even if the WRS does not exceed the yield strength, the material near the crack will inevitably enter into plasticity with the fatigue crack propagation at the toe or root. Qu et al. [12] used discontinuous Galerkin XFEM to analyze the crack propagation hysteresis in bridge structure under overload condition, established a Q345Q slab model for bridge structural, and studied the influence of the plastic zone of the mode I crack on the crack propagation, but the research object is limited to structural steel, and the influence of the plastic zone of the typical fatigue crack on the crack propagation law of the whole bridge structure is not studied.
Therefore, for the whole structure of the bridge, this paper focuses on the change of fatigue crack propagation law caused by WRS field and crack tip plastic zone. Considering that welding toe of U-rib at the connection of U-rib and diaphragm was significantly affected by WRS, the fatigue crack propagation law of U-rib-toe in the whole bridge structure was mainly studied in this paper. To this end, a Multiscale finite element model of long-span bridge is firstly established, which includes the cables, bridge towers and equivalent steel box girder models at non-critical locations with the characteristic length of 100–102 m, refined steel box girder model including the top deck, bottom deck, inclined web, diaphragm and U-shaped stiffener with the characteristic length of 10−2–100 m, and the weld model and the fatigue crack models with the characteristic length of less than 10−3 m. For finite element models with different characteristic lengths, different physical equations are used to describe them. Linear elasticity theory is used to describe the whole structure model and the local component model. For the welding area, the elastoplastic theory is adopted. Fracture mechanics and XFEM are used to describe the local crack model. Then, the residual stress field was simulated based on commercial software ABAQUS. Finally, the XFEM is used to study the propagation law of fatigue crack at U-rib toe under the action of vehicle load alone and the residual stress field and vehicle load together when the material near the crack is plastic.
2 Fatigue Crack Propagation Theory
2.1 Interaction Integral Calculation of WRS Intensity Factor
The direct cyclic loading method in ABAQUS software cannot directly output the energy release rate at the beginning of each cycle, that is, when the cyclic load is zero, the energy release rate is not available. When the influence of WRS on fatigue crack propagation is considered, there is an initial WRS in the structure. However, the fatigue load applied to the bridge deck at this time is 0, so ABAQUS cannot output the energy release rate generated by initial WRS. In order to calculate the energy release rate generated by WRS, the interaction integral theory is presented here, in which the stress intensity factor at the beginning and end of each loading cycle is calculated so as to further obtain the energy release rate. The energy release rate induced by fatigue crack propagation can be obtained by subtracted the energy release rate caused by WRS from the energy release rate caused by fatigue load peak. Interaction integral is a new calculation method developed on the basis of J integral, which not only inherits the advantages of simple and high precision of J integral calculation, but also solves the deficiency that J integral cannot directly obtain the crack tip stress intensity factor of composite crack. The basic assumption is that the cracked member bears two kinds of loads at the same time, namely the real load and the auxiliary load. The mechanical field at the crack tip is real (
The location of the crack tip should be determined first when the interaction integral is used to solve the stress intensity factor. In the XFEM, the position of the crack surface is traced and defined by the level set function. The normal horizontal set function represents the vertical distance between the element node and the crack face. The extended finite element module in ABAQUS software can directly output the value of the node’s normal level set function, but cannot directly output the coordinates of the crack surface. Instead, the coordinates of the crack tip in the process of crack propagation can only be calculated indirectly according to the node’s normal level set function, and then the location of the crack surface can be determined.
For OSBD, arbitrary hexahedral eight-node elements are adopted in this paper, as shown in Fig. 1. The edges of the element are all straight lines. Normal level set function
where, P is the intersection coordinates of crack surface and cell edge,
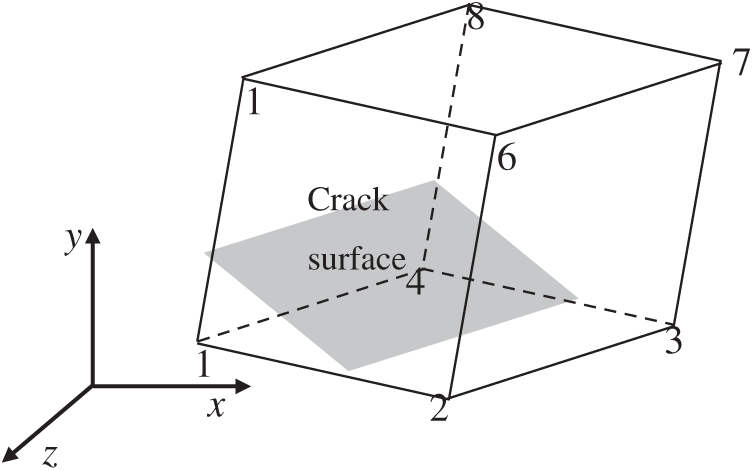
Figure 1: Spatial location diagram of three-dimensional element and crack face
After the coordinate value of the crack tip is obtained, J integral is calculated by selecting the integral region of the crack tip. For the 3D model, the integral region of the J integral is shown in Fig. 2. In the inner boundary of volume V, the weight function q = 1. The outer boundary of the volume domain, the weight function q = 0. The formula of J integral [14] is:
where
where Cijkl is the stiffness matrix.
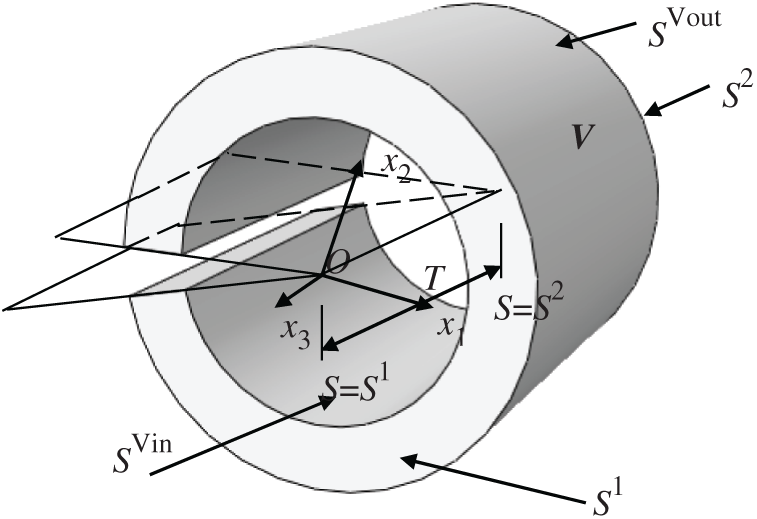
Figure 2: Three-dimensional J integral region
In fracture mechanics theory, the relation between J integral and stress intensity factor is shown in Eq. (5):
where E′ is elastic modulus E in the plane stress state, and it is
Based on the J integral, interaction integral I introduces the mechanical field at the crack tip under the separate action of auxiliary load, namely the auxiliary field
where
The auxiliary field of the crack tip is obtained according to Westergaard stress function, and its displacement field is shown in Eq. (7):
Among them:
According to Eq. (6), the interaction integral expression can be written:
According to Eq. (5) of J integral and stress intensity factor, it can be seen that:
The relationship between interaction integral I and stress intensity factor is shown in Eq. (11):
Stress intensity factor of the real displacement field can be got by controlling
The discrete integral formula for calculating the J integral in the integral volume V element by finite element method is shown in Eq. (13):
where, V is the integral volume region, and elems is the number of all elements in the integral volume V. P is integral point, gps is the number of unit integral points. For a hexahedral eight-nodal element, the integral form is
According to Eq. (13), the corresponding J integral is solved by combining the real displacement field, virtual displacement field and the sum of real and virtual displacement fields. The interaction integral I and the corresponding stress intensity factor are obtained according to Eq. (12). The specific calculation flow chart is shown in Fig. 3. First, the element number, node number, node coordinates, normal level set function and node displacement in the integral volume V region of the crack tip are extracted from the results file of extended finite element analysis. The coordinates of the intersection point between the crack surface and the edge of the element are obtained by linear interpolation, and the crack tip position and the crack surface angle are determined. In order to get the exact value of the superposition of virtual displacement and real displacement, the coordinates of the nodes and their displacements were converted into coordinates, in the converted coordinate system, x axis was parallel to the crack surface and perpendicular to the crack front, y axis was perpendicular to the crack surface, and z axis was parallel to the crack surface and the crack front. The virtual displacement of the node was determined according to the displacement field of the crack tip obtained by Westergaard stress function, the virtual displacement field U2 had three cases, when
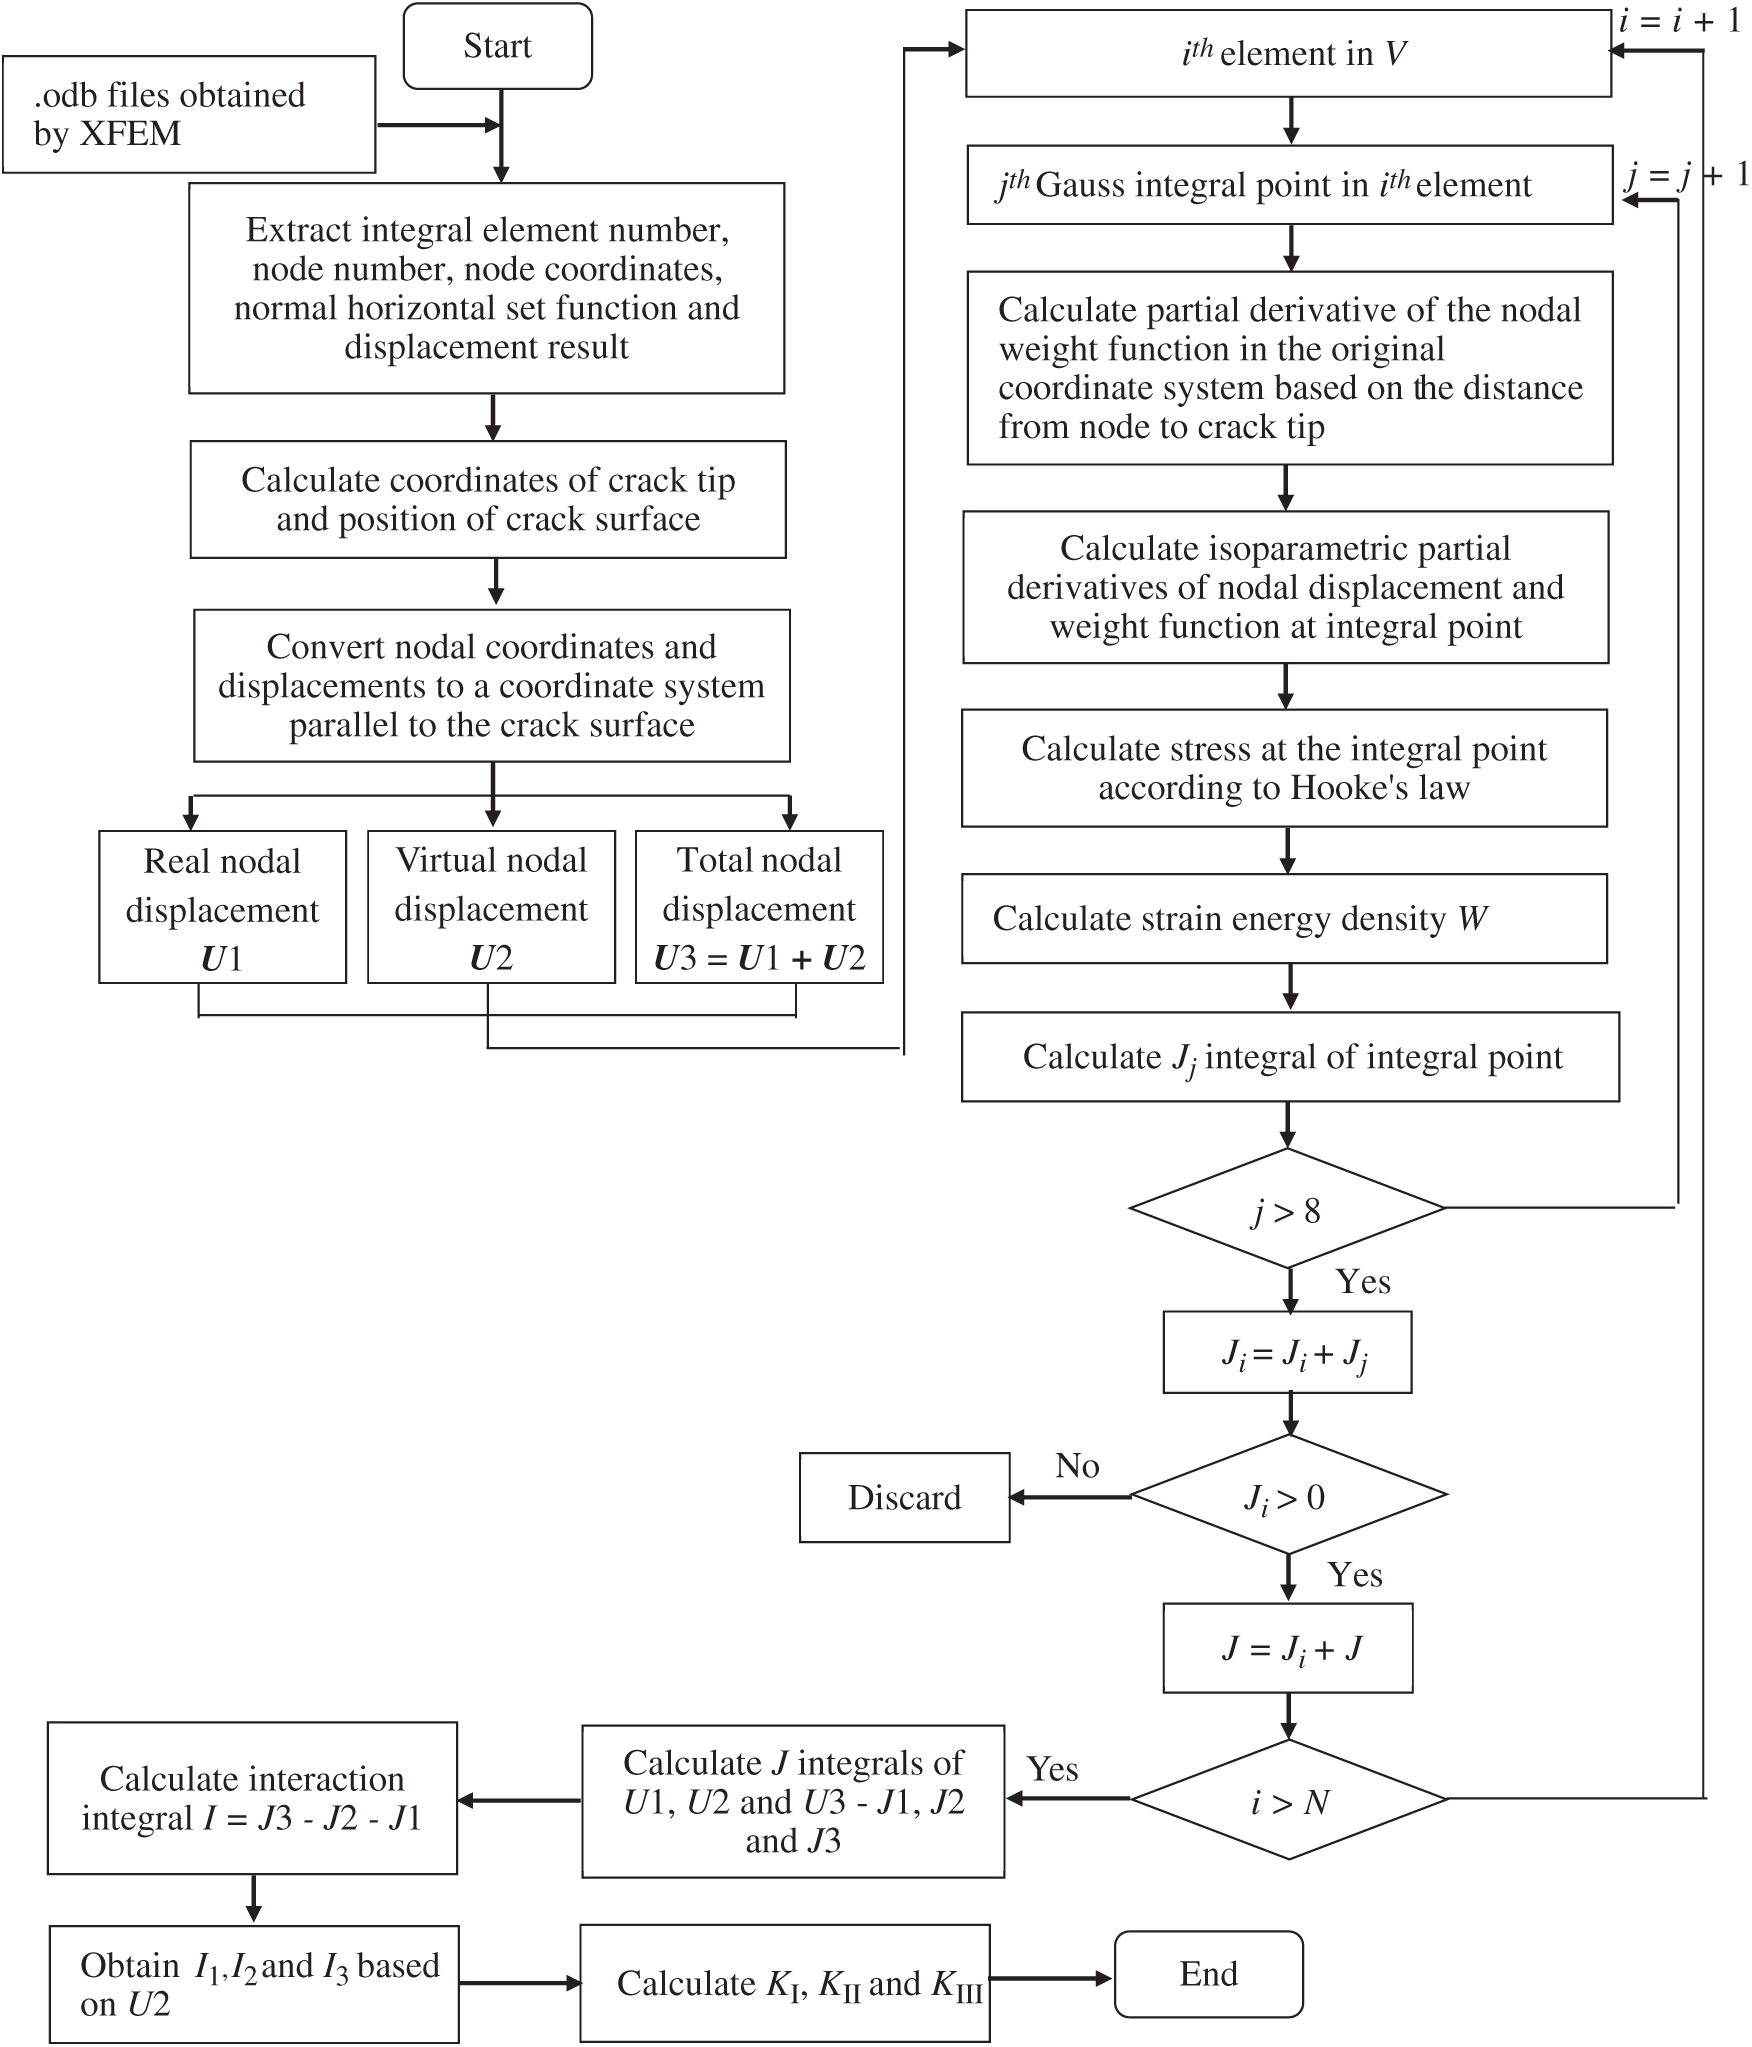
Figure 3: Implementation process of interaction integral
To be sure, the singularity of the crack tip cannot be simulated in this paper, which is due to the limitations of the extended finite element module in the commercial software ABAQUS. The extended finite element method in ABAQUS omits the third term of the extended finite element formula which can simulate the crack tip singularity, so the final calculation result does not simulate the crack tip singularity in theory.
2.2 Fatigue Crack Propagation Analysis Theory
In the commercial software ABAQUS, fatigue crack initiation can be determined by the increase of energy release rate
where, c1 and c2 are material constants, and N is the number of cycles. When the above two crack propagation conditions are met, and the maximum energy release rate at the crack tip Gmax is less than the upper limit Gpl, Gpl is close to the steel fracture toughness GC, then the fatigue crack can propagate under the current cyclic load, and the propagation law can be simulated by the fatigue crack propagation rate model.
Under the influence of WRS, the fatigue crack propagation law can be obtained by Walker [15] formula, whose expression is:
where N is the number of cycles; a is the length of the crack; R is the stress ratio, Kmax is the maximum stress intensity factor; Kmin is the minimum stress intensity factor; Kr is the stress intensity factor under the influence of WRS, C, n and m are material constants, which can be obtained from test or specification. The C and m selected in this paper refer to the Japanese JSSC specification [16], C = 2 * 10−12, m = 2.75. In the fatigue crack propagation analysis of bridge steel,
The influence of stress ratio R on fatigue crack life is reflected in the Walker formula, but the influence of crack tip plasticity on fatigue crack propagation is not considered. In 1971, Elber [18] found through tests that the plastic deformation of crack tip would lead to the closure of crack surface, which hindered the action of external load on crack surface. The crack would continue to expand only after the crack face was fully opened. Aiming at the crack closure phenomenon, Elber proposed to use the stress intensity factor Kop corresponding to the crack opening stress to reflect the crack closure effect, taking the effective stress intensity factor
The material constants C and m in the formula can take the corresponding values of Paris formula and Walker formula.
There are many methods for the solution of crack opening stress intensity factor Kop and opening stress
(1) Nodal displacement method [19] determines the opening stress by monitoring the displacement state of the first or second nodal point of the crack tip. In the loading stage, when the monitored nodal displacement becomes positive, the corresponding nodal stress is the opening stress; (2) Wu et al. [20] defined crack opening stress as the far-field stress at the crack tip node perpendicular to the crack plane that changes from compressive stress to tensile stress. (3) Matos et al. [21] believes that the WRS intensity factor generated in the plastic zone of crack tip is the stress intensity factor that needs to be overcome by crack opening stress. Therefore, the relationship between the WRS intensity factor and crack opening stress intensity factor is shown in Eq. (18):
where, Kres is the WRS intensity factor, which can be solved by the interaction integration method.
When considering the WRS field of components, especially the welding residual compressive stress at the crack tip, the fatigue crack propagation life can be analyzed based on the Elber crack closure theory, Because Elber’s theory that the plastic deformation of the crack tip generates the residual compressive stress and the crack closure is essentially the same as the external compressive WRS field causes the crack closure [22], the subtle difference is that the closure of the crack in the WRS field is the result of the combined effect of the welding residual compressive stress and the crack tip plastic zone. At this time, the crack opening stress is the sum of the external welding residual compressive stress field and the residual compressive stress generated by the plastic zone at the crack tip.
In the finite element software ABAQUS, the energy release rate is taken as the parameter to analysis the fatigue crack propagation. In the fatigue crack propagation rate model of Eqs. (17) and (18), the increment of stress intensity factor is replaced by the increment of energy release rate. The corresponding material constants C and m need to be transformed accordingly, the transformation relationship is shown in Eq. (19):
where C′ and m′ are material constants when the energy release rate is taken as the parameter of the fatigue crack propagation model.
In this paper, after the stress intensity factor of the crack tip is obtained based on the interaction integration method, the WRS state (tensile stress or compressive stress) of the crack tip is judged according to the positive and negative values of the stress intensity factor, then, different models of crack propagation rate are selected to calculate the number of load cycles, where the number of load cycles is N in Paris formula and described by the number of load cycles in ABAQUS. If the WRS field at the crack tip is the tensile stress state, the load cycle N is calculated based on Walker formula. If the WRS field at the crack tip is the compressive stress state or the residual compressive stress caused by plastic deformation, then the crack closure effect is considered and the number of load cycles N is calculated according to Elber formula. In this paper, the Chaboche model is selected as the constitutive model of elastoplastic materials, which can reflect the nonlinear hardening behavior of materials under cyclic loading. The correlation parameters of the back stress components in the nonlinear hardening criterion are obtained, as shown in Tab. 1 [23]. Mises yield condition is adopted.
Table 1: Parameters of Chaboche model

3 Description of Finite Element Model
3.1 Finite Element Model to Simulate Welding Process
There is no universal method to analyze the influence of WRS on the mechanical properties of welded structures [24,25]. Considering that ABAQUS software contains the interface to introduce the initial stress, in this paper, the calculated WRS is applied to the established weld model of OSBD in the form of initial stress. Then the vehicle load is applied on the OSBD to realize the superposition of the stress field corresponding to the vehicle load and the WRS field.
Specifically, the bilinear isotropic hardening model and the thermal elastic-plastic finite element model of typical welding details were firstly established, and the welding heating process was simulated by using the birth and death element technique. The thermal-structural coupling analysis of welding process and weld condensation process was realized, and the temperature field of the welding detail under the double ellipsoid heat source was solved step by step according to Newton iterative method. Then, the temperature field was applied as the temperature load to the structural model of the typical welding detail, and the WRS was obtained by using thermal-structural sequential coupling analysis. Finally, the WRS field was introduced as the initial stress field into the Multiscale finite element model of the bridge, and then the XFEM was used to analyze the fatigue crack propagation law of typical fatigue details of the bridge deck under vehicle loads after the WRS field was introduced.
When the finite element mesh is inconsistent, mesh mapping is needed from welding process analysis to crack propagation analysis. In order to ensure the accuracy of WRS in the crack propagation analysis, the element size of the solid model used in welding analysis and crack propagation analysis are the same, so there is no need for mesh mapping.
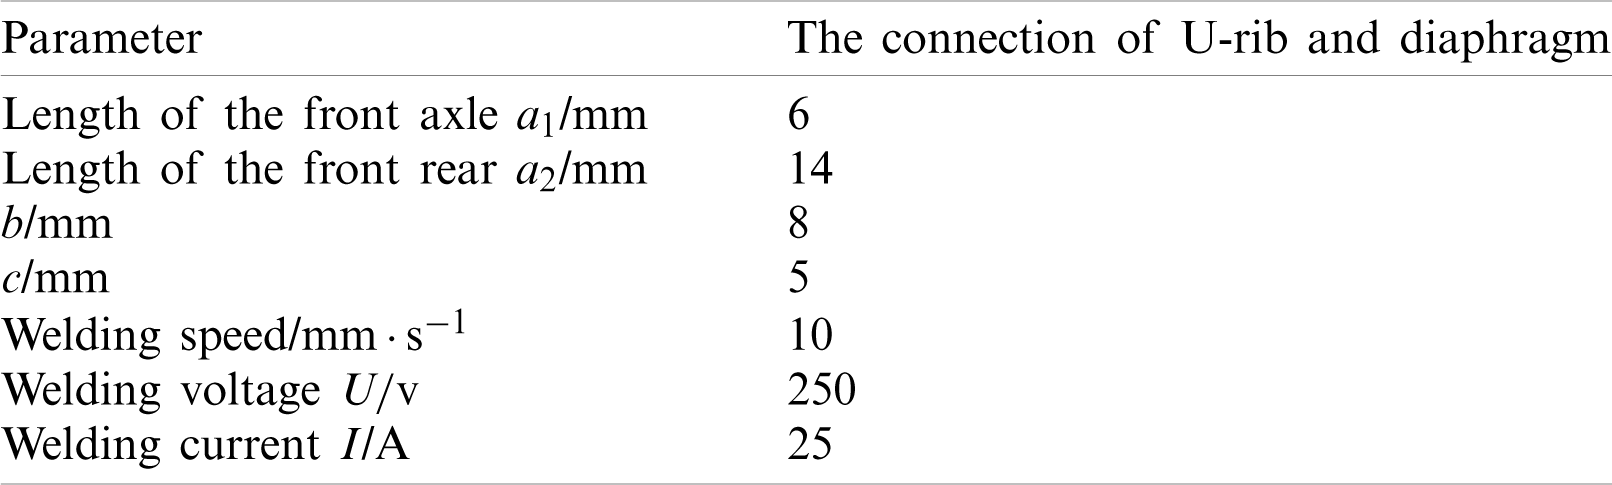
A refined solid element model of the connection of the U-rib and diaphragm with welds is established, as shown in Fig. 4. In the thermal analysis, the heat source uses a double ellipsoid heat source, and the parameters are shown in Tab. 2. The room temperature is set at 20
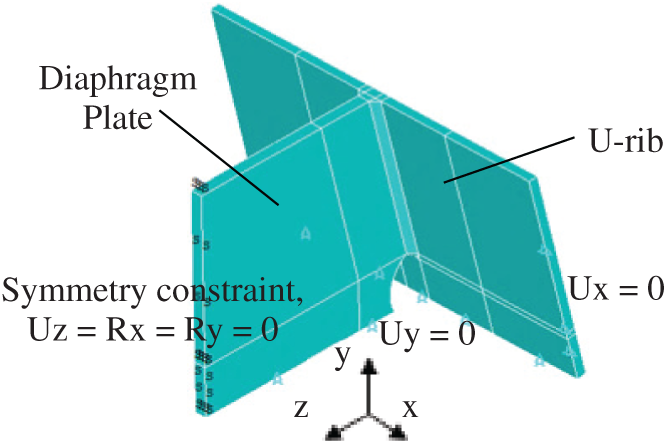
Figure 4: Welding analysis model of the joint of U-rib and diaphragm plate
Table 2: Parameters of double ellipsoid heat source function
According to References [26,27], the thermal physical and thermodynamic parameters of steel used in welding analysis are appropriately modified to obtain the thermodynamic analysis parameters of Q345 steel used in this paper, as shown in Fig. 5.
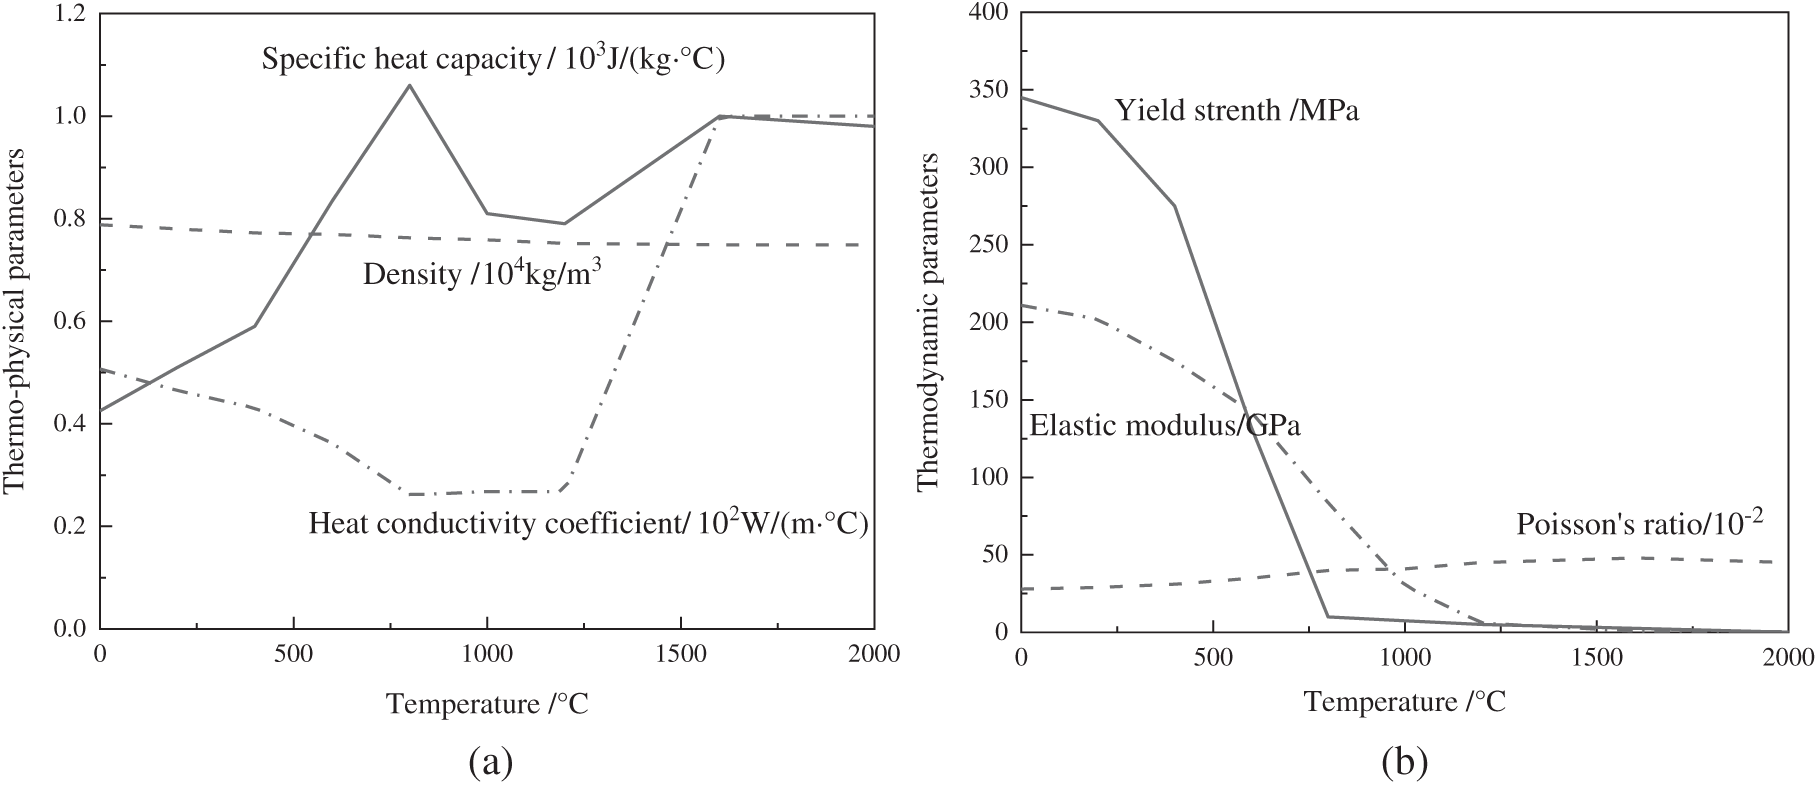
Figure 5: Thermodynamic analysis parameters of Q345 steel (a) thermophysical parameters of Q345 steel (b) thermodynamic parameters of Q345 steel
3.2 Multiscale Finite Element Model and Loading Condition of Bridge
In order to study the stress characteristics and crack propagation rule at critical locations under vehicle load, a Multiscale finite element model of bridge was established. Taking the cable-stayed bridge of Runyang Yangtze River Highway Bridge as an example, in the commercial finite element software ABAQUS, the global finite element model of the bridge is first established, as shown in Fig. 6a. The model includes bridge towers, cables and OSBDs, and the characteristic length of these components is between 100–102 m. The concrete counterweight of steel box girder at the end of the bridge is simulated by mass unit. Three translational and three rotational degrees of freedom are constrained at the end of the bridge and at the bottom of the bridge. The bridge tower is simulated by beam element B31, and the cable is simulated by rod element T3D2. In order to improve the calculation efficiency, according to the principles of composite mechanics, mass equivalence and stiffness equivalence, the OSBD with U-ribs is equivalent to the physically equivalent OSBD without the U-rib at non-critical locations [28]. The bridge deck is simulated by shell element S4, as shown in Fig. 6b. In order to accurately obtain the fatigue stress characteristics of each structural detail of the steel box girder under cyclic vehicle load, considering that the middle span is the part with large vertical displacement of the structure, a refined model for the middle span of the steel box girder with length of 40 m is established. The refined model includes the top deck, the bottom deck, inclined web, diaphragm and U-shaped stiffener. There is a U-shaped stiffener every 0.04 to 0.08 m in the transverse bridge direction. The characteristic lengths of these components are between 10−2–100 m, which are simulated by solid element C3D8 in ABAQUS, as shown in Fig. 6c. Submodel technology is used to connect the boundary between the equivalent OSBD model without U-ribs and the refined OSBD model with U-ribs. The dislocations of the cut boundary nodes of the full-bridge model are linearly interpolated to the boundary nodes of the local model, and the dislocations of the nodes are coupled. The shell element cannot simulate the crack propagation behavior. In order to study the fatigue crack propagation along the direction of plate thickness, a solid model is established at the critical locations of the refined OSBD model, including the welding connection of the U-rib and diaphragm and the crack model, and C3D8 element is used to simulate the weld and the crack, as shown in Fig. 6d. The established solid model is embedded into the corresponding position of the refined model of the OSBD in Fig. 6c to replace the original shell element model. The shell-solid element coupling connection is adopted between the embedded solid element model and the surrounding shell element. The length of U-rib is 300 mm, the height is 200 mm, and the width of transverse diaphragm is 150 mm. In order to study the crack propagation behavior at the connection of the U-rib and diaphragm, a semi-elliptical initial crack is established at the toe of the U-rib with a long axis of 10 mm and a short axis of 2 mm, and the characteristic length of the crack is 10−3 m, as shown in Fig. 6e.
Therefore, the characteristic lengths of different components are on different scales. Moreover, for finite element models with different characteristic lengths, different physical equations are used to describe them. Linear elasticity theory is used to describe the whole structure model and the local component model. For the welding area, the elastoplastic theory is adopted. Fracture mechanics and extended finite element theory are used to describe the local crack model.
The vehicle load model selected in this paper refers to fatigue load model III in reference [29], and its loading mode is shown in Fig. 7. The model consists of four standard axes. The distance between the longitudinal and longitudinal axes is 6 m and the distance between them is large. For a node on the bridge face plate, when the wheel pressure of the two axes of the current plane acts near the node, the latter two axes are still far away from the point, which has no significant influence on the fatigue stress of this part. Therefore, this paper only takes the two-wheel pressures with a longitudinal wheelbase of 1.2 m as the fatigue load applied to the Multiscale model of the bridge. The area of each wheel load acting surface is
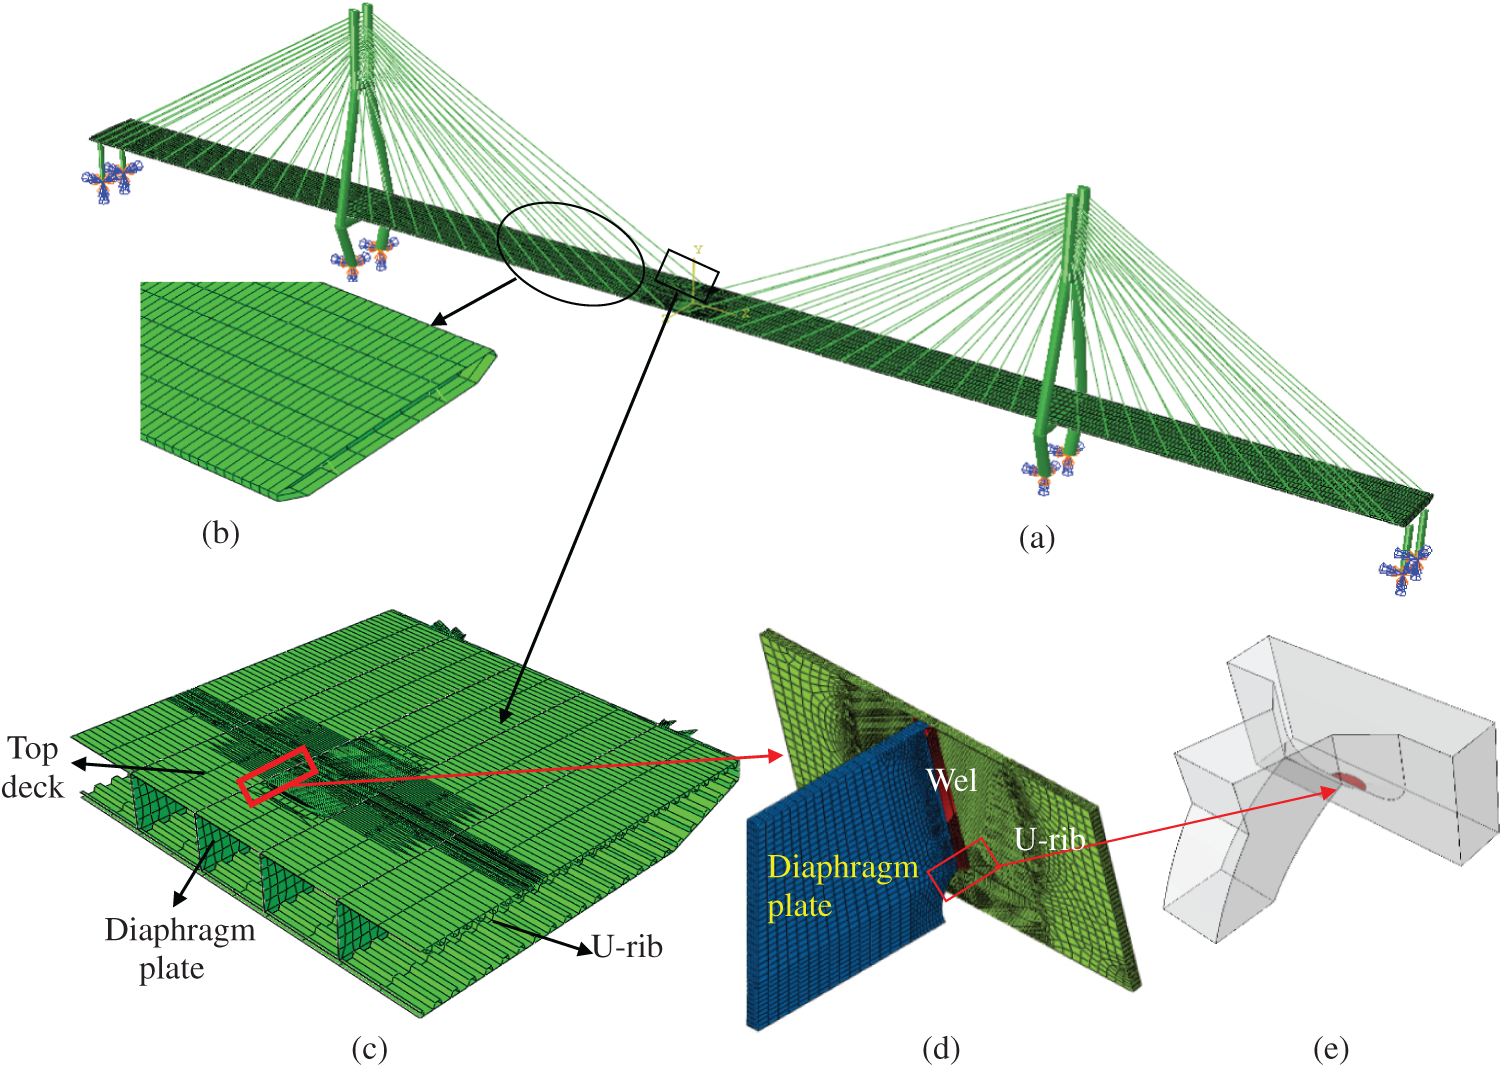
Figure 6: Runyang multiscale finite element model of cable-stayed bridge (a) overall bridge model, (b) equivalent orthotropic deck (c) refined orthotropic deck (d) solid model of connecting parts (e) semi-elliptic crack model
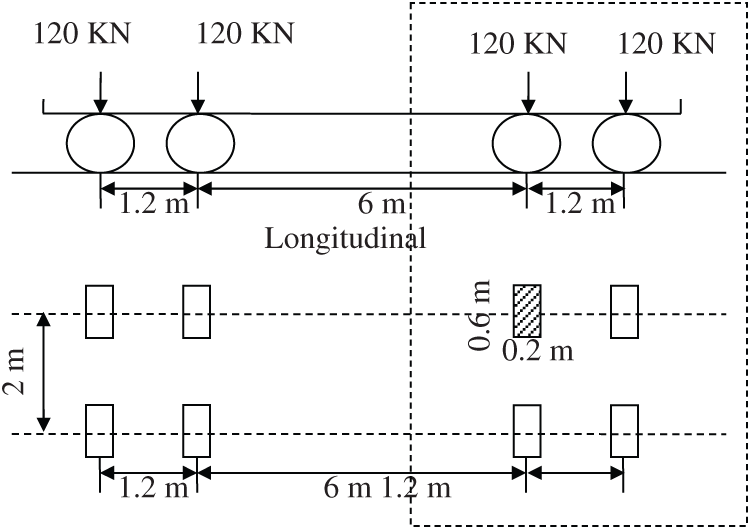
Figure 7: Fatigue load model III
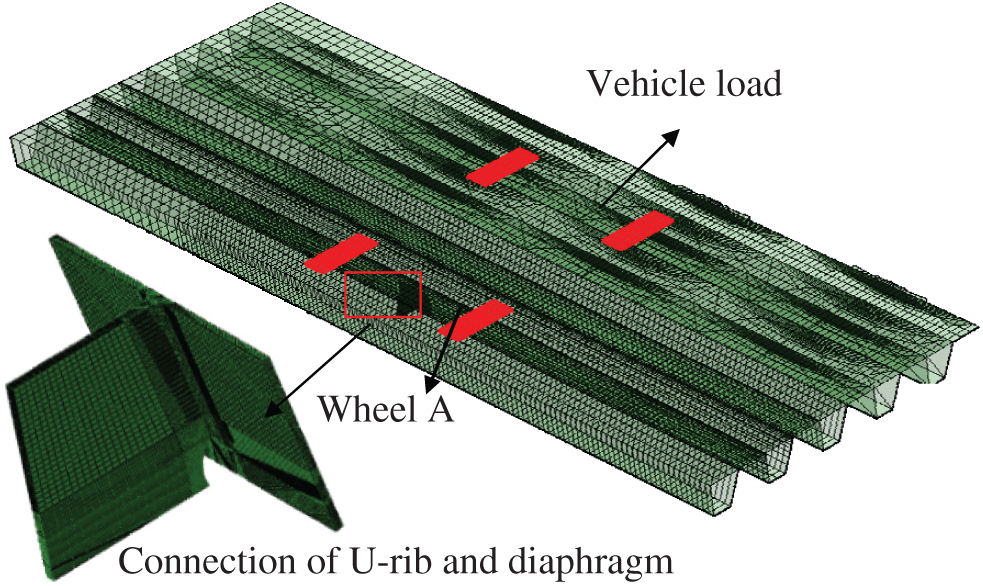
Figure 8: The loading position of vehicle with fatigue crack at welding toe of U-rib
The welding process of steel box girder of long-span bridge is generally divided into two steps: welding and assembly of each plate of steel box girder in the factory and welding between each section of the girder at the construction site. The former includes the welding of the top deck and the U-rib, the bottom deck and the U-rib, the U-rib and the diaphragm, and the top deck or bottom deck and the diaphragm, and so on. The latter generally refers to the welding of two adjacent sections of steel box girder or the welding of the arm and the box girder section. This paper mainly focuses on the welding process of each plate of OSBD, and considers that the WRS is mainly generated in the process. This process is completed in the factory.
The WRS field can be obtained through thermal-structural sequence coupling, as shown in Fig. 9. It can be seen that the equivalent stress of the whole weld area reaches the yield stress of steel. The WRS at the beginning and end of the welding seam is small, the middle area of the welding seam is in the state of residual tensile stress, the stress distribution is uniform and has reached the steel yield stress. The distribution of WRS on some typical paths of the U-rib and diaphragm connection is studied, the corresponding path diagram is shown in Fig. 10. Path 1 is parallel to the U-rib toe and starts at the center of the U-rib toe, path 2 is perpendicular to the U-rib toe and starts at the center of the U-rib toe, path 3 is the cross-baffle toe, starting at the upper end of the cross-baffle toe, path 4 starts at the lower end of the cross-baffle toe and ends at the toe of the cross-baffle toe.
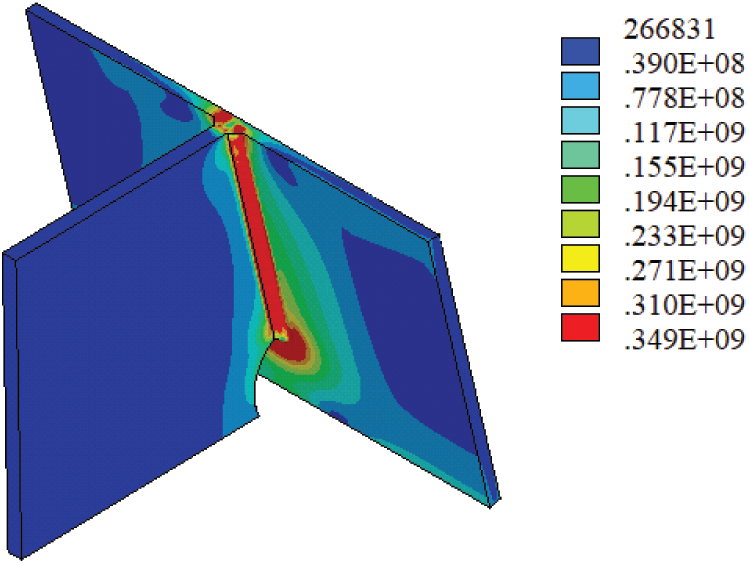
Figure 9: Stress at the connections of U-rib and diaphragms (unit: Pa)
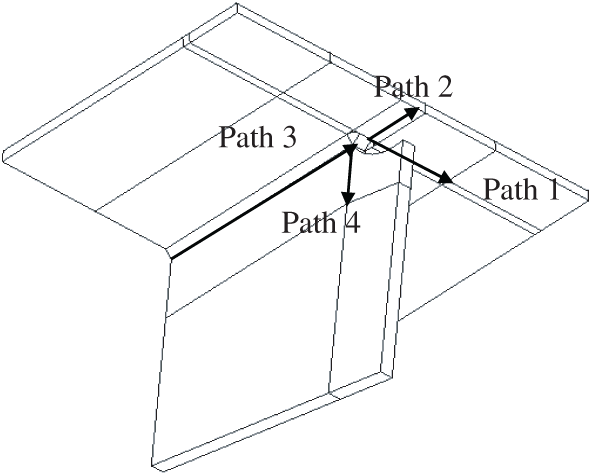
Figure 10: Weld path diagram
Fig. 11 shows the distribution curves of WRS along four typical paths. Figs. 11a and 11b show the transverse residual stresses along paths 1 and 2, respectively. It can be seen that the transverse residual stresses in the welding toe of U-rib along paths 1 and 2 are relatively larger, while the stress in the U-rib far from the welding toe gradually decreases, and the U-rib far from the center of the welding toe along path 1 is in a state of residual compressive stress. Fig. 11c shows the distribution of transverse and longitudinal residual stresses along path 3. It can be seen that the transverse and longitudinal residual stresses at the welding toe of diaphragm are almost all tensile stresses, and only the residual compressive stresses occur in the small area at the end of the welding toe of diaphragm. Fig. 11d shows the transverse and longitudinal residual stresses along path 4. It can be seen that along the path 4 perpendicular to the welding toe of diaphragm, the transverse and longitudinal residual stresses at the welding toe end of the diaphragm are the least. With the increase of distance from the welding toe, the residual stress increases, then tends to a stable value. The transverse and longitudinal tensile stress peaks along path 4 are small, about 100 and 25 MPa, respectively. It can be seen that the distribution of WRS at the connections of U-rib and transverse diaphragm in the longitudinal and transverse direction is basically consistent with that in the references [10,27]. Therefore, the WRS field simulated in this paper can provide an initial stress field for the subsequent analysis of the propagation law of the fatigue crack at the welding toe of U-rib.
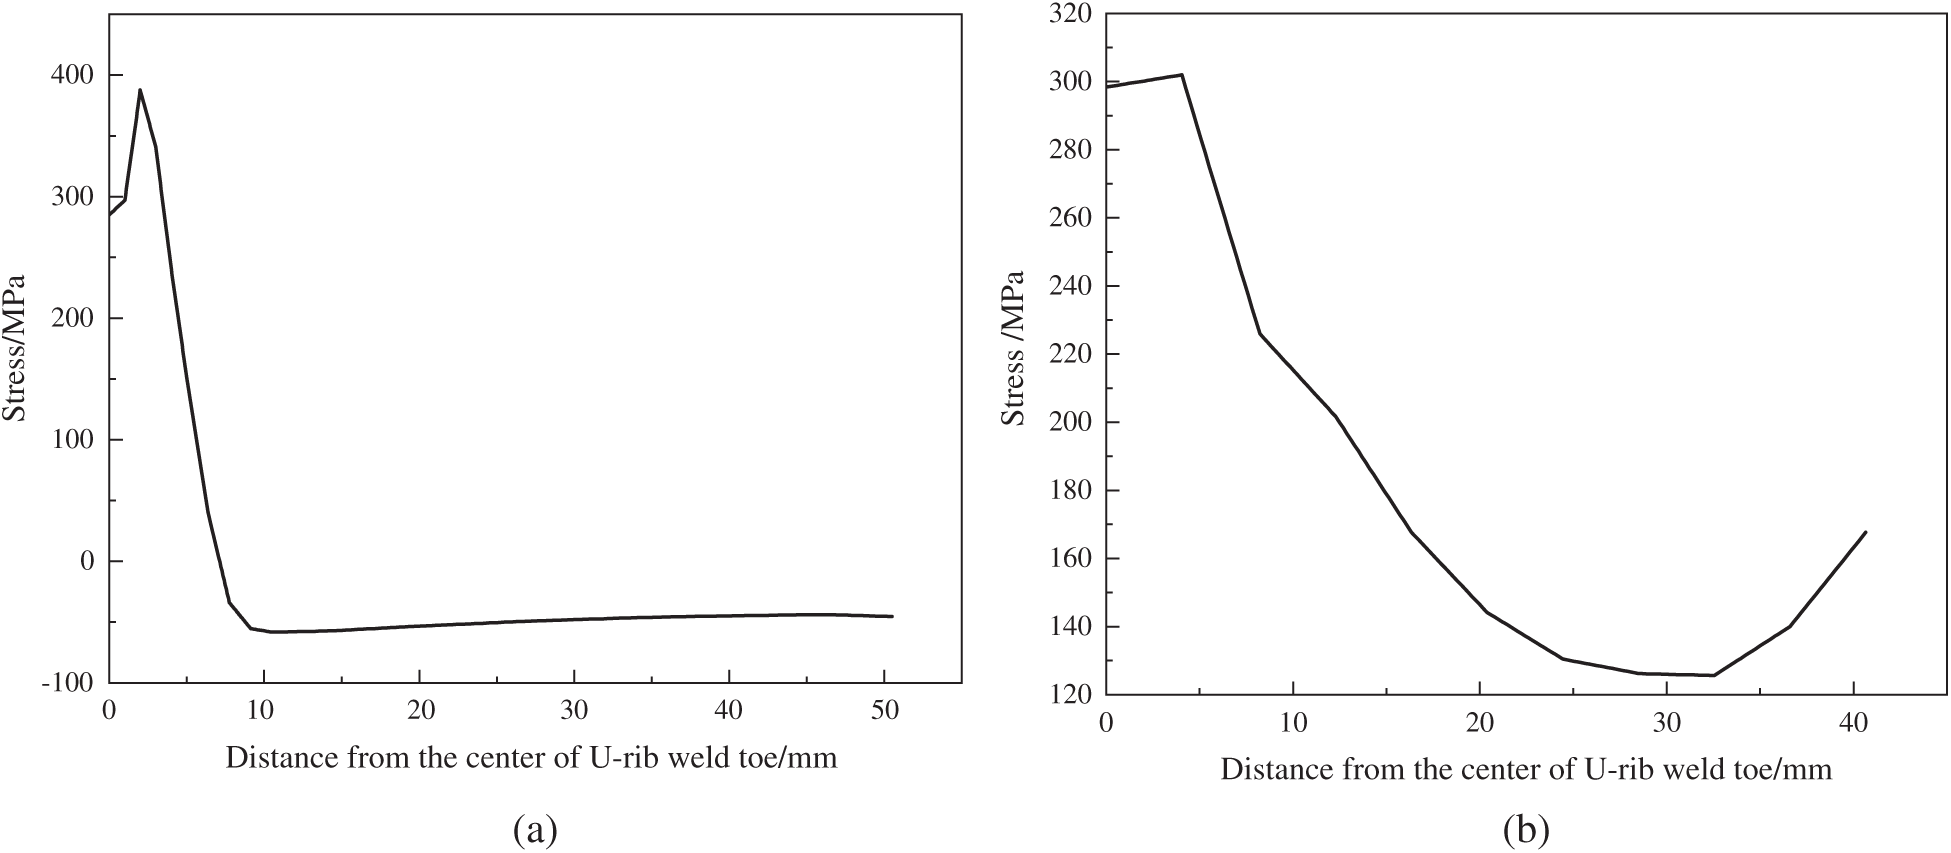
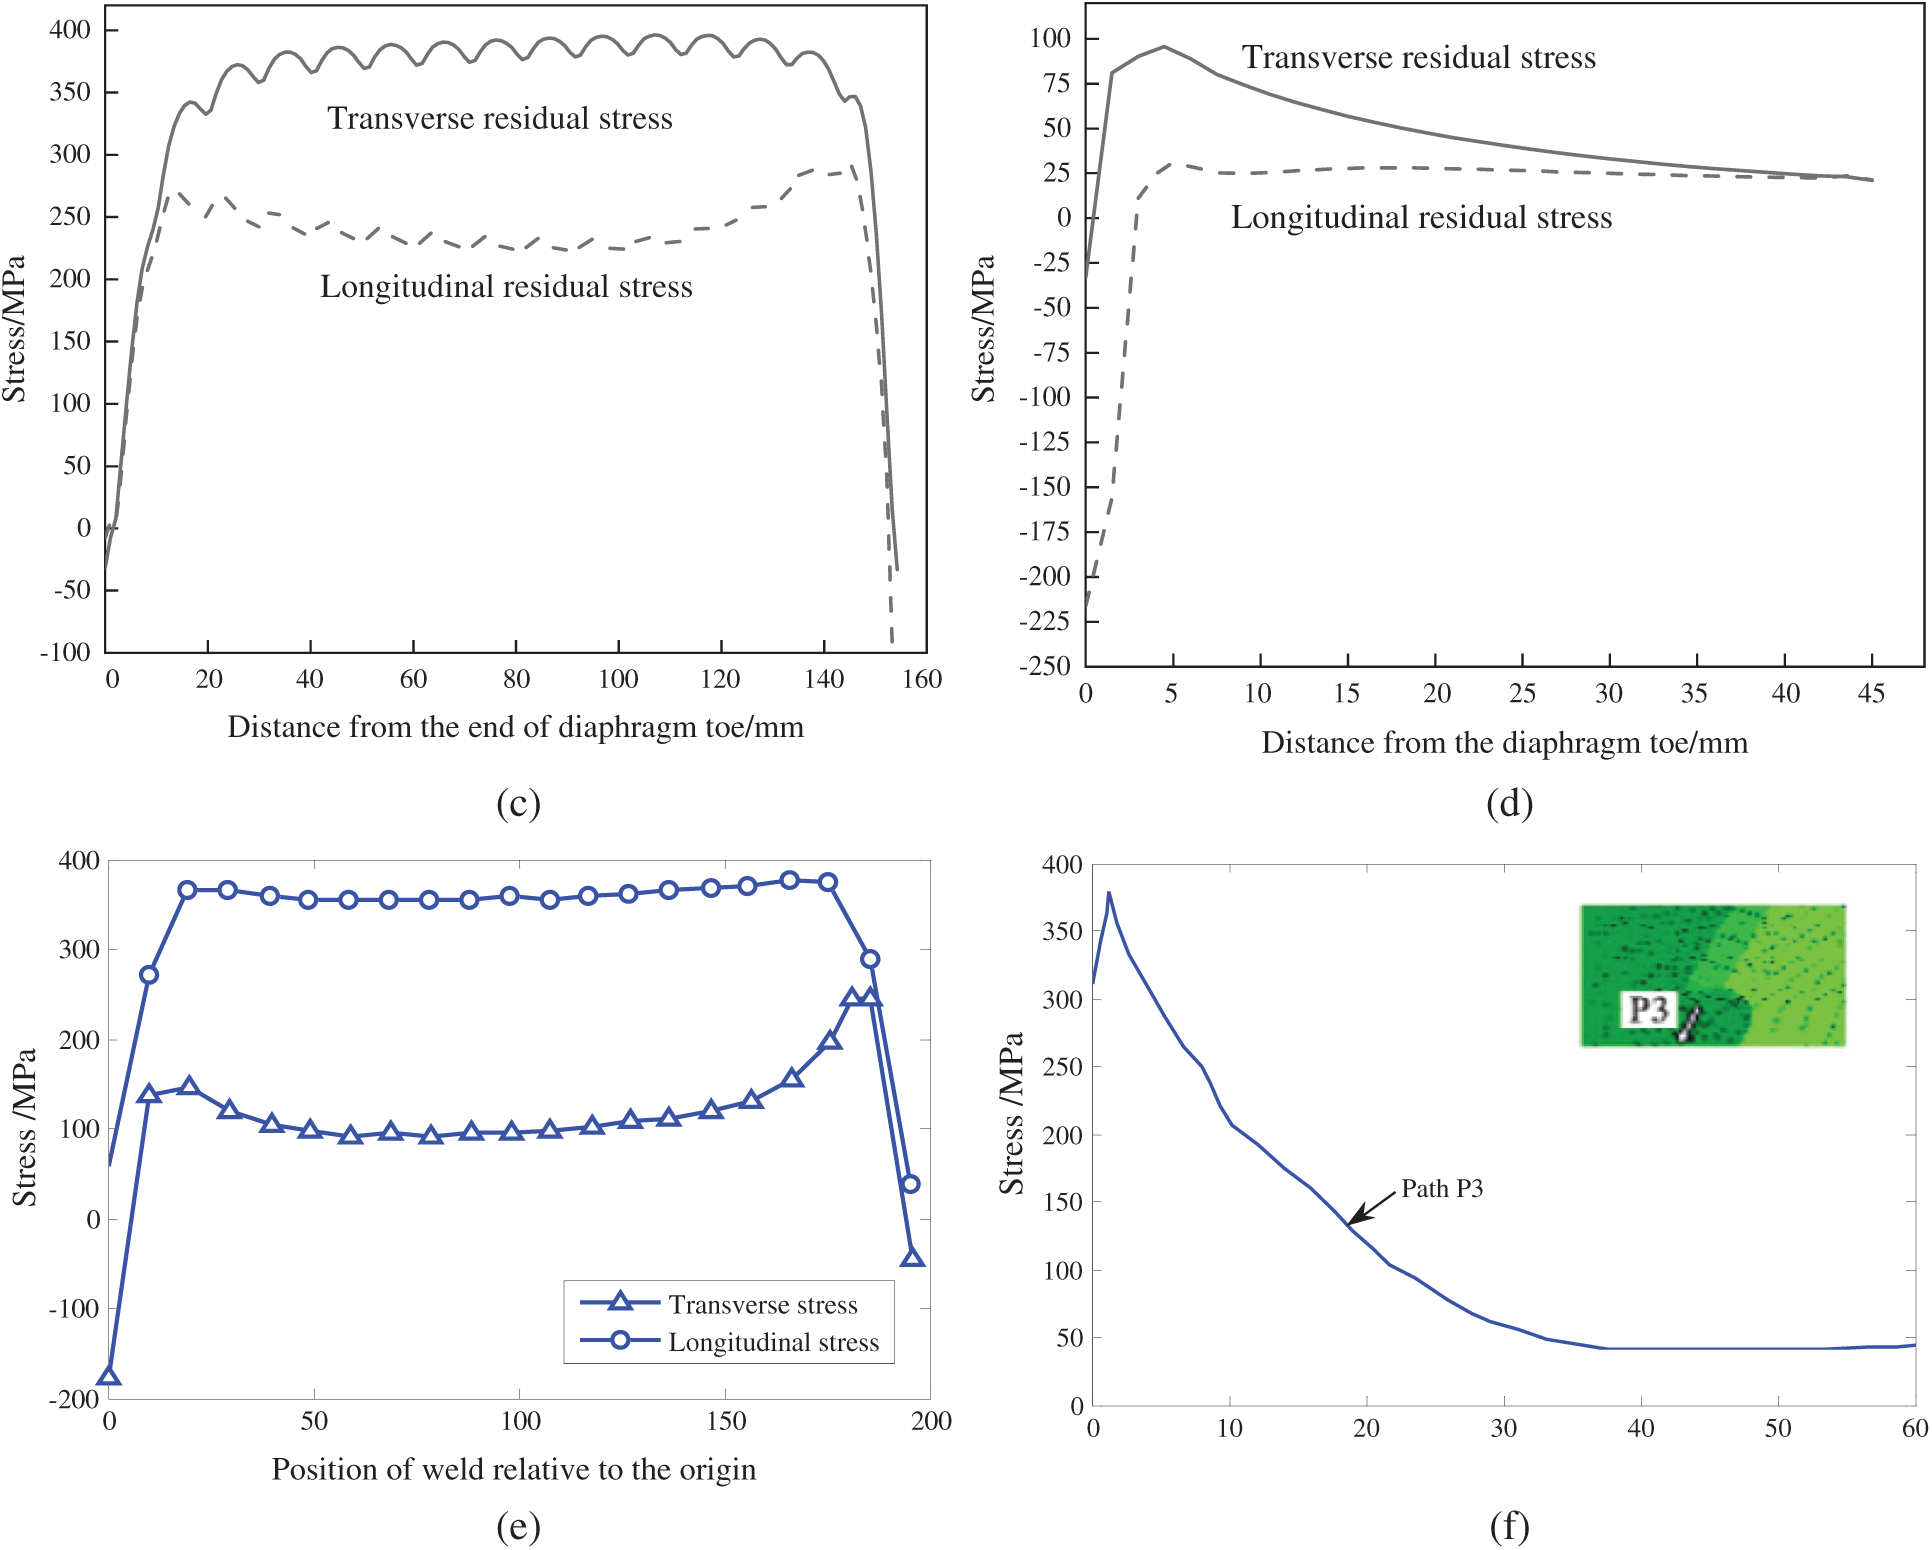
Figure 11: Distribution curve of WRS at the junction of U-rib and diaphragm (a) transverse residual stress along path 1 (b) transverse residual stress along path 2 (c) transverse and longitudinal WRSes along path 3 (d) transverse and longitudinal WRSes along path 4 (e) transverse and longitudinal residual stresses of diaphragm toe (f) WRS of U-rib
5 Analysis of Fatigue Crack Propagation at U-Rib Toe
5.1 Fatigue Crack Propagation Path
Firstly, without considering the influence of WRS field of welding, cyclic vehicle load as shown in Fig. 9 is applied to the multiscale finite element model of the bridge containing the initial crack, and the elastic-plastic constitutive relation of the material is embedded, then the fatigue crack propagation path at the U-rib toe is obtained by using the XFEM, as shown in Fig. 12. It can be seen that when the plastic deformation of the material is considered but the influence of the WRS field is not taken into account, the surface crack morphology caused by the plastic deformation is asymmetric to the center line of the diaphragm, and the crack front propagation rate on the right side is higher than that on the left side. In the long axis direction of the initial crack, the crack surface after expansion presents an angle of about 17
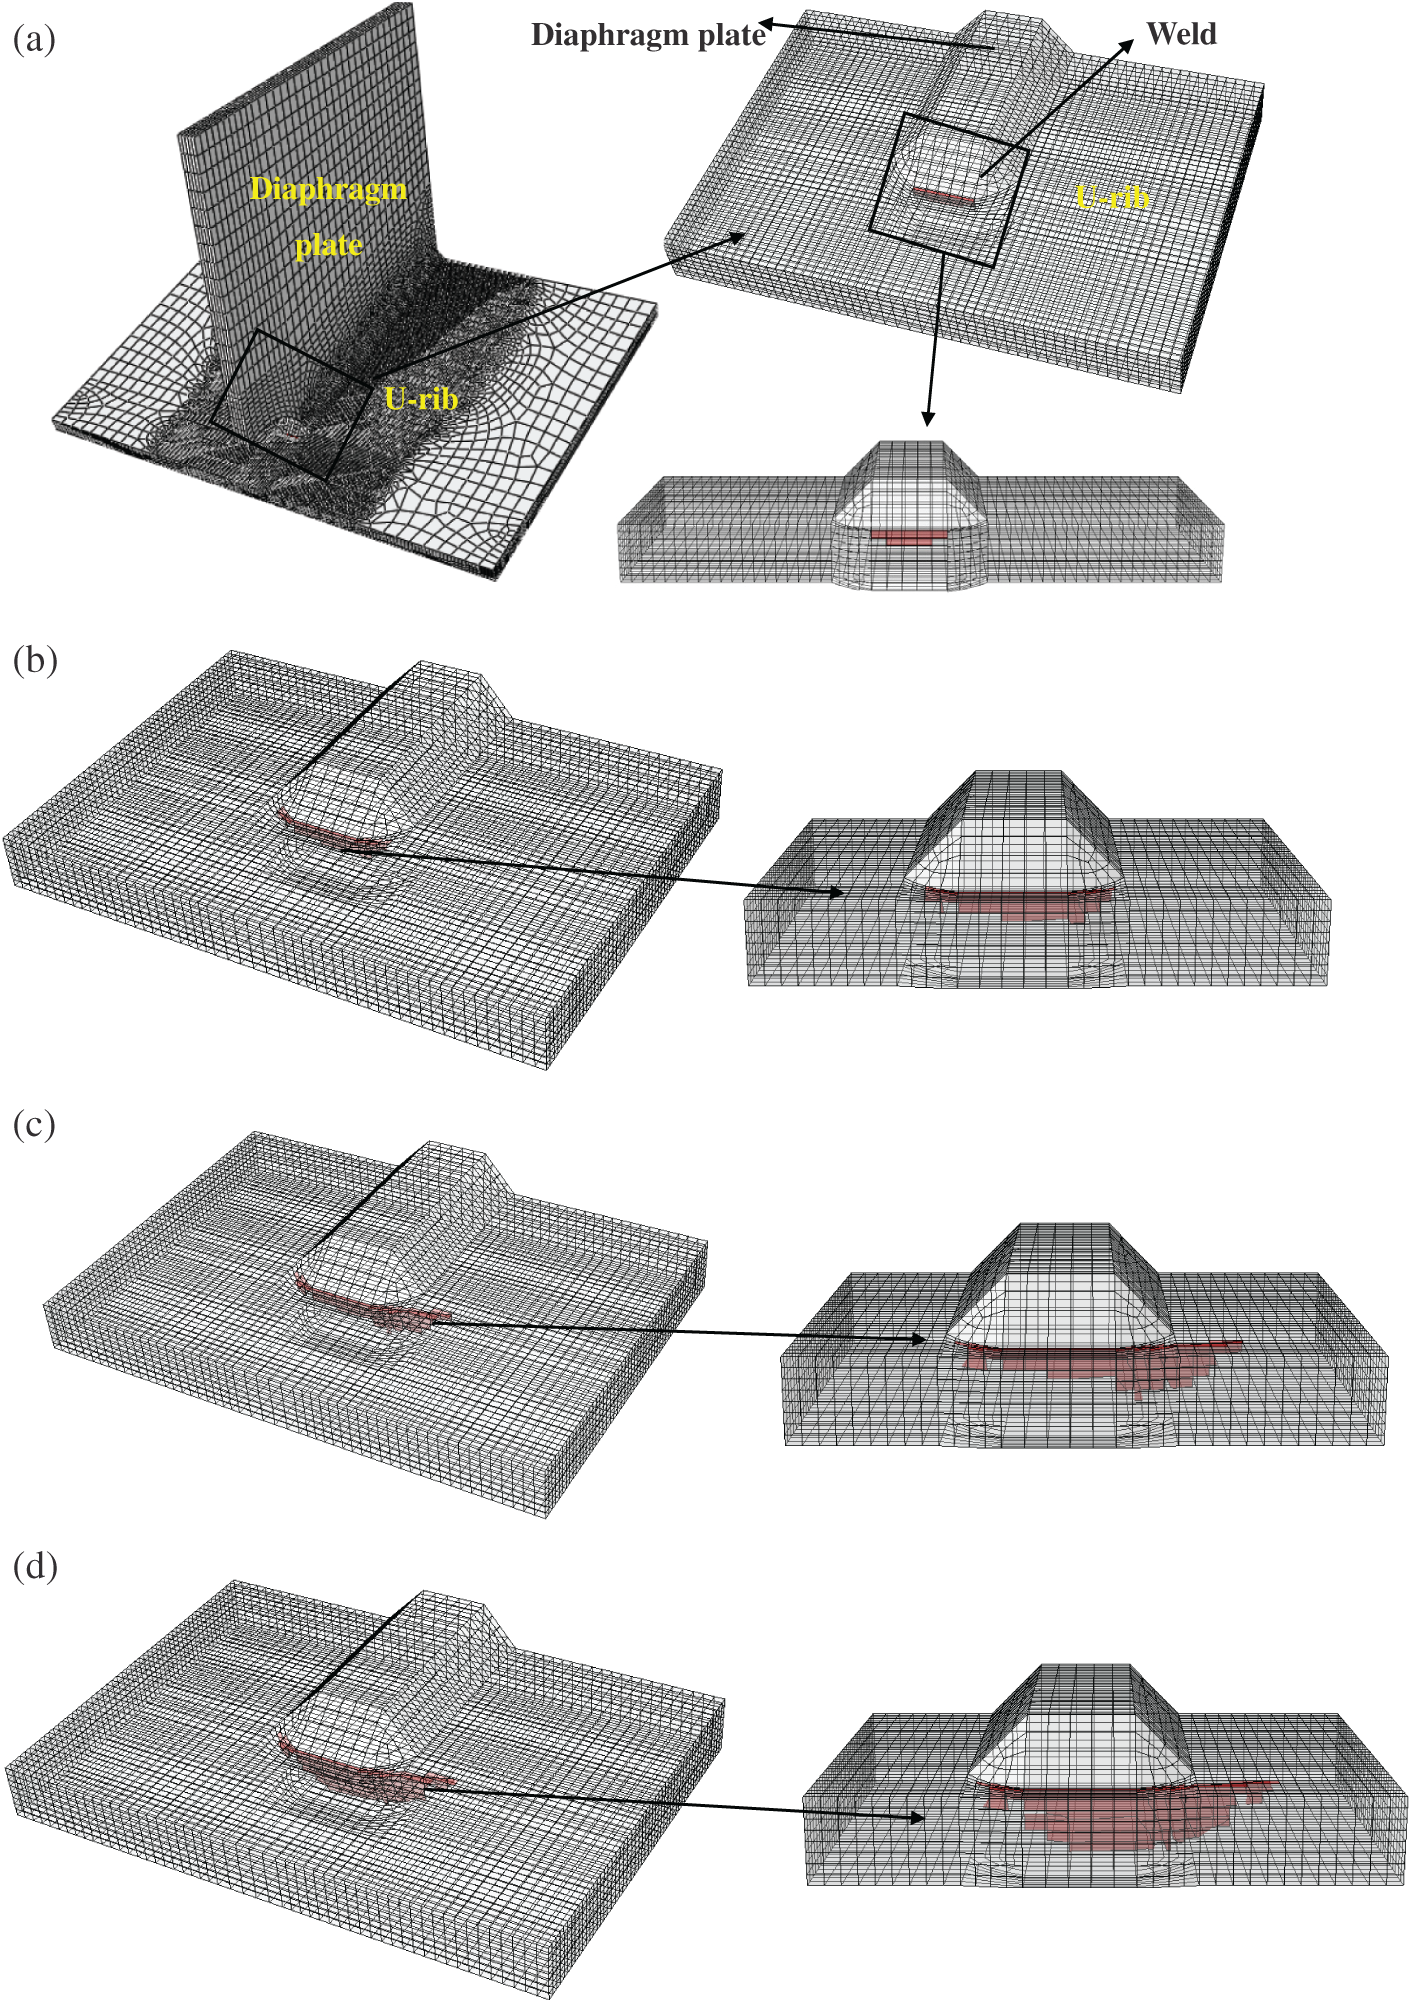
Figure 12: Fatigue crack propagation path at welding toe of U-rib without considering WRS field (plastic material) (a) initial crack surface (b) 600,000 cycles (c) 2 million cycles (d) 3.5 million cycles
Similarly, when plastic deformation of materials and the influence of WRS field are considered, vehicle loads are applied to the multiscale finite element model of the bridge to obtain the propagation path of fatigue crack at welding toe of U-rib, as shown in Fig. 13. It can be seen that when the vehicle load, WRS and material plasticity are taken into account, the propagation rate of fatigue crack at the welding toe of U-rib on the left side of the diaphragm is higher than that on the right side before 30,000 loading cycles, with the midline of the diaphragm as the dividing line. After 30,000 cycles, the position of crack front on the left side of the diaphragm remains basically unchanged, while the crack propagation rate on the right side of the diaphragm is higher than that on the left side. At the end of the load cycle, the crack length on the right side of the diaphragm is larger. Compared with Fig. 12, it can be seen that, considering the influence of WRS field, the fatigue crack propagation at the welding toe of U-rib in the short-axis direction is basically the same as that without residual stress field, both of which propagate at a small deflection angle. At the end of the cycle, the crack length in the short-axis direction is 6 mm. However, the angle along the long-axis direction is larger. By extracting crack coordinates, the angle between the fatigue crack at the end of cycle and the initial crack is 67.5
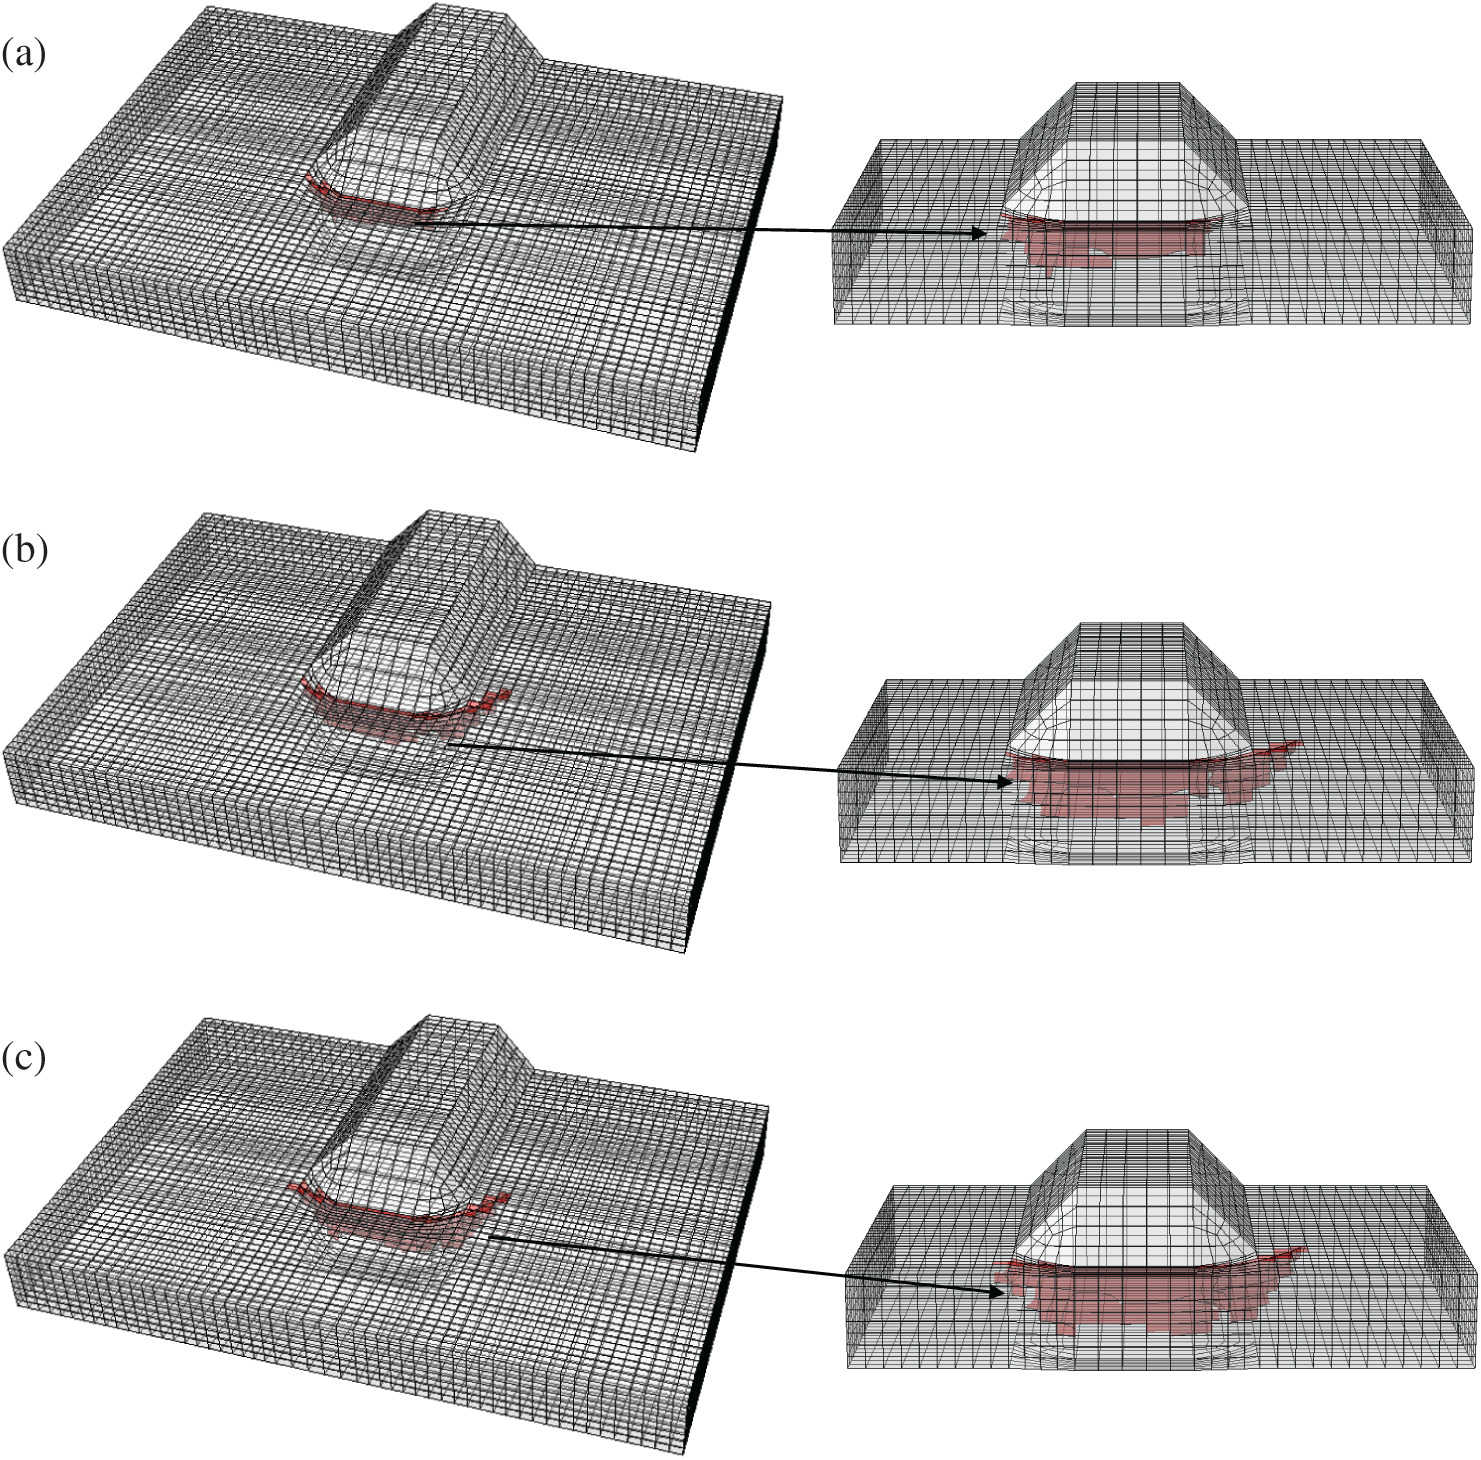
Figure 13: Fatigue crack propagation path at welding toe of U-rib considering WRS field (plastic material) (a) 30,000 cycles (b) 200,000 cycles (c) 250,000 cycles
The fatigue crack propagation paths of U-rib toe are compared under the following four conditions: considering WRS and material plasticity, considering WRS and material elasticity, not considering WRS and material plasticity, not considering WRS and material elasticity. The fatigue crack propagation steps at U-rib toe under four conditions were set as 90 steps. The propagation step represents the number of crack propagation. In the extended finite element analysis, ABAQUS software can obtain the value of stress intensity factor corresponding to all elements at the leading edge of the crack each time the load is applied, and then the life of each element N can be obtained according to Paris formula. Since there is more than one element at the leading edge of the crack, the program will set cracking of the element with the minimum life N and no cracking of the other elements, that is, only one element at the leading edge of the crack will generally propagate at each fatigue crack propagation step. The coordinates of the leading edge of the crack were extracted. Fig. 14 shows the fatigue crack propagation path at U-rib toe under different conditions. Fig. 14a shows the difference in fatigue crack propagation paths caused by plasticity and elasticity when WRS fields are considered. It can be seen that, considering material to plastic deformation, U-rib on the left side of the crack tip due to large plastic zone inhibits the crack extension, with transverse diaphragm axis is bounded, fatigue crack in the diaphragm plate on the right side of the crack tip length increment is bigger, and the initial crack extension along the long axis angle also increases, after considering plastic deformation crack angle by 59
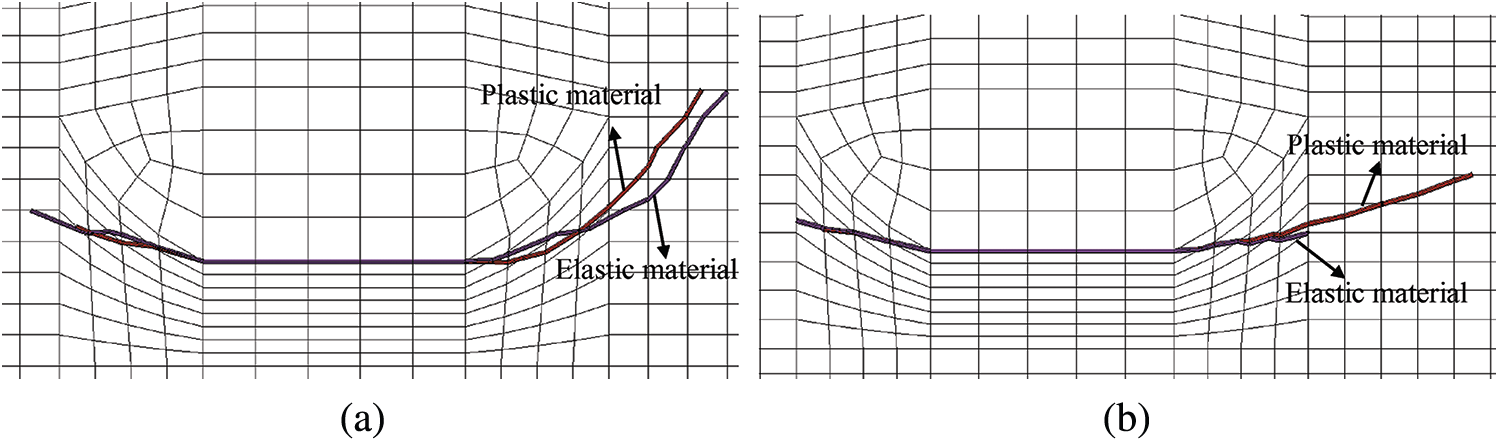
Figure 14: Fatigue crack propagation path at U-rib toe under different conditions (a) considering the WRS field (b) without considering WRS field
5.2 Analysis of WRS Intensity Factor
OSBD of Runyang Bridge in China are made of Q345D steel and made of isotropic material. The structural orthotropic nature is only due to the different stiffness in the longitudinal and transverse bridge directions caused by U-shape stiffeners. However, for the individual components of the box girder, such as the U-rib and diaphragm, they are all made of Q345D steel, which is an isotropic material. Therefore, the formulas for calculating stress intensity factor are valid for orthotropic steel bridge decks. Based on the elastic-plastic analysis of fatigue crack in U-rib toe, the crack opening stress intensity factor Kop, namely, type I crack stress intensity factor
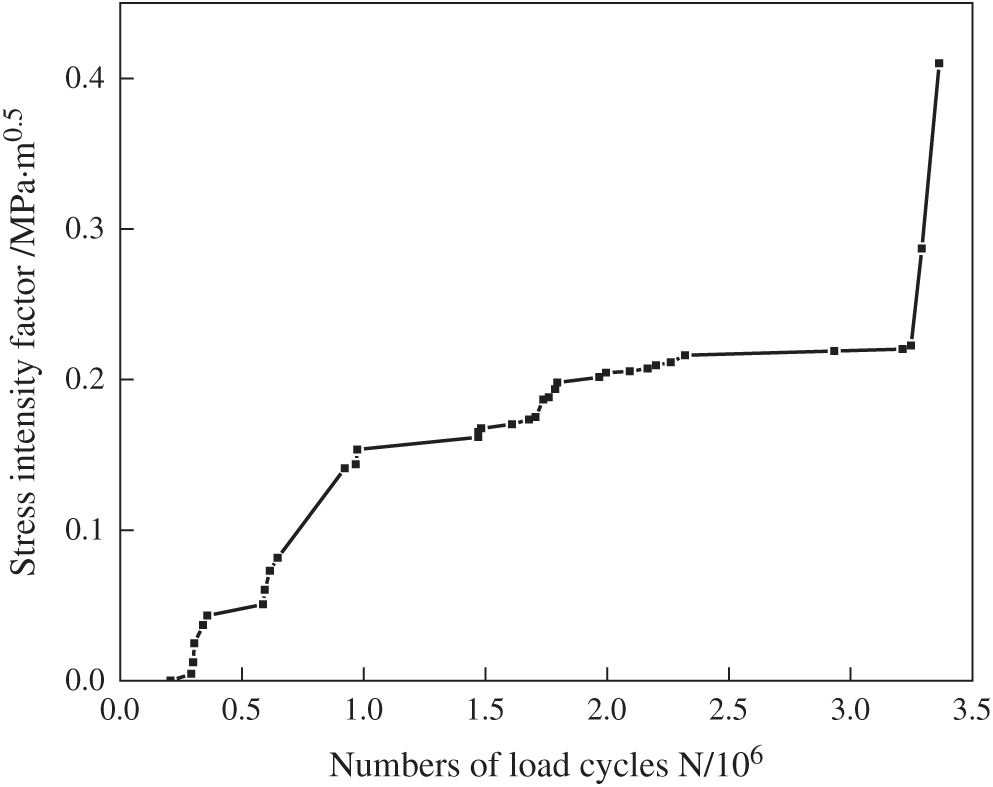
Figure 15: Crack opening stress intensity factor
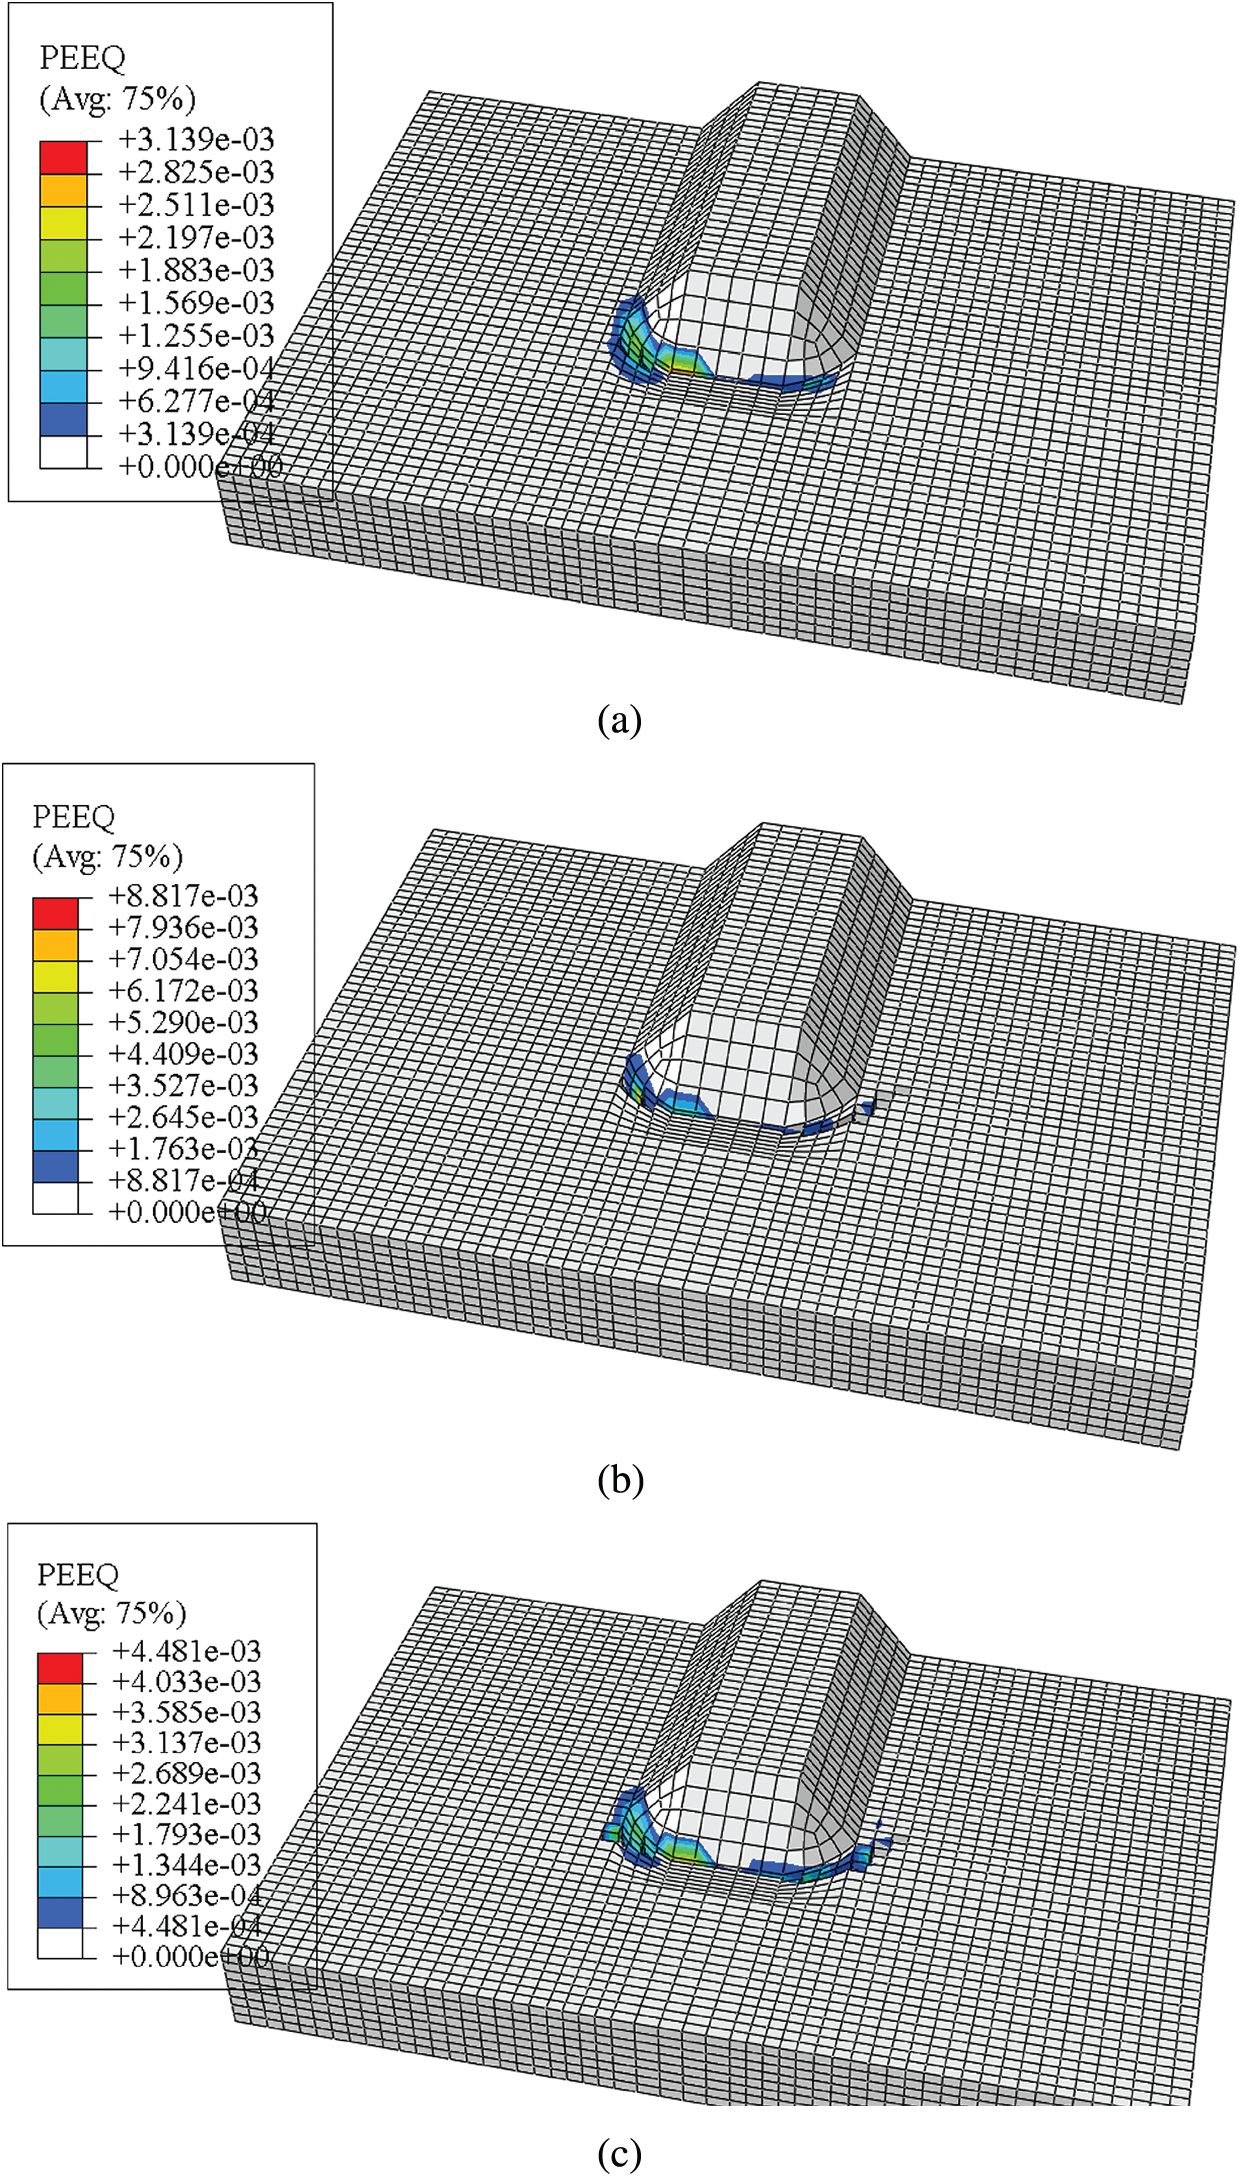
Figure 16: Equivalent plastic strain in the crack tip area of welding toe of U-rib when the WRS field is introduced (a) 30,000 cycles (b) 200,000 cycles (c) 250,000 cycles
When the WRS field is introduced, the crack tip stress field of the fatigue crack at the U-rib toe reaches the yield stress of the material before the crack propagation. In the process of crack propagation, the crack propagation step with a large plastic zone is selected to obtain the equivalent plastic strain in the crack tip region of the U-rib, as shown in Fig. 16. In order to observe the plastic zone range of the crack tip more intuitively, the strain cloud map given in Fig. 16 does not show the plastic strain at the crack surface. If the plastic strain at the crack surface is shown, the plastic strain value will increase with the fatigue crack propagation. In combination with the fatigue crack propagation path at welding toe of U-rib with WRS considered in Fig. 13, it can be found that the plastic deformation is mainly at the crack surface and crack tip area, and the equivalent plastic strain in other areas at the connection of U-rib and diaphragm is zero. Through measurement, the plastic zone sizes of 30,000 load cycles, 200,000 load cycles and 250,000 load cycles were 2.26, 3.4 and 4.46 mm, respectively, the corresponding surface crack lengths were 17.36, 27.83 and 29.43 mm, and the ratio of the plastic zone to the crack length was small. Larger plastic zone appeared in the diaphragm plate on the left side of the crack tip of the crack tip cell by inhibiting crack after loading cycle 30,000 times, diaphragm plate on the right side of the crack tip during the load cycle extended continuously, the crack tip plastic zone is small is always less than 1 mm, so the linear elastic fracture mechanics can be thought of and the interaction integral method based on the theory of the J integral of the WRS field in the U-rib toe fatigue crack propagation analysis still apply.
Considering the influence of the plastic zone, the stress intensity factor corresponding to the WRS field is calculated by executing the interaction integral process in Fig. 3, as shown in Fig. 17. It can be seen that the intensity factor corresponding to the WRS field is always positive and shows an increasing trend, indicating that when considering the WRS field, the residual tensile stress generated by the WRS field is greater than the residual compressive stress generated by plastic deformation for the fatigue crack at welding toe of U-rib, and crack closure will not occur during the fatigue crack propagation process. By comparing the intensity factor corresponding to the WRS field and the stress intensity factor generated by the cyclic load, it can be seen that the ratio between the intensity factor corresponding to the WRS field and that caused by the cyclic load is larger, that is, when the equivalent stress ratio is larger than R, the fatigue crack propagation at the U-rib toe will be accelerated. The equivalent stress ratio is defined in Eq. (16).
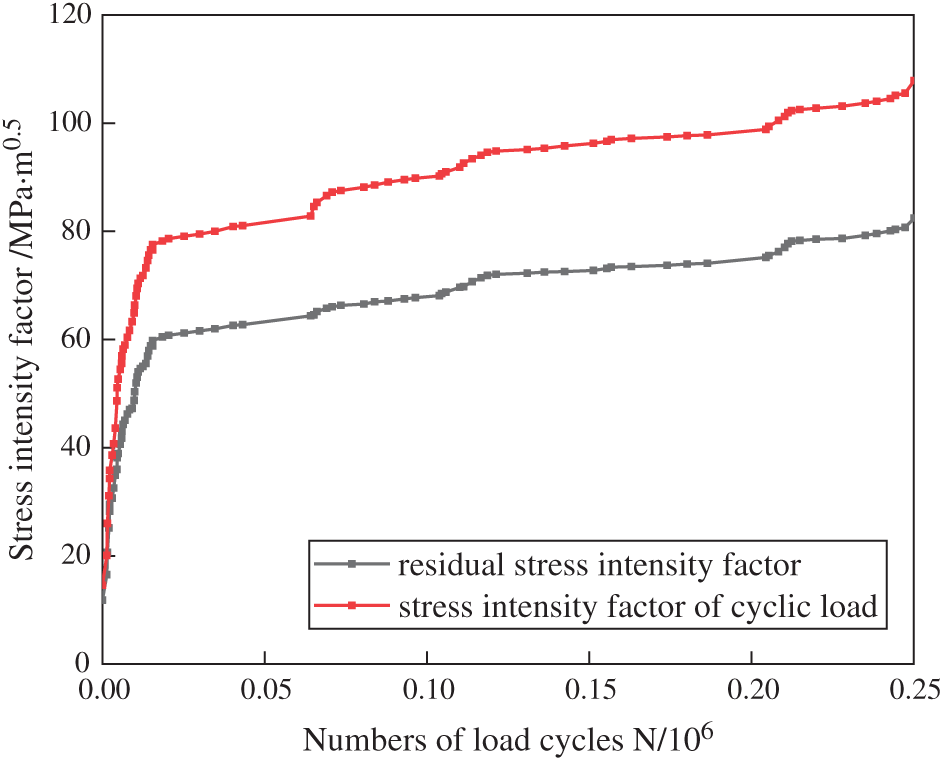
Figure 17: Stress intensity factor of fatigue crack in U-rib toe when WRS field is introduced
5.3 Analysis of Fatigue Crack Propagation Rate
The relationship between the length of the crack 2c along the long axis of the initial crack and the number of load cycles N of the fatigue crack at the U-rib toe is analyzed. Fig. 18 shows the 2c-N curve without considering the WRS field. It can be seen that under the single action of vehicle loads, before the 200,000 cycles, no plastic deformation occurs at the fatigue crack tip, and the two curves coincide, that is, the crack propagation rate is the same under both plastic and non-plastic conditions. The crack propagation rate is the same under both plastic and non-plastic conditions. Considering the plastic fatigue crack of the material, the length of the crack reached 25 mm when the load cycle was about 1.5 million times, while the length of the fatigue crack without plastic consideration reached 25 mm when the load cycle was about 3 million times, indicating that the fatigue crack propagation rate at the U-rib toe with plastic consideration was slightly higher than that without plastic consideration. The reason may be that the plastic deformation of crack tip increases the increment of energy release rate.
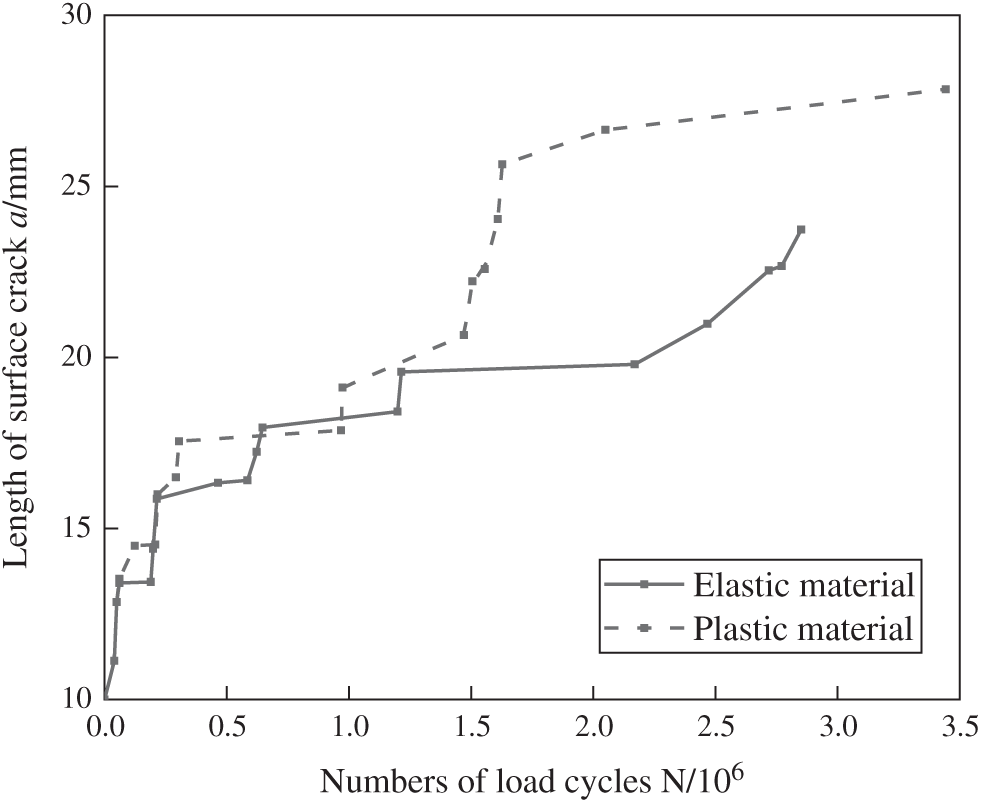
Figure 18: Crack propagation rate with WRS field
Similarly, Fig. 19 shows the relationship between the length of the crack 2c along the long axis of the initial crack and the number of load cycles N of the fatigue crack at the U-rib toe when the WRS field is considered. As the stress intensity factor generated by the WRS field of welding is large and always positive, the equivalent stress ratio R is increased, and the corresponding equivalent stress intensity factor amplitude increases, finally leading to the increase of crack propagation rate. It can be seen from Fig. 19 that before 20,000 load cycles, when considering plasticity and equivalent stress ratio R, the curve slope of fatigue crack length and cycle times at welding toe of U-rib is the largest, indicating that the propagation rate is the fastest at this time. Before 150,000 cycles, considering material plastic deformation U-rib weld toe of the fatigue crack propagation rate is significantly higher than without considering the plastic extension rate, after considering plastic deformation U-rib fatigue crack is mainly extend along U-rib thickness direction, without considering the plastic deformation and fatigue crack along the long axis direction of 2c extensions, lead to the late without considering plastic deformation of crack propagation is faster. However, from the analysis of the whole cycle process, the U-rib fatigue crack with plastic deformation considered after 250,000 cycles, the crack length along the long axis direction is 30 mm, the crack depth along the short axis direction is 6 mm, and after 250,000 cycles, the length of the U-rib fatigue crack along the long axis direction is about 25 mm, the crack depth along the short axis direction is 5.88 mm, which show that the fatigue crack propagation rate is higher in the whole cycle considering plastic deformation and equivalent stress ratio R.
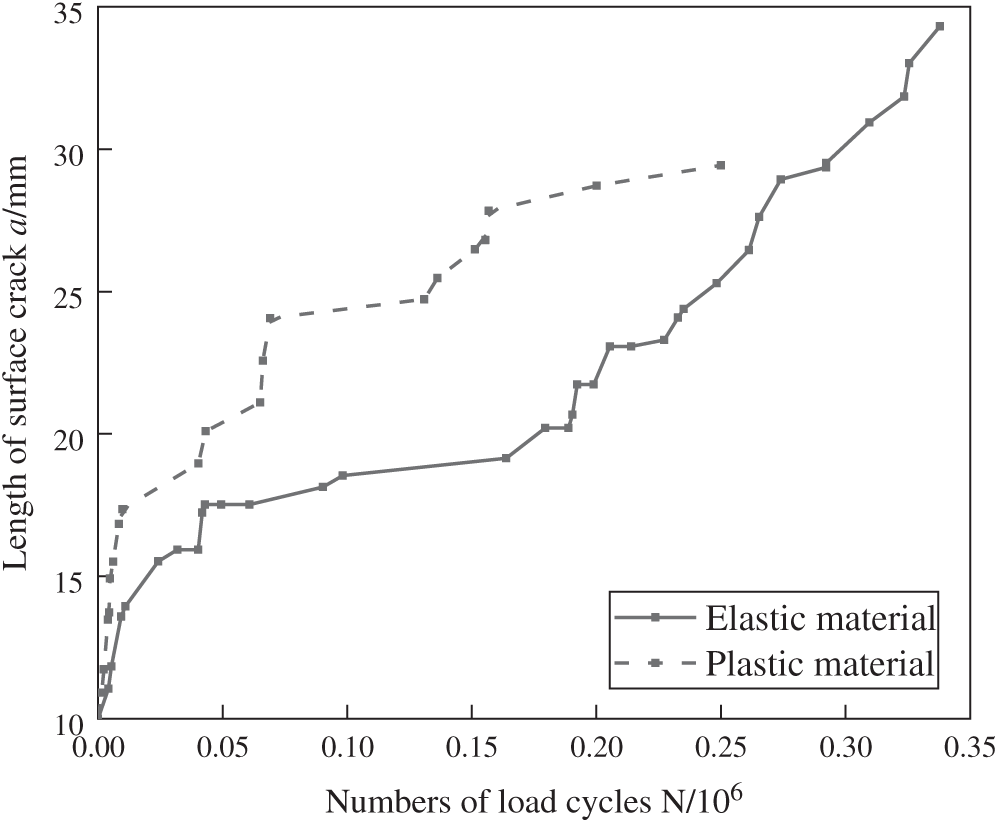
Figure 19: Crack propagation rate without WRS field
In this paper, an elastoplastic constitutive model based on the Chaboche kinematic hardening model was introduced, and the XFEM was used to study the influence of material elastoplasticity and crack tip plastic zone on the law of fatigue crack propagation with or without WRS field. The interaction integral method was used to obtain the stress intensity factor at the crack tip when the cyclic load dropped to zero during the crack propagation process. The following conclusions are drawn:
(1) For the fatigue crack propagation path, when the plastic deformation is considered, the fatigue crack at the welding toe of U-rib basically remains unchanged in the short-axis direction of the initial half elliptical crack, but is going up along the long-axis direction. Compared with linear elastic materials, the crack propagation path is more consistent with that in actual bridges. In the process of crack propagation, the plastic zone of the crack tip on one side of the diaphragm is larger than that on the other side, which will inhibit the crack propagation, and the inhibition effect will be more significant when the WRS field is considered. The reason may be that residual compressive stress is generated at the crack tip on one side of the plastic zone, resulting in the stress intensity factor here lower than that of the other side of the crack, and thus inhibits the crack propagation.
(2) As the cyclic load drops to zero, if the WRS is not considered, the plastic zone near the fatigue crack tip at the weld toe of U-rib is small, and the stress intensity factor of the residual compressive stress produced by the plastic deformation is less than
(3) The relationship between the crack length 2c in the long axis direction of the initial crack at the weld toe of U-rib and the cyclic loading numbers N is analyzed. The results show that when the WRS field is not considered, the fatigue crack propagation rate at weld toe of U-rib with plasticity considered is significantly higher than that without plasticity because the plastic deformation will affect the energy release rate amplitude. When the WRS field is introduced, due to the combined actions of plastic deformation and equivalent stress ratio R, the increment of equivalent energy release rate during the fatigue crack propagation process is increased, and the fatigue crack propagation rate at weld toe of U-rib is increased accordingly.
Funding Statement: The works described in this paper are substantially supported by the grant from the National Natural Science Foundation of China (Grant No. 51678135); the Natural Science Foundation of Jiangsu Province (No. BK20171350); Six Talent Peak Projects in Jiangsu Province (JNHB-007), which are gratefully acknowledged.
Conflicts of Interest: The authors declare that they have no conflicts of interest to report regarding the present study.
1. Ji, B. H., Xu, J., Yao, Y., Fu, Z. Q. (2019). Fatigue damage analysis of rib-to-deck weld joints of steel bridge deck considering load influence surface. Journal of Chongqing Jiaotong University (Natural Science), 38(11), 27–33. DOI 10.3969/j.issn.1674-0696.2019.11.05. [Google Scholar] [CrossRef]
2. Qu, Y., Zeng, Y., Gu, A. B., Du, B. S. (2018). XFEM and its application in fatigue crack propagation of orthotropic steel bridge deck. Journal of Chongqing Jiaotong University (Natural Science), 37(4), 21–27. DOI 10.3969/j.issn.1674-0696.2018.04.04. [Google Scholar] [CrossRef]
3. Kim, J. H., Lee, S. B. (2000). Prediction of crack opening stress for part-through cracks and its verification using a modified strip-yield model. Engineering Fracture Mechanics, 66(1), 1–14. DOI 10.1016/S0013-7944(00)00006-0. [Google Scholar] [CrossRef]
4. Zhang, B., Guo, W. L. (2005). Numerical simulation of surface crack propagation considering the crack closure effects and the three-dimensional stress constraints. Chinese Journal of Computational Mechanics, 22(6), 716–721. DOI 10.3969/j.issn.1007-4708.2005.06.015. [Google Scholar] [CrossRef]
5. Qu, X. Q., Shi, D. X., Cui, H. B., Lu, C. L. (2006). Crack closure model in residual stress field of welding. Journal of Harbin Engineering University, 5, 686–689. DOI 10.3969/j.issn.1006-7043.2006.05.012. [Google Scholar] [CrossRef]
6. Liu, Z. X. (2015). Research in numerical simulation of fatigue crack propagation in long-span steel bridges (Ph.D. Thesis), Nanjing: Southeast University. [Google Scholar]
7. Wei, X., Jiang, S. (2017). Fatigue life prediction on rib-to-deck welded joints of steel bridge deck based on LEFM. Journal of Southwest Jiaotong University, 52(1), 16–22. DOI 10.3969/j.issn.0258-2724.2017.01.003. [Google Scholar] [CrossRef]
8. Wang, B. J., de, B. H., Chen, A. R. (2017). A Homogenization method on crack growth on orthotropic steel decks. China Journal of Highway and Transport, 30(3), 113–158. DOI https://dx.doi.org/10.19721/j.cnki.1001-7372.2017.03.012. [Google Scholar]
9. Qu, Y. (2018). Study on fatigue mechanism of orthotropic deck of steel bridge with box girder (Ph.D. Thesis). Chongqing: Chongqing Jiaotong University Press. [Google Scholar]
10. Wang, C. S., Zhai, M. S., Tang, Y. M., Chen, W. Z. et al. (2017). Numerical fracture mechanical simulation of fatigue crack coupled propagation mechanism for steel bridge deck. China Journal of Highway and Transport, 30(3), 82–95. DOI 10.3969/j.issn.1006-3897.2017.03.009. [Google Scholar] [CrossRef]
11. Zhou, X. H., Huang, K. (2019). Research on fatigue cracking characteristics and reinforcement method for butt welded joints of U-ribs in steel bridge deck. Journal of China & Foreign Highway, 29(3), 138–142. DOI 10.14048/j.issn.1671-2579.2019.03.028. [Google Scholar] [CrossRef]
12. Qu, Y., Gu, A. B., Zeng, Y., Du, B. S. (2018). Study on the crack plastic zone of bridge structure steel and its application. Journal of Southwest Jiaotong University, 53(4), 720–726. DOI 10.3969/j.issn.0258-2724.2018.04.008. [Google Scholar] [CrossRef]
13. Ma, Z. C. (2018). Study on residual fatigue life prediction for crack damaged offshore platform structures (Ph.D. Thesis). Dalian: Dalian University of Technology. [Google Scholar]
14. Shih, C. F., Asaro, R. J. (1988). Elastic-plastic analysis of cracks on biomaterial interface: Part I–-Small scale yielding. Journal of Applied Mechanics, 55(2), 299–316. DOI 10.1115/1.3173676. [Google Scholar] [CrossRef]
15. Walker, K., ASTM International (1970). The effect of stress ratio during crack propagation and fatigue for 2024-T3 and 7075-T6 aluminum. Effects of Environment and Complex Load History on Fatigue Life. USA: ASTM International. [Google Scholar]
16. Japan Society of Steel Construction (2012). Fatigue design recommendations for steel structures and commentary. JP: Technical Paper Hall Press. [Google Scholar]
17. Cui, C., Zhang, Q. H., Bao, Y., Bu, Y. Z., Luo, Y. (2019). Fatigue life evaluation of welded joints in steel bridge considering WRS. Journal of Constructional Steel Research, 153(7), 509–518. DOI 10.1016/j.jcsr.2018.11.003. [Google Scholar] [CrossRef]
18. Elber, W. (1971). The significance of fatigue crack closure. Damage Tolerance in Aircraft Structure, 486, 230–242. DOI 10.1520/stp26680s. [Google Scholar] [CrossRef]
19. Solanki, K., Daniewicz, S. R., Newman, J. C. (2003). Finite element modelling of plasticity-induced crack closure with emphasis on geometry and mesh refinement effects. Engineering Fracture Mechanics, 70(12), 1475–1489. DOI 10.1016/S0013-7944(02)00168-6. [Google Scholar] [CrossRef]
20. Wu, J., Ellyin, F. A. (1996). Study of fatigue crack closure by elastic-plastic finite element analysis for constant-amplitude loading. International Journal Fracture, 82(1), 43–65. DOI 10.1007/BF00017863. [Google Scholar] [CrossRef]
21. de Matos, P. F. P., Nowell, D. (2007). On the accurate assessment of crack opening and closing stresses in plasticity-induced fatigue crack closure problems. Engineering Fracture Mechanics, 74(10), 1579–1601. DOI 10.1016/j.engfracmech.2006.09.007. [Google Scholar] [CrossRef]
22. Zhao, L. L. (2015). Numerical simulation of the effect of shot peening WRS on crack growth fatigue life (Ph.D. Thesis). Jinan: Shandong University. [Google Scholar]
23. Wang, M., Qian, F. X., Yang, W. G., Yang, L. (2017). Comparison study on constitutive relationship of low yield point steels Q345B steel and Q460D steel. Engineering Mechanics, 34(2), 60–68. DOI 10.6052/j.issn.1000-4750.2016.01.0051. [Google Scholar] [CrossRef]
24. Berg, N. V. D., Xin, H. H., Veljkovic, M. (2021). Effects of welding residual stresses on fatigue crack propagation of an orthotropic steel bridge deck. Materials & Design, 198(3–4), 109294. DOI 10.1016/j.matdes.2020.109294. [Google Scholar] [CrossRef]
25. Xin, H. H., Veljkovic, M. (2020). WRS effects on fatigue crack growth rate of mild steel S355 exposed to air and seawater environments. Materials & Design, 193, 108732. DOI 10.1016/j.matdes.2020.108732. [Google Scholar] [CrossRef]
26. Zhao, Q., Wu, C. (2012). Numerical analysis of welding residual stress of U-rib stiffened plate. Engineering Mechanics, 29(8), 262–268. DOI 10.7631/issn.1000-2243.2015.06.0815. [Google Scholar] [CrossRef]
27. Kang, L. (2015). Numerical simulation of welding residual stress in both longitudinal and transverse ribs of orthotropic steel deck (Ph.D. Thesis). Chengdu: Southeast Jiaotong University. [Google Scholar]
28. Sun, Z. H. (2006). Multi-scale modeling dealing with local details for long span steel bridges and its applications (Ph.D. Thesis). Nanjing: Southeast University. [Google Scholar]
29. China National Standardization Management Committee (2015). Code for design of steel structures of highway bridges (JTG D64-2015). Beijing: Standards Press of China. [Google Scholar]
 | This work is licensed under a Creative Commons Attribution 4.0 International License, which permits unrestricted use, distribution, and reproduction in any medium, provided the original work is properly cited. |