| Computer Modeling in Engineering & Sciences |
DOI: 10.32604/cmes.2021.015365
ARTICLE
Debonding Failure in FRP Reinforced SHCC Beams Induced from Multiple Flexural-Shear Cracks under Three-Point Bending Test
Hubei Key Laboratory of Theory and Application of Advanced Materials Mechanics, School of Science, Wuhan University of Technology, Wuhan, 430070, China
*Corresponding Author: Mingqing Sun. Email: sunmqing@whut.edu.cn
Received: 13 December 2020; Accepted: 02 February 2021
Abstract: Strain hardening cement-based composites (SHCC) beam externally bonded with glass fiber-reinforced polymer (FRP) plate was examined under three-point flexural test. The effects of the type of substrate used (plain cement mortar vs. SHCC), the use or not of a FRP plate to strengthen the SHCC beam, and the thickness of the FRP plate on the flexural performances were studied. Results show that the ultimate load of SHCC beams strengthened with FRP plate has improved greatly in comparison with plain SHCC beams. The deformation capacity of beams makes little change with an increase in the thickness of FRP plates. The formation of multiple flexural-shear cracks (MFSC) is the unique feature of SHCC beams bonded with FRP plates under three-point bending. The debonding of the FRP plate is initiated from MFSC. The initiated debonding area (IDA) is formed by the joint points of the flexural-shear cracks with the FRP plate. Then the debonding strain is represented using the average strain of FRP plate within IDA, which decreases with an increase of FRP plate thickness. The experimental values of the debonding strain of SHCC beam reinforced with FRP plate are close to those predicted by the JSCE’s equation.
Keywords: SHCC; FRP; debonding strain; flexural-shear crack; initiated debonding area
The mechanical behaviors of concrete structures externally bonded with fiber-reinforced polymer (FRP) plates have been investigated widely [1–5]. Teng et al. [6] pointed out that stress concentration near the mouth of crack initiated at the FRP-concrete interface was the main factor to induce the debonding of FRP plate from concrete substrate. FIB standard suggests that the interface slip between FRP plate and concrete increases with an increase of the crack width, and the debonding failure arises once the interface slip reaches 0.185 mm [7]. From the previous studies, it can be seen that the debonding failure of the FRP plate reinforced concrete beam is closely related to the cracking properties of concrete. Strain hardening cementitious composites (SHCC) prepared using cement, fine sands, fly ash and 2.0 volume % of PVA fibers, etc., shows an excellent capacity to control the crack width within the scope of less than 100 micrometers, and high ductility and the multiple fine crack characteristics under direct tension or flexure [8,9]. Thus, the debonding process of FRP from SHCC may delay in SHCC beam reinforced with FRP plate, inducing its load carrying capacity is greater than that of a normal concrete beam bonded with FRP plate. The spacing between two adjacent fine cracks generated in the SHCC-FRP interface is far less than the effective bonding length between FRP and SHCC. So, its debonding mode may be different from that of normal concrete beam reinforced FRP plate.
Previous studies have reported that as SHCC was used as the transition layer between FRP plate and concrete in FRP plated reinforced concrete (RC) beams, it was found that the debonding of FRP from concrete was postponed and the ultimate load of the strengthened beam improved apparently [10–12]. SHCC as the transition layer was beneficial to control the width of crack generated in the interface between FRP and concrete, and reduced stress concentration in the interface [12]. The hybrid composite plates (HCPs) technique is another example to use the combination of SHCC and FRP for strengthening or repairing RC beams. HCP is a thin plate SHCC reinforced with FRP laminates. The HCPs are applied to RC beams by using epoxy adhesive or anchoring or casting directly [13–15].
However, studies on RC structures strengthened with SHCC transition layer or HCP were focused on the overall performances regarding ultimate capacity, load-deflection response, mode of failure, and ductility, etc. The cracking process in SHCC layer and SHCC-FRP interface has been paid little attention. So, in this paper concrete substrate is not involved so as to investigate the bonding characteristics of SHCC and FRP under bending. To our knowledge, studies on the whole SHCC beam reinforced with FRP plate have not been performed yet. The purpose of this work is to clarify the flexural behavior, debonding mode, and the debonding strain
SHCC was prepared using PVA fiber reinforced cement mortar composite. The diameter of the PVA fiber was 39 micrometers, and the length was 12 mm. The volume content of PVA fiber was 2.0%. Other raw materials included P.O. 42.5 cement, Class I fly ash, fine silica sand (particle
Table 1: The weight of raw materials used for the preparation of 1 m3 of SHCC

FRP plate was fabricated by impregnating several layers of unidirectional glass fiber fabric (227 g/m2) with TM-192 unsaturated polyester resin. Methyl ethyl ketone peroxide and octylic acid cobalt were used as the curing agent and accelerant, respectively. After curing, the FRP plate was cut into sheets with the size of
Table 2: The gradation of coarse sand

The mass of sand applied on the FRP plate per unit area was about 3.41 kg/m2. Finally, the coarse sand-coated-FRP plate was cured at room temperature. The finished FRP plates are shown in Fig. 1.
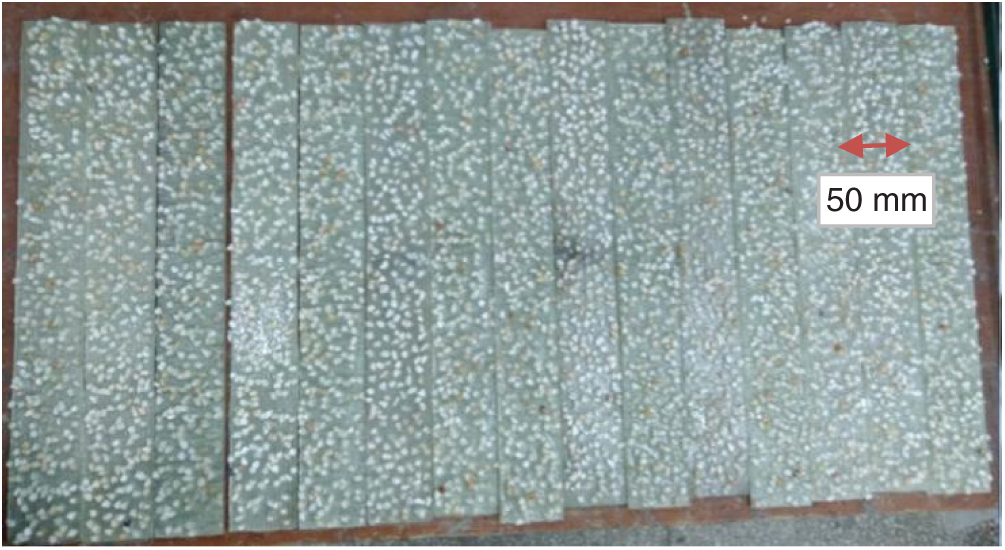
Figure 1: Coarse sand-coated-FRP sheets
After the coarse sand-coated-FRP sheet was fixed at the bottom of the mould, the fresh mixture of SHCC was poured into the mould. The mould was vibrated for 2 min to remove the air bubbles. Specimens were stored in the curing chamber for 28 days. The size of the beam was 400 mm
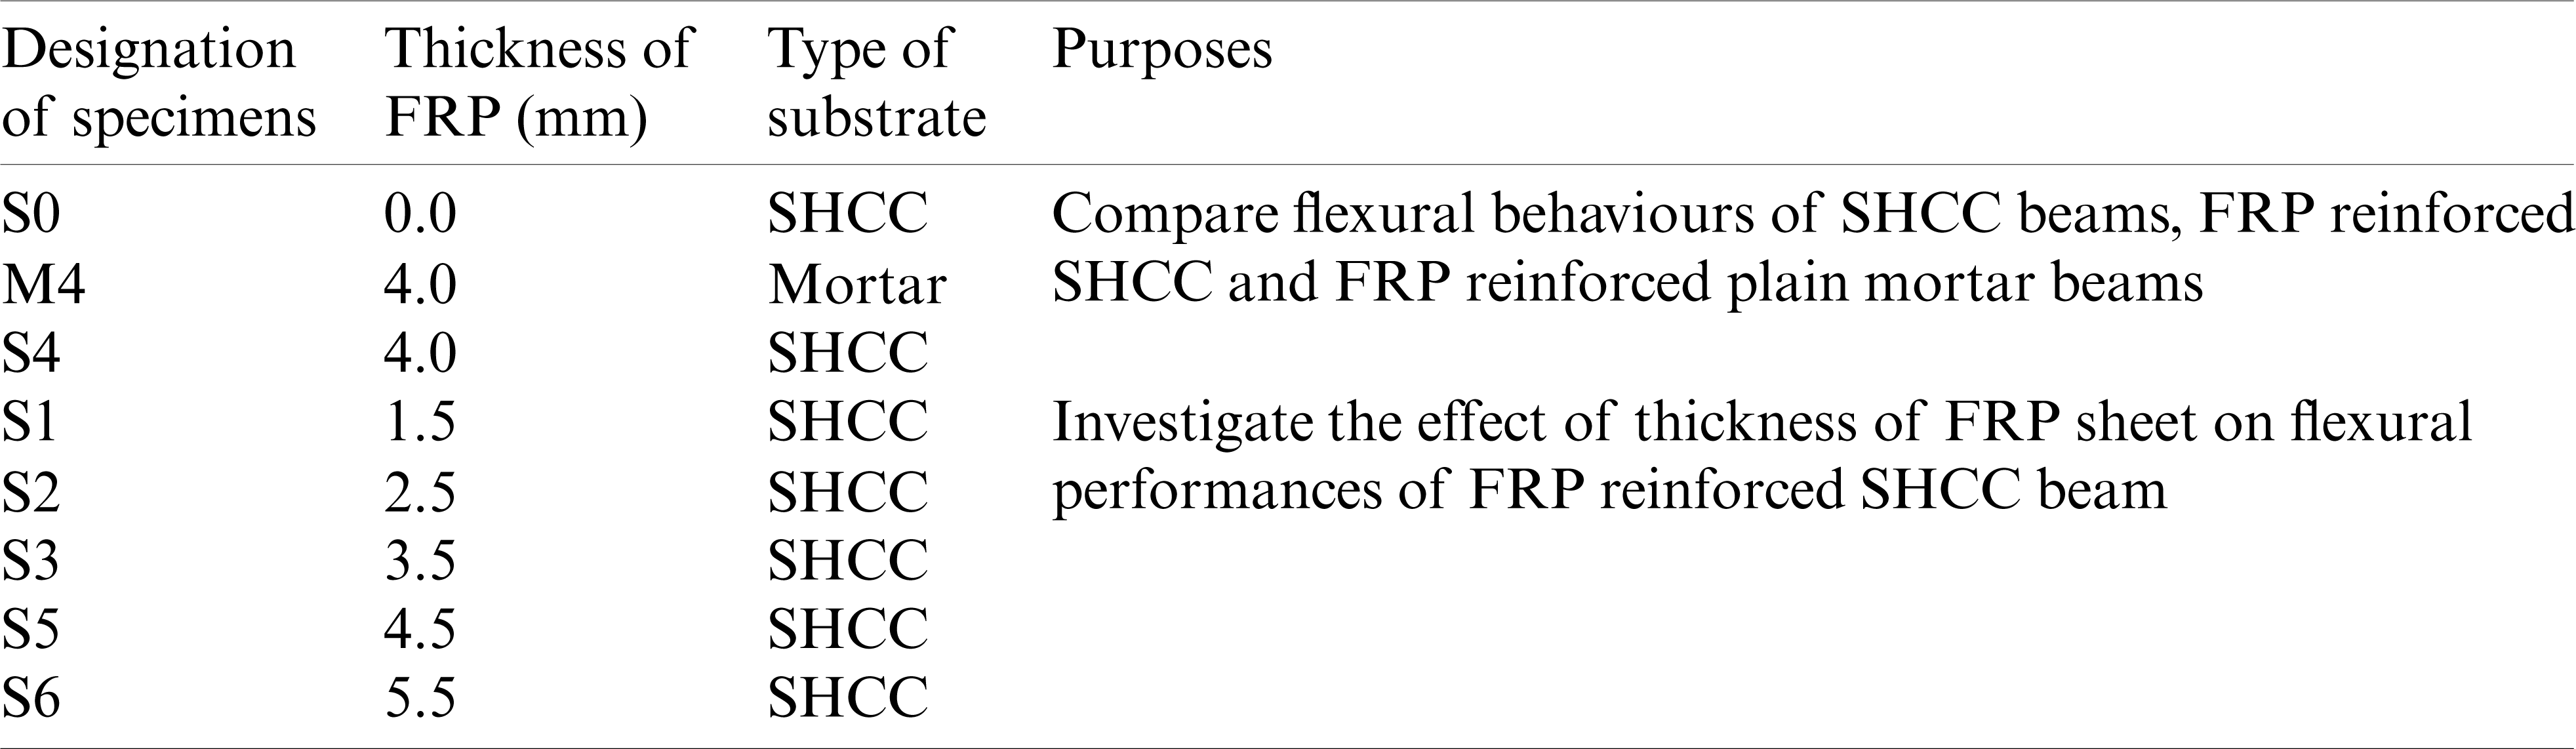
Table 3: Specimens of FRP reinforced SHCC or plain mortar beam
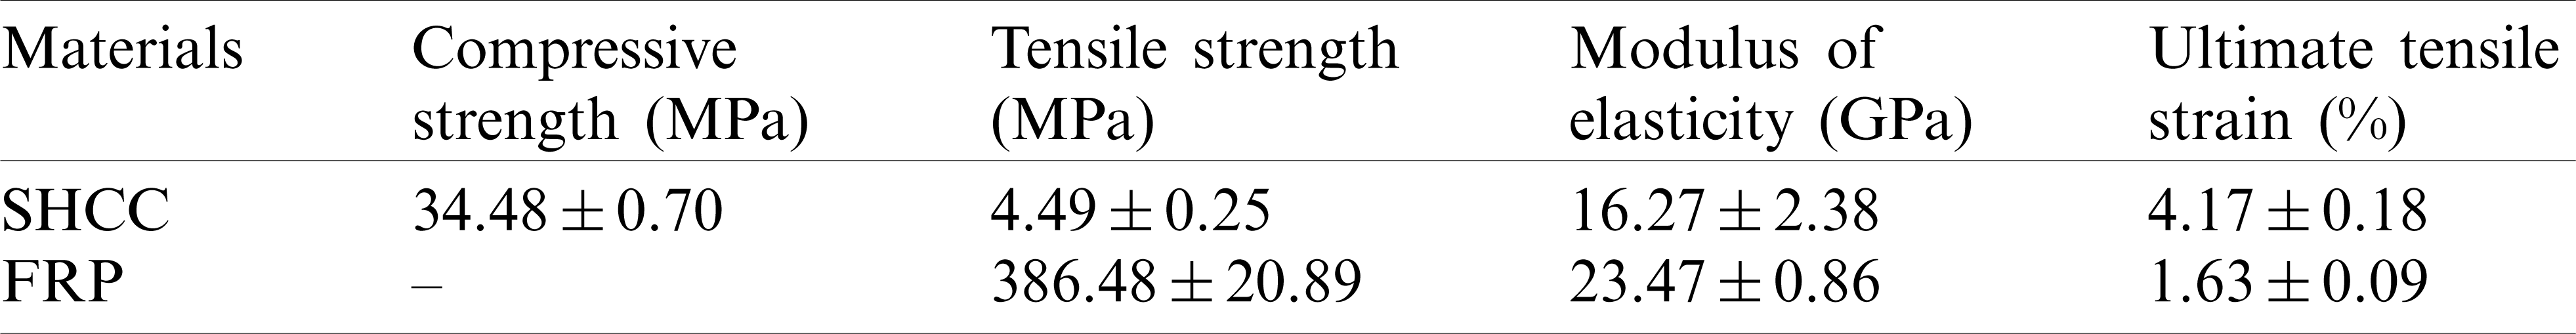
The basic mechanical properties of SHCC and FRP were measured. Specimens for measuring the tensile properties of SHCC were dumbbell-shaped in terms of JSCE recommendations [19]. 70 mm cubic specimens were used to test compressive strength in terms of JGJ 70 [20]. FRP sheets with the size of 300 mm
Table 4: Mechanical properties of SHCC and FRP
Three-point bending tests were performed on specimens. The experimental setup is shown in Fig. 2. During loading, the span was 350 mm. The loading rate was 0.1 mm/min. The deflection and cracks were measured by using the DIC (Digital Image Correlation) system (CSI Co., USA) as shown in Fig. 2a. Two digital cameras with 9 mega-pixel resolution were used to acquire images of the sprayed speckle, which was created by spraying oil paint on the front surface of the specimen. The working distance of the camera was about 800 mm from the specimen. The image acquisition frame rate was 1 frame per second (FPS). The VIC-3DTM software was used to analyze the displacement occurring at the surface of the inspected specimen during loading. Virtual clip gauges offered in the VIC-3DTM were used to measure the crack width.
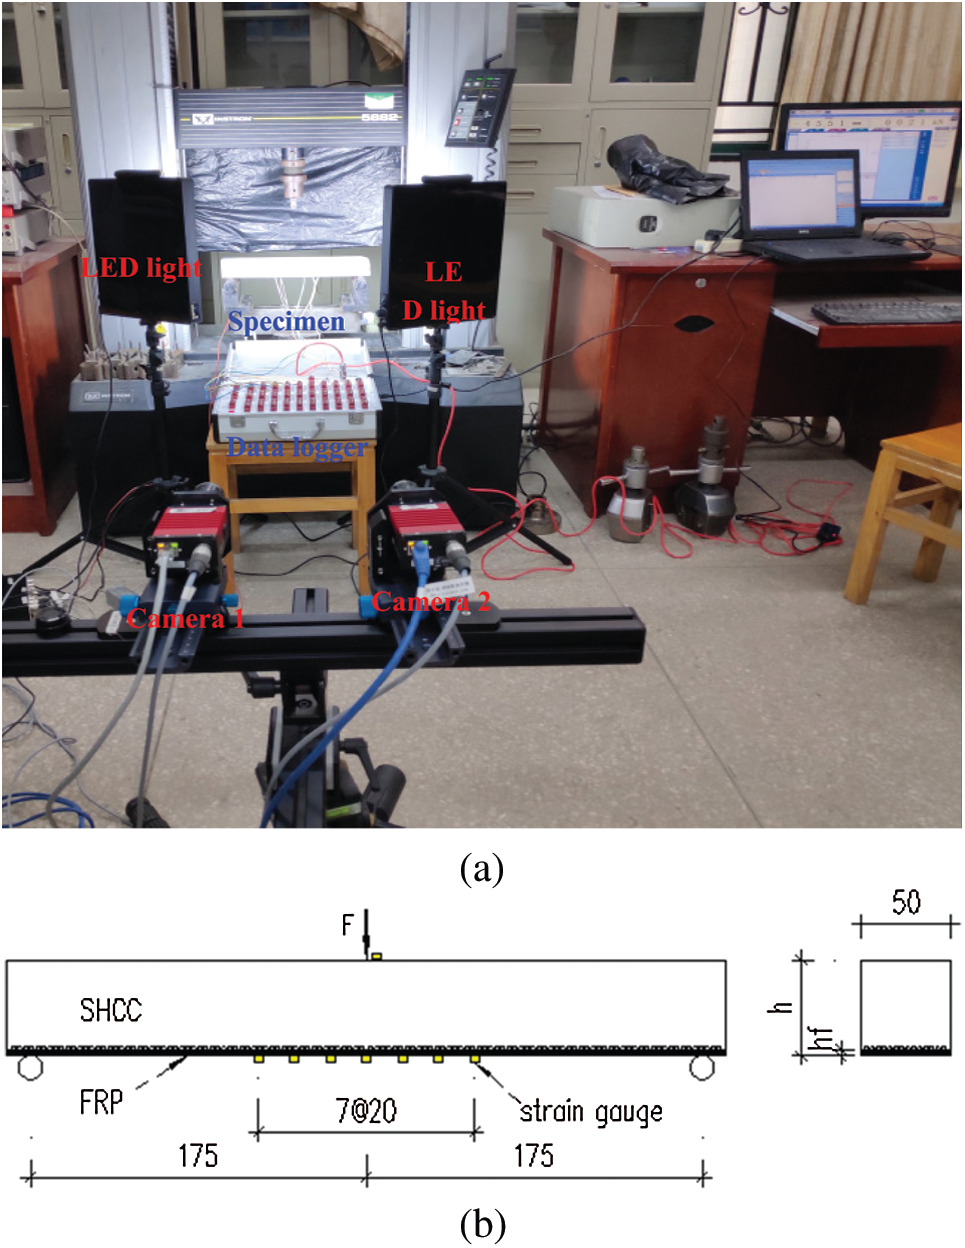
Figure 2: Setup for flexural test (a) DIC system, and (b) positions of strain gauges on the FRP plate
As shown in Fig. 2b, seven electrical resistance strain gauges with a 20-mm longitudinal spacing were stuck on the surface of the FRP sheet to monitor tensile strain. One strain gauge was adhered on the upper surface of the substrate to monitor compressive strain. The gauge length of strain gauge was 10 mm.
3.1 The Load-Deflection Responses
Fig. 3 presents curves of load vs. deflection for specimens S0, M4, and S4. As shown in Fig. 3, the deflection of specimen M4 increases linearly with the increase in the imposed load till failure, while specimens S4 and S0 exhibit flexural hardening behavior following the linear elastic stage. The ultimate loads are 2.5, 3.4, and 10.9 kN in specimens S0, M4, and S4, respectively. Compared to that of S0, load-carrying capacities of M4 and S4 increase by 36%, and 336%, respectively. The strengthening effect of the FRP plate indicates that the FRP sheet shares bending moment and hinder the extension of cracks generated in the substrate. As shown in Fig. 3, the maximum deflections (corresponding to the peak load) are 3.1, 1.0, and 3.3 mm for S0, M4, and S4, respectively. The higher deflection of S0 and S4 is attributed to high ductility and multiple fine cracking behaviors of SHCC. The slope of load-deflection curves of S4 is greater than that of S0, implying that the flexural stiffness has improved greatly as the SHCC beam is reinforced with the FRP plate. Specimen S0 has experienced a longer hardening stage than specimen S4, which may due to the higher flexural stiffness in specimen S4.
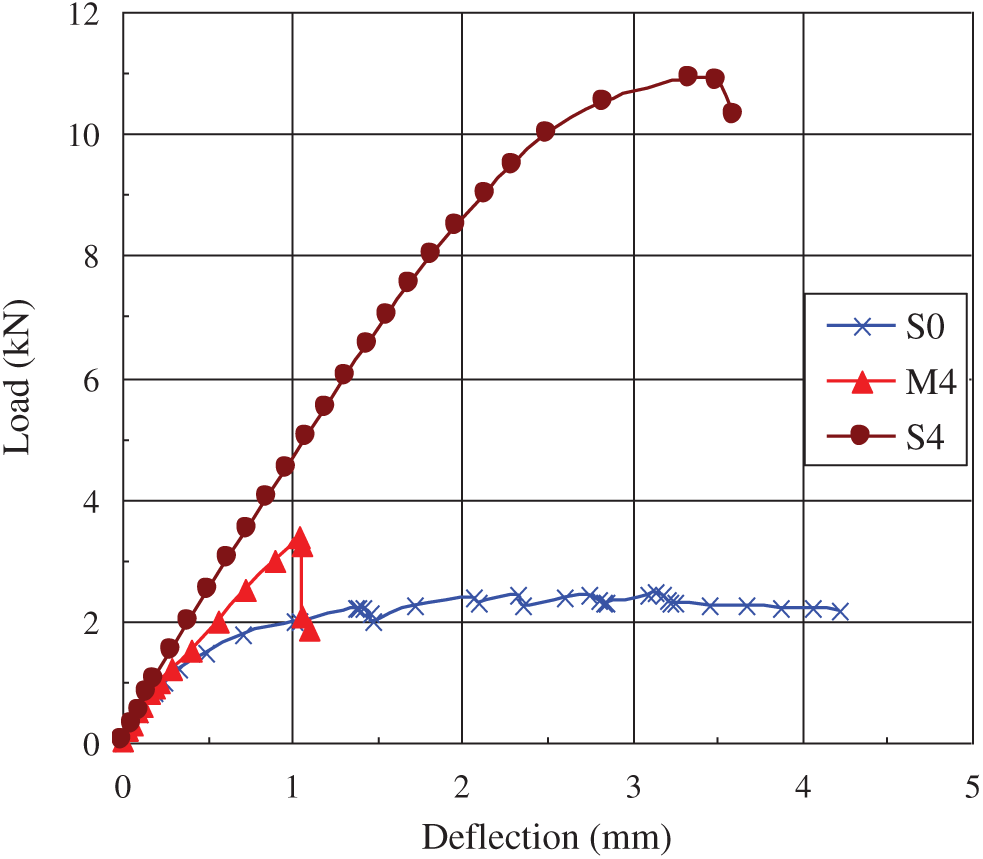
Figure 3: Load-deflection curves of specimens S0, M4, and S4
Fig. 4 displays the curves of load vs. deflection for specimens S1
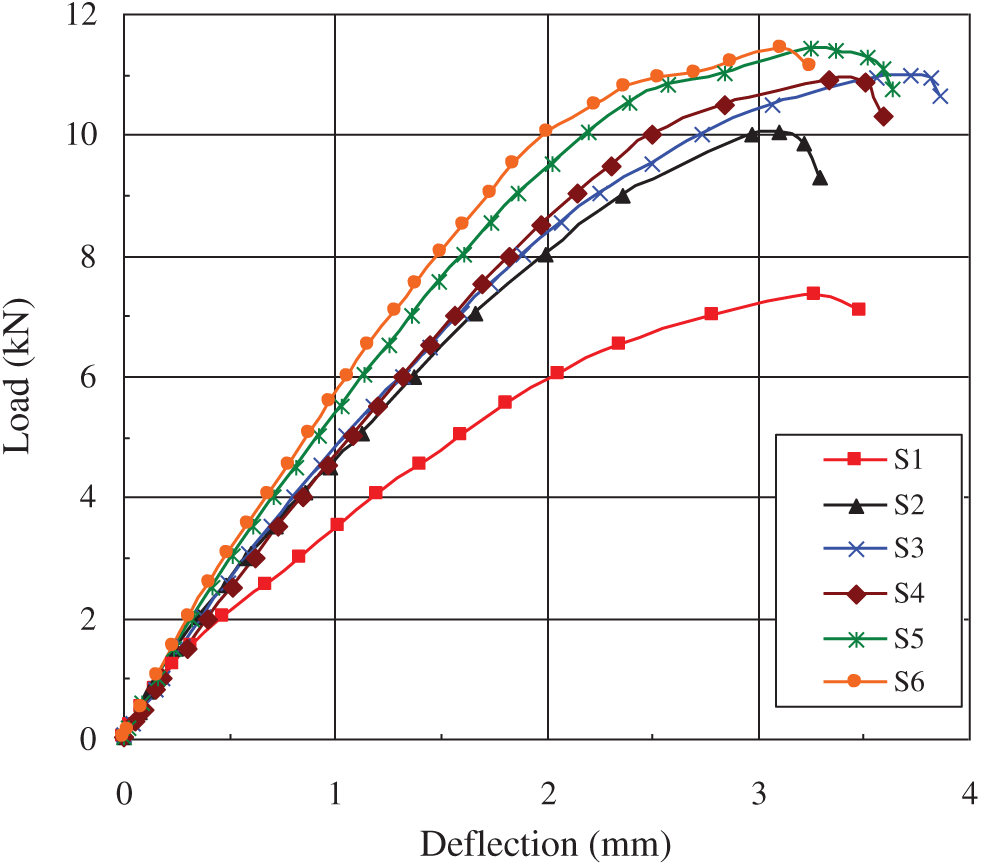
Figure 4: Load-deflection curves of specimens S1
The maximum deflections are between 3.1 and 3.7 mm for specimens S1
3.2 Crack Patterns and Debonding Modes
Crack patterns of S0, M4, and S4 are shown in Fig. 5. These images gained by using the DIC system are listed according to four loading stages such as (i) 0
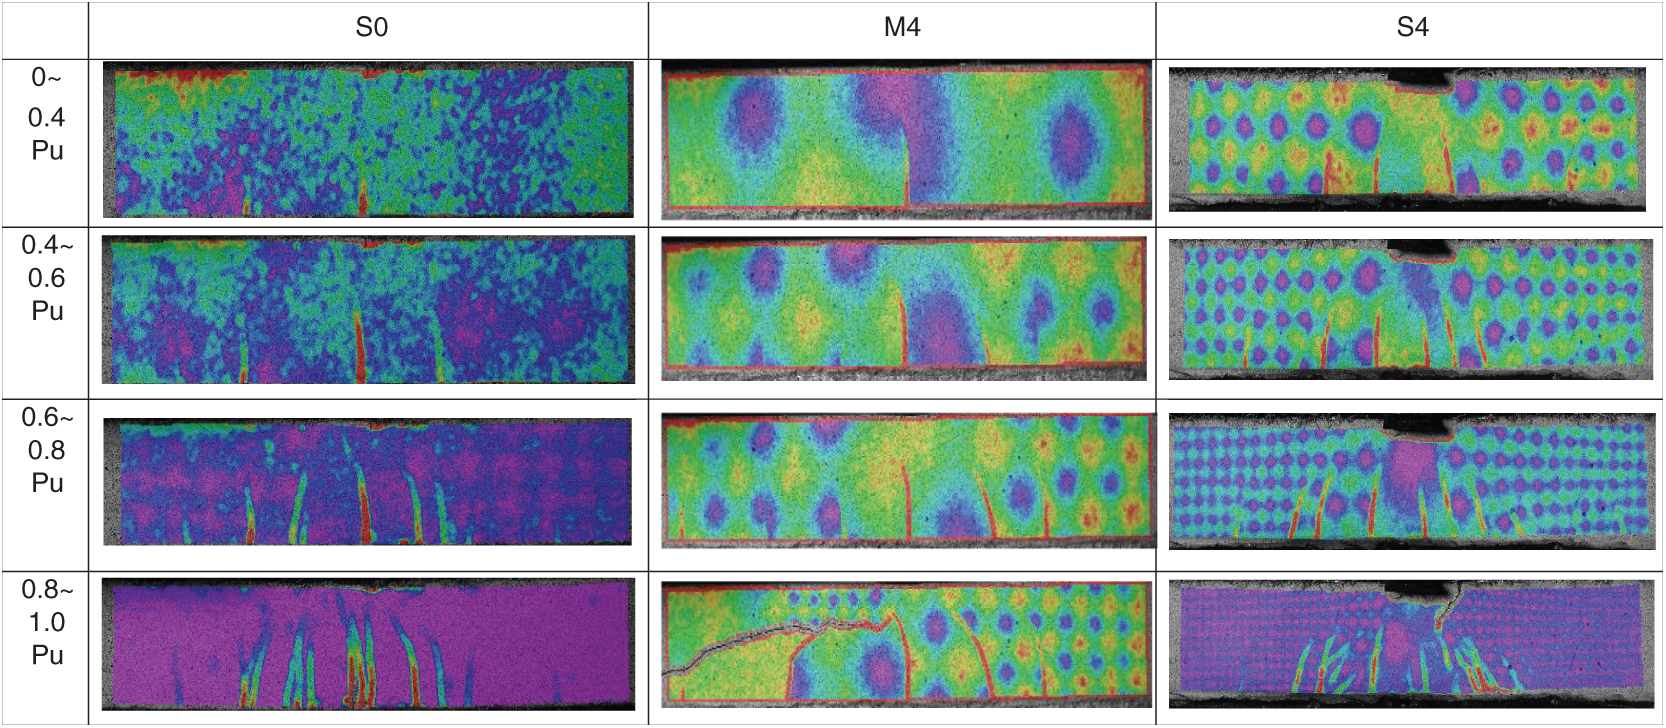
Figure 5: Crack patterns in S0, M4, and S4 measured by DIC system
In Fig. 5, the first flexural crack is initiated in specimen S0 during the first loading stage, resulting from the tensile stress is beyond the tensile strength of the matrix. With increasing applied load some parallel flexural cracks are generated. The upper ends of some flexural cracks tend to be inclined due to the shear stress. Finally, the flexural cracks extend near the upper surface of the beam. The opening of crack in specimen S0 with an increase of the applied load is shown in Fig. 6. As shown in this figure, the crack opening increases with increasing load quickly under three-point bending in specimen S0, and the maximum crack width is beyond 100
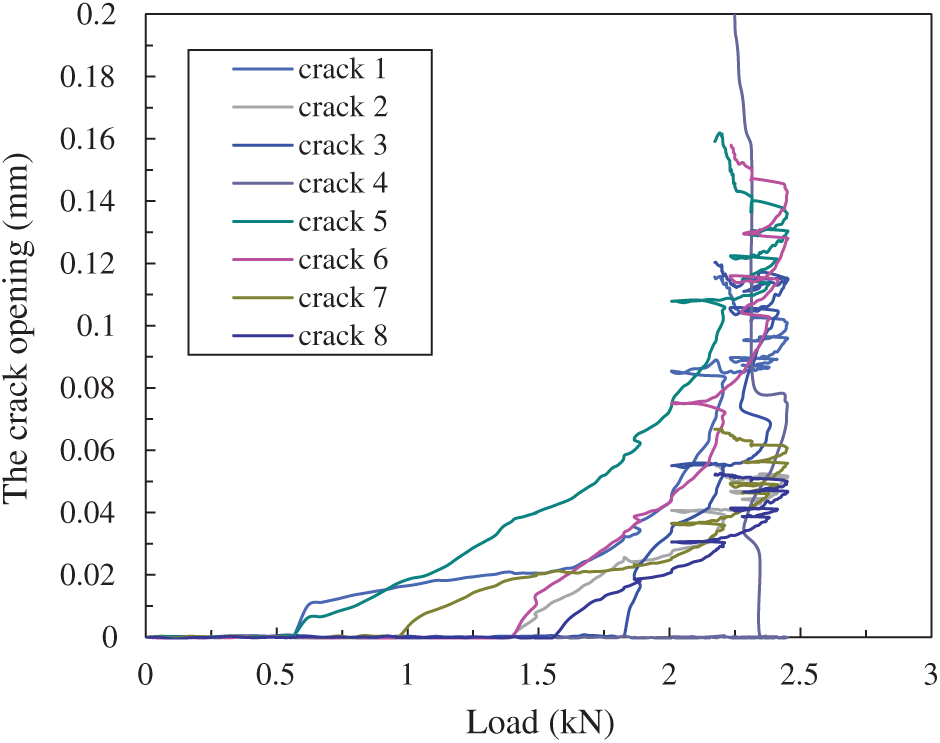
Figure 6: The opening of cracks vs. load in specimen S0
3.2.2 Plain Mortar Beams Strengthened with FRP Plate
Flexural cracks are also formed in specimen M4 during the first stage of loading. But during the final loading stage, a large diagonal crack is generated in specimen M4, and the direction of the crack is almost from the loading point to the support of the beam (see Fig. 7). It propagates quickly and connects several existing flexural cracks, finally resulting in the debonding of the FRP sheet from the substrate. This phenomenon is ascribed to the weak shear strength of the plain mortar. It is obvious that the debonding mode of the FRP plate in specimen M4 belongs to the critical diagonal crack (CDC)-induced debonding mechanism, which is related to a single critical shear crack in the member [1]. Fig. 8 shows the variation of the crack opening with an increase of load in specimen M4. It is noticed that near the ultimate load the width of CDC increases rapidly without prior warning. CDC can cause the rigid body sliding and rotation motions across the crack, thus inducing the FRP plate to debond from the root of the crack towards the plate end [1]. Due to its brittle failure, the deflection in specimen M4 is the minimum among these specimens.
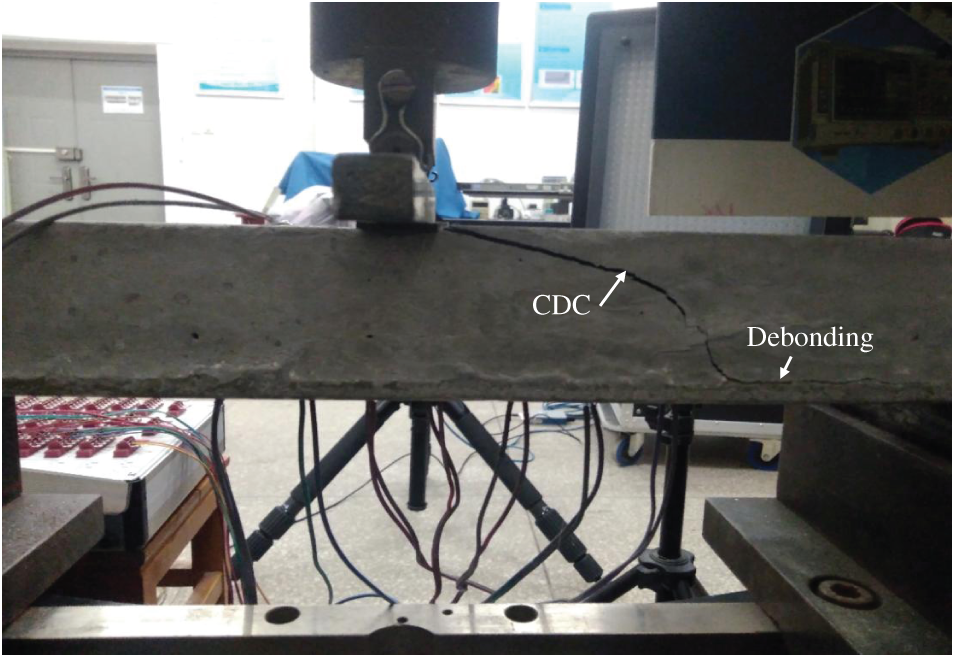
Figure 7: The CDC crack in specimen M4
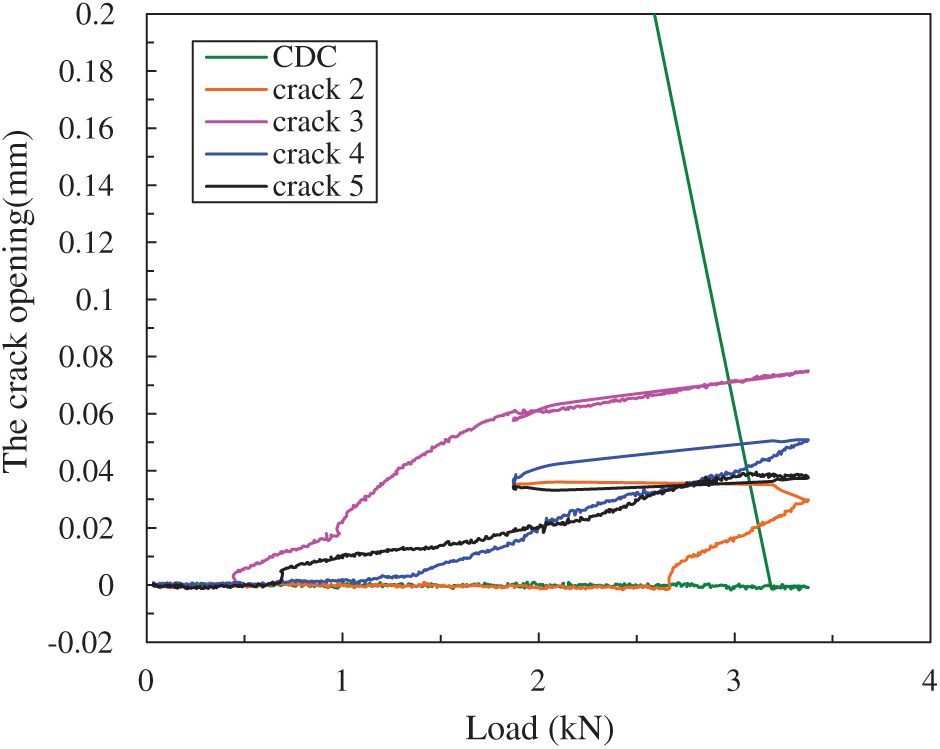
Figure 8: The opening of cracks vs. load in specimen M4
3.2.3 SHCC Beams Strengthened with FRP Plate
As shown in Fig. 5, some inclined flexural-shear cracks caused by normal stress and shear stress are generated in specimen S4 after the first loading stage. The number of flexural-shear cracks increases during loading. Especially, during the final loading stage the formation of multiple flexural-shear cracks (MFSC) is the unique feature of specimen S4 under three-point bending. It implies that the debonding mode of FRP plate in specimen S4 belongs to intermediate crack (IC) debonding initiating from MFSC. The opening of several cracks in specimen S4 with increasing imposed load is displayed in Fig. 9. The crack openings in specimen S4 increase slowly with increasing load, and the maximum crack opening is within 60
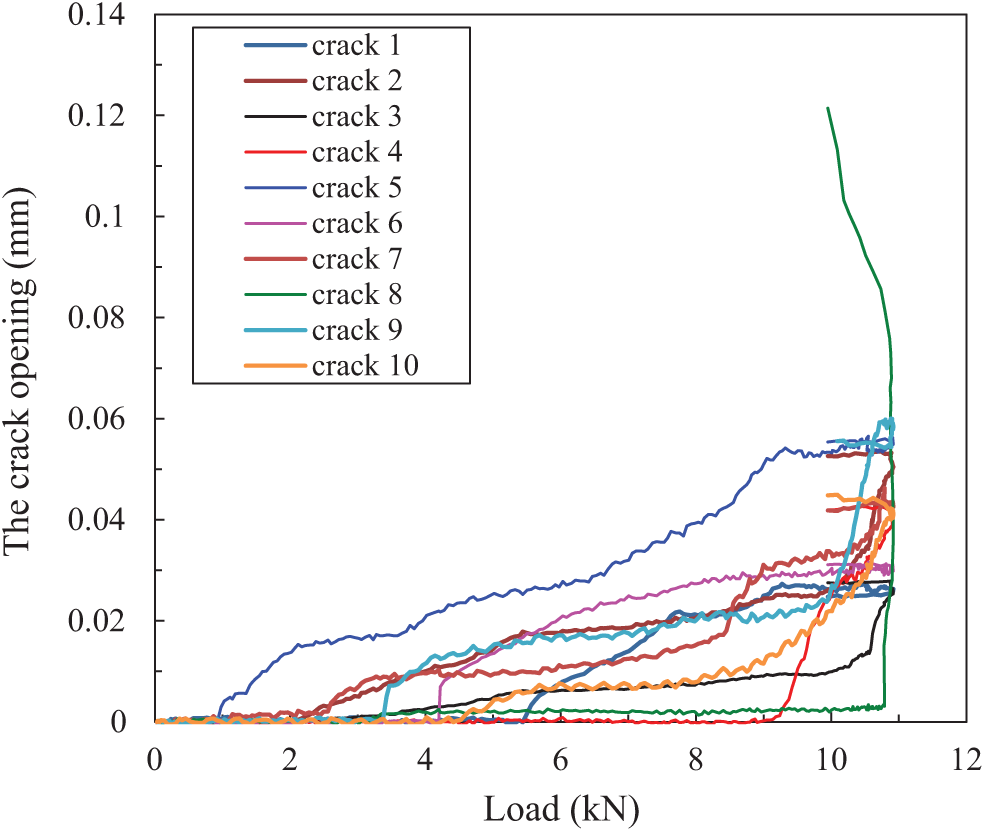
Figure 9: The opening of cracks vs. load in specimen S4
Fig. 10 shows crack patterns of specimens S1, S2, S3, S5, and S6. To simplify, Fig. 10 only provides crack patterns at the final two loading stages. It is found that the formation of MFSC is the common characteristic among these specimens. At the final loading stage the density of flexural-shear cracks seems to decrease with an increase in the thickness of the FRP plate.
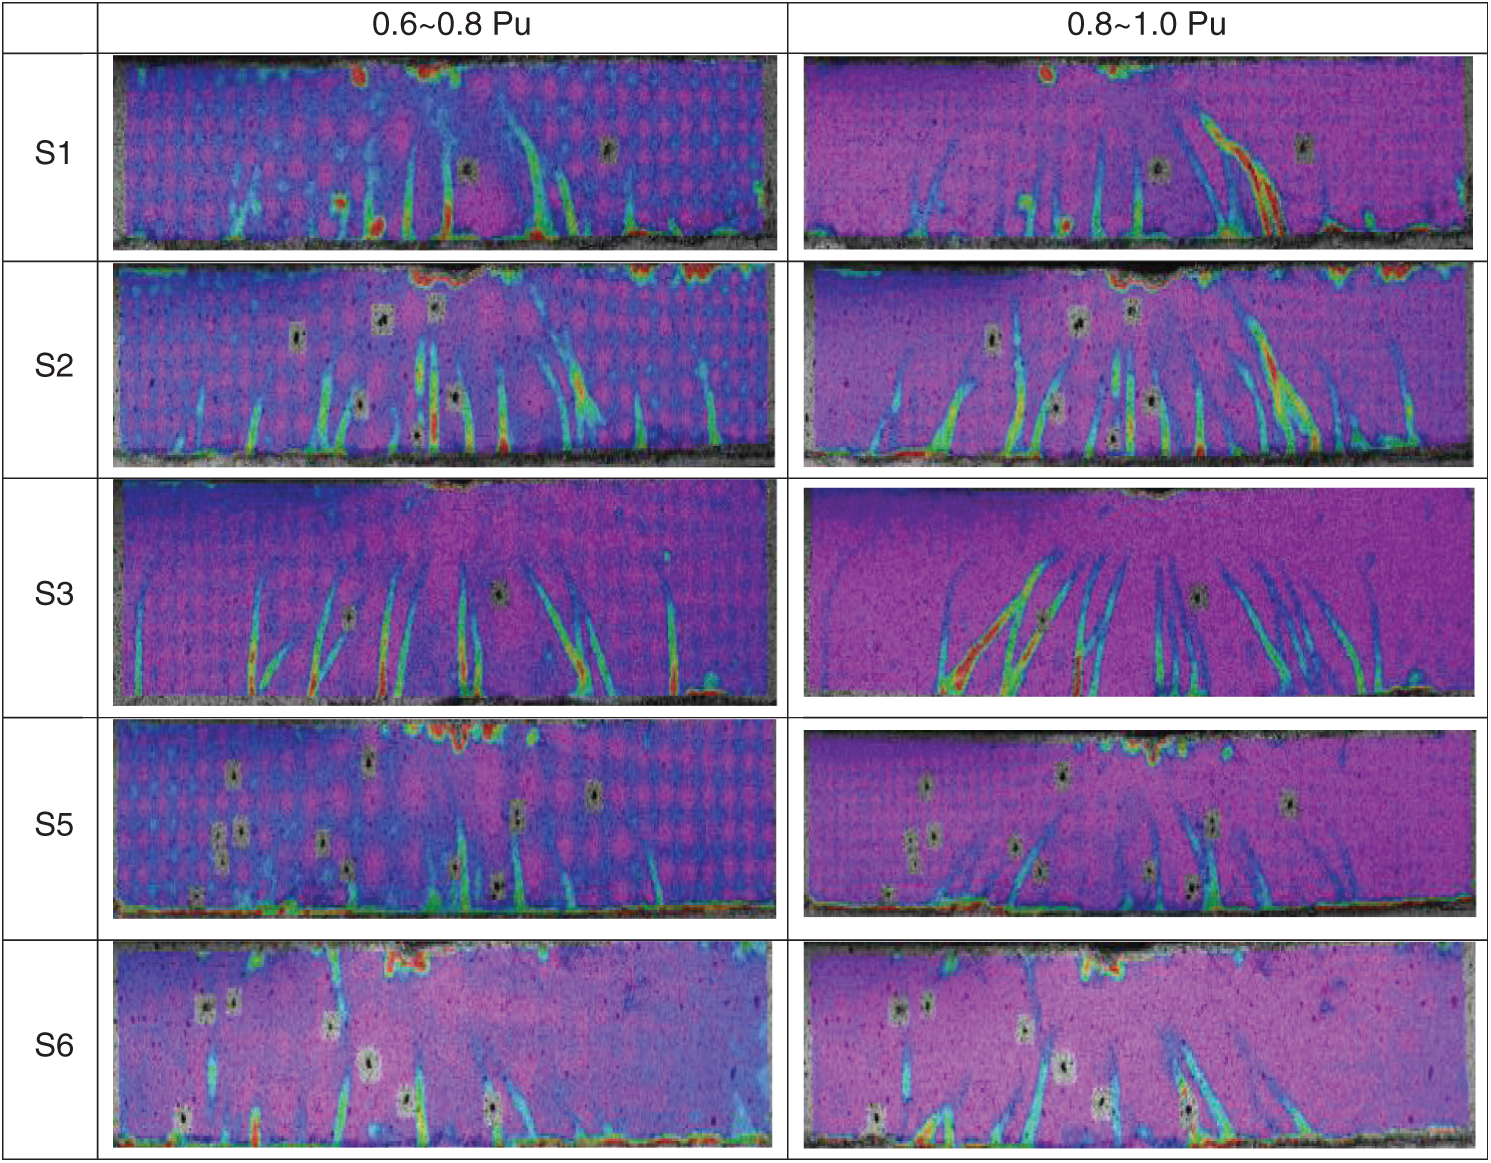
Figure 10: Crack patterns of SHCC beams bonded with different thickness of FRP plate
To observe MFSC, a thin layer of adhesive was painted on the behind surface of the specimen (the DIC system was faced the front surface) to record MFSC. Fig. 11 gives the patterns of MFSC in specimens S1
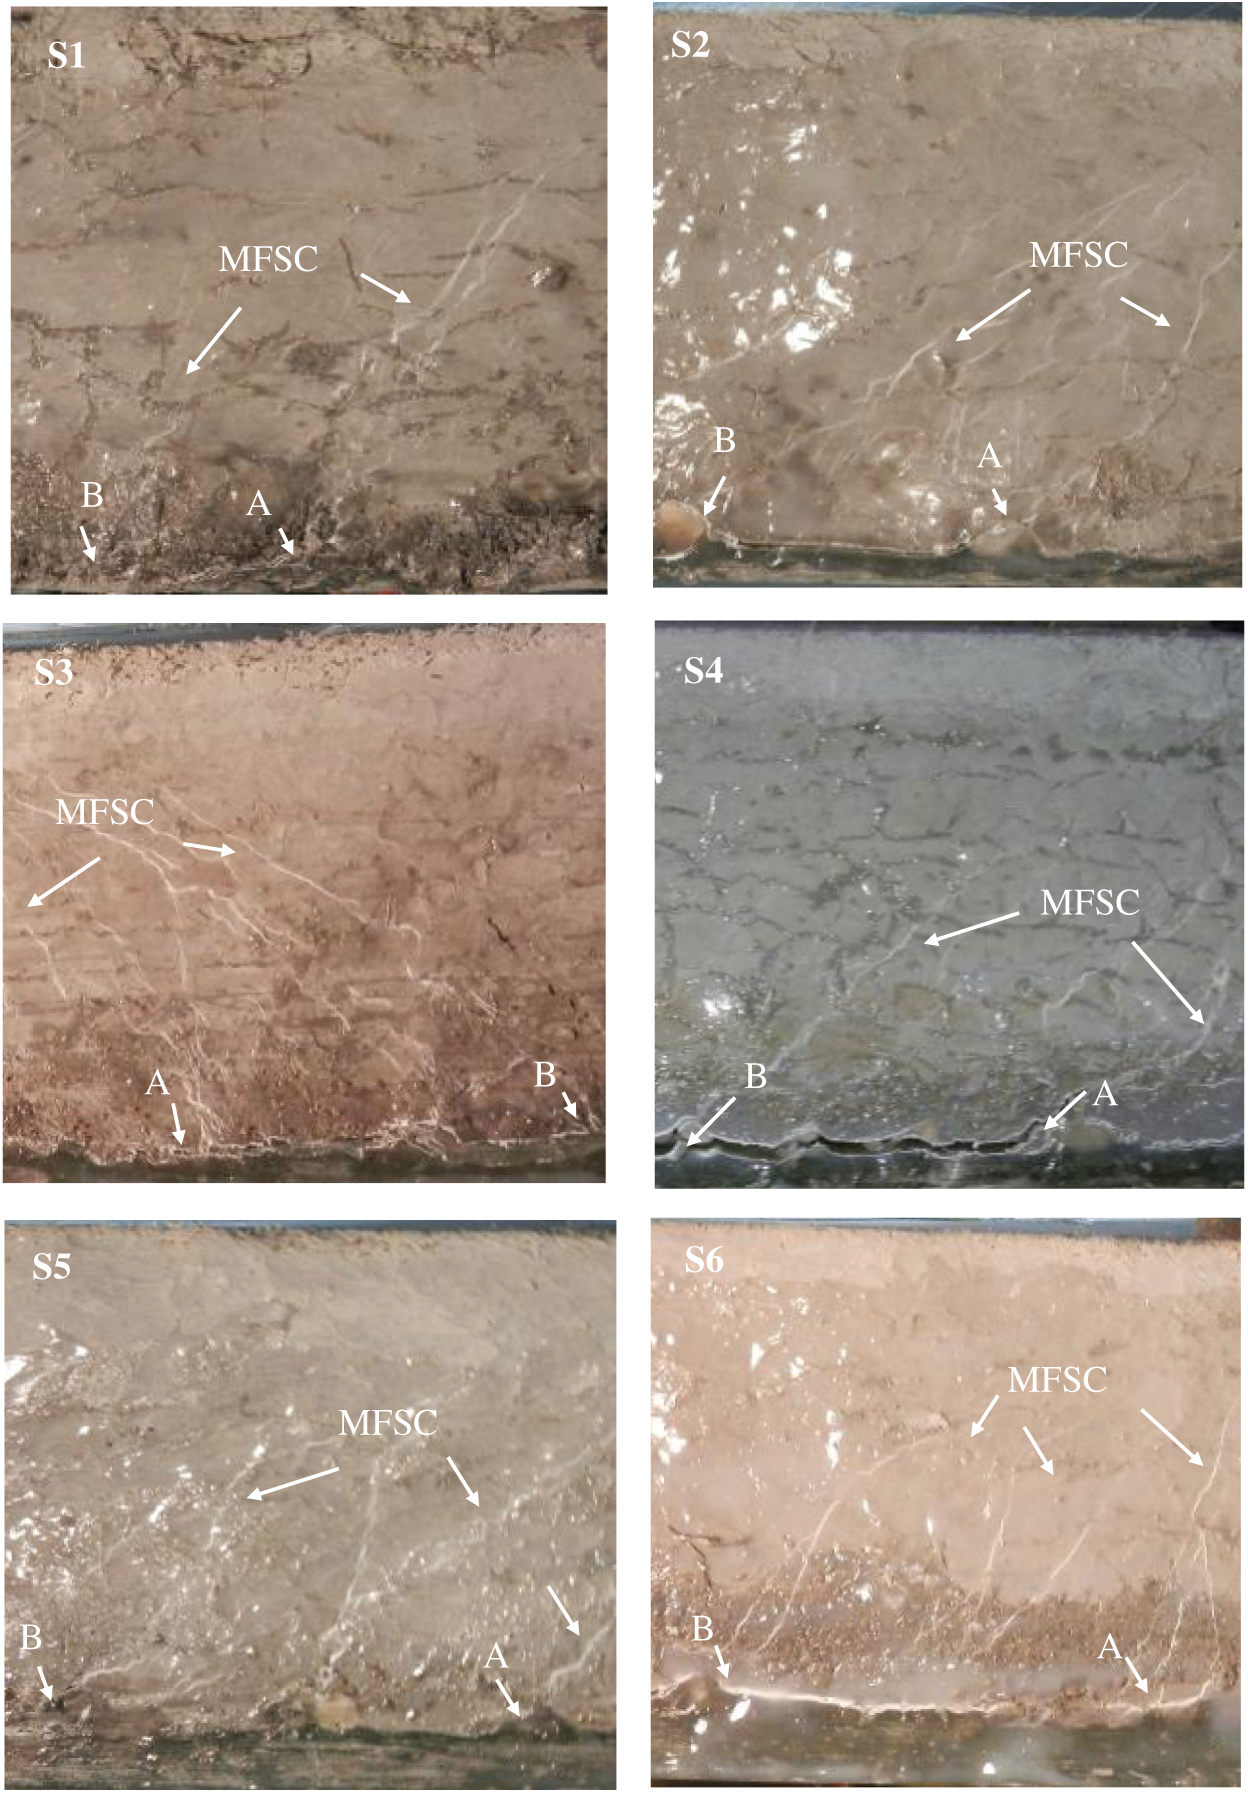
Figure 11: Patterns of MFSC in specimen S1
In specimens S1
As a crack forms on the SHCC substrate, the accommodation of the crack is accomplished by the shear strain of the coarse sand coating, thus resulting in the horizontal crack along with the SHCC-coarse sand interface since the bond strength of FRP-coarse sand interface is higher than that of the SHCC-coarse sand interface. As shown in Fig. 11, some interfacial cracks are developed around the boundary of coarse sand, which ascribes to the weak bond between SHCC and the coarse sand. Then, the deformation of the FRP sheet across the crack is equal to that of the SHCC involving the width of crack. As shown in Fig. 11, in this test the debonding of the FRP plate is not initiated from the midspan in spite that the maximum bending moment and strain happened at the position. This indicates the flexural crack at the midspan has not caused the propagation of the interface crack. However, when MFSC generates and propagates toward the interface, MFSC will bring about both the normal and shear stress upon the interface. So, the debonding induced by MFSC along the interface is in mixed-mode (i.e., including Mode I and Mode II), not in Mode II debonding as the flexural crack initiates. The debonding caused by flexural-shear crack may be much easier to initiate than that induced by the flexural crack because of the peeling effect originating from the flexural-shear crack [3]. That is, MFSC may aggravate the debonding between SHCC and the coarse sand. When several interface cracks emanate from MFSC interconnect, the debonding of FRP plate forms and propagates toward the plate end, thus the applied load decreases apparently.
As a result, the debonding of the FRP plate is initiated from the joint points (like points A and B) of the flexural-shear cracks with the FRP plate. That is, the interfacial range between point A and B is the area to initiate the debonding failure of the FRP plate, which is called as the initiated debonding area (IDA) thereinafter. So, in this paper, the average strain of FRP plate within IDA corresponding to the ultimate load is regarded as
3.3 Strains at the FRP Plate and SHCC
Fig. 12 illustrates the strain at the midspan of FRP plates, the average strain of FRP plate within IDA, and the compressive strain at the top of the beam with an increase of the imposed load for SHCC specimens strengthened with the FRP sheet. In Fig. 12, the tensile strain-load curves almost involve two phases. The first phase represents the elastic range, then at the other phase the slope of the tensile strain-load curve decreases on account of the generation of cracks. However, the slope of the tensile strain-load curve at the second stage will close to that at the first stage as the thickness of the FRP plate increases. Finally, the strain decreases suddenly at the arrival of the ultimate load due to the complete debonding of the FRP plate. Different from the tensile strain, the compressive strain increases with an increase of the applied load nonlinearly. In Fig. 12, the maximum compressive strain is about 0.5%, which is less than the ultimate compressive strain in the theoretical calculation of SHCC structures [16,24]. In the test, the crushing of SHCC is not observed. In Fig. 12, the maximum tensile strain at the FRP plate decreases while the maximum compressive strain increases with the increasing thickness of the FRP plate. This implies that the neutral axis of the beam moves downwards as the thickness of the FRP sheet increases, which may lead to the decrease in density of flexural-shear cracks with an increase of the thickness of the FRP plate (Fig. 10).
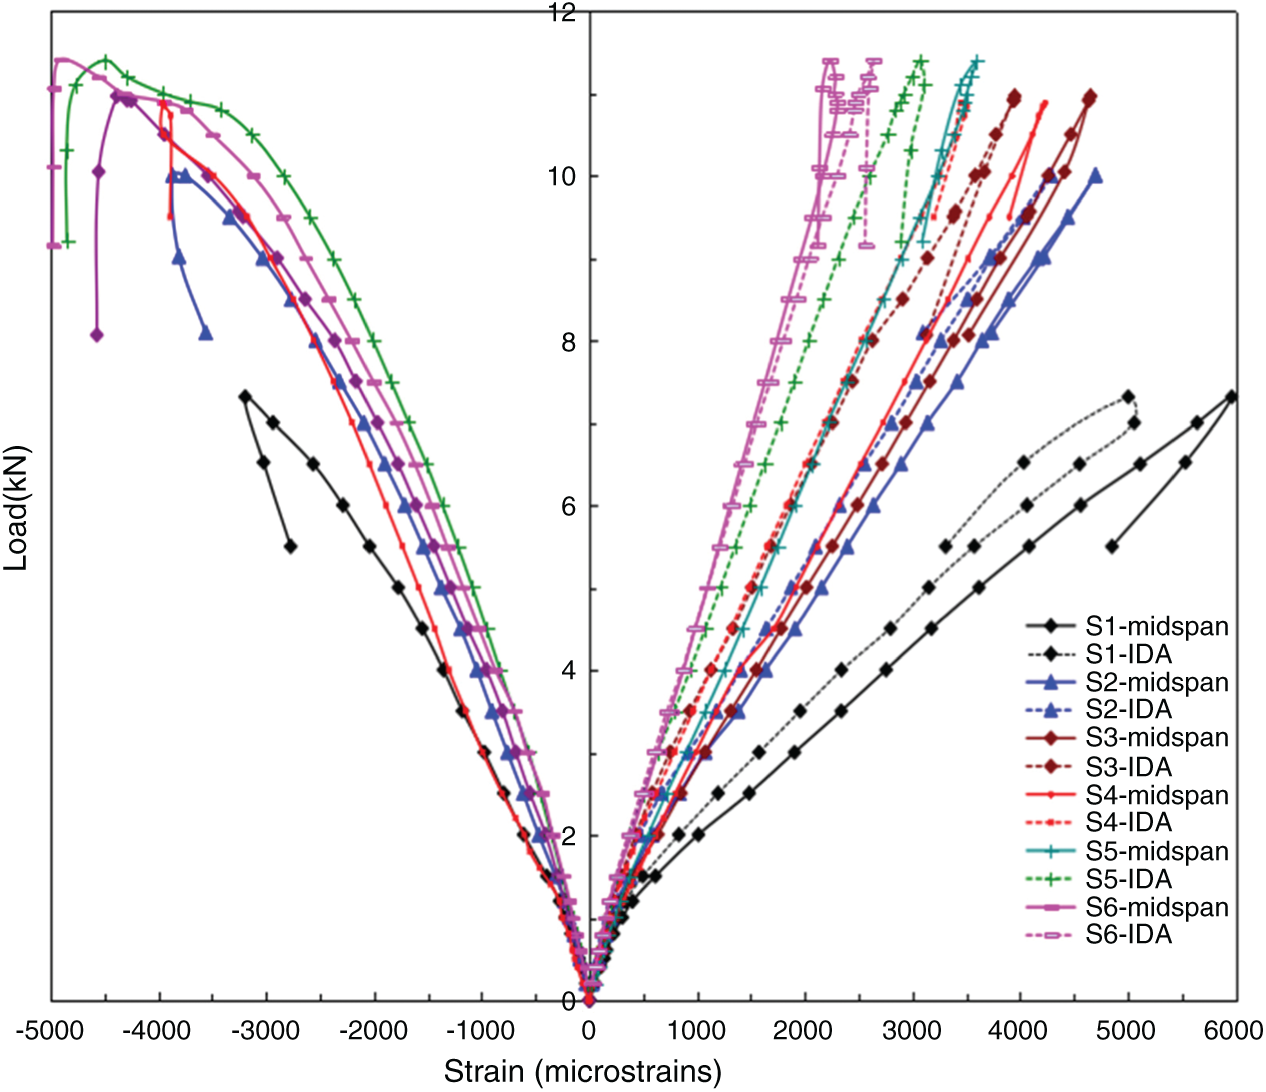
Figure 12: Tensile and compressive strain vs. load curves at the midspan (solid line) and IDA (dash line) for specimens S1
In Fig. 12, the strain at IDA (the dash lines in Fig. 12) is smaller than the strain at the midspan in specimens except for specimen S6. In specimen S6, the strain at IDA is slightly larger than the strain at the midspan.
3.4.1 Equations on Debonding Strain
There are several typical design equations on
where
where
where
where bf, b is the width of FRP and the width of the concrete beam. Here since the width of FRP and the concrete beam is 50 mm, so kb = 1.0.
Considering the mechanical properties of SHCC and FRP given in Tab. 4, and
Table 5: Experimental and predicted values of the debonding strain
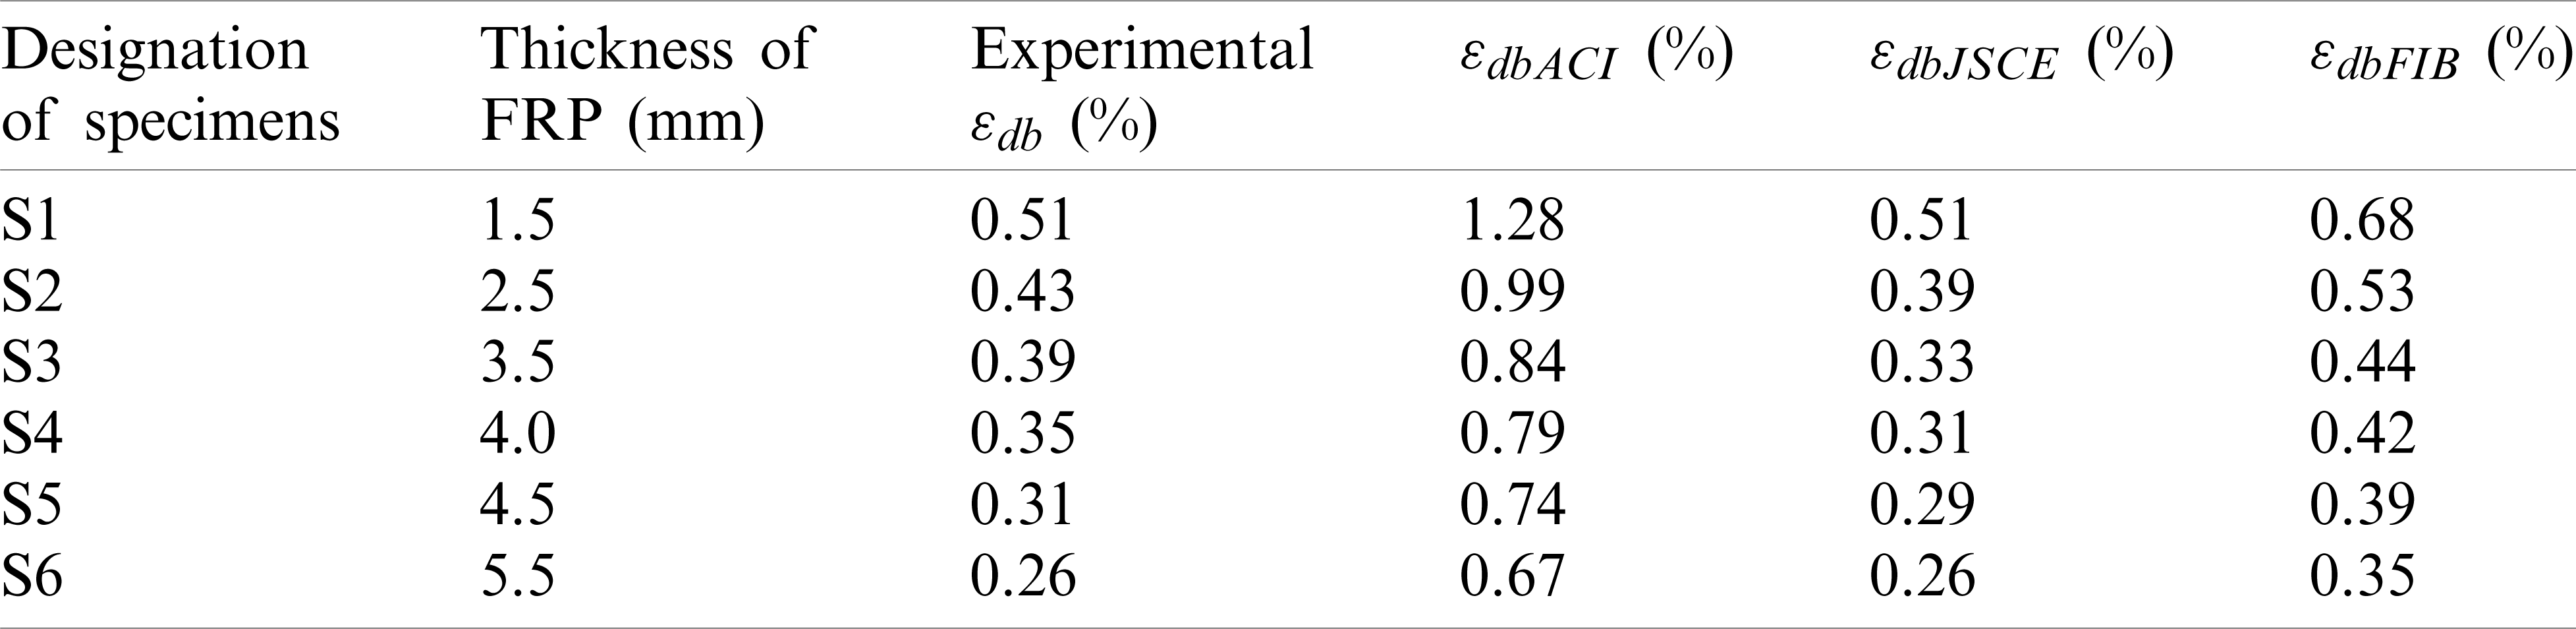
It is found that the experimental value of
3.4.2 Stress–Strain Relations of Materials for Modeling
The stress–strain relation of the SHCC material in uniaxial compression and tension can be described by bilinear stress–strain curves as shown in Figs. 13a and 13b, respectively [26]. The stress-strain relation is characterized using the following equations:
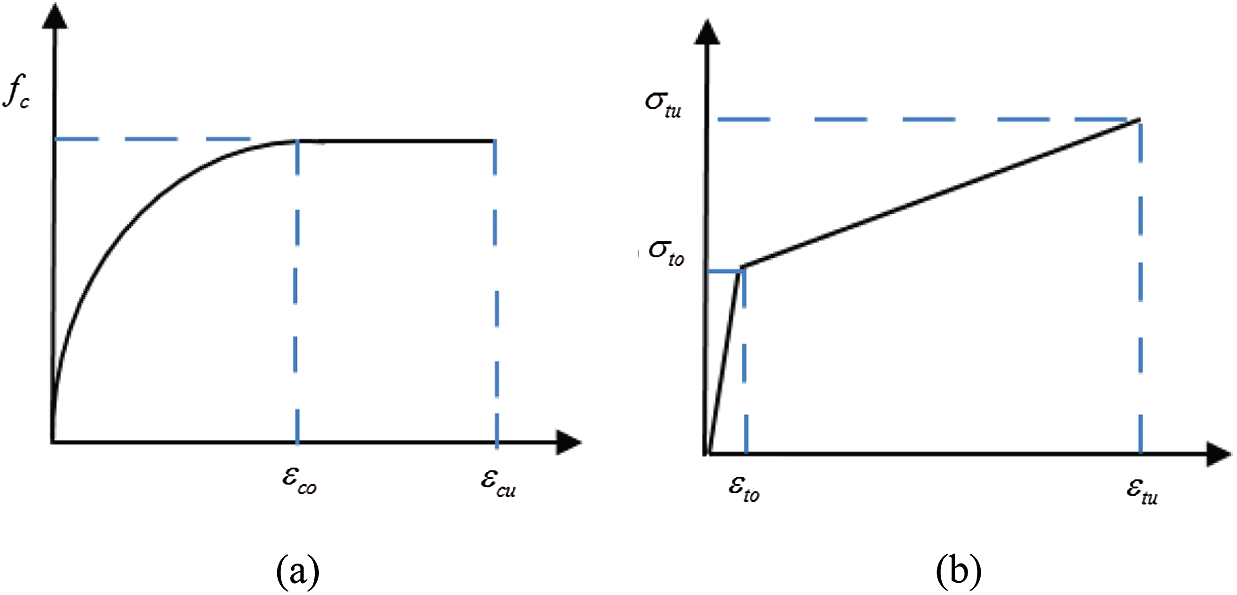
Figure 13: Stress–strain curves of SHCC in uniaxial compression (a) and tension (b)
where fc denotes compressive strength;
The stress–strain relation of FRP is assumed to be linear elastic. The linear law is adopted to described the interface bond slip relation between FRP and SHCC.
where
Based on these basic relations, an analytical model of SHCC beam reinforced with FRP plate is under investigation.
This paper investigates the flexural behavior, failure mode, and the debonding strain of SHCC and plain cement mortar beams externally bonded with FRP plate under three-point bending. The effect of the following parameters such as the type of substrate used (plain cement mortar vs. SHCC), the use or not of a FRP plate to strengthen the SHCC beam, and the thickness of the FRP plate on the flexural performances are studied. The experimental value of
1. In comparison with SHCC beams, the ultimate load of SHCC beams strengthened with FRP plate has improved greatly. The deformation capacity of SHCC beams strengthened with the FRP plate makes little change with an increase of the thickness of the FRP plates.
2. The formation of multiple flexural-shear cracks (MFSC) is the unique feature of SHCC beams bonded with FRP plates under three-point bending. The pattern of MFSC has different characteristics in SHCC beams reinforced with different thickness of FRP plates.
3. The debonding of the FRP plate is initiated from MFSC. The initiated debonding area (IDA) is formed by the joint points of the flexural-shear cracks with the FRP plate. Then the debonding strain is represented using the average strain of FRP plate within IDA, which decreases with an increase of FRP plate thickness.
4. The experimental results of the debonding strain of SHCC beam reinforced with FRP plate are close to those predicted by JSCE’s equation.
Funding Statement: This work is supported by National Natural Science Foundation of China (51608406), and the Fundamental Research Funds for the Central Universities (201114013).
Conflicts of Interest: The authors declare that they have no conflicts of interest to report regarding the present study.
1. Oehlers, D. J., Seracino, R. (2004). Design of FRP and steel plated RC structures: Retrofitting beams and slabs for strength, stiffness and ductility. Oxford, UK: Elsevier. [Google Scholar]
2. Teng, J. G., Chen, J. F., Smith, S. T., Lam, L. (2002). FRP strengthened RC structures. Hoboken, New Jersey, USA: John Wiley & Sons, Ltd. [Google Scholar]
3. Wang, J. L., Zhang, C. (2008). Nonlinear fracture mechanics of flexural-shear crack induced debonding of FRP strengthened concrete beams. International Journal of Solids and Structures, 45(10), 2916–2936. DOI 10.1016/j.ijsolstr.2008.01.004. [Google Scholar] [CrossRef]
4. Yu, H., Bai, Y. L., Dai, J. G., Gao, W. Y. (2017). Finite element modeling for debonding of frp-to-concrete interfaces subjected to mixed-mode loading. Polymers, 9(12), 438–457. DOI 10.3390/polym9090438. [Google Scholar] [CrossRef]
5. Yuan, H., Teng, J. G., Seracino, R., Wu, Z. S., Yao, J. (2004). Full-range behaviour of FRP-to-concrete bonded joints. Engineering Structures, 26(5), 553–565. DOI 10.1016/j.engstruct.2003.11.006. [Google Scholar] [CrossRef]
6. Teng, J. G., Smith, S. T., Yao, J., Chen, J. F. (2003). Intermediate crack-induced debonding in RC beams and slabs. Construction and Building Materials, 17(6–7), 447–462. DOI 10.1016/S0950-0618(03)00043-6. [Google Scholar] [CrossRef]
7. FIB. (2001). Externally bonded FRP reinforcement for RC structures. Bulletin 14, Fédération Internationale du Béton (FIBLausanne, Switzerland. [Google Scholar]
8. Li, V. C., Wu, H. C. (1992). Conditions for pseudo strain-hardening in fiber reinforced brittle matrix composites. Applied Mechanics Reviews, 45(8), 390–398. DOI 10.1115/1.3119767. [Google Scholar] [CrossRef]
9. Yang, E. H., Li, V. C. (2010). Strain-hardening fiber cement optimization and component tailoring by means of a micromechanical model. Construction and Building Materials, 24(2), 130–139. DOI10.1016/j.conbuildmat.2007.05.014. [Google Scholar] [CrossRef]
10. Maalej, M., Leong, K. S. (2005). Engineered cementitious composites for effective FRP strengthening of RC beams. Composites Science and Technology, 65(7–8), 1120–1128. DOI 10.1016/j.compscitech.2004.11.007. [Google Scholar] [CrossRef]
11. Afefy, H. M., Kassem, N., Hussein, M. (2015). Enhancement of flexural behavior of CFRP strengthened reinforced concrete beams using engineered cementitious composites transition layer. Structure and Infrastructure Engineering, 11(8), 1042–1053. DOI 10.1080/15732479.2014.930497. [Google Scholar] [CrossRef]
12. Sui, L. L., Luo, M., Yu, K., Xing, F., Li, P. et al. (2018). Effect of engineered cementitious composite on the bond behavior between fiber-reinforced polymer and concrete. Composite Structures, 184(5), 775–788. DOI 10.1016/j.compstruct.2017.10.050. [Google Scholar] [CrossRef]
13. Esmaeeli, E., Barros, J. A. O. (2015). Flexural strengthening of RC beams using Hybrid Composite Plate (HCPExperimental and analytical study. Composites: Part B, 79(6–7), 604–620. DOI 10.1016/j.compositesb.2015.05.003. [Google Scholar] [CrossRef]
14. Zheng, Y. Z., Wang, W. W., Brigham, J. C. (2016). Flexural behaviour of reinforced concrete beams strengthened with a composite reinforcement layer: BFRP grid and ECC. Construction and Building Materials, 115(8), 424–437. DOI 10.1016/j.conbuildmat.2016.04.038. [Google Scholar] [CrossRef]
15. Baghi, H., Barros, J. A. O., Rezazadeh, M. (2017). Shear strengthening of damaged reinforced concrete beams with hybrid composite plates. Composite Structures, 178(5), 353–371. DOI http://dx.doi.org/10.1016/j.compstruct.2017.07.039. [Google Scholar]
16. Li, J., Sun, M. Q., Hu, J. H., Ruan, R. T., Wang, Y. J. (2016). Structural performance of reinforced strain hardening cementitious composite pipes during monotonic loading. Construction and Building Materials, 114(8), 794–804. DOI 10.1016/j.conbuildmat.2016.03.185. [Google Scholar] [CrossRef]
17. Cho, K. H., Cho, J. R., Chin, W. J., Kim, B. S. (2006). Bond-slip model for coarse sand coated interface between FRP and concrete from optimization technique. Computers and Structures, 84(7), 439–449. DOI 10.1016/j.compstruc.2005.10.004. [Google Scholar] [CrossRef]
18. Cho, J. R., Cho, K. H., Park, S. Y., Kim, S. T., Kim, B. S. (2010). Bond characteristics of coarse sand coated interface between stay-in-place fibre-reinforced polymer formwork and concrete based on shear and tension tests. Canadian Journal of Civil Engineering, 37(5), 706–718. DOI 10.1139/L10-012. [Google Scholar] [CrossRef]
19. JSCE. (2008). Design and construction of high performance fiber reinforced cement composites with multiple fine cracks. Concrete Engineering Series 82, Japan: Japan Society of Civil Engineers. [Google Scholar]
20. JGJ. (2009). Standard for test method of performance on building mortar. JGJ, vol. 70. Beijing: China Building Industry Press. [Google Scholar]
21. GB. (1999). Test method for tensile properties of oriented fiber reinforced plastics GB/T, vol. 3354. Beijing: Standard Press of China. [Google Scholar]
22. Li, V. C., Mishra, D. K., Naaman, A. E., Wigh, J. K., LaFave, J. M. et al. (1994). On the shear behavior of engineered cementitious composites. Journal of Advanced Cement Based Materials, 1(3), 142–149. DOI 10.1016/1065-7355(94)90045-0. [Google Scholar] [CrossRef]
23. Kang, S. B., Tan, K. H., Zhou, X. H., Yang, B. (2017). Experimental investigation on shear strength of engineered cementitious composites. Engineering Structures, 143, 141–151. DOI 10.1016/j.engstruct.2017.04.019. [Google Scholar] [CrossRef]
24. Maalej, M., Li, V. C. (1994). Flexural/tensile-strength ratio in engineered cementitious composites. Journal of Materials in Civil Engineering, 6(4), 513–528. DOI 10.1061/(ASCE)0899-1561(1994)6:4(513). [Google Scholar] [CrossRef]
25. ACI. (2008). Guide for the design and construction of externally bonded FRP systems for strengthening concrete structures. American Concrete Institute (ACI) Committee 440. ACI 440.2R. Michigan, USA: Farmington Hills. [Google Scholar]
26. JSCE,. (1997). Recommendations for upgrading of concrete structures with use of continuous fiber sheets. Tokyo: Japan Society of Civil Engineers. [Google Scholar]
27. Niu, H. D., Wu, Z. S. (2006). Effects of FRP-concrete interface bond properties on the performance of RC beams strengthened in flexure with externally bonded FRP sheets. Journal of Materials in Civil Engineering, 18(5), 723–731. DOI 10.1061/(ASCE)0899-1561(2006)18:5(723). [Google Scholar] [CrossRef]
 | This work is licensed under a Creative Commons Attribution 4.0 International License, which permits unrestricted use, distribution, and reproduction in any medium, provided the original work is properly cited. |