DOI: 10.32604/cmes.2021.011821
ARTICLE
1School of Computer and Software, Nanjing University of Information Science and Technology, Nanjing, 210044, China
2Faculty of Computer Science and Engineering, University of Information Science and Technology, Ohrid, 6000, Republic of Macedonia
*Corresponding Author: Sunil Kr. Jha. Email: 002891@nuist.edu.cn
Received: 30 May 2020; Accepted: 04 December 2020
Abstract: Ohrid trout (Salamo letnica) is an endemic species of fish found in Lake Ohrid in the Former Yugoslav Republic of Macedonia (FYROM). The growth of Ohrid trout was examined in a controlled environment for a certain period, thereafter released into the lake to grow their natural population. The external features of the fish were measured regularly during the cultivation period in the laboratory to monitor their growth. The data mining methods-based computational model can be used for fast, accurate, reliable, automatic, and improved growth monitoring procedures and classification of Ohrid trout. With this motivation, a combined approach of principal component analysis (PCA) and support vector machine (SVM) has been implemented for the visual discrimination and quantitative classification of Ohrid trout of the experimental and natural breeding and their growth stages. The PCA results in better discrimination of breeding categories of Ohrid trout at different development phases while the maximum classification accuracy of 98.33% was achieved using the combination of PCA and SVM. The classification performance of the combination of PCA and SVM has been compared to combinations of PCA and other classification methods (multilayer perceptron, nave Bayes, random committee, decision stump, random forest, and random tree). Besides, the classification accuracy of multilayer perceptron using the original features has been studied.
Keywords: Salamo letnica; growth phase; modeling; PCA; SVM
Lake Ohrid (area of 358 km2) is mainly located in the Former Yugoslav Republic of Macedonia (FYROM) and partly in Albania. It is home to more than 200 endemic species, including the algae, crabs, eels, snails, and fish species (Salamo ohridanus, and Salamo letnica, etc.), etc., of the Salmonidae family [1–4]. Ohrid trout (Salmo letnica) is a unique breed of the Salmonidae family. The activities of the inhabitants and tourists, especially during summer affect the ecosystem of the lake and the species living inside it. For instance, the presence of polycyclic aromatic hydrocarbons (PAH) resulting from human activity was identified in the muscle samples of fish species [5]. Consequently, there is an urgent need to initiate both the governmental and non-governmental projects to save such a huge and oldest ecosystem and the living endemic species. The conservation projects and monitoring program to save the ecosystem of Lake Ohrid have been detailed in [6]. In a related study, the risk and the necessity of Lake Ohrid biodiversity protection have been reviewed in detail [7]. Some research studies are available in the published literature based on the biological investigation of Ohrid trout to promote its population growth; e.g., the ontogenetic development [8], genetic and morphological characterization [9], liver ultrastructure characterization [10], cytological of Sertoli cells [11], genetic architecture [12], external morphology [13], spleen histology during the reproductive cycle [14], breeding cycle [15,16], and mitochondrial DNA differentiation [17], etc. Though, it is hard to find any published study based on the computational modeling approach for growth monitoring of the Ohrid trout.
2 Literature Review and Objective of the Present Study
Statistical and machine learning-based data mining methods have been successfully implemented in the development of an improved decision system of aquaculture in the past studies, e.g., fuzzy inference system in the modeling of soil microbial dynamics [18]; optimum-path forest, support vector machine (SVM), Bayes classifier, multilayer perceptron (MLP), and self-organizing maps to control the aquatic weeds (maximum accuracy of  %) [19]; the decision tree-based ensemble approach (maximum accuracy of 75%), SVM, Bayes network, MLP, and radial basis function in the prediction of shellfish farm closure [20]; time-series classification in the prediction of shellfish farm closure [21]; SVM in the fish species classification [22]; and quadratic classifier and SVM in the classification of feeding and fasted fish (maximum accuracy of
  %) [23], etc. Besides, in some recent studies, artificial bee colony-water temperature mechanism algorithm in the prediction of the temperature of prawn [24], particle swarm optimization to determine the optimal production strategies of fish [25], a neuro-fuzzy method in the feeding system of fish (accuracy of 98%) [26], an ensemble of wrappers in the fish age classification [27], convolutional neural network (CNN) and SVM methods in the classification of normal vs. defective fillets [28], CNN and MLP in the prediction of dissolved oxygen of aquaculture systems [29], and feature extraction algorithms in the automatic tuna sizing [30], etc., have been implemented.
From the literature survey, it is obvious that several statistical and machine learning-based data mining methods have been used in the automation of aquaculture and fisheries for different applications. Amongst them, SVM is the most widely used and successful method [19,20,22,23,28,31–33]. Though, the application of data mining methods specifically the SVM, and its combination with some feature extraction methods in monitoring the growth of the Ohrid trout haven’t explored yet. This is the main motivation behind the present study to implement a combination of principal component analysis (PCA) and SVM in the development stages discrimination of Ohrid trout (Salmo letnica).
It is essential to monitor the growth of Ohrid trout in the initial stage regularly. Though, the manual procedures of growth monitoring, including the development stage classification and the differentiation of experimental and natural groups of Ohrid trout by using their external features, is a time and cost-consuming process. The external features of Ohrid trout, like length, breadth, and weight, etc., are highly correlated. PCA is a statistical multivariate method that transforms the correlated features into linear uncorrelated features. Therefore, the PCA method was used in the discrimination of development stages of the Ohrid trout as well as the discrimination of two categories (experimental and natural breeding groups) using their measured features. Due to the wide acceptance and the great achievement of the SVM model for the decision support system of aquaculture in the past studies, it has been used for the quantitative classification of different development stages and two categories of Ohrid trout using the PC scores of original experimental measurement in the present study. The external features of the Ohrid trout, including the length (in mm), breadth (in mm), and weight (in g) were measured for the two different categories of natural and experimental populations in three different development stages (different months of growth). The measured features of Ohrid trout were used in the input of PCA and SVM. The rest part of the study is organized as follows. The implementation details of the PCA and SVM have been discussed in Section 3. The detailed experimental procedures have been presented in Section 4. The analysis results have been compiled and presented in Section 5. The conclusion and future scope of the study are summarized in Section 6.
3 Growth Stages Modeling Procedures
The measurements were compiled in the form of a matrix which results in a dataset  of the natural population and
  of experimental population and used in the growth stage modeling. Before PCA analysis, the data was preprocessed by the logarithmic scaling.
3.1 Growth Stage Modeling Using PCA
PCA was used for the qualitative discrimination of the development stages of Ohrid trout using their measured features of the natural and experimental population. PCA is a commonly used multivariate method for qualitative discrimination of multidimensional datasets. In the present study, PCA was used to transform Ohrid trout samples from measurement space into 3D principal components (PC) space. The PCs (generated by the linear combination of original experimental variables) have maximum variance and minimum correlation. The basic steps of PCA include (i) Mean centering of the dataset by subtracting each of the measured features from their mean value  , where xij is the value of jth feature of the ith sample, and
  is the mean value of jth feature; (ii) Calculation of the covariance matrix
  ; (iii) Factorization of covariance matrix into eigenvalues and eigenfunctions by solving the characteristic equation
  , where
  represents the eigenvalues; (iv) Selection of few significant PC directions according to their eigenvalues; and (v) Transformation of a dataset x into the PC space [33,34]. The ‘stats’ package of R [35] was used in the implementation of the PCA method.
3.2 Classification of Growth Stages Using SVM
SVM method has been used for classification, clustering, regression, and outlier detection, etc. in a different application in past studies. In the present study, SVM was used for the quantitative class discrimination of growth stages and population types of Ohrid trout using the PC scores of their measured features as input. Specifically, the SVM method was used in the classification of three growth stages of Ohrid trout and their natural and experimental populations. The SVM builds an optimal separating decision hyperplane that maximizes the distance with the closest points (support vectors). The decision hyperplane is the weighted sum of training vectors (x) and bias (b) and formulated as

where y denotes the value of the class,  signifies class-1
  , and
, and  denotes class-2
  for a binary class training dataset
  . The weight vector
  and bias value were computed by maximizing the margin
  under constraint
  . The quadratic optimization method is mostly used to calculate the weight and bias using Lagrange multiplier
  and maximization of
  under constraint
  and
and  . This results in
  and
and  . The class decision function of a test data is defined according to Eq. (2).

In the dual formulation of the quadratic optimization problem, instead of using the dot product of data points in high dimensional feature space, a kernel function is used to reduce the mathematical complexity. The kernel function is formulated as  . The polynomial, sigmoid, and RBF, etc., are the widely used kernel functions. By using the kernel trick, the earlier dual optimization can be reformulated as
  under the condition
  and
and  . The class decision function in Eq. (2) using kernel function has been defined according to Eq. (3).

For a multiclass dataset, the training dataset was divided into combinations of several binary classes, and the model was trained using each of them. In the validation phase, the test data points were classified using binary class trained models. The final decision was made based on the majority voting on the decision of binary class models. The details of the SVM method are available in [34–37]. The ‘e1071’ package in R [38,39] was used in the implementation of the SVM method [39]. The polynomial kernel results in the maximum classification accuracy of the training datasets of experimental and natural populations of three development stages. Three-fold cross-validation was used in SVM analysis.
4.1 Location of Experimental Area and Source of Experimental Data
The study area was the Hydrobiological Institute (established in 1935) in Ohrid, FYROM for controlling experiments and Lake Ohrid for natural experiments. The Hydrobiological Institute is situated on the city side of Lake Ohrid. The Lake Ohrid lies between the latitude of  N–
N– N and longitude of
  E–
E– E, and the central point of
  N–
N– E shown in Fig. 1 [40]. Ohrid has humid subtropical weather and an annual average temperature of 16.7–6.2
 C. The Hydrobiological Institute is the oldest research organization in Ohrid, FYROM, working for the growth of Salamo letnica and other endemic species. The main focus of the institute is to increase the number of Salmo letnica by experimental and natural breeding procedures.
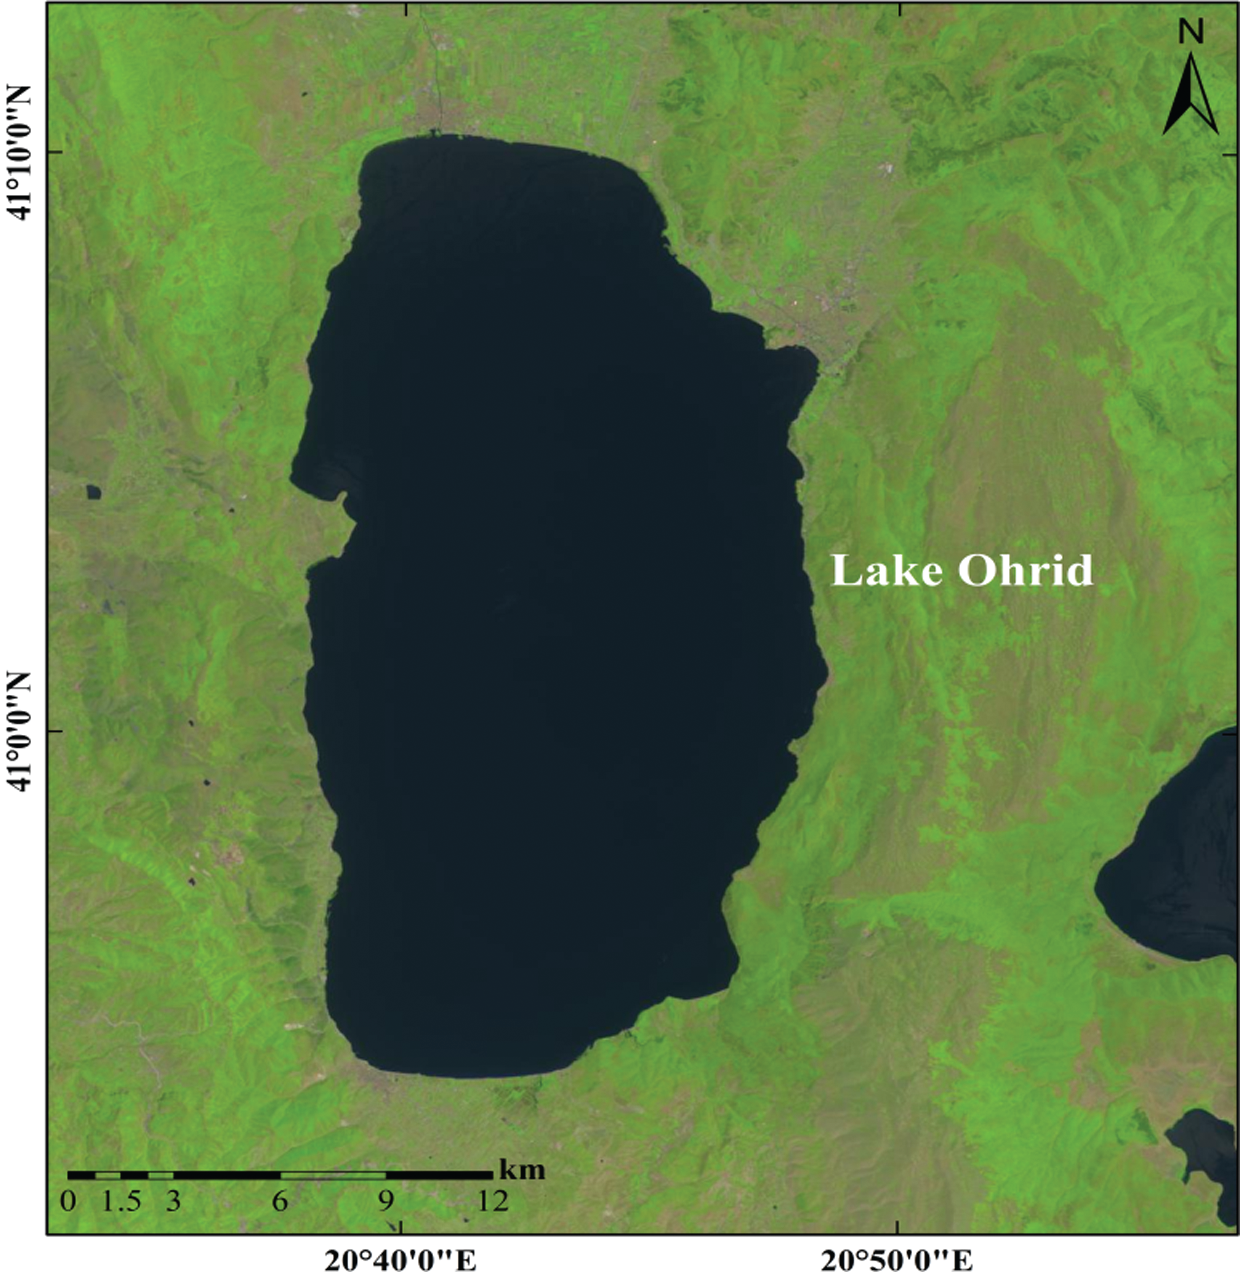
Figure 1: The location map of Lake Ohrid
4.2 Experimental Conditions, Procedures, and Measurement
The experiment starts with the organized fertilization in which the breeding and the growth of the Ohrid trout to a certain period was controlled in the laboratory of Hydrobiological Institute. The process begins around 21st January ( 5–6 days) every year by using the boats to catch fish and breed them. A special anesthetic (eugenol between 25 to 100 mg/L) was used for Ohrid trout after catching. The anesthetic is harmless to the fish and used to receive eggs and sperms. After that, the features of fish were measured (length and width using a standard measuring board and weight using the digital electronic balance), and then the fish were marked and released into the lake. The female fish leaves eggs in a separate water carrier from the male fish. Afterward, they were combined under special conditions and treated very carefully in the Institute. The growth of the fish was carefully monitored in the following three stages: (a) The first 36–40 days (the development of the fetus), (b) The next 30–40 days (the embryo develops and looks like a fish, but has an external abdomen that helps in feeding), and (c) After this period, the fish is more independent and learns how to survive in the simulated conditions. The growth stages of Ohrid trout have been demonstrated in Fig. 2. More specifically, Fig. 2a exhibits the fetus stage of the Ohrid trout. The next development stages in the third month and after that are shown in Figs. 2b and 2c, respectively, which represents the continuous growth process of Ohrid trout in the controlled environment. Three features of Ohrid trout, including length, breadth, and weight were measured in two different categories: (i) Experimental category (the amount of the food provided exceed the needs of the fish, therefore only a few of them do not survive throughout the process), and (ii) Natural category (limited food was provided to the fish), the reason behind this is to have more trained fish that will survive in the lake after releasing. The latter method supports the Salmo letnica to grow their natural population. The experimental category contains
  10000 samples per year and the natural category contains
  3 million samples per year. The environment of the growth stages (Figs. 2a–2c) contains tubs of dimension
  . Both of the categories of fish were fed with the same food ‘frozen planktons’ or ‘zooplanktons’ which can be found in any ocean, lake, and river. The size of the zooplanktons was in the range of 0.3–0.5 mm similar to the natural environment. Finally, both categories of fish released into the lake after eight months of birth with an approximate length of 8 cm and a weight of 3.5 g (Fig. 2d). In the present study, the length, breadth, and weight of one hundred and eighty samples of Ohrid trout in September 2017, December 2017, and May 2018 of the natural population category (sixty samples of each of the three months) and one hundred and eighty samples of Ohrid trout of the experimental population category (sixty samples of each of the three months) have been used in modeling. The external feature of the Ohrid trout does not differ significantly from year to year. Tab. 1 summarizes the basic statistics of experimental measurements.
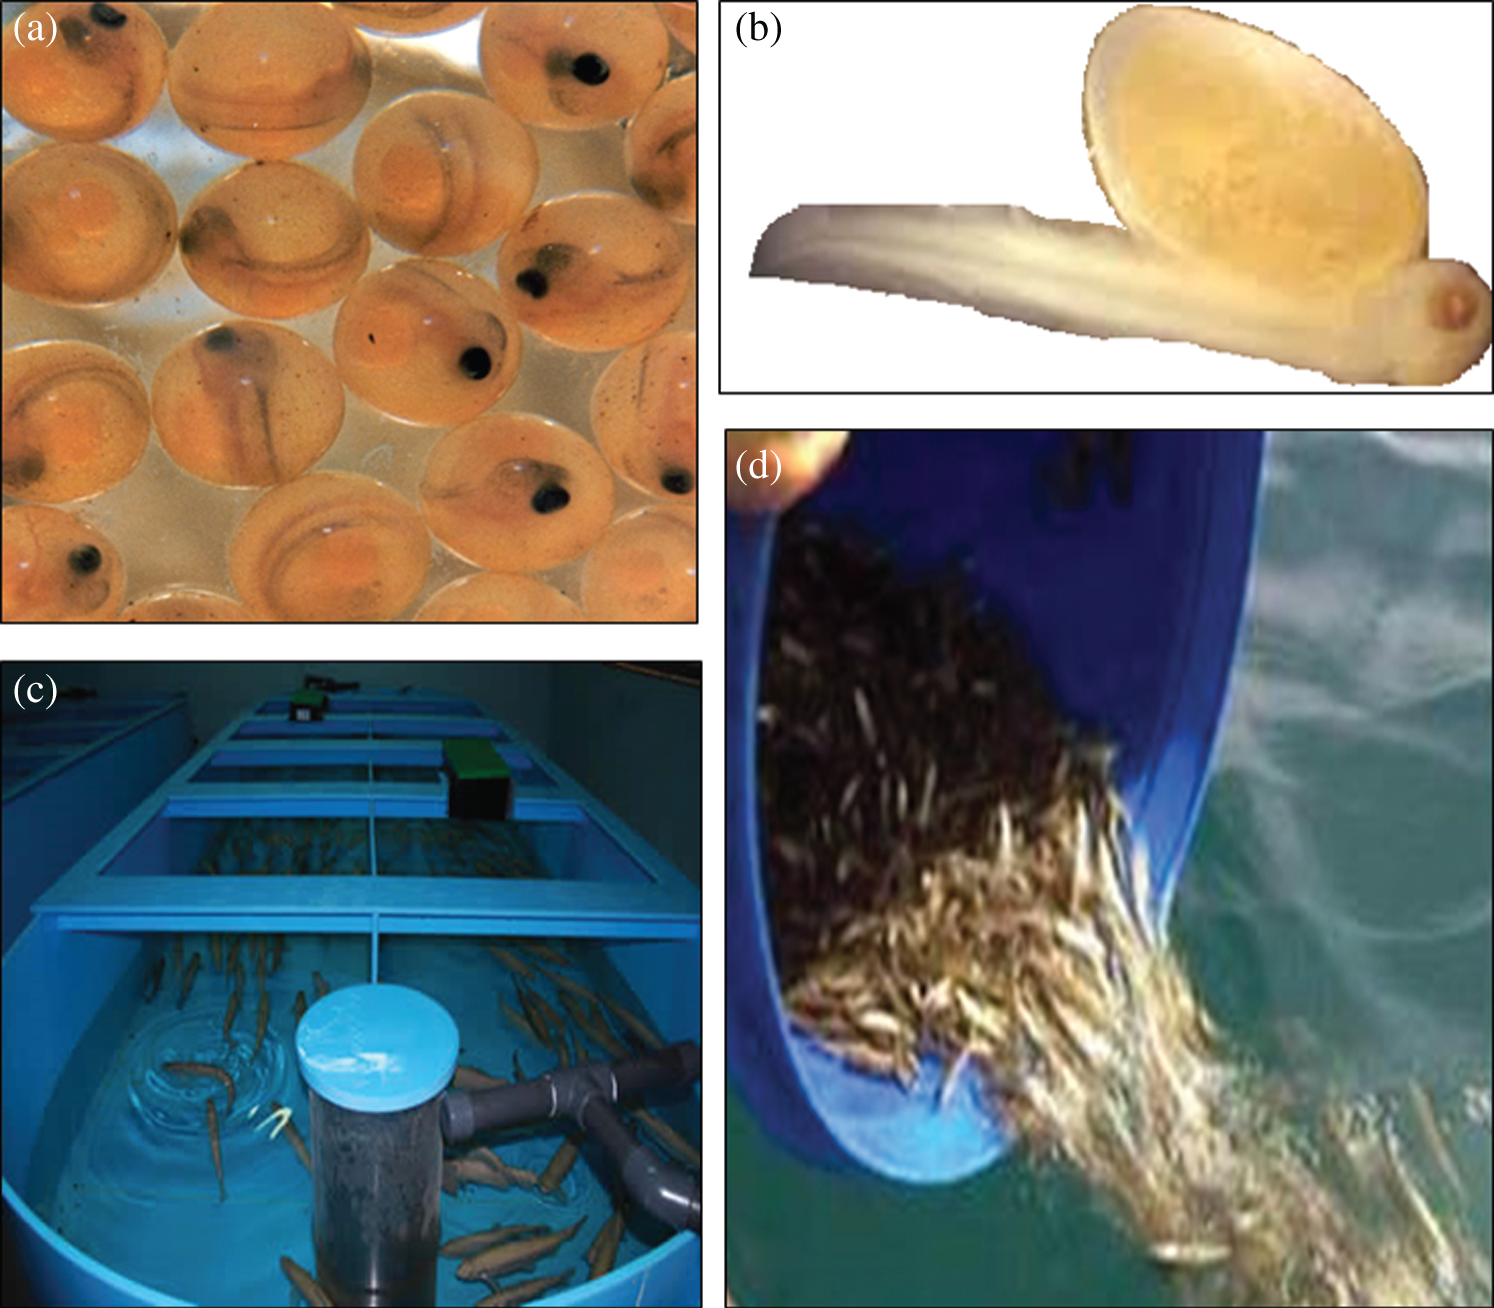
Figure 2: Growth stages of Ohrid trout (a) fetus, (b) embryo, (c) after one month, and (d) final releasing to the lake
Table 1: Basic statistics of measured features of Ohrid trout
5 Growth Stages Modeling Results
The qualitative and quantitative growth stages modeling results of Ohrid trout using the PCA and combinations of original features and PCA with SVM and other classification approaches are shown in Figs. 3–5 and Tabs. 2–8, and Figs. 6–9, respectively.
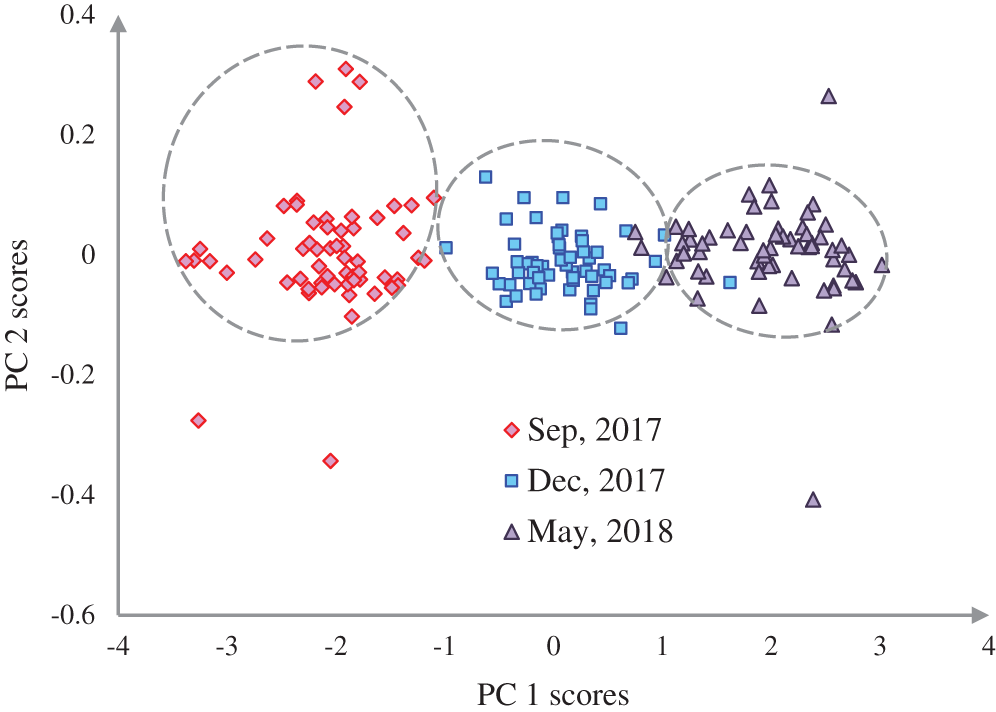
Figure 3: Representation of three growth stages of the experimental population of Ohrid trout in the PC space
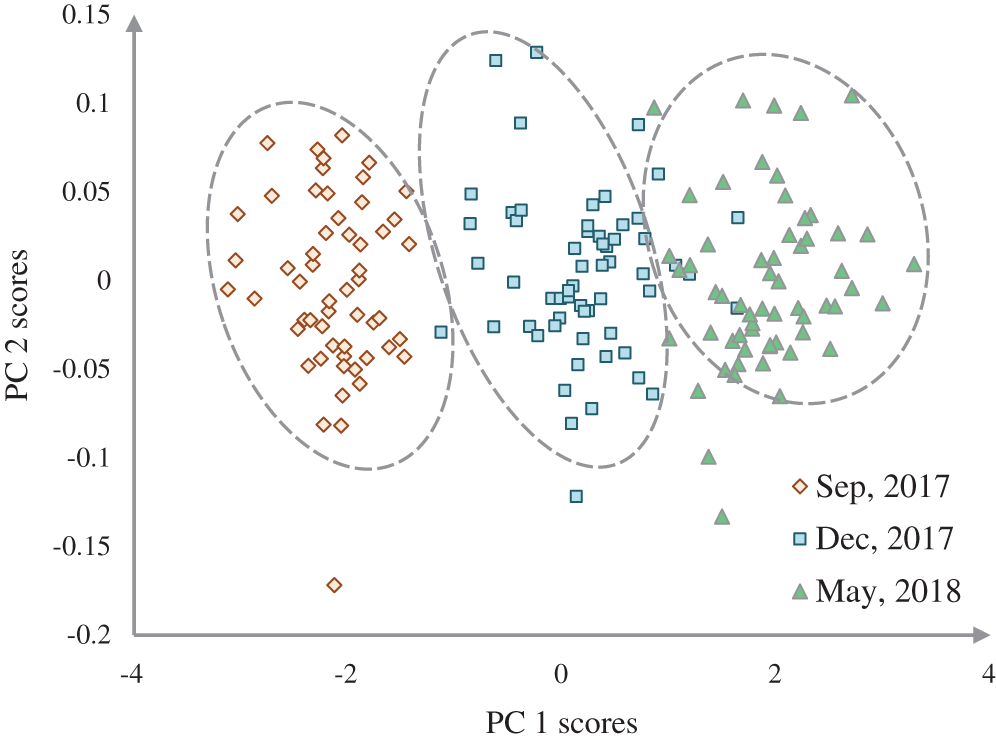
Figure 4: Representation of three growth stages of the natural population of Ohrid trout in the PC space
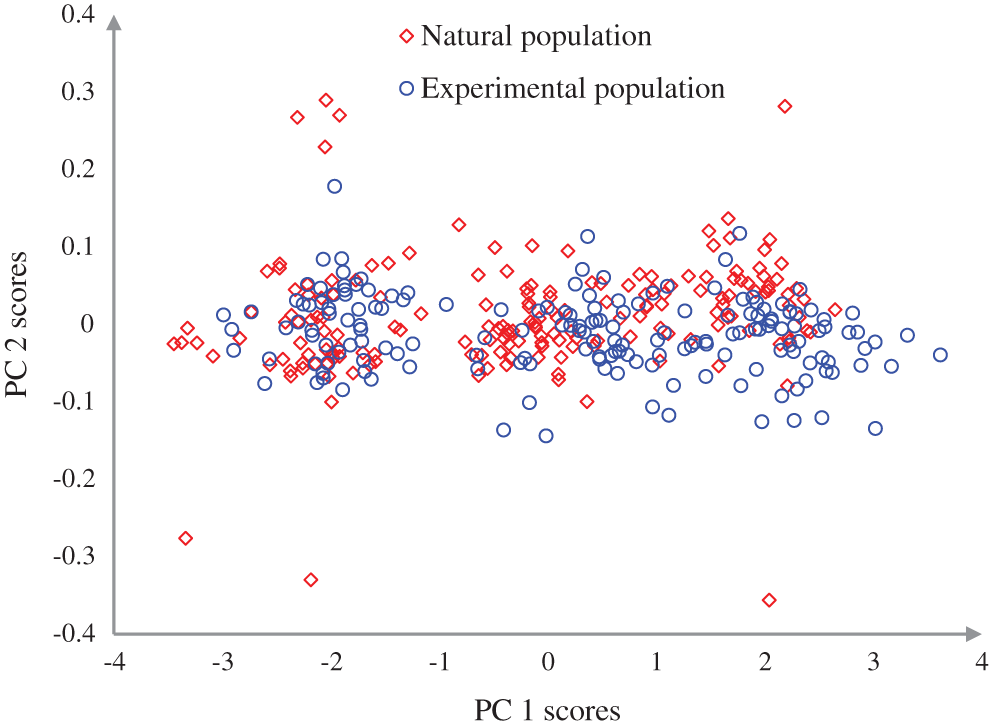
Figure 5: Discrimination of the experimental and natural populations of Ohrid trout in the PC space
Table 2: Growth stages classification of Ohrid trout with original experimental features in SVM
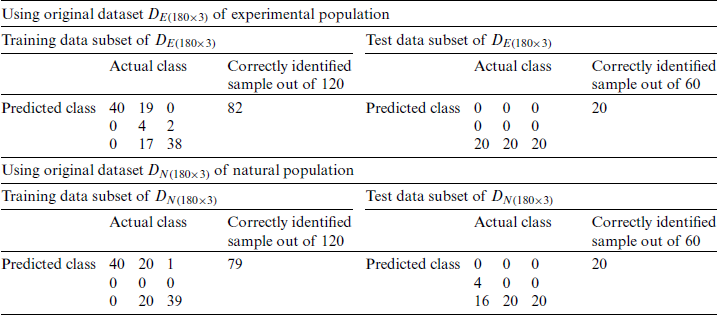
Table 3: SVM classification of the experimental and natural populations of Ohrid trout with original features
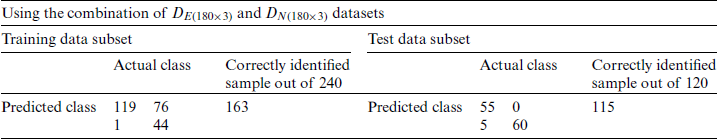
Table 4: Growth stage classification of the experimental and natural populations of Ohrid trout with PC1 in SVM
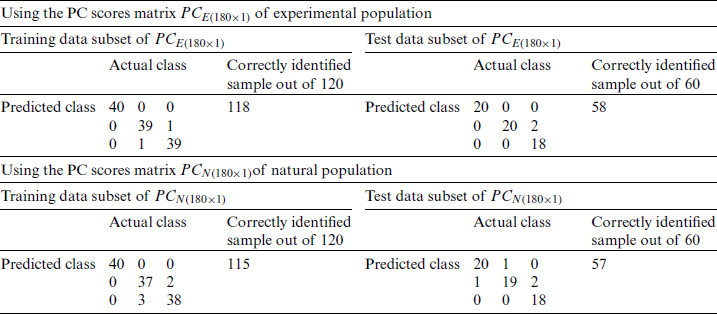
Table 5: Classification of the experimental and natural populations of Ohrid trout with PC1 in SVM
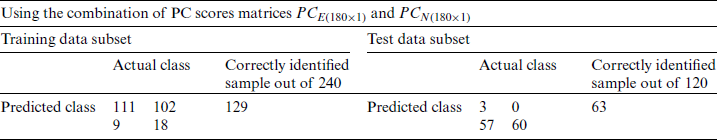
Table 6: Growth stage classification of Ohrid trout with PC1and PC2 in SVM
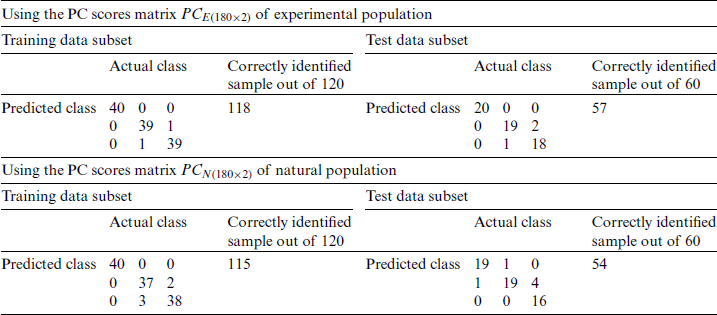
Table 7: Classification of the experimental and natural populations of Ohrid trout with PC1 and PC2 in SVM
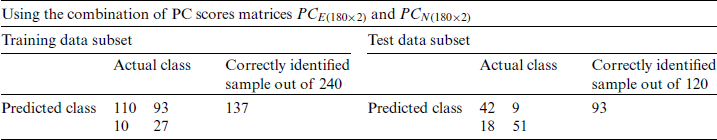
Table 8: Performance of other approaches for classification of the growth stage of the experimental and natural populations and their mixture
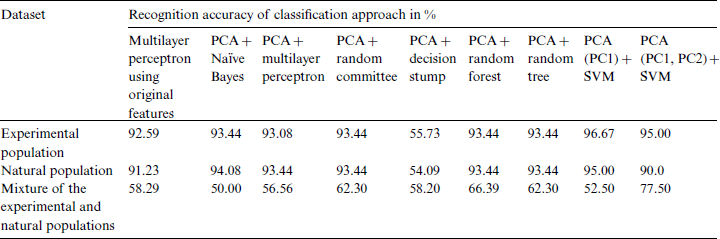
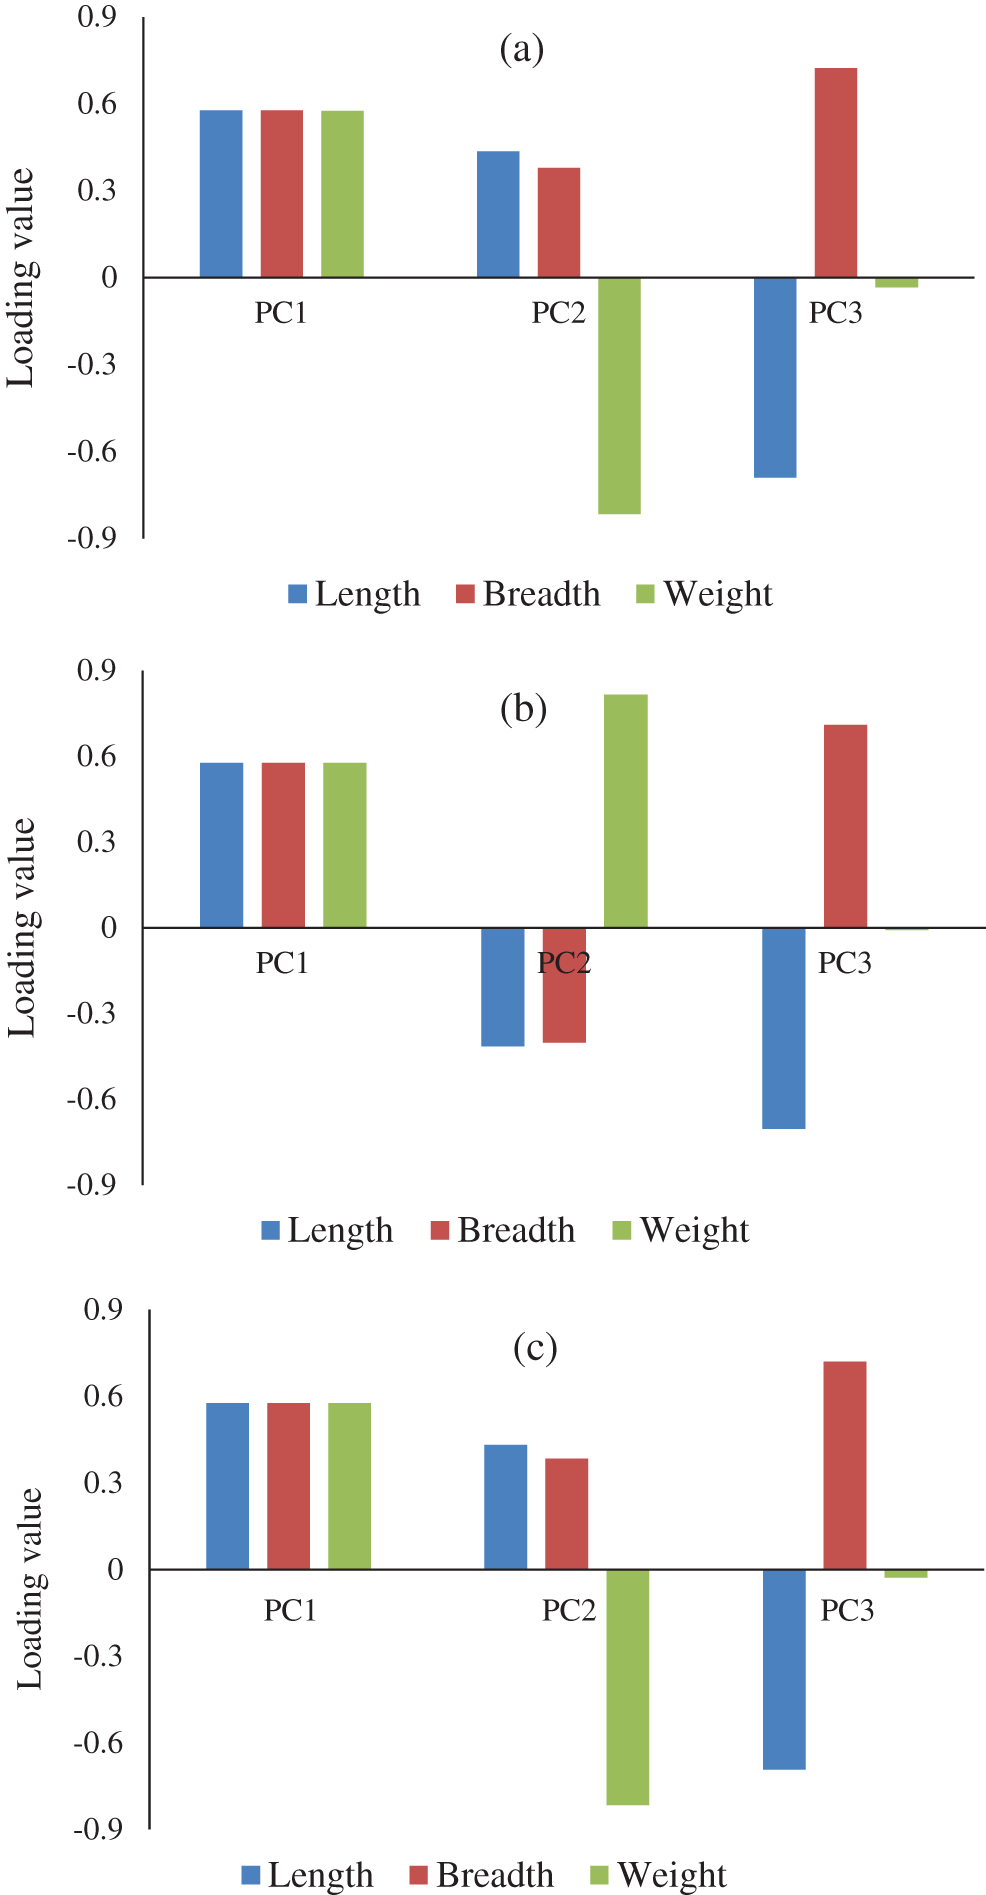
Figure 6: The loading value plots of PCA of (a)  , (b)
, (b)  , and (c) combination of
  and
and 
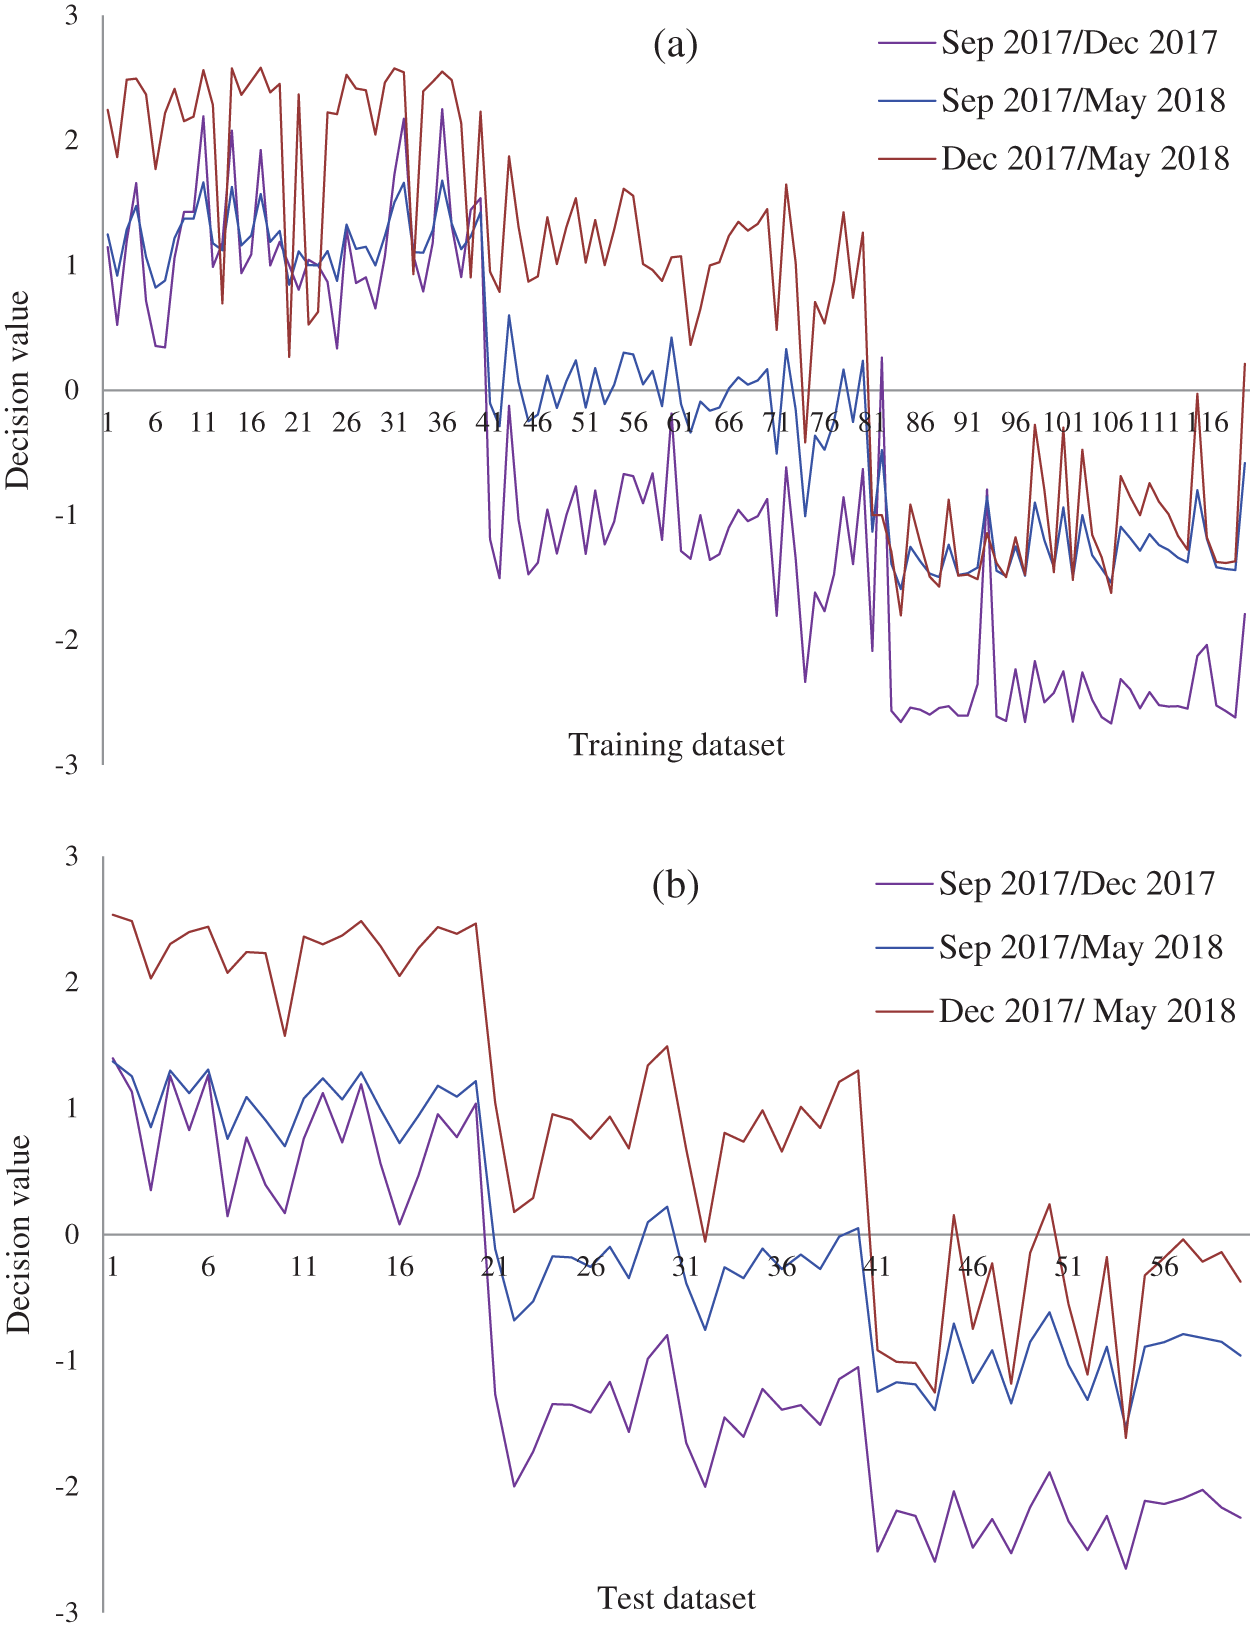
Figure 7: Decision values (positive for the first class and negative for second class) of the growth stages of the experimental population of Ohrid trout in (a) Training and (b) Test of the SVM
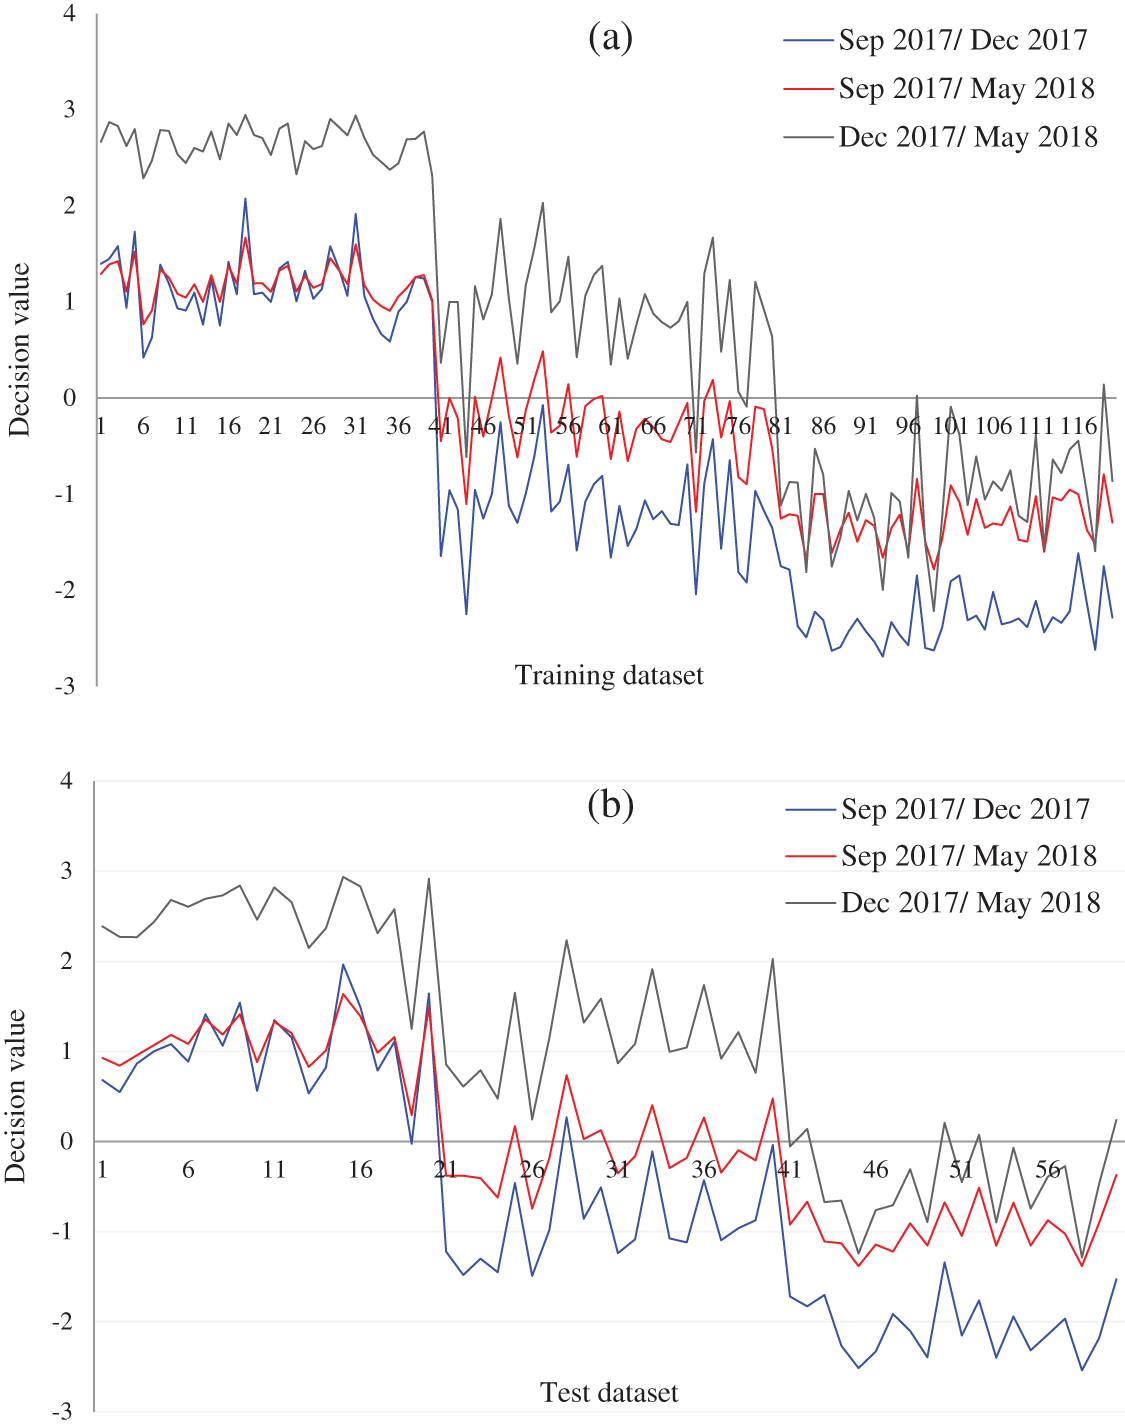
Figure 8: Decision values (positive for the first class and negative for second class) of the growth stage of the natural population of Ohrid trout in (a) Training and (b) Test of the SVM
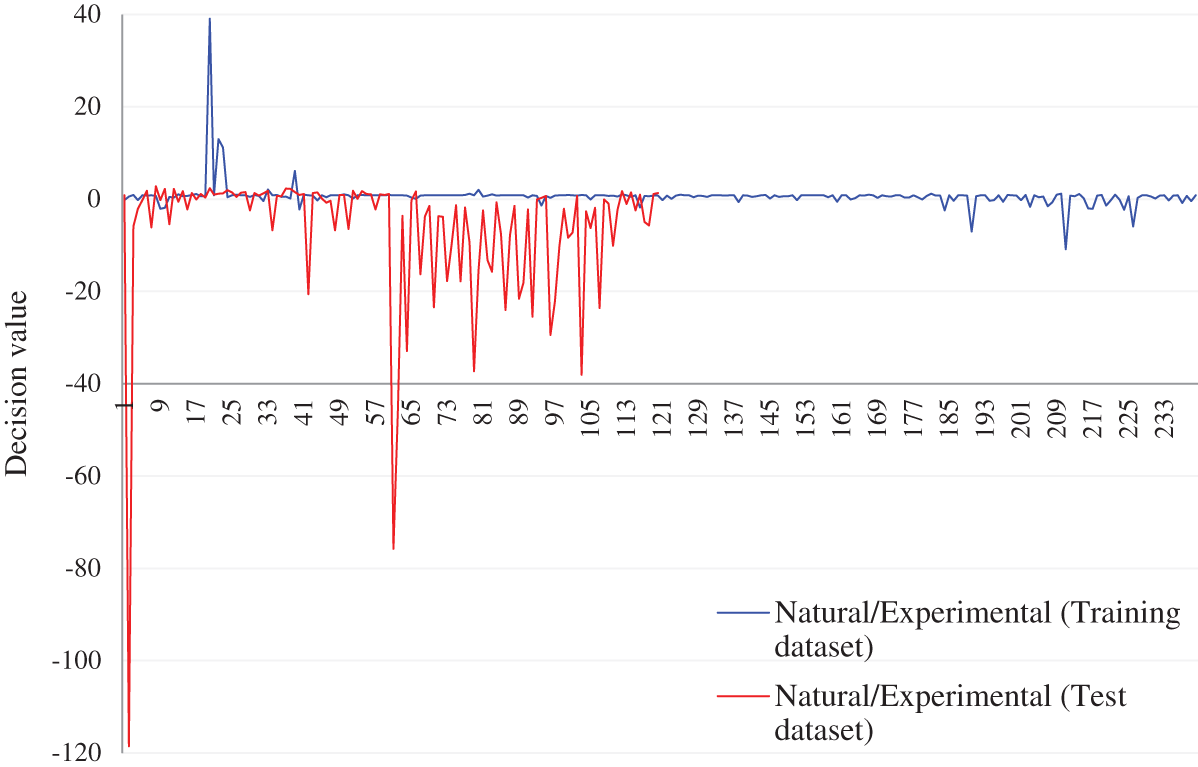
Figure 9: Decision values (positive for the first class and negative for second class) in discrimination of the experimental and natural populations of Ohrid trout in (a) Training and (b) Test of the SVM
5.1 Qualitative Modeling Results Using PCA
The discrimination of Ohrid trout samples of the experimental population by the analysis of the dataset  is shown in Fig. 3. Fig. 4 exhibits the qualitative discrimination results of Ohrid trout samples of the natural population in the PC space by the analysis of the dataset
  . The datasets
  and
and  were combined and analyzed by the PCA method to observe the discrimination of two categories (experimental and natural populations) of the Ohrid trout in the PC space. Fig. 5 represents the discrimination of the experimental and natural populations of Ohrid trout. Figs. 6a–6c presents the loading of features on PCs in the analysis of
  ,
,  , and their combination, respectively. From the PCA results of
  ,
,  and their combinations (Figs. 3–5), it is obvious that the first principal component (PC-1) has a variance between 99.76–99.90%. The variance of PC-2 and PC-3 lies between 0.07%–0.21% and 0.022%–0.023%, respectively, and hence are less significant.
From the growth stage discrimination of Ohrid trout in the experimental population by PCA (Fig. 3); it is obvious that Ohrid trout samples of September 2017 and December 2017 are almost separated from each other in the PC space. Though, there is a partial overlapping between the samples of December 2017 and May 2018. Specifically, one sample of December 2017 exists in the cluster of May 2018 while three samples of May 2018 occupying the cluster of December 2017. Besides, there are some samples of Ohrid trout, which behave like outliers, particularly two samples of each of the September 2017 and May 2018. Also, the samples belonging to the earlier two months are completely discriminated in the PC space.
The partial overlapping among some samples of three growth stages of experimental and natural populations and between some samples of two populations of Ohrid trout is due to the correlation between samples, some matching features of growth stages of two populations, and minor limits of PCA, etc. The maximum weights of three original features were −0.69 of length (l) in the PC-3, 0.72 of breadth (b) in PC-3, and −0.82 of weight (wt) in PC-2 (Fig. 6a). Besides, Fig. 6a indicates the maximum contribution of weight in the PC-2 and the minimum contribution in the PC-3. The three features have an equal contribution to the formation of the PC-1. The growth stage discrimination of Ohrid trout of the natural population by the PCA is shown in Fig. 4. In this case, again, there is no overlapping between the samples of September 2017 and December 2017. Nevertheless, approximately six samples of December 2017 are occupying the cluster of May 2018. Besides, there are a few samples of September 2017 and May 2018 classes that seem like outliers while all the samples of these two classes are completely separated from each other in the PC space. Similar to Figs. 6a, 6b denotes the maximum contribution of weight feature in the PC-2 and its minimum contribution in the PC-3 and the equal contribution of the three features of the natural population of Ohrid trout in the formation of PC-1.
The PCA scores plot after combining the samples of the experimental and natural populations is demonstrated in Fig. 5, which exhibits the overlapping of most of the samples of the two categories, though the appearance of three clusters (samples of September 2017, December 2017, and May 2018) can be noticed in both of the categories. The maximum overlapping of the two populations is due to the correlation between samples, large variation, and noise in features of natural population and minor restrictions of PCA, etc., The loading value plot in Fig. 6c presents similar conclusions, like Figs. 6a and 6b.
5.2 Quantitative Modeling Results Using the Original Features and SVM
The dataset  was divided into (i) training subset that contains 120 samples (40 samples of each of the months, September 2017, December 2017, and May 2018) and (ii) test subset that contains 60 samples (20 samples of each of the months, September 2017, December 2017, and May 2018). Similarly, the dataset
  was divided into training and test subsets. SVM model was trained by using the training data subset of
  and
and  , independently. Different types of kernel functions (linear, polynomial, radial basis, and sigmoid) and their related parameters have been investigated to achieve the best recognition accuracy. SVM model with optimal kernel function and their parameters was used to predict the classes of the test data subsets
  and
and  . This process was repeated three times using different training and test subsets. The SVM classification results of three growth stages of the experimental and natural populations using the original dataset are summarized in Tab. 2. The classification results of experimental and natural populations of Ohrid trout by SVM using their combined dataset are summarized in Tab. 3. The polynomial kernel (
 ,
,  , and
, and  ) results in the optimum performance of SVM in the classification of natural and experimental populations (Tab. 3) as well as their growth stages (Tab. 2). It is obvious that the SVM has low accuracy of only 33.33% in growth stages recognition of both experimental and natural populations while the better classification of results (recognition rate of 95.83%) has been achieved in the classification of two populations.
5.3 Quantitative Modeling Results Using the Combination of PCA and SVM
The quantitative class discrimination procedure of the experimental populations of Ohrid trout using the combination of PCA and SVM is as follows. The PC scores matrix  was obtained by the PCA of the original dataset
  .
.  was divided into (i) training subset that contains PC scores of 120 samples (40 samples of each of the months, September 2017, December 2017, and May 2018) and (ii) test subset that contains 60 samples (20 samples of each of the months, September 2017, December 2017, and May 2018). Similarly,
  (obtained by the PCA of
  ) was divided into training and test subsets.
5.3.1 Using the First Principal Component
 and
and  were used as input of SVM, independently in growth stage classification of experimental and natural populations, respectively, and in combination in the classification of two populations. Tab. 4 summarizes the growth stage classification results of SVM using PC-1. Classification of the experimental and natural populations of Ohrid trout using the first principal component in SVM is summarized in Tab. 5.
5.3.2 Using the First and Second Principal Components
Tab. 6 summarizes the SVM classification results of PC score matrices  and
and  , respectively.
For the quantitative class discrimination of two categories: (i) Experimental, and (ii) Natural populations of Ohrid trout using the SVM, two PC score matrices  and
and  were combined, thereafter divided into training and test subsets. In this case, the training subset contains 240 samples of Ohrid trout (120 samples of each of two categories), and the rest 120 samples of Ohrid trout (60 samples of each of the two categories) were used as the test subset. The SVM model of the polynomial kernel (
 ,
,  , and
, and  ) results in the maximum class discrimination of the training data subset. A similar SVM model was used in the class prediction of the test data subset. The SVM classification results of the training and test subsets are summarized in Tab. 7.
The decision values plot of SVM analysis of the PC scores matrix  and
and  are shown in Figs. 7 and 8, respectively. The decision plot of the combination of
  and
and  is shown in Fig. 9.
Due to the maximum variance, PC-1 and PC-2 are selected as the input of SVM, and PC3 is discarded. Moreover, for performance comparison, the only PC1 is used in SVM in the earlier section. It is obvious from Tabs. 4 and 6 that there is a minor improvement (1.67%) in classification accuracy of SVM in the analysis of the experimental population and a 5% improvement in the analysis of the natural population using only PC-1 than using both PC-1 and PC-2 for test data subsets. Though the classification accuracy of the SVM by using only PC-1 in the analysis of the combination of  and
and  is less (Tab. 5) than using both PC-1 and PC-2 for the similarly combined matrix (Tab. 7) by 3.28% and 25% for training and test data subsets, respectively. It is obvious from the SVM classification results in Tab. 6 (using PC-1 and PC-2), Tab. 4 (using PC-1), and Tab. 2 (using the original dataset) that the combination of PCA and SVM results in better classification accuracy than the SVM method alone. However, using the SVM method alone results in better classification accuracy for the combination of experimental and natural populations as shown in Tab. 3. It is clear from Tab. 6 that there is only class confusion between the samples of December 2017 and May 2018 of the SVM classifier. It is similar to the qualitative discrimination results shown in Fig. 3. The SVM classifier results in correct class recognition rate of 98.3% and 95% using training and test data subsets, respectively. For the visual demonstration of SVM classification results, the decision value plots of three binary class SVMs in Fig. 7a indicate a positive decision value in favor of the first class and a negative decision value in favor of the second class. The majority voting rule was adopted to decide the final class of a training data point. A similar rule was followed for the test data subsets classification using the decision values of three binary class SVMs shown in Fig. 7b. The SVM classification results of the three different months of the natural population are shown in Tab. 6. It is obvious that most of the class confusion is in between the samples of December 2017 and May 2018. SVM results are complementing the PC score plot shown in Fig. 4. The SVM classifier results in the correct class recognition rate of 95.8% and 90% using the training and test data subsets, respectively. The decision value plots of training and test data subsets of three binary SVMs in Figs. 8a and 8b, respectively, indicate the positive decision value of the first class and negative decision value of the second class, and the final class was decided according to the majority voting rule. The SVM classifier results in only 57% correct classification in the training stage (Tab. 7), which is due to the maximum overlapping of the samples in the PC space (Fig. 5). For the test data subset, similar SVM model results in a correct class recognition rate of 77.5%. The decision value plots in Fig. 9 of training and test data subsets are based on a single binary class SVM model and indicate the positive decision value of the first class (experimental population) and the negative decision value of the second class (natural population), similar to previous decision value plots in Figs. 7 and 8. The decision values (Figs. 7–9) show that the multiclass identification works well due to the majority vote of the outputs of 1-vs.-1 SVMs. In the present study, a combination of PCA and SVM method is implemented first time in the classification of different growth stages of Ohrid trout. Therefore, it’s not feasible to compare the results with other studies.
Though, the performance of the SVM using the original dataset (Tabs. 2 and 3) has been compared with the classification performance of the combination of PCA and SVM using PC-1 (Tabs. 4 and 5), and using the PC-1 and PC-2 (Tabs. 6 and 7). In some related studies, the SVM method has been implemented and results in a comparable accuracy, like hunger states classification of Rainbow trout (average accuracy of 85%) [23]; color and texture features-based classification of fish species (average accuracy of 81.14%–96.30%) [22]; fish species classification (accuracy of 78.59%) [41]; hyperspectral imaging-based classification of fresh and frozen fish (accuracy of 91.43%) [42]; and an ensemble of wrappers features-based fish age classification (accuracy of 77.07%–77.27%) [27], etc.
5.4 Quantitative Modeling Results of Other Classification Approaches Using Original Features and PCA
With the objective to evaluate the performance of the SVM, other classification methods have been also used in the growth stage classification of Ohrid trout using their original features and principal components. Tab. 8 summarizes the performance evaluation of other approaches in the classification of the growth stages of Ohrid trout. The performance of Naïve Bayes, multilayer perceptron, random committee (Meta classifier), decision stump, random forest, random tree (tree-based classifiers) is compared in the classification of growth stages of experimental and natural populations of Ohrid trout (Tab. 8). It is obvious that the combination of PCA and SVM has higher accuracy in growth stage classification (Tab. 6) than other classification approaches (Tab. 8). Besides, the combination of PCA and SVM has higher accuracy in the classification of two populations (Tab. 7).
6 Conclusion and Future Research Scope
Past research studies for saving the population of Ohrid trout were discussed and the significance of data mining methods in the aquaculture and fisheries has been summarized. For the first time, a combined approach of PCA and SVM in growth monitoring of Ohrid trout has been explained. The proposed data mining approach based growth stage modeling results in the better qualitative and quantitative discrimination efficiency of the different development stages of the Ohrid trout. Future research will focus on the measurement of additional features of the Ohrid trout and advanced modeling schemes for their growth stage discrimination and class identification.
Experimental Ethics: The experiment was approved by the Ministry of Environment and Physical Planning, FYROM. Features of Ohrid trout were measured under the supervision of Hydrological Institute Ohrid, FYROM.
Funding Statement: This work is supported by the startup foundation for introducing talent of NUIST, Nanjing, China (Project No. 2243141701103).
Conflicts of Interest: The authors declare that they have no conflicts of interest to report regarding the present study.
1. Albrecht, C., Wilke, T. (2008). Ancient Lake Ohrid: Biodiversity and evolution. Hydrobiologia, 615(1), 103–140. [Google Scholar]
2. Wagner, B., Lotter, A. F., Nowaczyk, N., Reed, J. M., Schwalb, A. et al. (2009). A 40,000-year record of environmental change from ancient Lake Ohrid (Albania and Macedonia). Journal of Paleolimnology, 41(3), 407–430. DOI 10.1007/s10933-008-9234-2. [Google Scholar] [CrossRef]
3. Hoffmann, N., Reicherter, K., Fernandez-Steeger, T., Grutzner, C. (2010). Evolution of ancient Lake Ohrid: A tectonic perspective. Biogeosciences, 7(10), 3377–3386. DOI 10.5194/bg-7-3377-2010. [Google Scholar] [CrossRef]
4. Dodeva, S. (2012). Macedonian lakes. Encyclopedia of Lakes and Reservoirs, 503–508. [Google Scholar]
5. Topi, D., Seiti, B., Shabani, M. (2011). Polycyclic aromatic hydrocarbons in fish species from Lake Ohrid. Albanian Journal of Natural & Technical Sciences, 30(1), 155–162. https://www.ebsco.com. [Google Scholar]
6. Spirkovski, Z., Krstanovski, Z., Selfo, L., Sanxhaku, M., Puka, V. I. (2000). The monitoring programme of the Lake Ohrid conservation project. In: Transboundary Water Resources in the Balkans. pp. 41–53. Springer, Dordrecht. [Google Scholar]
7. Kostoski, G., Albrecht, C., Trajanovski, S., Wilke, T. (2010). A freshwater biodiversity hotspot under pressure-assessing threats and identifying conservation needs for ancient Lake Ohrid. Biogeosciences, 7(12), 3999–4015. DOI 10.5194/bg-7-3999-2010. [Google Scholar] [CrossRef]
8. Ristovska, M., Karaman, B., Verraes, W., Adriaens, D. (2004). Development of the cranial lateral-line system and canal related bones in Salmo letnica kar (Teleostei: Salmonidae). Balwois, 1–7. http://hdl.handle.net/1854/LU-337275. [Google Scholar]
9. Sušnik, S., Knizhin, I., Snoj, A., Weiss, S. (2006). Genetic and morphological characterization of a Lake Ohrid endemic, Salmo (Acantholingua) ohridanus with a comparison to sympatric Salmo trutta. Journal of Fish Biology, 68(A), 2–23. DOI 10.1111/j.0022-1112.2006.00902.x. [Google Scholar] [CrossRef]
10. Jordanova, M., Miteva, N., Santos, N., Malhao, F., Rocha, E. (2009). Crystalline inclusions in hepatocytes and associated interhepatocytic macrophages from female Ohrid trout (Salmo letnica Kar.). Tissue & Cell, 41(4), 281–285. DOI 10.1016/j.tice.2008.12.005. [Google Scholar] [CrossRef]
11. Tavciovska-Vasileva, I., Rebok, K. (2005). Ultrastructural changes in sertoli cells in Ohrid trout-Salmo letnica (Karaman) during the prespawning and postspawning period. Bulgarian Journal of Veterinary Medicine, 8(1), 47–57. [Google Scholar]
12. Snoj, A., Maric, S., Berrebi, P., Crivelli, A. J., Shumka, S. et al. (2009). Genetic architecture of trout from Albania as revealed by mtDNA control region variation. Genetics Selection Evolution, 41(1), 1–11. DOI 10.1186/1297-9686-41-22. [Google Scholar] [CrossRef]
13. Ristovska, M., Spirovski, Z., Huysentruyt, F., Adriaens, D. (2008). Shape changes in the external morphology during early development of the Ohrid trout (Salmo letnica Karaman, 1924). Balwois, pp. 1–10, Ohrid, Macedonia. [Google Scholar]
14. Rebok, K., Jordanova, M., Tavciovska-Vasileva, I. (2011). Spleen histology in the female Ohrid trout, Salmo letnica (Kar.) (Teleostei, Salmonidae) during the reproductive cycle. Archives of Biological Sciences, 63(4), 1023–1030. DOI 10.2298/ABS1104023R. [Google Scholar] [CrossRef]
15. Jordanova, M., Miteva, N., Rocha, E. (2007). A quantitative study of the hepatic eosinophilic granule cells and rodlet cells during the breeding cycle of Ohrid trout, Salmo letnica Kar (Teloestei, Salmonidae). Fish and Shellfish Immunology, 23(2), 473–478. DOI 10.1016/j.fsi.2006.11.004. [Google Scholar] [CrossRef]
16. Jordanova, M., Miteva, N., Rocha, E. (2008). A qualitative and quantitative study of the hepatic pigmented macrophage aggregates during the breeding cycle of Ohrid trout, Salmo letnica Kar (Teloestei, Salmonidae). Microscopy Research and Technique, 71(11), 822–830. DOI 10.1002/jemt.20626. [Google Scholar] [CrossRef]
17. Sell, J., Spirkovski, Z. (2004). Mitochondrial DNA differentiation between two forms of trout Salmo letnica, endemic to the Balkan Lake Ohrid, reflects their reproductive isolation. Molecular Ecology, 13(12), 3633–3644. DOI 10.1111/j.1365-294X.2004.02362.x. [Google Scholar] [CrossRef]
18. Jha, S. K., Ahmad, Z. (2017). (Soil microbial dynamics modeling in fluctuating ecological situations by using subtractive clustering and fuzzy rule-based inference systems. Computer Modeling in Engineering & Sciences, 113(4), 443–459. DOI 10.3970/cmes.2017.113.443.pdf. [Google Scholar] [CrossRef]
19. Pereira, L. A., Nakamura, R. Y., De Souza, G. F., Martins, D., Papa, J. P. (2012). Aquatic weed automatic classification using machine learning techniques. Computers and Electronics in Agriculture, 87, 56–63. DOI 10.1016/j.compag.2012.05.015. [Google Scholar] [CrossRef]
20. Rahman, A., D’Este, C. (2015). Shellfish farm closure prediction and cause identification using machine learning methods. Computers and Electronics in Agriculture, 110, 241–248. DOI 10.1016/j.compag.2014.11.023. [Google Scholar] [CrossRef]
21. Shahriar, M. S., Rahman, A., McCulloch, J. (2014). Predicting shellfish farm closures using time series classification for aquaculture decision support. Computers and Electronics in Agriculture, 102, 85–97. DOI 10.1016/j.compag.2014.01.011. [Google Scholar] [CrossRef]
22. Hu, J., Li, D., Duan, Q., Han, Y., Chen, G. et al. (2012). Fish species classification by color, texture and multi-class support vector machine using computer vision. Computers and Electronics in Agriculture, 88, 133–140. DOI 10.1016/j.compag.2012.07.008. [Google Scholar] [CrossRef]
23. Cubitt, K. F., Williams, H. T., Rowsell, D., McFarlane, W. J., Gosine, R. G. et al. (2008). Development of an intelligent reasoning system to distinguish hunger states in Rainbow trout (Oncorhynchus mykiss). Computers and Electronics in Agriculture, 62(1), 29–34. DOI 10.1016/j.compag.2007.08.010. [Google Scholar] [CrossRef]
24. Xu, L., Liu, S., Li, D. (2017). Prediction of water temperature in prawn cultures based on a mechanism model optimized by an improved artificial bee colony. Computers and Electronics in Agriculture, 140, 397–408. DOI 10.1016/j.compag.2017.05.034. [Google Scholar] [CrossRef]
25. Cobo, Á., Llorente, I., Luna, L., Luna, M. (2019). A decision support system for fish farming using particle swarm optimization. Computers and Electronics in Agriculture, 161, 121–130. DOI 10.1016/j.compag.2018.03.036. [Google Scholar] [CrossRef]
26. Zhou, C., Lin, K., Xu, D., Chen, L., Guo, Q. et al. (2018). Near infrared computer vision and neuro-fuzzy model-based feeding decision system for fish in aquaculture. Computers and Electronics in Agriculture, 146, 114–124. DOI 10.1016/j.compag.2018.02.006. [Google Scholar] [CrossRef]
27. Bermejo, S. (2017). Ensembles of wrappers for automated feature selection in fish age classification. Computers and Electronics in Agriculture, 134, 27–32. DOI 10.1016/j.compag.2017.01.007. [Google Scholar] [CrossRef]
28. Misimi, E., Øye, E. R., Sture, Ø., Mathiassen, J. R. (2017). Robust classification approach for segmentation of blood defects in cod fillets based on deep convolutional neural networks and support vector machines and calculation of gripper vectors for robotic processing. Computers and Electronics in Agriculture, 139, 138–152. DOI 10.1016/j.compag.2017.05.021. [Google Scholar] [CrossRef]
29. Ta, X., Wei, Y. (2018). Research on a dissolved oxygen prediction method for recirculating aquaculture systems based on a convolution neural network. Computers and Electronics in Agriculture, 145, 302–310. DOI 10.1016/j.compag.2017.12.037. [Google Scholar] [CrossRef]
30. Muñoz-Benavent, P., Andreu-García, G., Valiente-González, J. M., Atienza-Vanacloig, V., Puig-Pons, V. et al. (2018). Enhanced fish bending model for automatic tuna sizing using computer vision. Computers and Electronics in Agriculture, 150, 52–61. DOI 10.1016/j.compag.2018.04.005. [Google Scholar] [CrossRef]
31. Liu, S., Tai, H., Ding, Q., Li, D., Xu, L. et al. (2013). A hybrid approach of support vector regression with genetic algorithm optimization for aquaculture water quality prediction. Mathematical and Computer Modelling, 58(3–4), 458–465. DOI 10.1016/j.mcm.2011.11.021. [Google Scholar] [CrossRef]
32. Bosch, P., Lopez, J., Ramirez, H., Robotham, H. (2013). Support vector machine under uncertainty: An application for hydroacoustic classification of fish-schools in Chile. Expert Systems with Applications, 40(10), 4029–4034. DOI 10.1016/j.eswa.2013.01.006. [Google Scholar] [CrossRef]
33. Masoum, S., Malabat, C., Jalali-Heravi, M., Guillou, C., Rezzi, S. et al. (2007). Application of support vector machines to 1H NMR data of fish oils: Methodology for the confirmation of wild and farmed salmon and their origins. Analytical and Bioanalytical Chemistry, 387(4), 1499–1510. DOI 10.1007/s00216-006-1025-x. [Google Scholar] [CrossRef]
34. Bishop, C. M. (2006). (Pattern recognition and machine learning. Springer, New York. [Google Scholar]
35. Theodoridis, S., Koutroumbas, K. (2006). (Pattern recognition. Academic Press, San Diego. [Google Scholar]
36. Vapnik, V. (1982). (Estimation of dependences based on empirical data. Springer, New York. [Google Scholar]
37. Burges, C. J. C. (1998). A Tutorial on Support vector machines for pattern recognition. Data Mining and Knowledge Discovery, 2(2), 1–43. DOI 10.1023/A:1009715923555. [Google Scholar] [CrossRef]
38. R Development Core Team. (2008). A language and environment for statistical computing. R Foundation for Statistical Computing, Austria. [Google Scholar]
39. Dimitriadou, E., Hornik, K., Leisch, F., Meyer, D., Weingessel, A. (2008). e1071: Misc. Functions of the Department of Statistics (e1071). TU Wien R Package, 1, 1, 5–18. [Google Scholar]
40. Environmental Systems Research Institute (ESRI). (2014). ArcGIS Desktop Help 10.2 Geo-statistical Analyst. http://resources.arcgis.com/en/help/main/10.2/index.html. [Google Scholar]
41. Ogunlana, S. O., Olabode, O., Oluwadare, S. A. A., Iwasokun, G. B. (2015). Fish classification using support vector machine. African Journal of Computing & ICT, 8, 75–82. [Google Scholar]
42. Cheng, J. H., Sun, D. W., Pu, H. B., Chen, X., Liu, Y. et al. (2015). Integration of classifiers analysis and hyperspectral imaging for rapid discrimination of fresh from cold-stored and frozen-thawed fish fillets. Journal of Food Engineering, 161, 33–39. DOI 10.1016/j.jfoodeng.2015.03.011. [Google Scholar] [CrossRef]
 | This work is licensed under a Creative Commons Attribution 4.0 International License, which permits unrestricted use, distribution, and reproduction in any medium, provided the original work is properly cited. |