DOI: 10.32604/cmes.2021.014558
ARTICLE
A Smart Wearable Ring Device for Sensing Hand Tremor of Parkinson’s Patients
1School of Instrument Science and Engineering, Southeast University, Nanjing, 211189, China
2School of Computer and Software, Nanjing University of Information Science and Technology, Nanjing, 210044, China
3School of Engineering and Technology, University of Washington, Tacoma, 98402, USA
4School of Cyber Science and Engineering, Southeast University, Nanjing, 211189, China
*Corresponding Author: Weigong Zhang. Email: zhangwg@seu.edu.cn
Received: 08 October 2020; Accepted: 19 November 2020
Abstract: Parkinson’s disease (PD) is a very common neurodegenerative disease that occurs mostly in the elderly. There are many main clinical manifestations of PD, such as tremor, bradykinesia, muscle rigidity, etc. Based on the current research on PD, the accurate and convenient detection of early symptoms is the key to detect PD. With the development of microelectronic and sensor technology, it is much easier to measure the barely noticeable tremor in just one hand for the early detection of Parkinson’s disease. In this paper, we present a smart wearable device for detecting hand tremor, in which MPU6050 (MIDI Processing Unit) consisting of a 3-axis gyroscope and a 3-axis accelerometer is used to collect acceleration and angular velocity of fingers. By analyzing the time of specific finger movements, we successfully recognized the tremor signals with high accuracy. Meanwhile, with Bluetooth 4.0 (Bluetooth Low Energy, BLE) and networking terminal ability, tremor data can be transferred to a monitoring device in real time with extremely low energy consumption. The experimental results have shown that the proposed device (smart ring) is convenient for long-term tremor detection which is vital for early detection and treatment for Parkinson’s disease.
Keywords: Parkinson’s disease; tremor detection; IMU sensor; MPU6050; BLE
Parkinson’s disease (PD) is a progressive nervous system disorder that affects movements of human body. Symptoms start gradually, sometimes starting with a barely noticeable tremor in just one hand. Tremors are common, but the disorder usually causes stiffness or bradykinesia [1]. The elderly is at a higher risk of Parkinson’s disease compared with young people which causes great difficulties to their life.
Tremor, especially static tremor, is usually the first symptom of Parkinson’s disease. The “static” refers to a state of quietness or relaxation of muscles of the body. These tremors look like as if a person is rubbing clay balls or counting money. They appear only occasionally at first, and get worse gradually.
The main symptoms of Parkinson’s disease are distinguishable, especially the tremors which serve as the prelude and can be used to foresee an onslaught of Parkinson’s disease [2–4]. In recent decades, the detection of tremor signals of Parkinson’s disease has attracted enthusiastic attentions and many detection methods have been proposed in academia and industry [5–7].
Devices with builtin accelerometers and gyroscopes have been used to assist detecting tremors in PD patients. The study of using accelerometer to detect tremor signals is evolved gradually with the development of electronic techniques [8,9]. In 2010, in the United States, Robert LeMoyne used builtin accelerometer in iPhone to detect tremor signals. By collecting and analyzing the waveform of tremors from a Parkinson’s patient, it is demonstrated that the accelerometer in iPhone can quantify the characteristics of tremor [10]. Oess et al. [11] designed a smart glove equipped with gyroscope which can trace the motion of hand and analyze the motion waveform to detect tremor. Paola Pierlenoni designed a bracelet which is used to detect tremor signal; it uses the FFT (Fast Fourier Transform) and autoregressive parameter model spectrum to plot the power spectrum and identifies the features of tremor [12]. Butson et al. [13] proposed a standardized method to classify motions based on motion programming DBS (Deep Brain Stimulation) parameters. In their study, subjects were asked to wear motion sensors while conducting DBS coded standard procedures to collect kinematics data. Researchers could use this method to better understand the parameters of motions.
So far, it is a common belief that tremor signals embrace reliable characteristics for early detection of Parkinson’s disease [14,15]. However, it remains a challenge about how to make the detection accurate and how to make the device easy to use for the elderly users. Researches are working to develop smaller and more convenient devices for tremor detection [16]. In the future, it is inevitable that there will be more demands on small and convenient devices for PD’s early detection.
In general, wearable devices [17–19] for PD detection have the following features in common:
1. Small size and light weight, so that the device can be used as convenient as possible.
2. High sensitivity. The device should be able to detect subtle tremors which can prelude the onslaught of PD.
3. Low power consumption. The battery capacity of microelectronic device is extremely limited. As a result, the operating power should be as low as possible.
In this paper, we present our design and implementation of a small ring device to detect hand tremors for Parkinson’s disease patients. Section 2 presents our selection of the system hardware components and Section 3 presents the hardware circuit design. Section 4 explains the tremor detection algorithm design. Section 5 presents our system implementation and the experimental studies. In Section 6, we conclude with future work to fine-tune the smart ring device.
2 System Hardware Architecture
2.1 Off-the-Shelf Hardware List
To minimize the size and cost of the device, we selected off-the-shelf hardware as listed in Tab. 1 and explained below.
Table 1: List of hardware materials
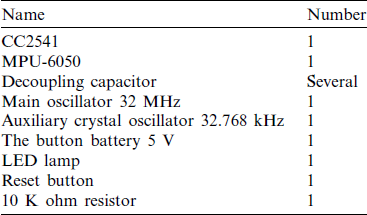
CC2541 is a Bluetooth low energy and proprietary wireless MCU (Microcontroller), used for data transmission. MPU-6050 (MIDI Processing Unit) is a motion tracking device designed for low power consumption, low cost and high-performance, used to obtain data of acceleration and angular velocity. Decoupling capacitor is used for signal filtering. Precision resistor (56 kohm,  1%) is a bias resistor. Main crystal oscillator (32 MHz) is to supply clock signals. Auxiliary crystal oscillator (32.768 kHz) works for low power consumption mode. The button battery (5 V) supplies power. LED lamp is used to indicate the state of device. Reset button is used to reset the device. 10 K
 resistor is used to protect the circuit.
2.2.1 A Brief Introduction of MPU-6050
MPU6050 is an integrated chip with embedded accelerometer and gyroscope on the same silicon die that can detect acceleration, angular velocity and temperature. We only use acceleration and angular velocity in this study. The data collected were converted from analog signals to digital signals using a 16-bit ADC (Analog-to-Digital Converter). The integrated gyro detection diagram is shown in Fig. 1. The pin diagram of MPU-6050 is shown in Fig. 2.

Figure 1: Gyro detection diagram

Figure 2: Pin diagram of MPU6050
2.2.2 Configuring Register Parameters
GYRO_CONFIG: XG_ST (self-testing X-axis gyroscope), YG_ST (self-testing Y-axis gyroscope), G_ST (self-testing Z-axis gyroscope) and FS_SEL (gyroscope range selection) are included in this register configuration part. When FS_SEL is 0, the output range is  250
250 . When FS_SEL is 1, the output range is
  500
500 . When FS_SEL is 2, the output range is
  1000
1000 . When FS_SEL is 3, the output range is
  2000
2000 .
.
ACCEL_CONFIG: XA_ST (self-testing X-axis accelerometer), YA_ST (self-testing Y-axis accelerometer), ZA_ST (self-testing Z-axis accelerometer) and AFS_SEL (accelerometer range selection) are included in this register configuration part. The accelerometer configuration is shown in Tab. 2.
Table 2: Accelerometer configuration

The registers used to store the triaxial acceleration values are: ACCEL_XOUT_H, ACCEL_ XOUT_L, ACCEL_YOUT_H, ACCEL_YOUT_L, ACCEL_ZOUT_H, ACCEL_ZOUT_L.
The registers used to store the value of gyroscope: GYRO_XOUT_H, GYRO_XOUT_L, GYRO_YOUT_H, GYRO_YOUT_L, GYRO_ZOUT_H, GYRO_ZOUT_L.
The interrupt status register can read interrupt status in MPU-6050. The main interrupt sources are Free Fall Interrupt, Motion Interrupt, and Zero Motion Interrupt.
Free Fall Interrupt: The free fall is judged by comparing the magnitude of triaxial acceleration with the threshold value. If the acceleration is close to the threshold value, it triggers the free fall interrupt and change the flag bit. If the acceleration is less than the threshold, it is ignored.
Motion Interrupt: If the output value is greater than the threshold value, the counter increases by 1. Otherwise, the counter decreases by 1. When the value of counter reaches the threshold value, the motion interrupt will be triggered. When the flag bit is read, both free fall and motion interrupt become 0.
Zero Motion Interrupt: If the output value is smaller than the threshold value, the counter will increase by 1. When the value of counter reaches the threshold value, the static interrupt is triggered.
Interrupts can be triggered by the following events: Switching clock source, completing the DMP (Digital Motion Processor), reading data from FIFO (First-In, First-Out) data register and interrupt accelerometer.
In addition to the IIC interface connected to MPU6050, CC2541 also has two powerful asynchronous serial communication interfaces that support multiple serial protocols: USART0 and USART1. These two interfaces can not only run asynchronous UART mode but also run synchronous SPI mode.
The operation characteristics of UART mode are as follows: 1) Three calibration methods are applicable, namely odd parity, even parity and no parity. 2) Receive interrupts autonomously. 3) Access memory autonomously. 4) Check the error state through the checksum frame.
UART has two interface selection methods: 2-wire interface (using RXD and TXD), 4-wire interface (using RXD, TXD, RTS and CTS). In USART0, P0_2 corresponds to RX, P0_3 to TX, P1_4 to RX, and P1_5 to TX. In USART1, P0_5 corresponds to RX, P0_4 to TX, P1_7 to RX, and P1_6 to TX.
The UART operations mainly include UxCSR and UxUCR (x is 0 or 1, which is the USART number). Now take USART0 for example. U0CSR.MODE is used to set UART MODE. When U0CSR.RE is 0, the receiver is disabled. When U0CSR.RE is 1, the receiver is enabled. When U0CSR.FE is 0, it means no frame error detection.
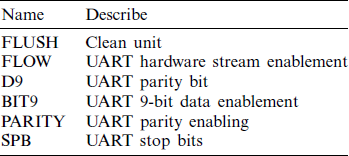
When U0CSR.FE is 1, it means the byte has received incorrect stop bit level. When U0CSR.ERR is 0, there is no parity error. When U0CSR.ERR is 1, there is parity error. U0CSR.RX_BYTE is 0 when no bytes are received. When U0CSR.RX_BYTE is 1, it is ready to receive bytes. When U0CSR.TX_BYTE is 0, the byte is not sent. When U0CSR.TX_BYTE is 1, the byte is written to the cache and the byte will be sent at last. When U0CSR.ACTIVE is 0, USART is idle. When U0CSR.ACTIVE is 1, USART is busy when sending or receiving. The table USART 0 UART Control-U0UCR (0xC4) is in Tab. 3.
Table 3: USART 0 UART control-U0UCR (0xC4)
3.1 Overall Design Scheme and Circuit Diagram Analysis
In this study, CC2541 is the main chip and MPU6050 is the data collection module which are to be integrated as a smart ring. Fig. 3 shows the overall scheme diagram. The smart ring includes the sensor module, power supply, and the Bluetooth transmission unit. APP is developed as a smartphone application to display the data. Fig. 4 shows the circuit of CC2541 module.
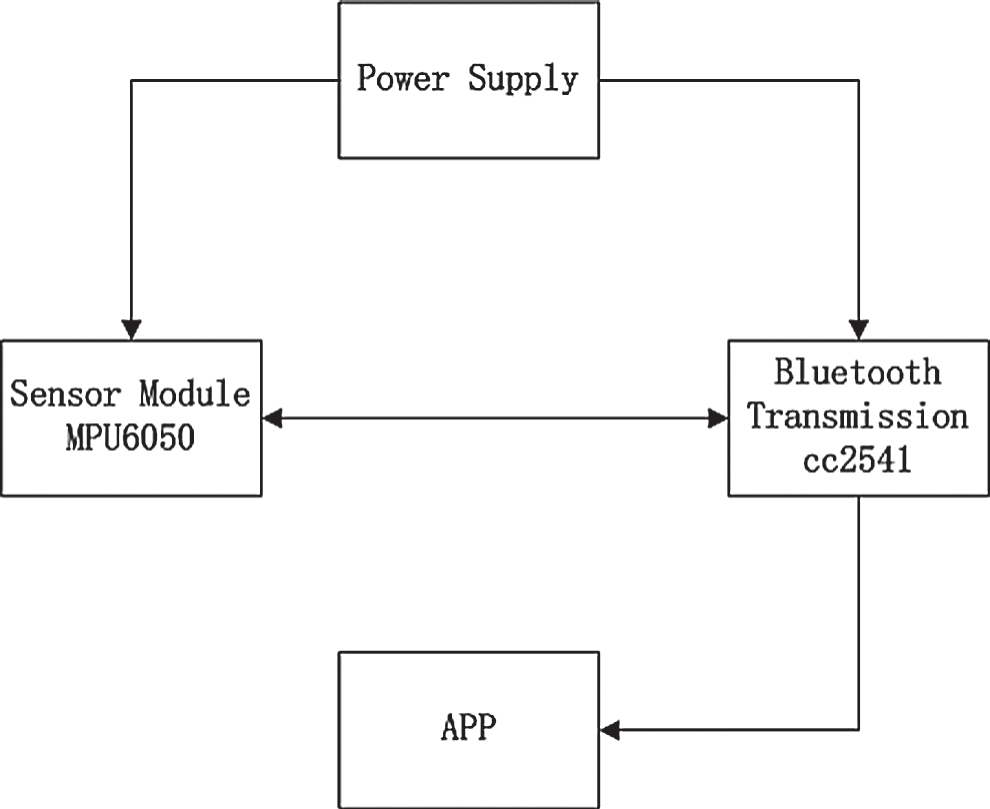
Figure 3: Overall scheme diagram

Figure 4: Circuit of CC2541 bluetooth module
3.2 Design of CC2541 Reset Circuit
CC2541 RESET pin can reset CC2541. The reset function will initialize the system to the original state when all registers are cleared. In this design, the reset button is used for future development. Fig. 5 is the reset button circuit.
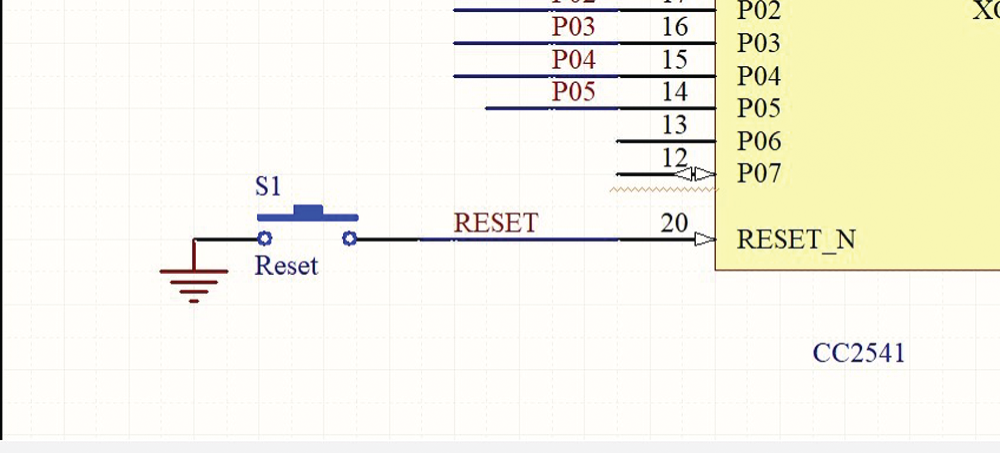
Figure 5: Reset button circuit
Under normal conditions, the key will always be in a disconnected state, and the RESET pin will always be in a low-level state. When the key is pressed, RESET is directly connected to the power supply. At this time, RESET is 1 and the starts to reset. Of course, C and R determine the duration of the high level. The advantage of button reset is that it can be reset at any time. But there are also disadvantages. For instance, the operation is more complex and welding is more difficult.
3.3 Crystal Oscillator Circuit Design of CC2541
Considering the low power consumption, a primary and a secondary crystal oscillator are added according to the user manual of CC2541. The main crystal oscillator is connected to the circuit of 22 and 23 pins. Fig. 6 shows the crystal oscillator circuit.
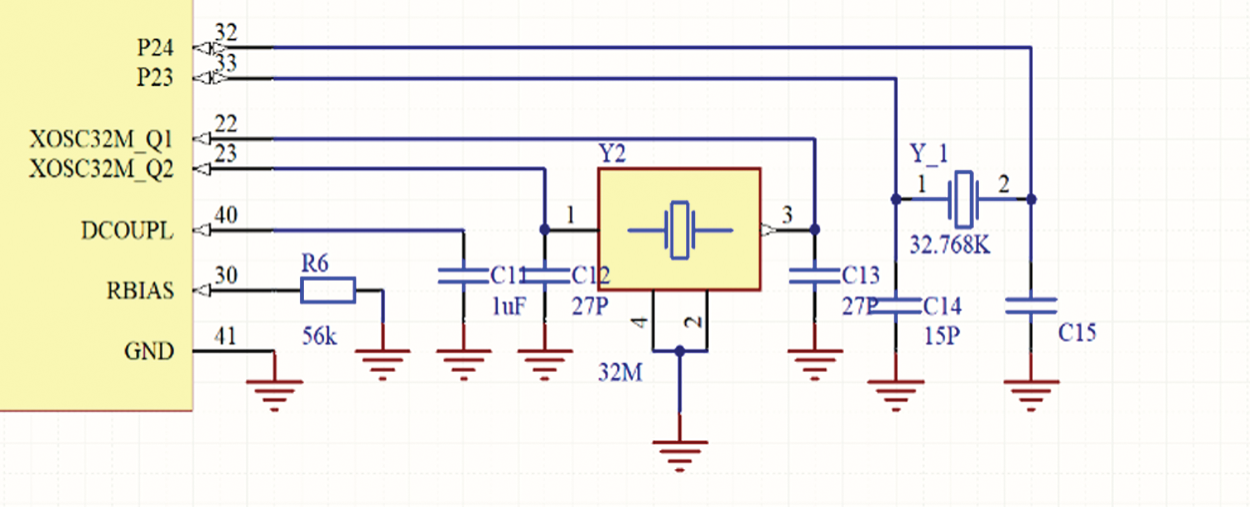
Figure 6: Crystal oscillator circuit
The reason why the RC internal oscillator of 16 MHz is not used is that it has low accuracy which cannot be used in RF transceivers. The main frequency of auxiliary crystal oscillator is 32.768 KHz according to the manual, which is added to achieve low power consumption. In general, the crystal oscillator is matched with capacitors. The main crystal oscillator and the auxiliary crystal oscillator have two capacitors respectively according to the manual, which can effectively assist the crystal to vibrate and improve the stability of the circuit.
3.4 CC2541 RF Circuit and Antenna Design
The 25 and 26 pins of CC2541 are RF pins, and a 50 ohms impedance is the best match for RF communication according to the manual. Therefore, a device named 2450BM15A0002 of balun is used in this design. Considering the ceramic antenna is smaller than traditional PCB antenna, ceramic antenna is selected. Fig. 7 is the RF circuit and antenna.

Figure 7: RF circuit and antenna
CC2541 and MPU6050 have SCL pin, SDA pin and IIC interface, which can receive and send data. NFC is used for communication between CC2541 and MPU6050. MPU6050 transmits the collected data to CC2541 using the two pins, and then the data will be transmitted to the mobile terminal using the Bluetooth module.
Since 5 V is the reference voltage, the voltage stabilizing circuit Lm1117 is used. The advantage of LM1117 is the high voltage stability, accuracy, small temperature drift at high and low temperature and simple peripheral circuit. The output current can reach 0.8 A with 0.2% voltage stability and 0.4% load stability. A light emitting diode is added to the far right to indicate whether it is working to prevent the battery from connecting backwards. Fig. 8 shows the power supply circuit.

Figure 8: Power supply circuit
This design uses a CC2541 chip, which has low power consumption. The current is only 0.5 mA in external interrupt mode. In order to meet the requirements of low power consumption, 32.768 kHz auxiliary crystal oscillator is used.
4 Tremor Detection Algorithm Design
After calling the main function, the system will enter the initial state, and then continuously send the current state of the device in the while loop. The program flow diagram is shown in Fig. 9.
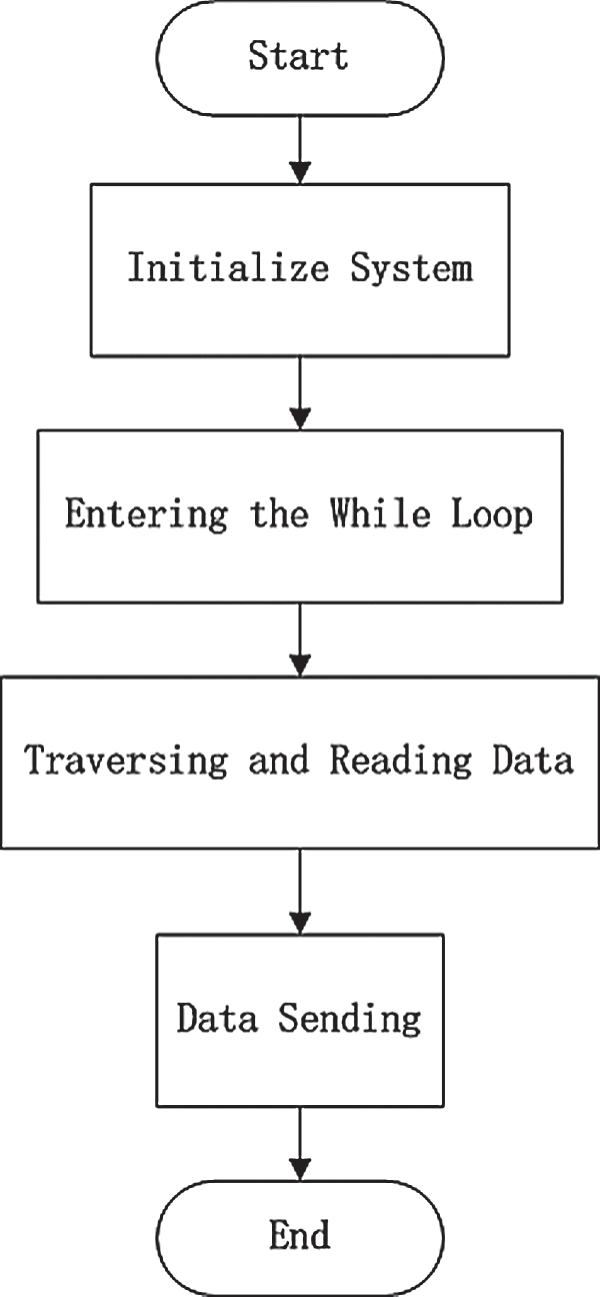
Figure 9: System flow design
4.2 Internal Drive Function Flow of MPU6050
After calling the MPU6050 drive function, it then tests readability of the data collected by MPU6050 and the stability of connection. It then sends all data of the triaxial acceleration and angular velocity to CC2541 by NFC. The flow diagram is shown in Fig. 10.

Figure 10: Internal flow diagram
4.3.1 Initialize and Test the Connection Fragment
The algorithm for collecting inertial data is shown in Fig. 11.

Figure 11:
At first, IIC is initialized and bIfConnected is set with a flag ahead of time. If AD0 of MPU6050 is in low level, then the connection is successful. And then assign a value of 1 to bIfConnected and initialize MPU6050.
Using a for loop, all the data in the IIC device are read and stored in the array for invocation. Where Slave Address is the device address, REG_Address is the device’s internal register address, readNum is the maximum number of internal registers, and I2CSlaveBuffer[PORT_USED][i] is the array to be sent.
The variables ax, ay, az receive the unprocessed triaxial acceleration data from registers and gx, gy, gz receive the unprocessed triaxial angular velocity data from the correspondent registers. These data will be continuously passed to the DMP motion chip for further processing and then being transmitted to the mobile client by the Bluetooth module.
The data packet of the communication protocol usually has 20 bytes, including header (1 byte), effective data length (1 byte), function code (1 byte), effective data (0–16 bytes), checksum (1 byte, the sum of data before the checksum in the package), and complement byte (0–16 bytes). Firstly, check the following packet head to see whether it is  . If so, continue the following operation and analyze whether the packet head of the transmitted packet is
  or
or  respectively. If it is
  , it indicates that the packet is an acceleration packet. Otherwise, it is an angular velocity packet.
5 System Experiments and Results
An smartphone application is designed as shown in Fig. 12. In this interface, x, y and z in the diagram are displayed for acceleration and angular velocity. In the test process, click the “Select Bluetooth” button to select the corresponding Bluetooth. At this time, each axial waveform will be displayed on the screen, and the data will be saved into two files in the system with file extension “.txt”, with “ble6050a.txt” storing acceleration data, and “ble6050b.txt” storing angular velocity data.

Figure 12: APP page
5.2 Prototype of the Ring Device
The smart ring implemented in this study uses a plastic platform, which does not produce much interference compared with using metal material. The Printed Circuit Board (PCB) contains a switch, MPU6050, CC2541. When the switch is open, a LED lamp will light up to indicate that the device is running. Fig. 13 shows the prototype and the PCB diagram.
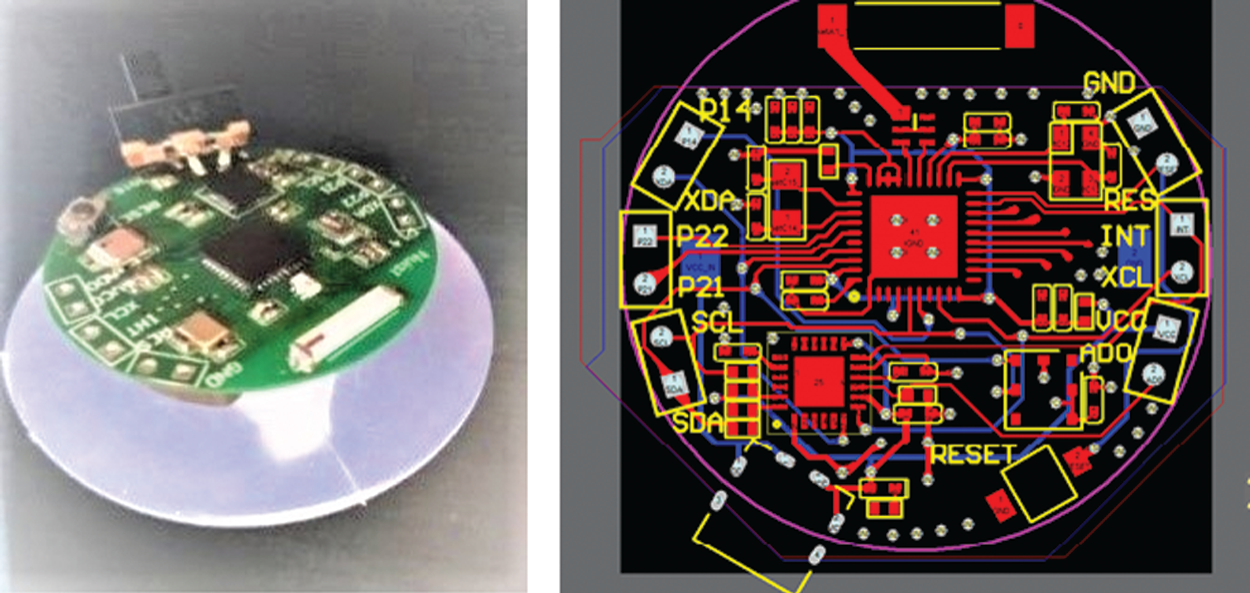
Figure 13: Prototype and PCB diagram
5.3 Experiments and Results Analysis
5.3.1 Measuring the Intensity of Finger Tremor
In our experiment, hand tremor is simulated by healthy people using protocols based on the study as described in the research background. Three tests are conducted in this study. All participants wear the ring device in their fingers (see Fig. 14).
Sample 1: The tested person stays static.
Sample 2: The tested person walks normally.
Sample 3: The tested person simulates the tremor.
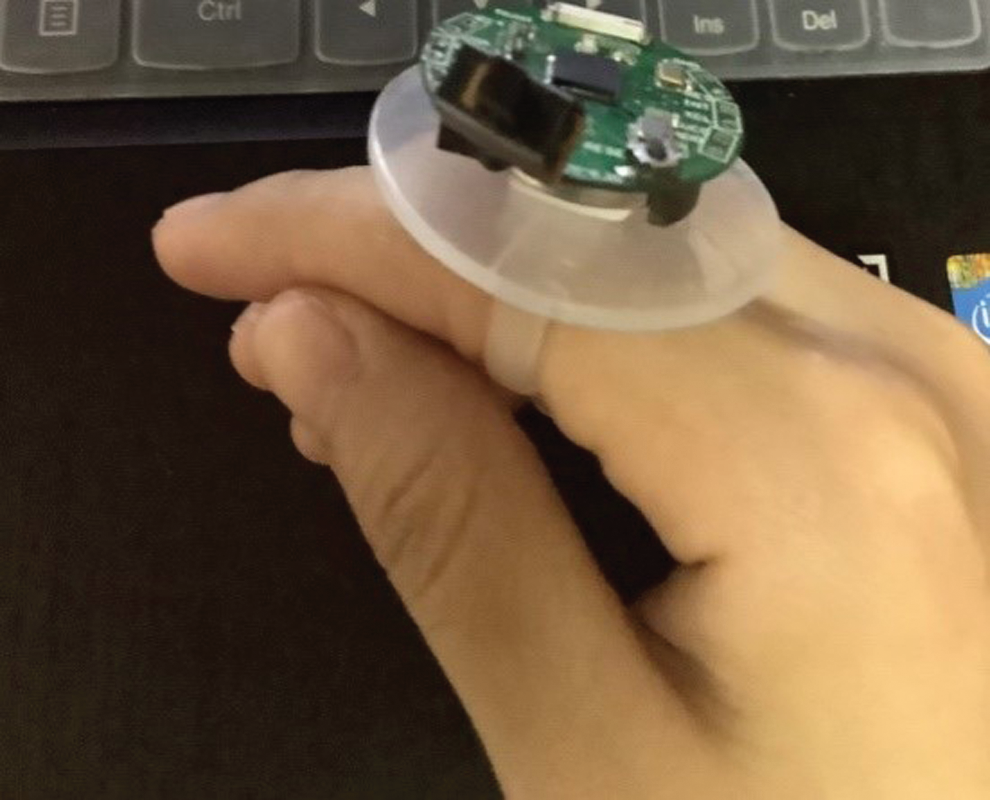
Figure 14: Wearing device on one finger
During the test, we transmitted the data to the mobile APP according to the operation instructions and selected sample screenshots as shown in the figures. Fig. 15 shows the waveform of three axis acceleration and angular velocity of Sample 1. Fig. 16 shows the waveform of Sample 2. Fig. 17 shows the waveform of Sample 3.
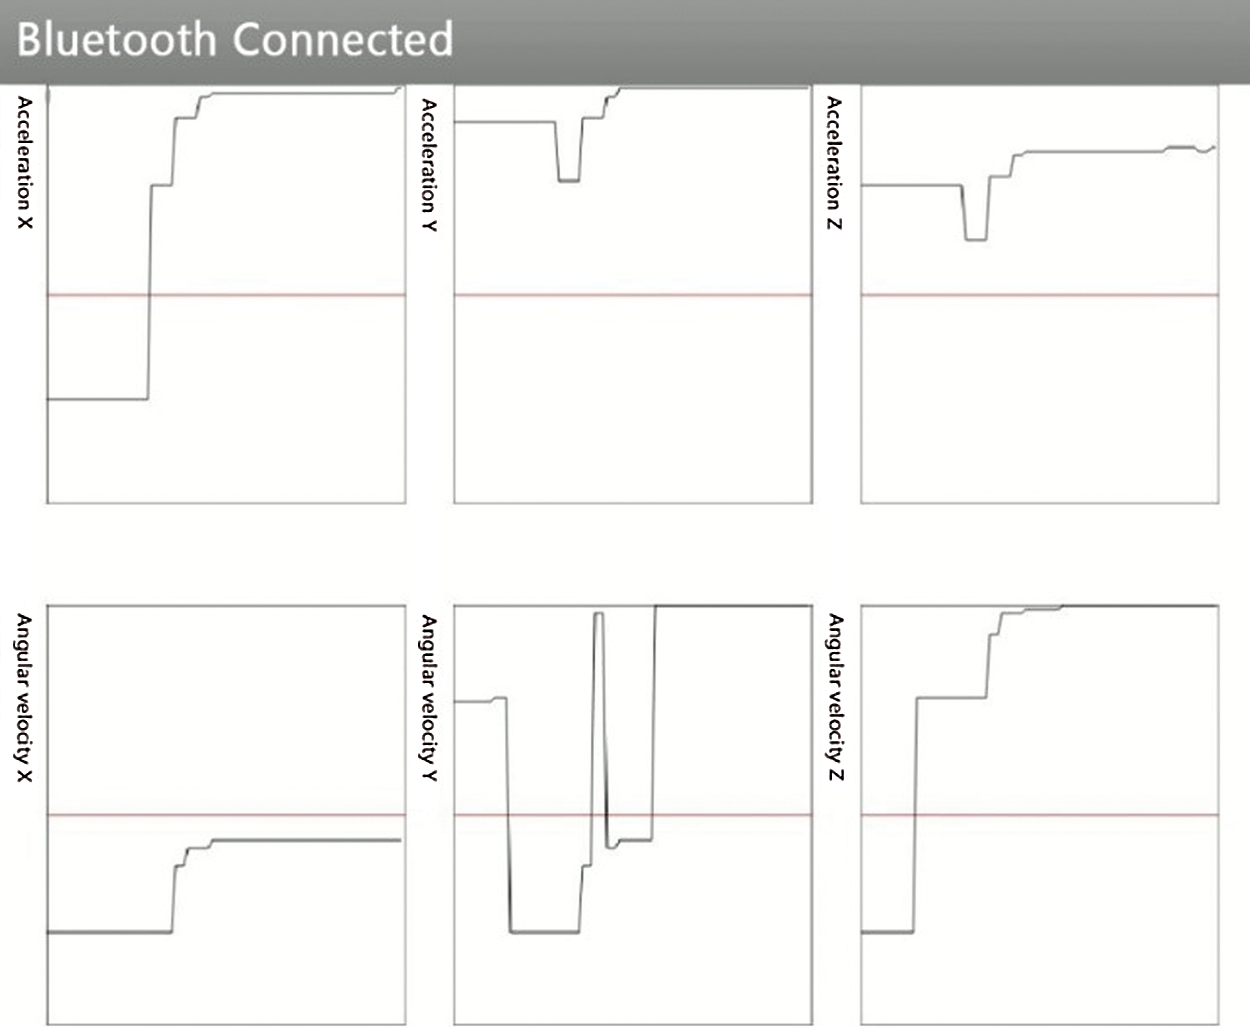
Figure 15: Waveform of three axis acceleration and angular velocity of Sample 1

Figure 16: Waveform of three axis acceleration and angular velocity of Sample 2
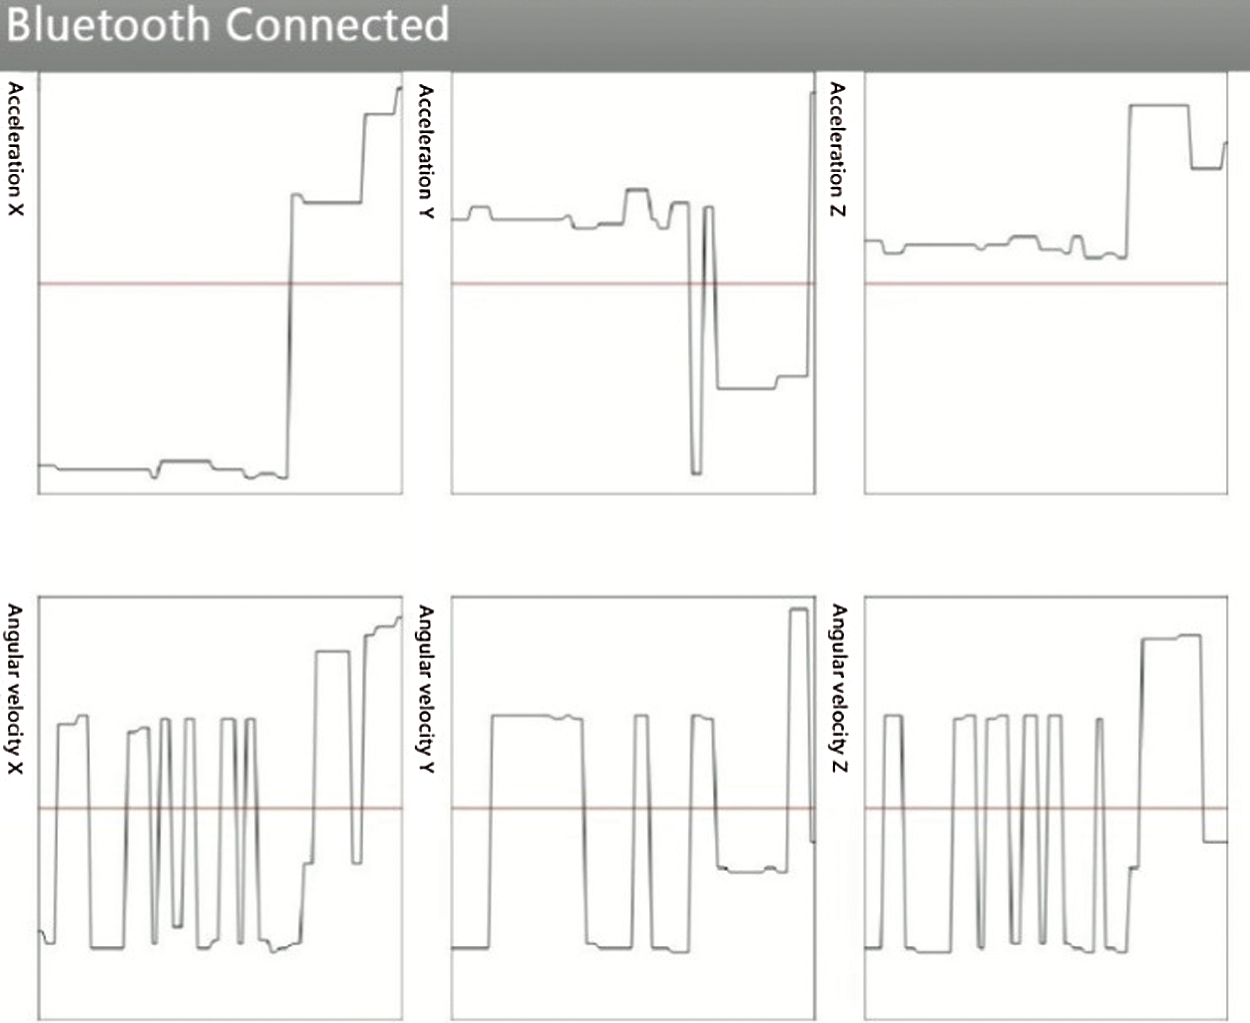
Figure 17: Waveform of three axis acceleration and angular velocity of Sample 3
Tabs. 4–9 present the raw data of the three samples of the experiments, and Tabs. 10–12 present the processed data, where acceleration of three-axis is processed by numerical value/ g (where g is the acceleration of gravity and taken as 9.8
  ), and angular velocity of three-axis is processed by numerical value/
 (
( ).
).
Table 4: Acceleration raw data of Sample 1

Table 5: Angular velocity raw data of Sample 1

Table 6: Acceleration raw data of Sample 2

Table 7: Angular velocity raw data of Sample 2

Table 8: Acceleration raw data of Sample 3
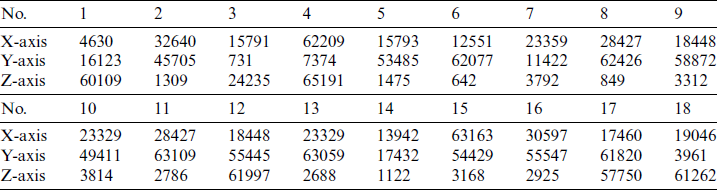
Table 9: Angular velocity raw data of Sample 3

Table 10: Strength table after Sample 1 treatment

Table 11: Strength table after Sample 2 treatment

Table 12: Strength table after Sample 3 treatment

Tab. 4 shows the acceleration raw data of Sample 1.
Tab. 5 shows the angular velocity raw data of Sample 1.
Tab. 6 shows the acceleration raw data of Sample 2.
Tab. 7 shows the velocity raw data of Sample 2.
Tab. 8 shows the acceleration raw data of Sample 3.
Tab. 9 shows the angular velocity raw data of Sample 3.
Tab. 10 shows strength table after Sample 1 treatment.
Tab. 11 shows strength table after Sample 2 treatment.
Tab. 12 shows strength table after Sample 3 treatment.
Figs. 18 and 19 show the intensity comparison of three samples for movements of static state, walking state, and simulated tremor by “counting money.” Examining the waveform of figure and the line graph of the processed intensity values of the acceleration and angular velocity, it can be found that acceleration of Sample 1 is stable at 275 and angular velocity is stable at 2000. The acceleration of Sample 3 fluctuates and so does the angular velocity.
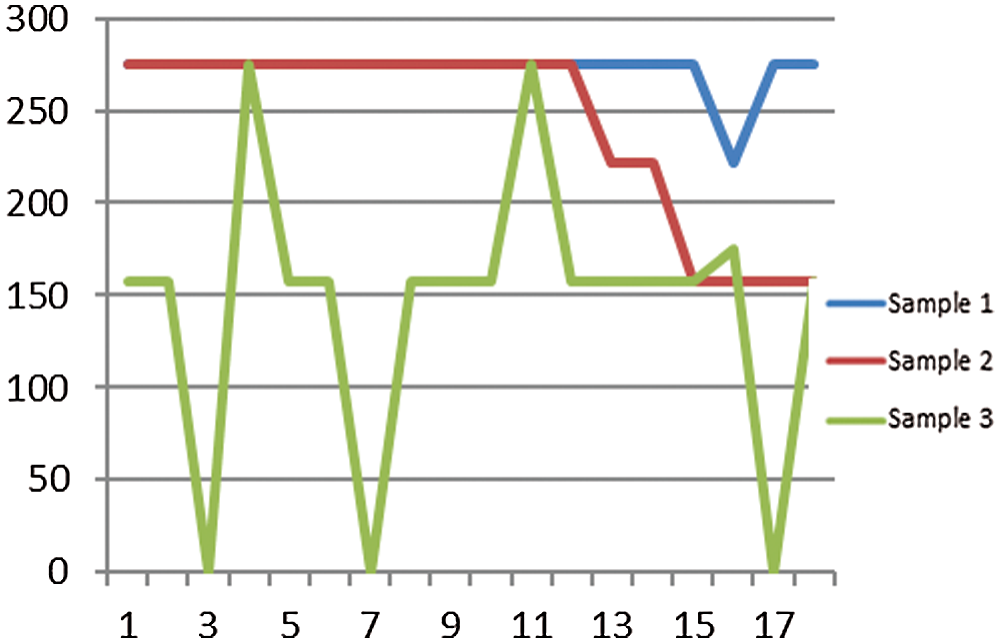
Figure 18: Acceleration intensity comparison diagram
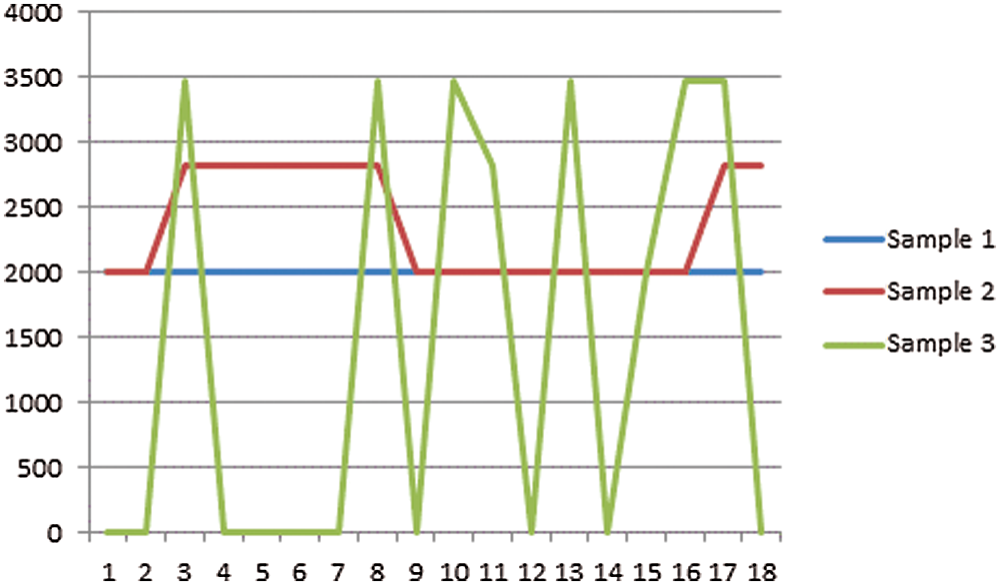
Figure 19: Angular velocity intensity comparison diagram
5.3.2 Determine the Degree of Bradykinesia in Parkinson’s Patients
To assess the severity of PD, the Unified Parkinson’s Disease Rating Scale (UPDRS) is most commonly used. In this experiment, measuring the movement time between the touching of thumb and the index finger is the most important part in order to analyze the symptoms of bradykinesia between Parkinson’s patients and normal people. In the experiment, three participants conducted as healthy people (Participant 1, Participant 2 and Participant 3) and three participants (Participant 4, Participant 5 and Participant 6) simulated PD of UPDRS level 1–3. All these participantss touched the index finger with thumb, and the movement time was measured respectively.
The movement time T between the touching of thumb and the index finger can be calculated using the collected data  ,
,  ,
,  , which represent the mutually perpendicular accelerated speed. Eq. (1) is the relationship between resultant acceleration and the three components.

where,  is the resultant acceleration, which can be represented using one 3-tuple (r,
  ,
,  ) according to the spherical coordinate system. After the coordinate transformation from Cartesian to spherical, the resultant acceleration
  will be in the form of Eq. (2).

The movement time T can be measured by evaluating the period P of angle  or
or  using the Discrete-Time Fourier Transform Eq. (3). The sequence with N samples of angle
  can be denoted as
  when only considering angle
  .
.

where,  represents the angular velocity of
  . We then calculate the
  which makes the
  to achieve the maximum value. Then,
  will be the movement time between the touching of thumb and the index finger.
Fig. 20 is the maximum finger opening.

Figure 20: Maximum finger opening
Fig. 21 is the moderate opening of the finger.
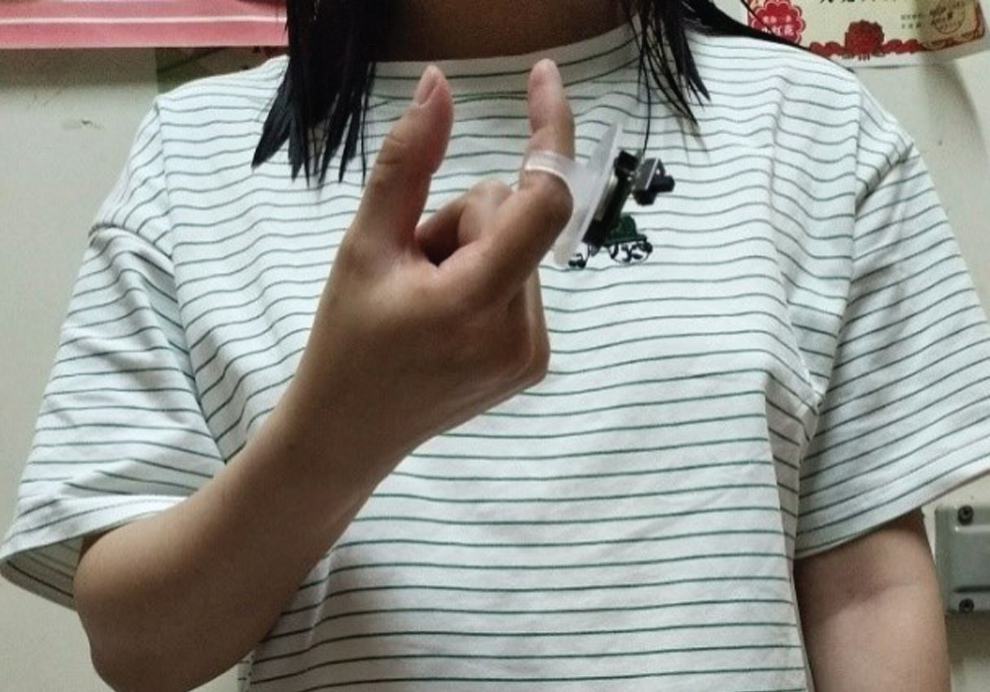
Figure 21: Moderate opening of the finger
Fig. 22 is the two-finger touch diagram.

Figure 22: Two-fingers touch
Tab. 13 shows the movement time of each sample and the doctor’s ratings according to UPDRS.
Table 13: Time recording table

It can be seen that the average finger movement time is 307 ms, and the standard deviation is 55 ms. The higher the level of bradykinesia is, the more serious the disease is. According to the experimental results, the severity of symptom S is approximately linear with the finger touch time T. The following Eq. (4) is a simple formula of the linear relationship between S and T:

where a, b are the coefficients which can be determined by experimental results.
As can be seen in the experiments, the resting state waveform of Sample 1 is not very smooth which may be caused by the following factors:
The fingers cannot stay completely still.
The interference of surrounding environment exists.
In this paper, we presented the design and implementation of a smart wearable device (smart ring) for detecting hand tremor for Parkinson’s disease patients. We used MPU6050 (MIDI Processing Unit) consisting of a 3-axis gyroscope and a 3-axis accelerometer to collect acceleration and angular velocity of fingers. By analyzing the time of specific finger movements, we successfully recognized the tremor signals with high accuracy. Meanwhile, with Bluetooth 4.0 (Bluetooth Low Energy, BLE) and networking terminal ability, tremor data are transferred to a monitoring smartphone application in real time. The experimental results have shown that the proposed device is convenient for long-term tremor detection which is vital for early detection and treatment for Parkinson’s disease. As future work, we will continue our study to address the following issues we found with the product: (1) The selected 5 V button battery caused a noticeable amount of power consumption in the process of transmitting data, making the standby time of the smart ring shorter; (2) Although the size of the smart ring is small, the physical switch is big which should be improved; (3) Open source Android APP is selected so that the conclusion can be obtained only by refreshing the interface and then further analysis of data can be conducted to best utilize this smart device.
Funding Statement: This work is supported by the National Natural Science Foundation of China (Grant Nos. 61972207 and 61802196), Jiangsu Provincial Government Scholarship for Studying Abroad and the Priority Academic Program Development of Jiangsu Higher Education Institutions (PAPD) fund.
Conflicts of Interest: The authors declare that they have no conflicts of interest to report regarding the present study.
1. Lieber, B., Taylor, B., Appelboom, G., McKhann, G., Connolly, E. (2015). Motion sensors to assess and monitor medical and surgical management of parkinson disease. World Neurosurgery, 84(2), 561–566. DOI 10.1016/j.wneu.2015.03.024. [Google Scholar] [CrossRef]
2. Camara, C., Lsasi, P., Warwick, K., Ruiz, V., Aziz, T. et al. (2015). Resting tremor classification and detection in Parkinson’s disease patients. Biomedical Signal Processing and Control, 16, 88–97. DOI 10.1016/j.bspc.2014.09.006. [Google Scholar] [CrossRef]
3. Alhussein, M. (2017). Monitoring Parkinson’s disease in smart cities. IEEE Access, 5, 19835–19841. DOI 10.1109/ACCESS.2017.2748561. [Google Scholar] [CrossRef]
4. Nilashi, M., Ibrahim, O., Ahmadi, H., Shahmoradi, L. (2017). An analytical method for diseases prediction using machine learning techniques. Computers & Chemical Engineering, 106, 212–223. DOI 10.1016/j.compchemeng.2017.06.011. [Google Scholar] [CrossRef]
5. Lee, C., Fong, V. H., Chu, Y., Cheng, L., HW, C. et al. (2019). A wearable device of gait tracking for Parkinson’s disease patients. International Conference on Machine Learning and Cybernetics, pp. 1–6, Zhuhai, China. [Google Scholar]
6. Grammatikopoulou, A., Grammalidis, N., Bostantjopoulou, S., Katsarou, Z. (2019). Detecting hypomimia symptoms by selfie photo analysis: For early Parkinson disease detection. Proceedings of the 12th ACM International Conference on PErvasive Technologies Related to Assistive Environments, pp. 517–522, Rhodes, Greece. [Google Scholar]
7. Prashanth, R., Roy, S. D., Mandal, P. K., Ghosh, S. (2016). High-accuracy detection of early Parkinson’s disease through mul-timodal features and machine learning. International Journal of Medical Informatics, 90, 13–21. DOI 10.1016/j.ijmedinf.2016.03.001. [Google Scholar] [CrossRef]
8. Contreras, R., Huerta, M., Sagbay, G., LLumiguano, C., Bravo, M. et al. (2016). Tremors quantification in Parkinson patients using smartwatches. IEEE Ecuador Technical Chapters Meeting, pp. 1–6, Guayaquil, Ecuador. [Google Scholar]
9. Ozinga, S. J., Linder, S. M., Alberts, J. L. (2016). Use of mobile device accelerometry to enhance evaluation of postural instability in Parkinson disease. Archives of Physical Medicine and Rehabilitation, 98(4), 649–658. DOI 10.1016/j.apmr.2016.08.479. [Google Scholar] [CrossRef]
10. Wang, W., Xie, L., Wang, X. (2017). Tremor detection using smartphone-based acoustic sensing. Proceedings of the 2017 ACM International Joint Conference on Pervasive and Ubiquitous Computing and Proceedings of the 2017 ACM International Symposium on Wearable Computers, pp. 309–312, Maui, Hawaii. [Google Scholar]
11. Oess, N. P., Wanek, J., Hedel, H. J. A. (2010). Enhancement of bend sensor properties as applied in a glove for use in neurorehabilitation settings. 2010 Annual International Conference of the IEEE Engineering in Medicine and Biology, pp. 5903–5906, Buenos Aires, Argentina. [Google Scholar]
12. Pierleoni, P., Palma, L., Belli, A., Pernini, L. (2014). A real-time system to aid clinical classification and quantification of tremor in Parkinson’s disease. IEEE-EMBS International Conference on Biomedical and Health Informatics, pp. 113–116, Chicago, USA. [Google Scholar]
13. Butson, C. R., Tamm, G., Jain, S., Fogal, T., Kruger, J. (2013). Evaluation of interactive visualization on mobile computing platforms for selection of deep brain stimulation parameters. IEEE Transactions on Visualization and Computer Graphics, 19(1), 108–117. DOI 10.1109/TVCG.2012.92. [Google Scholar] [CrossRef]
14. Alvarez, F., Popa, M., Solachidis, V., Penaloza, G. H., HernÃindez, A. B. et al. (2018). Behavior analysis through multimodal sensing for care of Parkinson’s and Alzheimer’s patients. IEEE MultiMedia, 25(1), 14–25. DOI 10.1109/MMUL.2018.011921232. [Google Scholar] [CrossRef]
15. Aharonson, V., Schlesinger, I., McDonald, A. M., Dubowsky, S., Korczyn, A. D. (2018). A practical measurement of Parkinson’s patients gait using simple walker-based motion sensing and data analysis. Journal of Medical Devices, 12(1), 368. DOI 10.1115/1.4038810. [Google Scholar] [CrossRef]
16. Vega, J. (2016). Monitoring Parkinson’s disease progression using behavioural inferences, mobile devices and web technologies. Proceedings of the 25th International Conference Companion on World Wide Web, pp. 323–327, Montréal Québec, Canada. [Google Scholar]
17. Zhuang, W., Chen, Y., Su, J., Wang, B., Gao, C. (2019). Design of human activity recognition algorithms based on a single wearable IMU sensor. International Journal of Sensor Networks, 30(3), 193. DOI 10.1504/IJSNET.2019.100218. [Google Scholar] [CrossRef]
18. Li, L., Yu, Q., Xu, B., Bai, Q., Zhang, Y. et al. (2017). Multi-sensor wearable devices for movement monitoring in Parkinson’s disease. 8th International IEEE/EMBS Conference on Neural Engineering, pp. 70–73, Shangai, China. [Google Scholar]
19. Tay, A., Yen, S. C., Lee, P. Y., Wang, C. Y., Neo, A. et al. (2015). Freezing of gait (fog) detection for Parkinson disease. 10th Asian Control Conference, pp. 1–6, Kota Kinabalu, Malaysia. [Google Scholar]
 | This work is licensed under a Creative Commons Attribution 4.0 International License, which permits unrestricted use, distribution, and reproduction in any medium, provided the original work is properly cited. |