DOI: 10.32604/cmes.2021.014524
ARTICLE
Simulating the Turbulent Hydrothermal Behavior of Oil/MWCNT Nanofluid in a Solar Channel Heat Exchanger Equipped with Vortex Generators
1Unité de Recherche en Energies Renouvelables en Milieu Saharien, URERMS, Centre de Développement des Energies Renouvelables, CDER, Adrar, 01000, Algeria
2Department of Physics, Unit of Research on Materials and Renewable Energies, Faculty of Sciences, Abou Bekr Belkaid University, Tlemcen, 13000, Algeria
3Department of Mathematics, Science Faculty, Firat University, Elazig, 23119, Turkey
4Department of Medical Research, China Medical University Hospital, China Medical University, Taichung, 40402 , Taiwan
5Department of Mathematics, Huzhou University, Huzhou, 313000, China
6Hunan Provincial Key Laboratory of Mathematical Modeling and Analysis in Engineering, Changsha University of Science & Technology, Changsha, 410114, China
7Department of Technology, University Centre of Naama, Naama, 45000, Algeria
8Department of Engineering and Architecture, University of Parma, Parco Area delle Scienze 181/A, Parma, 43124, Italy
*Corresponding Author: Yu-Ming Chu. Email: chuyuming2005@26.com; Mustafa Inc. Email: minc@firat.edu.tr
Received: 05 October 2020; Accepted: 18 November 2020
Abstract: Re-engineering the channel heat exchangers (CHEs) is the goal of many recent studies, due to their great importance in the scope of energy transport in various industrial and environmental fields. Changing the internal geometry of the CHEs by using extended surfaces, i.e., VGs (vortex generators), is the most common technique to enhance the efficiency of heat exchangers. This work aims to develop a new design of solar collectors to improve the overall energy efficiency. The study presents a new channel design by introducing VGs. The FVM (finite volume method) was adopted as a numerical technique to solve the problem, with the use of Oil/MWCNT (oil/multi-walled carbon nano-tubes) nanofluid to raise the thermal conductivity of the flow field. The study is achieved for a Re number ranging from  to
to  , while the concentration (
 ) of solid particles in the fluid (Oil) is set to 4%. The computational results showed that the hydrothermal characteristics depend strongly on the flow patterns with the presence of VGs within the CHE. Increasing the Oil/MWCNT rates with the presence of VGs generates negative turbulent velocities with high amounts, which promotes the good agitation of nanofluid particles, resulting in enhanced great transfer rates.
Keywords: Channel heat exchanger; forced-convection; Oil/MWCNT nanofluid; CFD; vortex generators
Nomenclature
 | Specific heat at constant pressure, J kg−1 K−1 |
 | Hydraulic diameter of exchanger, m |
 | Oil molecular diameter, m |
 | Nanoparticle diameter, m |
 | Cross-diffusion |
 | Thickness of VG, m |
 | Height of exchanger, m |
 | K generation due to mean-velocity-gradients |
G |
|
 | Local convective heat transfer coefficient, W m−2 K−1 |
 | Kinetic energy of turbulence, m2 s−2 |
 | Length of exchanger, m |
 | ‘Inlet—attached-VG’ distance, m |
 | ‘Detached-VG–exit’ distance, m |
| Nu | Average Nusselt number of baffled exchanger |
 | Average Nusselt number for smooth exchanger |
 | Pressure, Pa |
 | Atmospheric pressure, Pa |
 | Pressure coefficient |
| Pd | Dynamic pressure, Pa |
| Pr | Number of Prandtl |
| Re | Number of Reynolds |
 and and  | Source terms |
 | Temperature, K |
| TI | Turbulent intensity, % |
 | Inlet fluid temperature, K |
 | Wall temperature, K |
 | X-velocity, m s−1 |
 | Velocity in xi-direction, m s−1 |
 | Intake velocity, m s−1 |
 | Velocity in xj-direction, m s−1 |
 | Average velocity, m s−1 |
 | Y-velocity, m s−1 |
 | K dissipation due to turbulence |
 |
|
Greeks Symbols
 | K effective-diffusivity |
 |
|
 | Kroenecker delta |
 | Thermal-conductivity, W m−1 K−1 |
 | Dynamic viscosity, kg m−1 s−1 |
 | Effective viscosity, kg m−1 s−1 |
 | Turbulent viscosity, kg m−1 s−1 |
 | Density, kg m−3 |
 | Solid fraction, % |
 | Stream-function, kg/s |
 | Specific dissipation rate |
Subscript
| atm | Atmosphere |
| eff | Effective |
 | Bass fluid |
| in | Intake |
| nf | Nanofluid |
 | Nanoparticle |
 | Outlet |
 | Turbulent |
 | Wall |
 | Local |
The insertion of turbulators and vortex generators (Ts-VGs) inside channel heat exchangers (CHEs) is well-known for its efficiency to enhance the convective heat transfer [1–7]. Several studies have been reported on CHEs equipped with various types of obstacles.
Berner et al. [8] characterized the turbulent flow details throughout a channel with segmented baffles. Under laminar flow conditions, Webb et al. [9] simulated the dynamic behavior inside a duct with transverse ribs. The significant increase in transfer of heat was reached for fluids with high Pr numbers, such as fluorocarbons or water. Demartini et al. [10] mounted baffles on the surfaces of a rectangular duct to enhance the hydrothermal characteristics. Antoniou et al. [11] employed the hot wire technique to inspect the flow pattern around a prism with different aspect ratios (L/H). The increase of L/H yielded a reattachment of flows on the prism surface and downstream, with a reduction of turbulence scales and recirculation lengths.
By using numerical simulations and for a backward-facing step, Tsay et al. [12] obtained an enhancement by 190% in Nu number by employing a baffle. A strong dependence of the hydrothermal characteristics on the position of the baffle was also observed. Nasiruddin et al. [13] compared the efficiency of three orientations of baffles inside a tube heat exchanger. The highest performance was obtained with the 15 -downstream inclined baffle. Under turbulent flow conditions and by numerical simulation, Yongsiri et al. [14] addressed the impact of attack angles (0 to 165
 ) of detached-ribs in a channel. At high Re, the cases of 60
 and 120
 inclined ribs were the most efficient in terms of thermal transfer. However, so significant effect of the rib attack angle was observed at low Reynolds number. Ameur [15] inspected also the effect of baffle inclination inside a channel heat exchanger.
By experiments, Khan et al. [16] combined rib obstacles with inclined perforated baffles in a duct to enhance the hydrothermal behavior. Their results showed that the combination of ribs with baffle is an efficient technique in cases where the thermal transfer rate is critical to the device efficiency. Through numerical simulations and experiments, Ary et al. [17] used perforated VGs with holes of inclined-type diamond-shape in a duct. The numbers of holes had a great impact on the fluid current aspects and the local characteristics of transfer of heat. Furthermore, the efficiency of the single baffle was found to be lower than that of two baffles. Using a Re number ranging from  to
to  , Ko et al. [18] measured the hydrothermal details within a channel provided with staggered porous obstacles. An enhancement in the heat transfer rates by 300% has been obtained in comparison with the unbaffled channel.
Under laminar flow conditions, Guerroudj et al. [19] predicted the impact of the shape of porous type blocks on the thermal transfer in a duct with the presence of simultaneous effect of buoyant and forced flows. The hydrothermal characteristics have been substantially altered by the shape of the blocks. For Re varying from 102 to  , Sripattanapipat et al. [20] found an augmentation in the transfer of heat, from 200 to 680%, when using staggered diamond-shaped baffles with various inclination angles (5 to
  ) in a horizontal channel. However, the friction loss has been increased up to 220 times over the unbaffled channel. By experiments, Abene et al. [21] inspected the efficiency of different kinds of VGs on the efficiency of an air-flow solar-channel, namely: waisted type tube (WT), waisted delta type lengthways (WDL1), ogival inclined type folded (OIF1), ogival type transverse (OT), and waisted ogival type lengthways (WOL1). The highest efficiency has been reached with the WDL1.
Bopche et al. [22] used turbulators of form of U on the surface of an absorber found in an air-flow heater. The values of Nu number as well as friction factor have been increased by about 2.82 and 3.72 times over than those for the unbaffled duct, respectively. Kumar et al. [23] determined the performance of an air-flow solar channel equipped with V-obstacles. Among the different cases inspected, the highest performance factor was around 3.14. Ameur et al. [24] reported a simulation to test the influence of a new baffle shape on the hydrodynamics and filtration of a membrane system. They examined two orientations of hemispherical baffles, namely: RO baffle for the Right Orientation and LO baffle for the Left Orientation.
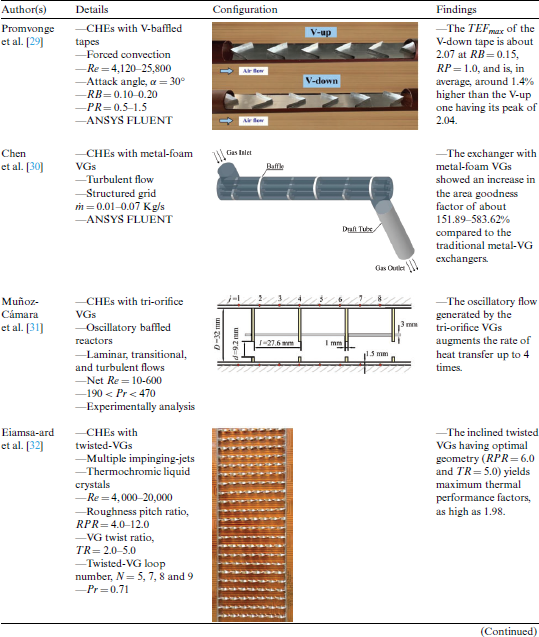
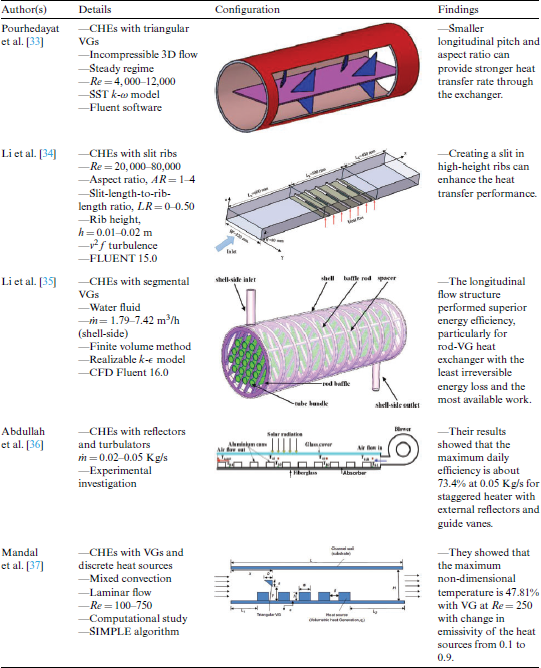
For turbulent flows through CHEs, Li et al. [25] found that the multi V type baffles may provide an improvement in the thermal performance factor up to 12%. Other interesting papers are available (Tab. 1), such as those of Yang et al. [26], Tongyote et al. [27], Ribeiro et al. [28], Promvonge et al. [29], Chen et al. [30], Muñoz-Cámara et al. [31], Eiamsa-ard et al. [32], Pourhedayat et al. [33], Li et al. [34,35], Abdullah et al. [36] and Mandal et al. [37].
Table 1: Performance improvement of CHEs by using Ts-VGs

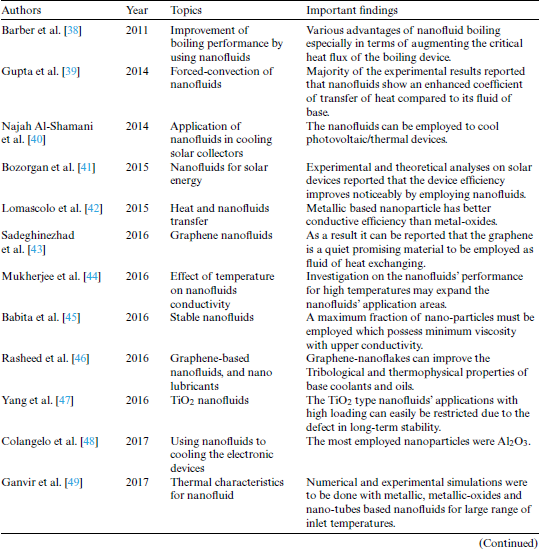
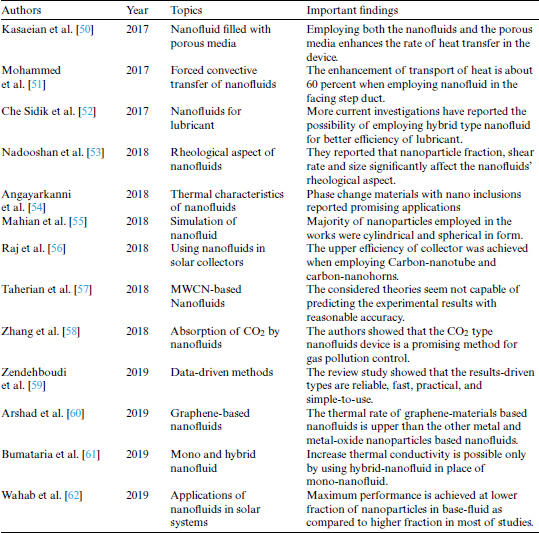
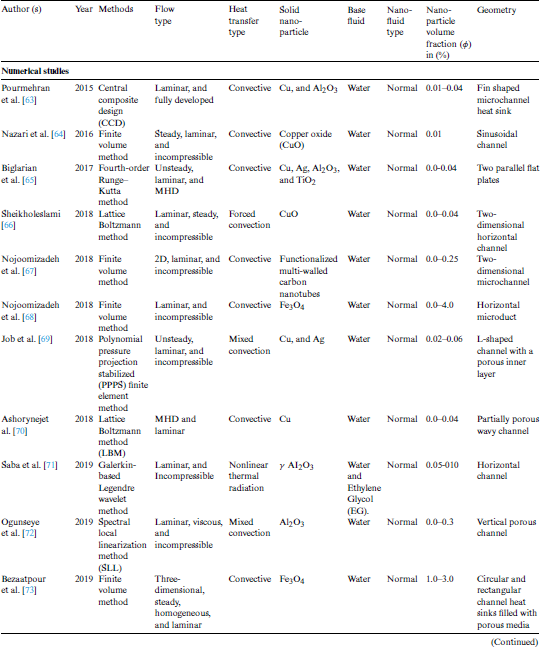
Most of these studies have known a deterioration in their effectiveness of their engineering devices, due to their use of traditional fluids known to have low values of thermal conductivities, such as oil, ethylene glycol, water, etc. To address this constraint, researchers used the nanotechnology technique by supporting conventional fluids with nanoscale solid particles (for example, Cu, Ag, Al2O3, TiO2, Fe3O4, CuO, etc.), i.e., forming new fluids, called nanofluids with elevated thermal conductivities. Recently, many studied have been achieved on the subject. For example, Barber et al. [38], Gupta et al. [39], Najah Al-Shamani et al. [40], Bozorgan et al. [41], Lomascolo et al. [42], Sadeghinezhad et al. [43], Mukherjee et al. [44], Babita et al. [45], Rasheed et al. [46], Yang et al. [47], Colangelo et al. [48], Ganvir et al. [49], Kasaeian et al. [50], Mohammed et al. [51], Che Sidik et al. [52], Nadooshan et al. [53], Angayarkanni et al. [54], Mahian et al. [55], Raj et al. [56], Taherian et al. [57], Zhang et al. [58], Zendehboudi et al. [59], Arshad et al. [60], Bumataria et al. [61] and Wahab et al. [62], as listed in Tab. 2.
Table 2: Description of nanofluids—Review studies
High thermal conductivity of nanoparticles yields a significant improvement of the overall performance, even with small amount of nanoparticles volume fraction. Several parameters may affect the nanofluids’ thermal conductivity such as the base-fluid nature, type, fraction, and form of the solid nano-particles. Further details may be found in the papers of Pourmehran et al. [63], Nazari et al. [64], Biglarian et al. [65], Sheikholeslami [66], Nojoomizadeh et al. [67], Nojoomizadeh et al. [68], Job et al. [69], Ashorynejet al. [70], Saba et al. [71], Ogunseye et al. [72], Bezaatpour et al. [73], Fakour et al. [74], Shahmohamadi et al. [75], Saqib et al. [76] and Siddiqui et al. [77], as reported in Tab. 3.
Table 3: Performance improvement of CHEs by using nanofluids
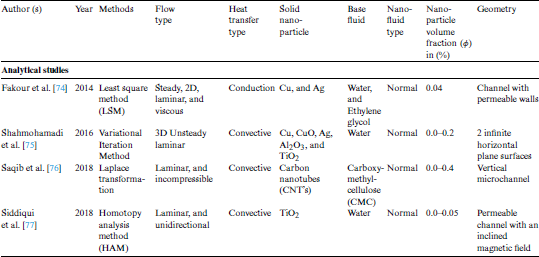
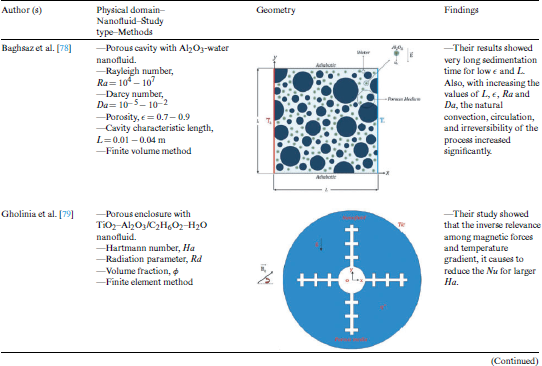
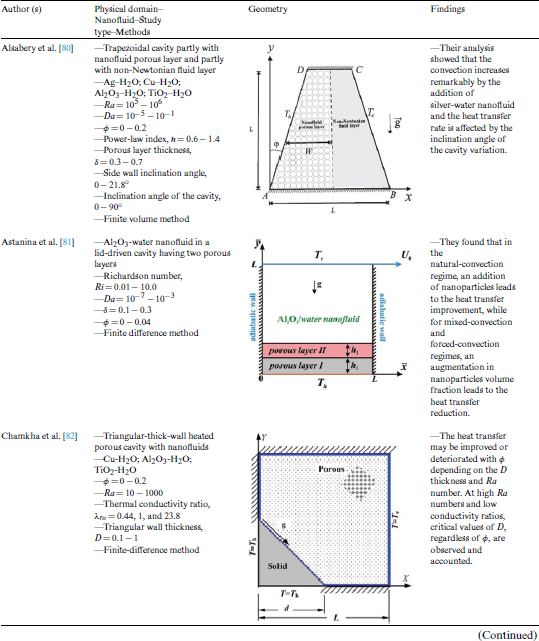
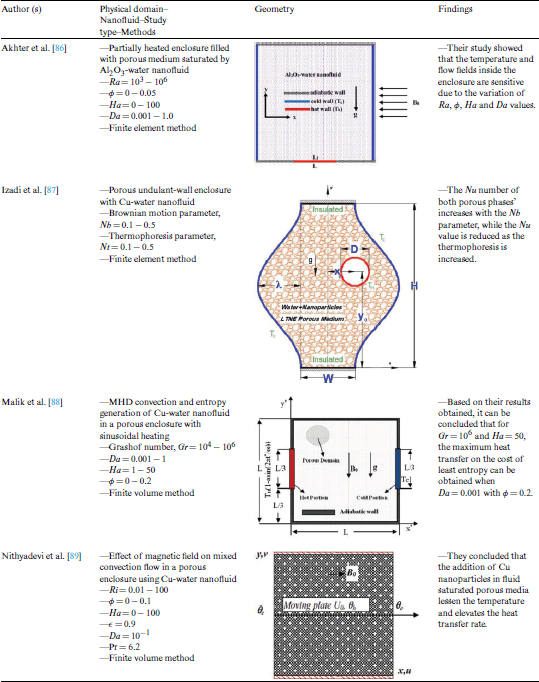
Reinforcing thermal systems with nanofluids and porous media simultaneously is also an effective technique, as illustrated by Baghsaz et al. [78], Gholinia et al. [79], Alsabery et al. [80], Astanina et al. [81], Chamkha et al. [82], Ismael et al. [83], Mehryan et al. [84], Miroshnichenko et al. [85], Akhter et al. [86], Izadi et al. [87], Malik et al. [88] and Nithyadevi et al. [89], as tabulated in Tab. 4. Other physical models under various boundary conditions can be found in Mahani et al. [90], Mehryan et al. [91,92], Ho et al. [93] and Mohammed et al. [94].
Table 4: Performance improvement of porous cavities and enclosures by using the nanofluids

All the studies cited above have addressed the improvement of thermal and dynamic performance within channels by:
i) increasing the heat transfer surfaces by adding transverse/longitudinal fins,
ii) increasing the turbulence level by adding baffle plates, i.e., VGs, or
iii) by treating the nature of the fluid by inserting nano-sized solid particles ‘called: nanofluids.’
The majority of these studies used only one technique: insert the obstacles with the classic working fluid, or use nanofluids in the absence of obstacles. Therefore, and in this study, the two methods (baffling and nanofluid techniques) are adopted simultaneously by inserting VGs to improve the dynamic aspect of the flow, while the oil/multi-walled carbon nano-tubes (Oil/MWCNT) is used to promote a good heat transfer.
This new study relies on a new model of CHE to update those in the solar receptors, Fig. 1. The CHE is a horizontal and rectangular duct. The upper surface of the CHE subjected to a constant temperature (Tw = 375 K [13]), while the bottom surface is thermally insulated. Two baffles (VGs) are attached to the top and lower walls of the CHE. Both baffles are located at the distance, Lin, from the CHE inlet. The space between the tips of the upper and lower VGs is  , which represents the length of the exit section. A third VG is added at the distance, Ls, behind the upper and the lower VGs. The 3rd VG is centered between the top and lower surfaces of the CHE. All dimensional parameters of the CHE are summarized in Fig. 1.

Figure 1: Computational domain. (L = 0.554 m, H = 0.146 m, Lin = 0.218 m, Ls = 0.142 m, e = 0.01 m, and h = 0.08 m [10])
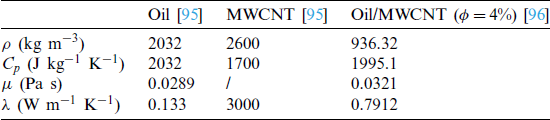
The working fluid is an oil-based nanofluid, dispersed by nano-sized solid particles of Multi-Walled Carbon Nano-Tubes (MWCNT), with a volume fraction ( ) of 4%. The thermo-physical properties of the oil base-fluid (oil molecular diameter,
  A) [95], carbon-nanotubes’ nanoparticles [95], and Oil/MWCNT nanofluid (
 ) [96] are presented in Tab. 5 [96]. The Reynolds number is changed from
  to
to  .
.
Table 5: Thermo-physical properties of 298 K used materials [96]
The hydrothermal field inside the CHE at  is subjected to some conditions, the most important of which are: (i) The forced-convection heat transfer and flow are two-dimensional; (ii) The stream is steady, turbulent, Newtonian [96], and incompressible; (iii) The nanofluid is homogeneous [96] and single-phase [96]; (iv) The condition of no-slip boundaries is applied to the solid surfaces [10]; and (v) The transfer of heat by radiation is neglected.
In this simulation, the top wall of the CHE ( and
and  ) is considered under the constant surface-temperature condition (Tw) of 375 K [13], and the opposite wall (
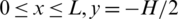 ) is considered thermally insulated. The T-VGs as well as the right walls of the channel also are considered as adiabatic. For the section of the channel entrance (
 ), the profile of velocity is uniform [10,13] (
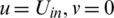 ), while the condition of pressure-outlet (P = Patm) [10] is applied at the exit section (
 ). The fluid Tin, i.e., at the inlet, is 298 K [96].
According to the hydrothermal conditions reported above, the present simulated physical model is governed by [97]:
The continuity:

The momentum:

The energy:

with,
 Total energy (E):

 Deviated stress tensor (
 ):
):

The SST k- model is used to model the turbulence in the case of the simulated configuration. Its turbulent kinetic energy, k is defined as follow [13,96]:

While, its specific dissipation rate,  is given as follow:

The thermo-physical properties of the nanofluid can be defined as follows [96]:
Density ( ):
):

Heat capacitance  :
:

Thermal conductivity ( ):
):

Effective dynamic viscosity ( ):
):

p, f and nf are the nanoparticle, base fluid, and nanofluid, respectively.
Reynolds number (Re):

where Dh is the hydraulic diameter calculated as:

The heat transfer in terms of local Nusselt number (Nux) is defined by:

The study was realized by using ANSYS Fluent. The computer tool Gambit was employed to mesh the computational domain. The governing equations were discretized by FV (finite volume) technique [98]. The SIMPLE-type algorithm was employed for the coupling ‘pressure-velocity’ [98] and the Quick-scheme was applied to the interpolations [99], while a second-order upwind scheme [99] was employed for the pressure terms. The under-relaxation factor was varied between 0.3 and 1.0 to verify the update of the predicted results at each iteration [13]. The residual target was fixed to 10−9 for the convergence criterion. The numerical simulations were realized on a PC-i5 with a CPU frequency of 2.5 Go and a RAM of 6 Go. A typical model of running time (CPU time) for the calculation of a case is about 180–240 min.
Rectangular mesh elements were constructed for the computational domain. The mesh density was increased near the CHE walls to capture the strong flow field gradients in these regions. The grid independence tests were conducted by changing the mesh nodes’ density, from 35 to 145 along with the CHE height and from 95 to 370 along with the length. For  and
and  , the optimum values of the dynamic pressure (Pd) and the axial velocity (u) are plotted in Fig. 2 versus the mesh density. The variation in Pd and u values is found to be less than 1% when the number of cells has been changed from (
 ) to (
 ). Thus, the increase in the density of cells beyond this value is not needed. Considering the results precision, the mesh of (
 ) cells with high node concentration near the solid limits was selected for the next calculation.

Figure 2: Effect of mesh node density on the NS in terms of (a) Pd and (b) u for 
The simulated results are verified against the experimental and CFD results of Demartini et al. [10]. For this reason, the same physical model and flow characteristics are considered [10]: (i) 2D horizontal rectangular channel with 0.554 m of length, 0.146 m of height, and 0.167 m of hydraulic diameter; (ii) Two upper and lower VGs with 0.08 m of height, 0.01 m of thickness and 0.142 m of separation distance; (iii) Air fluid; and (iv)  .
.
Figs. 3a and 3b present the results of the pressure coefficient (Pc) and the axial velocity (u) for Uin = 7.8 m/s, respectively. The values of Pc and u are, respectively, calculated along with the CHE depth at the positions x = 0.223 m and x = 0.525 m from the exchanger inlet. We note that the air is employed as a working fluid for this validation. As remarked, the comparison illustrates a good agreement. After checking the validity of our predicted results, the same CFD technique was used for the new model that contains:
Firstly, using the same CHE and its dimensions (L, H and Dh) mentioned by Demartini et al. [10];
Secondly, use three VGs instead of two baffle plates [10], but with the same dimensions (Lin, Ls and e) received from the same source [10];
Thirdly, adopt a new fluid, which is Oil/MWCNT nanofluid [96], instead of the traditional gaseous fluid (air) [10].

Figure 3: Validation of results in terms of (a) Pc and (b) u for Uin = 7.8 m/s
This research is an important numerical simulation in the context of solar channel heat exchangers. Therefore, visualization of the flow distribution should be determined, indicating possible recycling phenomena, and highlighting regions with high temperature gradients.
4.1 Dynamic Pressure and Stream-Function Fields
Fig. 4a shows the Pd field inside the CHE for a variable Re value. The Pd values are very high across the first gap, between the upper edges of the top and bottom attached baffles, as well as through the upper and lower gaps next to the top and bottom walls of the channel, due to the existence of the detached third baffle. The Pd values are also high across the channel outlet, due to its smallness. Whereas, Pd values are low in the vicinity of the walls of the channel, from its inlet to the left sides of the attached baffles. The Pd values are also reduced on the rear sides of the three baffles and next to the upper and lower edges of the channel outlet.

Figure 4: Hydrodynamic fields in terms of (a) Pd (in Pa) and (b)  (in Kg s−1)
From this same figure, it is very clear that the Pd values would greatly improve if Re values improved from  to
to  . So, there is a direct correlation between Re values and Pd values. As the Re number increases, the Pd improves.
Fig. 4b shows the stream-function ( ) field distribution when
  to
to  . From the figure, the nanofluid current enters from a large area, of a height of H, located in x = 0. The current is disturbed immediately after the inlet of the CHE, as it approaches the VGs. The current disturbance in this area results in the appearance of two recycling cells. The first cell of recirculation is located at the top of the channel, upstream of the upper VG, while the second cell is presented at the bottom, before the lower VG. These regions have low Pd values as reported in Fig. 4a. The main current flows through the first gap, between the upper edges of the upper and lower VGs, towards the turbulator-type detached baffle. The presence of VGs leads to the formation of two recycling cells, next to their right sides, due to the decrease in Pd values in their back regions. The presence of the turbulator-type third baffle in the CHE center allows the main current to be divided into two streams, heading towards the upper and lower gaps, next to the channel surfaces, to the exit section with the formation of two adjacent recycling cells on the back region of the same turbulator, due to a decrease in Pd values. As shown in Fig. 4b, the current disturbance augments as the number of Re increases.
4.2 Axial and Transverse Velocity Fields
From Fig. 5a, the axial velocity (u) has negative values in the areas in front and back of the VGs, behind the turbulator, as well as next to the top and bottom edges of CHE outlet. Negative u values are evidence of adverse currents called recycling cells. These cells have length, height, volume, strength, and speed to rotate in the reverse direction of the mainstream. However, the u values increase across the three gaps, due to the presence of T-VGs in the fluid circulation vein and severe current deviations on their left sides. It is very clear that large u values are located near the CHE walls, behind the turbulator. The u values enhance as Re values improve. All geometrical dimensions of the recycling cells as well as their strength improve in the case of the wide Re range.

Figure 5: Hydrodynamic fields in terms of (a) u (in m s−1) and (b) v (in m s−1)
There is negative transverse velocity (v) values on the upper front edge of the upper VG, as well as on the lower front edge of the turbulator, while there are very high v values on the upper front edges of the bottom VG and the turbulator, see Fig. 5b. As expected, the high number of Re creates strong current deviations on the left sides of the T-VGs, towards the top and bottom of the CHE and thus, the v increases in both directions, direct towards the top of the channel, and negative towards the its bottom.
4.3 Mean Velocity and Kinetic Energy Fields
Mean velocity (V) values are low on the left and right sides of the VGs, on the rear side of the Turbulator, and next to the top and bottom edges of the outlet. In the region between the upper edges of the VGs, V values rise as a result of decreases in the Oil/MWCNT circulation vein, and current flows through this gap under high Pd. The current acceleration decreases as it approaches the front side of the turbulator, while accelerating through the upper and lower gaps adjacent to its edges, due to severe current deviations in these areas. The V reaches its maximum values on the right side of the turbulator, near the top and bottom CHE surfaces. The nanofluid flows under high Pd and very quickly to the CHE outlet in the middle, see Fig. 6a. In addition, it is very clear from this figure that the change in Re number greatly affects the V of nanofluid flow where there is a direct correlation between the increase in the Re and the rise in V values. As the number of Re increases, the nanofluid deviation force increases on the left sides of the T-VGs, towards the gaps, up to the CHE outlet.
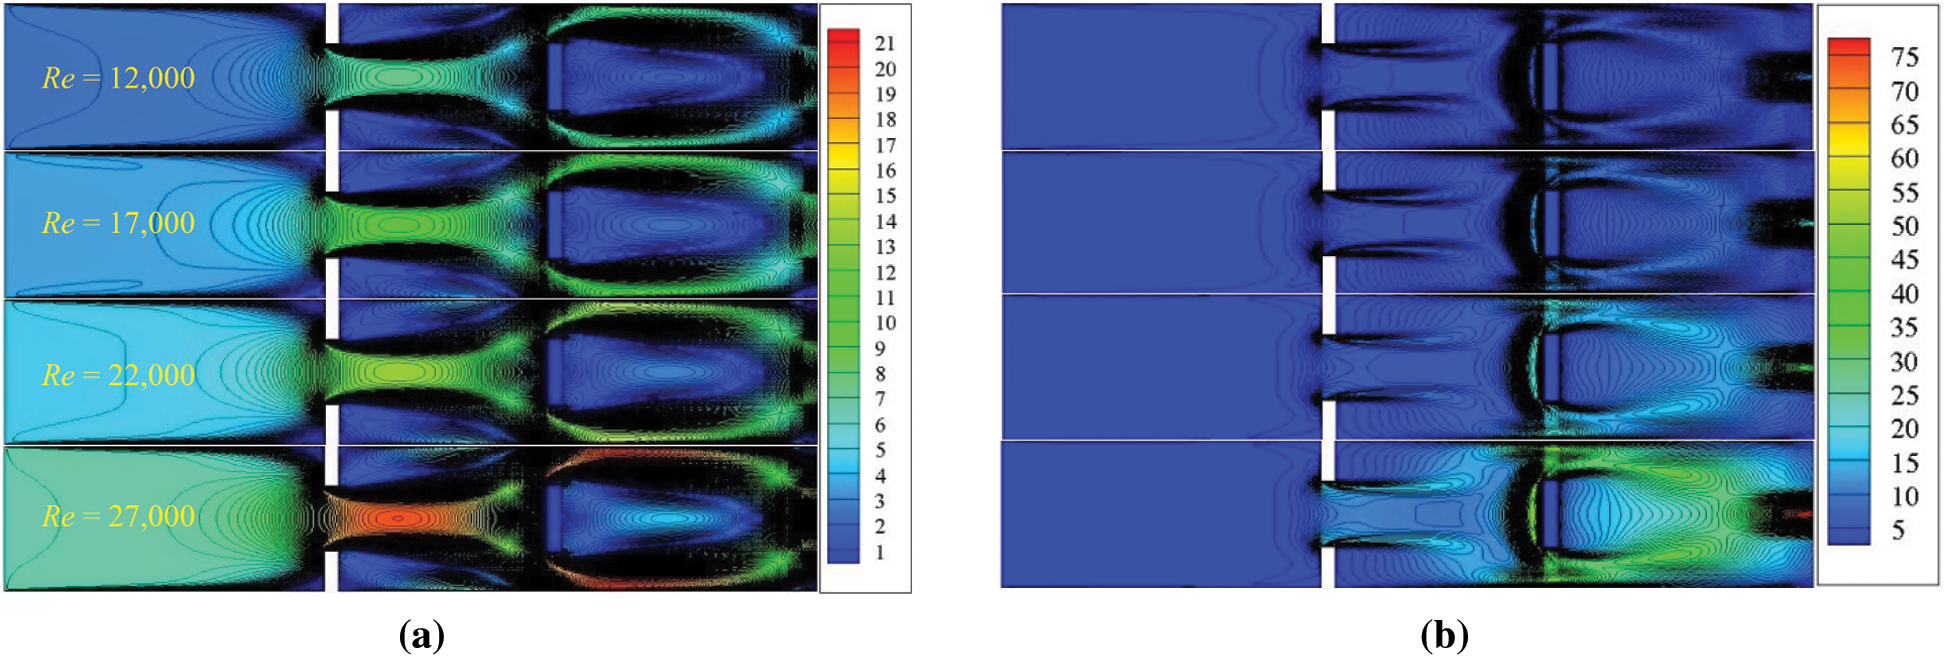
Figure 6: Hydrodynamic fields in terms of (a) V (in m s−1) and (b) K (in m2 s−2)
From Fig. 6b, it is evident that there are high turbulent kinetic energy (K) values on the upper front edges of the VGs, on the left side of the turbulator as well as on its upper and lower edges. In addition, K values are high at the outlet. However, K energy decreases on the rest of the CHE areas, in front and behind the VGs and on the back of the turbulator as well as next to the top and bottom edges of the outlet. From the figure, it turns out that the K energy of the Oil/MWCNT nanofluid current is influenced by the change in the value of the Re number. The K energy gets better as the number of Reynolds improves. The turbulent kinetic energy values are very important for  compared to
  ,
,  and
and  .
.
4.4 Turbulent Fields of Viscosity and Intensity
In Fig. 7a, turbulent viscosity ( ) values are very high compared to k values. The
  values are high across the three gaps and on the front ends of the T-VGs. The
  values also rise behind the turbulator to the CHE exit. Conversely,
  values are very low near the solid boundaries of the CHE and the T-VGs. The
  viscosity is directly proportional to the values of the Re number as it reaches its maximum values in the exchanger outlet area, as reported in Fig. 7a.

Figure 7: Hydrodynamic fields in terms of (a)  (in kg m−1 s−1) and (b) TI (in %)
Fig. 7b shows the contour plot of the turbulence intensity (TI) field. For the minimum Re number, i.e.,  , the TI is low in areas adjacent to the right sides of the VGs, ranging from 30% to 50%. The TI also decreases on the rear side of the turbulator, estimated at 60%. The TI has low values at the exchanger entrance, estimated at 10%. This decrease continues until the first gap between the upper and lower edges of the VGs. There are also low values of TI near the edges of the exit, estimated at 60%. The TI rises to 80% next to the upper and lower walls of the exchanger to the front left sides of the VGs, reaching 120% near its edges. The TI is also higher on the front side of the turbulator and next to its edges, estimated at 160%. In addition, there are high values of TI away from the rear side of the 3rd obstacle, ranging from 100% to 120%. The TI reaches its maximum values at the exchanger outlet, which is estimated at 240%, 24 times greater than that at the inlet. When Re number changes from
  to
to  , the TI increases from 240% to 700% at the exit section. So, there is a direct correlation between the values of TI and the Re values.
4.5 Dynamic Pressure Profiles in Different Axial Sections
Computational data report very low profiles of Pd next to the T-VGs. In the areas behind the T-VGs, zones of vortices with very low curves of Pd are presented. In the areas situated between the upper edges of the VGs, the Pd is augmented.
Due to the variations in the streamlines reported by the T-VGs, the highest profiles of Pd appear downstream of the turbulator, near the top and bottom CHE surfaces, with a process of acceleration that found just after the third VG. Also, there is a direct correlation between Re values and Pd values in all sections examined as shown in Fig. 8.
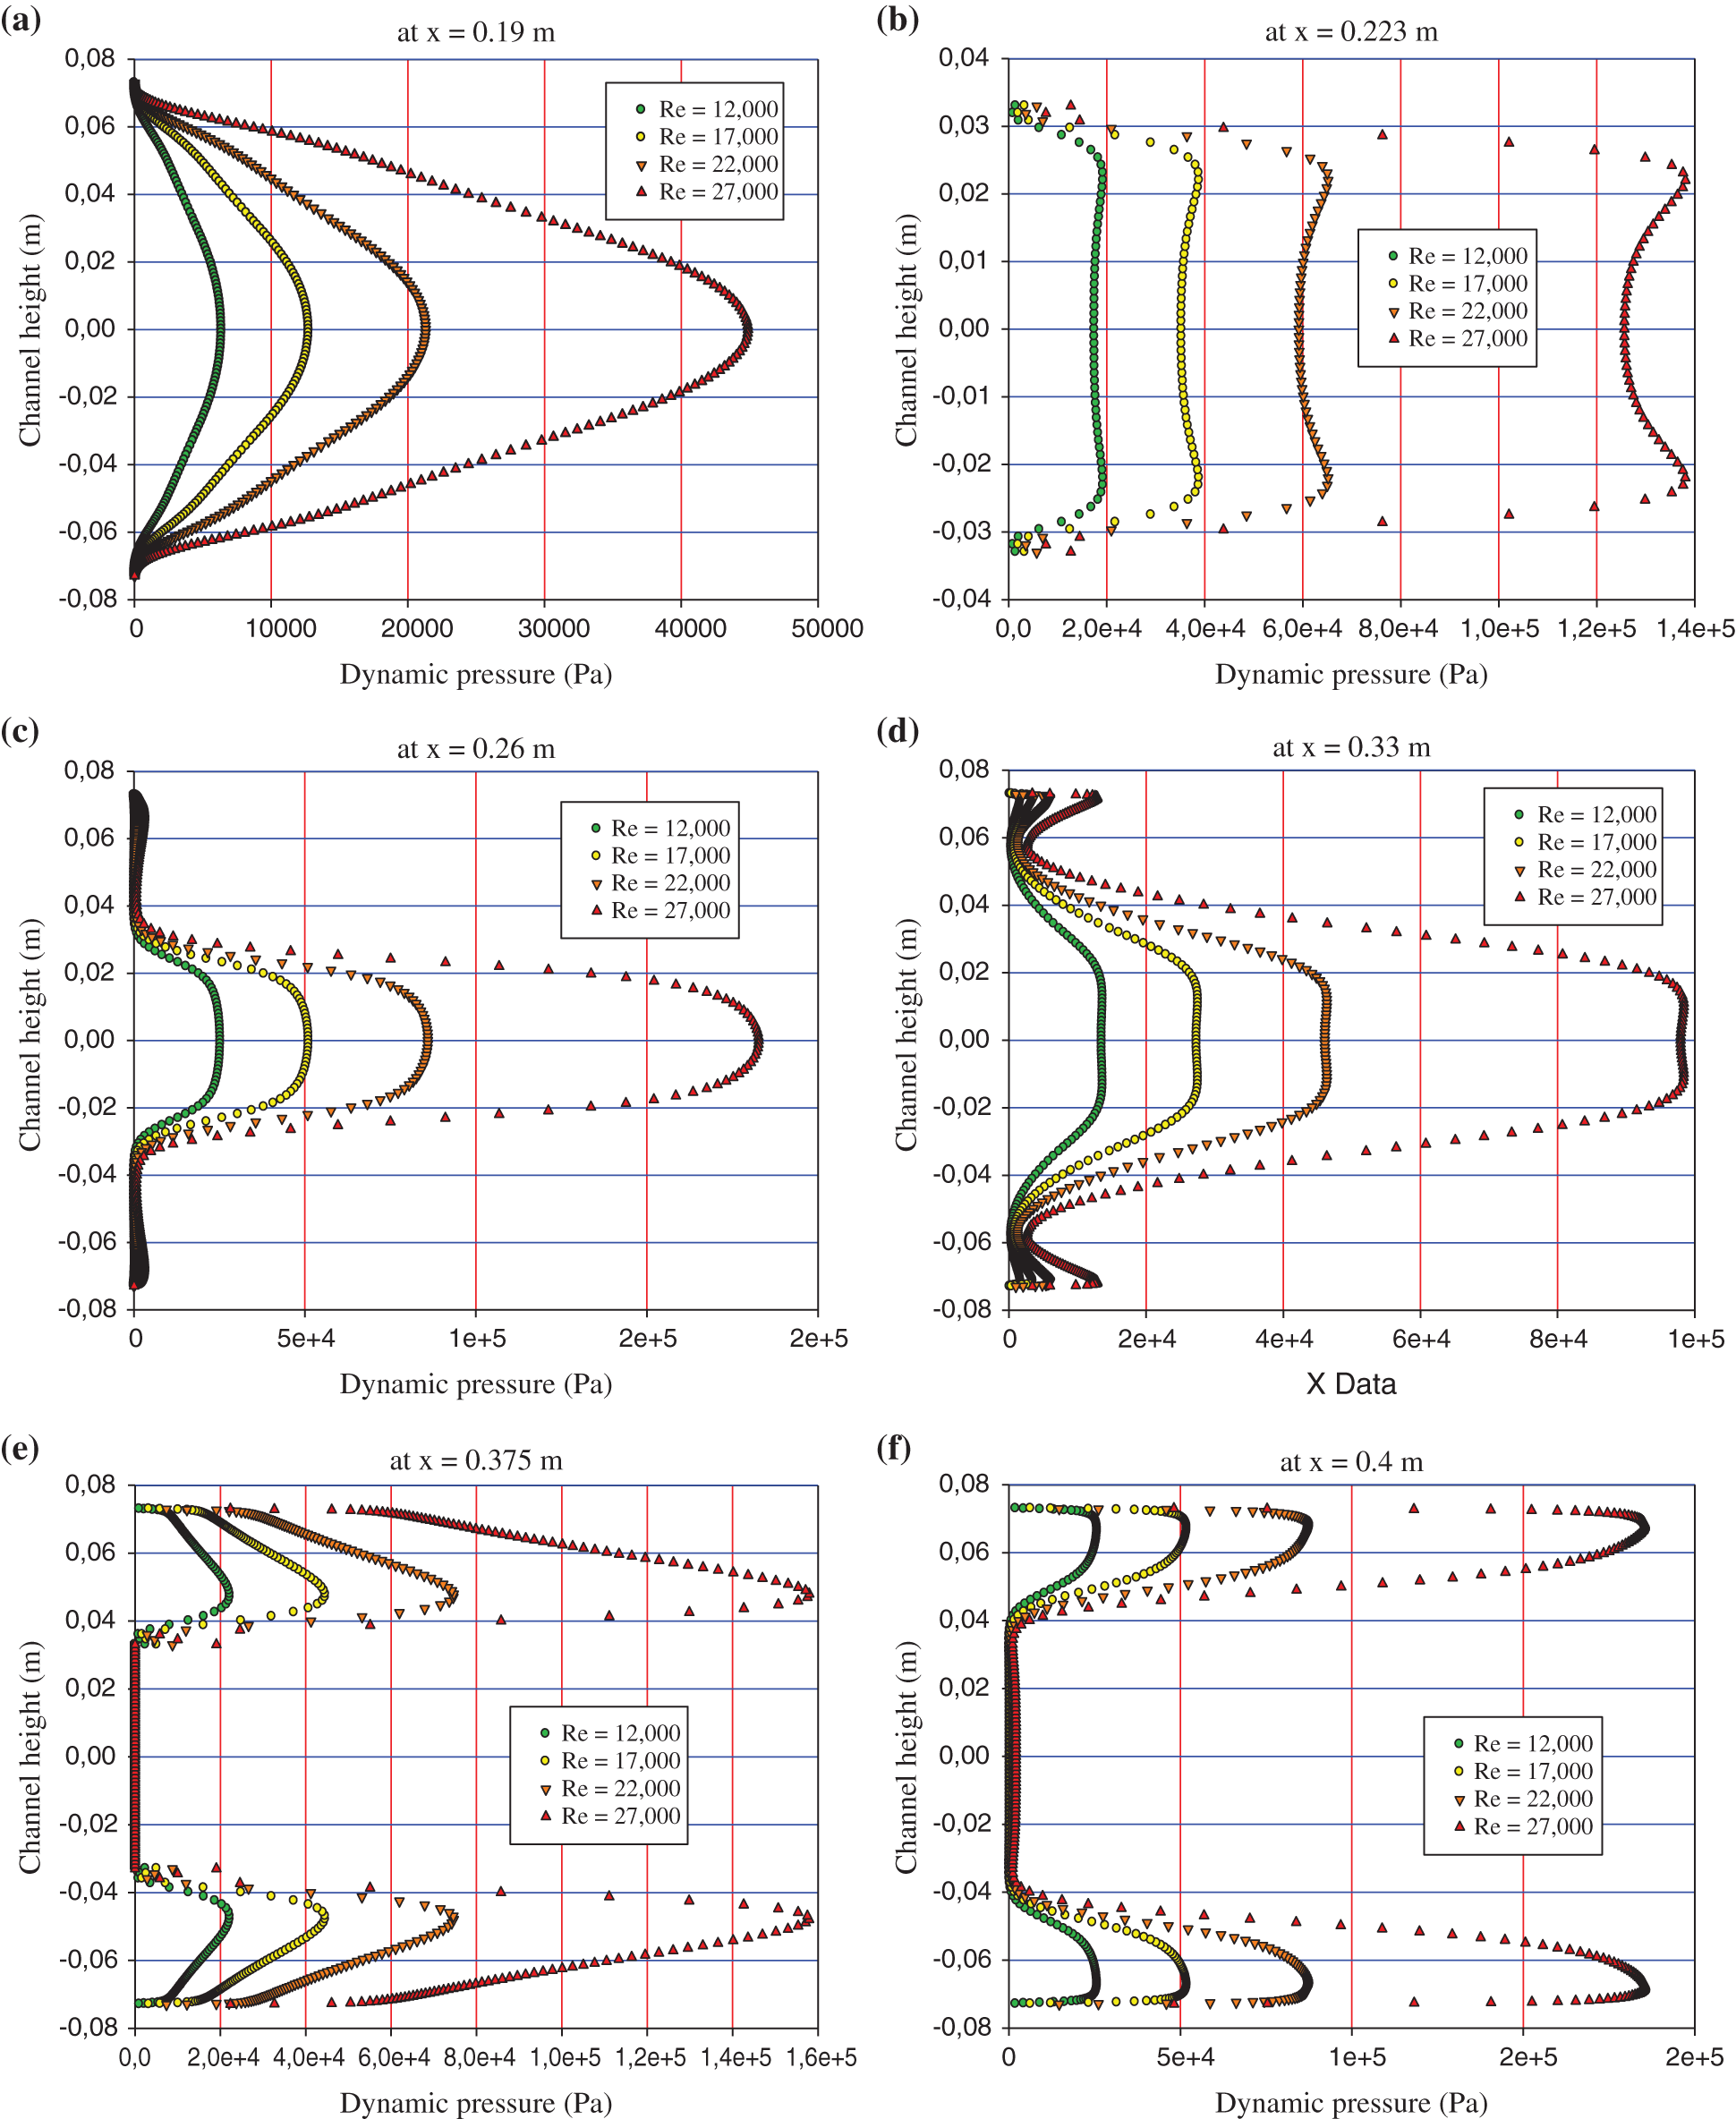
Figure 8: Effect of Re on the Pd curves in different axial sections
4.6 Normalized Axial Velocity Profiles in Different Axial Sections
Fig. 9a shows the normalized axial velocity ( ) profiles upstream of the top and bottom VGs, at x = 0.19 m. For
  , the
, the  profiles are very high next to the center of the gap formed between the edges of these VGs and very low near the top and bottom CHE surfaces.
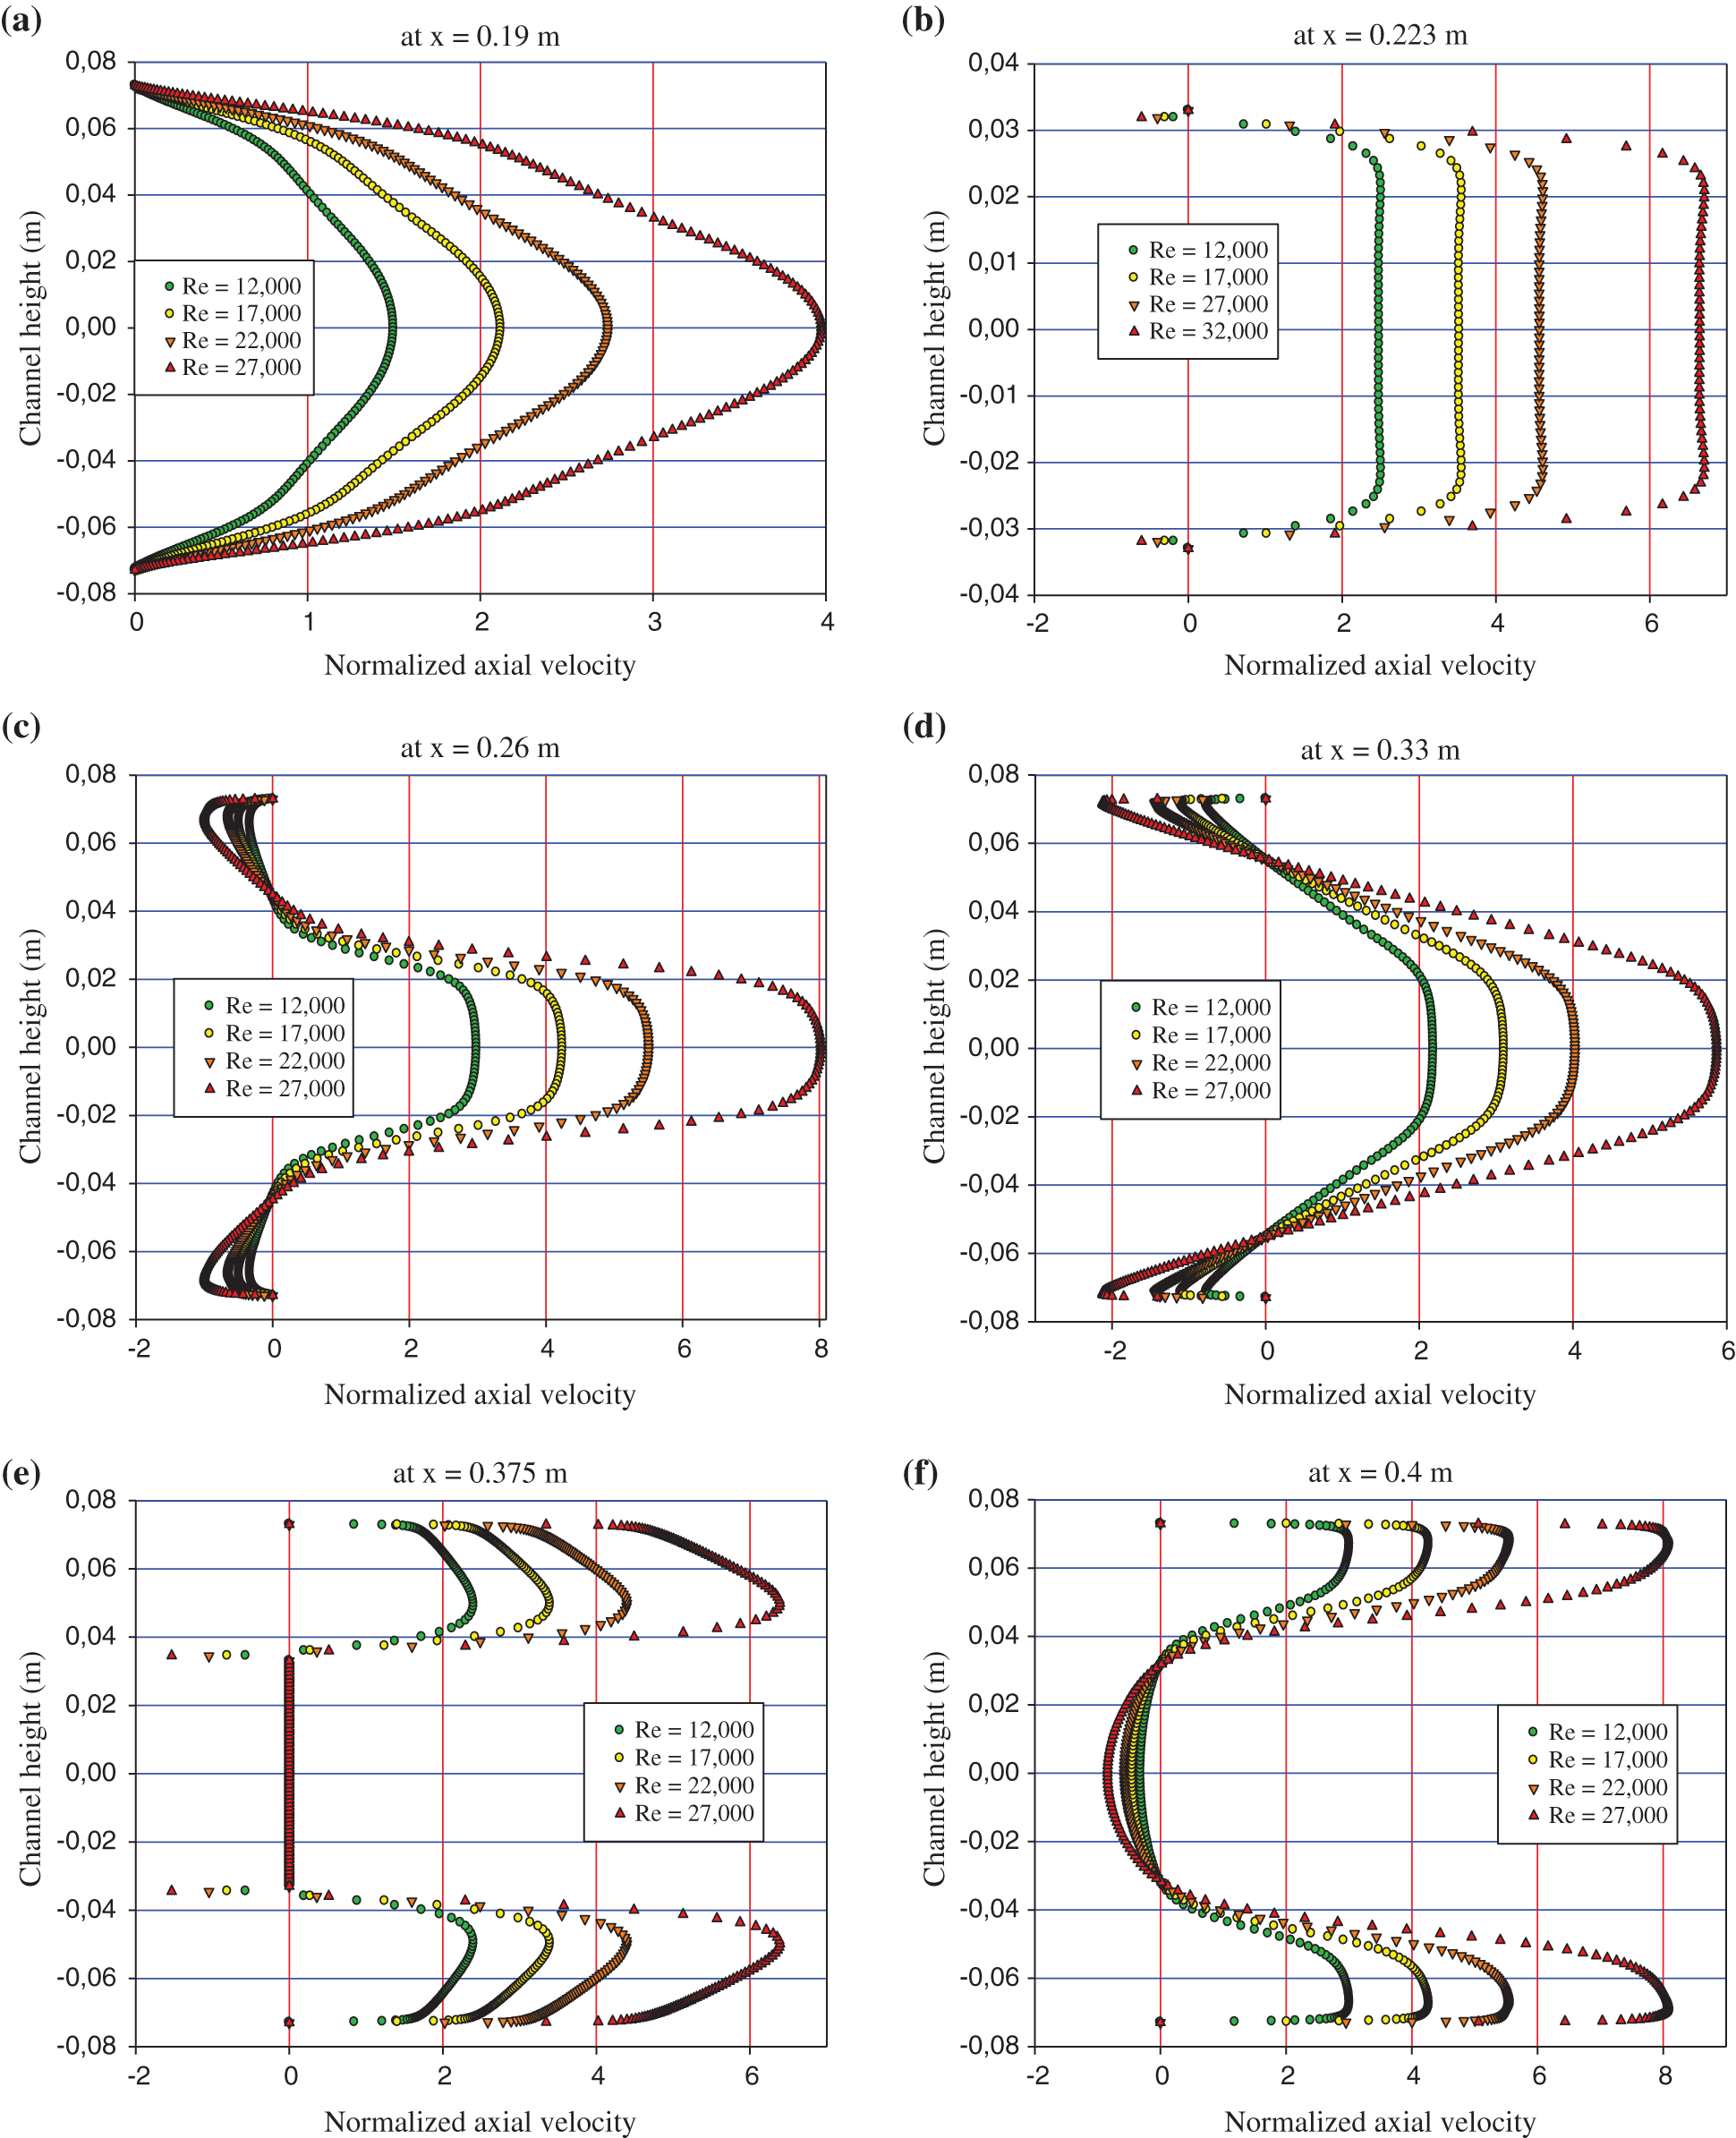
Figure 9: Effect of Re on the  curves in different axial sections
A comparison of curves of  between the VGs’ top edges, at x = 0.223 m, for the same Re value is given in Fig. 9b. The u/Uin profiles at this location are flat. The values of
  are high in the middle of the gap, while decreasing next to the top edges of the turbulator.
Fig. 9c reports the profile plot of  downstream of the VGs, at x = 0.26 m. For
  , the
, the  values are negative in the upper and lower sections of the exchanger, due to the presence of recycling cells on the back sides of the VGs. In the middle, there is a significant rise in
  values, due to the rapid flow of the nanofluid current through the first gap under high pressure, due to the presence of these VGs.
The  profiles for the position x = 0.33 m, measured downstream of the inlet section, are shown in Fig. 9d. There is a decrease in the high
  values compared to the previous location, i.e., at x = 0.26 m in Fig. 9c, due to the current approaching the turbulator, while the negative values of
  indicate the extension of the recycling cells located behind the VGs.
Fig. 9e plots the distribution of  profiles in the position x = 0.375 m, starting from the tip of the turbulator to the opposite walls. For
  , it is very clear that the
  values are very high across the top and lower gaps, especially next to the upper and bottom edges of the turbulator.
Fig. 9f shows the  profiles at a station given by x = 0.4 m, 0.02 m after the turbulator. The low speed values are indicative of a large recycling zone on the right side of the turbulator, due to a decrease in Pd values in this region. The
  values rise significantly near the top and lower surfaces of the exchanger, due to the rapid flow through the top and lower gaps in the presence of a high Pd.
Figs. 9a–9f also show the variation of  profiles with flow rate, i.e.,
  ,
,  ,
,  and
and  , in different axial stations from the exchanger, i.e., x = 0.19, 0.223, 0.26, 0.33, 0.375, and 0.4 m, respectively. When the number Re rises from
  to
to  , the
, the  values go up considerably allowing rapid flow through the gaps while improving the size and strength of the rotating cells on the rear sides of the T-VGs.
Fig. 10 shows the thermal field for a constant Re value of 12,000. The nanofluid temperature (Tnf) is high in areas with low speeds; next to the top VG, due to the recycling cells in these CHE regions. However, the Tnf gradients are improved in high-velocity areas; in the area opposite the detached.

Figure 10: Tnf contour plot for 
4.8 Temperature Profiles in Various Axial Sections
Fig. 11a represents the Tnf changes of the field along the vertical position, located at x = 0.19 m from the exchanger inlet, i.e., 28 mm before the left side of the VGs. It is very clear that the Tnf at  is variable from 298 to 330 K in the upper part of the CHE, due to the presence of convective heat transfer from the hot top surface to the nanofluid, while its temperature is constant in the lower part of the exchanger and estimated at 298 K, due to the lack of heat transfer in this area, due to the absence of hot surfaces.

Figure 11: Effect of Re on the  curves in different CHE stations
Fig. 11b shows the temperature curve of the nanofluid current on the line extending between the upper edges of the VGs, in the axial position x = 0.223 m of the inlet of the exchanger, meaning 331 mm before its exit. From the figure, the Tnf is elevated next to the upper edge of the top VG, up to 301 K at  , whereas, its temperature decreases as the fluid moves away from the hot surface where it reaches 298 K next to the top edge of the bottom VG. So the Tnf varies from 298 to 301 K between the edges of the VGs.
Fig. 11c shows the Tnf variations on the back region of the VGs, at the transverse position x = 0.26 m from the exchanger inlet, 32 mm after the right sides of the VGs, 110 mm before the left side of the turbulator, and 294 mm before the CHE outlet. The Tnf values are constant in the lower part of the exchanger, 298 K (for  ), because there are no hot surfaces in this region of the CHE and therefore, there is no heat transfer. However, the Tnf is variable in the upper region of the exchanger where there is a large recycling cell in this area. The Tnf value ranges between 301 and 319 K in the recycling zone between the tip of the top VG and the hot wall of the exchanger. The Tnf drops from 319 to 298 K in the area between the top edge of the upper VG and the bottom of the CHE.
At the transverse position x = 0.33 m behind the inlet section of the exchanger, 102 mm from the right sides of the VGs, 40 and 224 mm before the front side of the third VG (or turbulator) and the outlet section of the CHE, respectively, and according to Fig. 11d, the Tnf is improved next to the hot surface of the exchanger where it ranges between 298 and 305 K at  . This indicates the presence of heat transfer in the region.
At the exchanger outlet, through the position  , and based on Fig. 11e, the temperature of the nanofluid is varied from 298.059 K, at the bottom of the outlet section due to the absence of hot spaces in the lower part of the CHE and therefore there is no heat transfer in this area, to 299.6 K at the top of this same exit section, due to the presence of a hot surface in the upper part of the exchanger and, it is very clear that the maximum Tnf drops from 299.6 to 298.69 K if Re values rise from
  to
to  .
.
Fig. 11f examines the Tnf distribution along the top horizontal station, i.e.,  . In the figure, two stations have low temperature gradients. The first station is situated next to the upper VG, due to the low V and Pd on its front and rear sides. The second station is located above the exchanger exit section. All of these regions have poor heat transfer. The high gradients of temperature are located next to the top edge of the turbulator, due to the strong current flow and its extreme deviation on the front side of the third obstacle towards the top and lower parts of the CHE. Thus, the thermal gradient rises in the stations with high V and Pd values. Also, the thermal gradient is proportional to the values of the Re number, along the hot top surface of the exchanger, as also reported in Fig. 11.
The heat transfer rate of the hot wall,  and
and  , is calculated in terms of the normalized local Nusselt number (Nux/Nu0) and for different values of flow rate (
 ). The Nux number is given by Eq. (14), while the Nu0 number represents the Nusselt number for the smooth channel under the same flow conditions. Three different phases can be distinguished (Fig. 12). The first phase has a decrease in the Nux/Nu0 values, on the front of the upper VG, as the flow is deflected downward towards the gap situated between the two attached VGs. The second phase indicates the absence of the heat transfer in the attachment position of the insulated upper VG. The third phase shows an increase in the heat transfer values in the vicinity of the detached VG. In general, the heat exchange values are maximum for areas with high flow velocities, i.e., with high temperature gradients, and which are located near the upper surface of the third VG, while the small Nux/Nu0 values are situated near the front and back sides of the top VG. The figure also shows an enhanced heat transfer in the baffled exchanger compared to the smooth exchanger for all Re values used. Finally, the heat transfer rate is further improved when the flow rate goes from 12,000 to 27,000.

Figure 12: Variation of (Nux/Nu0) with Re number
This paper aimed to develop a new design of SCHEs to improve their overall energy efficiency. The study simulated a new channel configuration by introducing VGs. The FVM was adopted as a computation method to solve the problem, with the use of Oil/MWCNT to raise the thermal conductivity of the flow field. This is an appreciated effort in the field of numerical analysis of convective heat transfer in a channel with T-VGs. Comprehensive literature review in the introduction part and detailed analysis of the fluid flow and energy was highly appreciated. The computational results showed that the hydrothermal characteristics depend strongly on the flow patterns with the presence of VGs within the SCHE. Increasing the Oil/MWCNT rates with the presence of VGs generate negative turbulent velocities with high amounts, which promotes the good agitation of nanofluid particles, resulting thus in enhanced great transfer rates. This selected heat exchanger can be applicable in various sectors such as heating and cooling of houses, drying agricultural food materials, and water desalination process.
For future developments, here are some research perspectives to be considered:
i) Further investigations are needed to precise the best location of the Ts-VGs. The geometrical parameters of the vortex generator should be optimized, such as thickness, width, inclination, arrangement, etc.
ii) To eliminate the lower thermal transfer regions that are developed behind the VGs, the introduction of holes in the walls of the obstacles may overcome this issue. When using the perforation technique, several parameters should also be optimized, like the number of pores, their shape and dimensions, and the porous medium permeability.
iii) The 3D computations may allow further knowledge for the entire volume of the solar collector.
Acknowledgement: The authors would like to thank the General Directorate of Scientific Research and Technological Development (DGRSDT) of the Ministry of Higher Education and Scientific Research in Algeria, which sponsored this work.
Funding Statement: The work was supported by the Natural Science Foundation of China (Grant Nos. 61673169, 11301127, 11701176, 11626101, 11601485).
Conflicts of Interest: The author(s) declared no potential conflicts of interest with respect to the research, authorship and publication of this article.
1. Gao, T., Zhu, J., Li, J., Xia, Q. (2018). Numerical study of the influence of rib orientation on heat transfer enhancement in two-pass ribbed rectangular channel. Engineering Applications of Computational Fluid Mechanics, 12(1), 117–136. DOI 10.1080/19942060.2017.1360210. [Google Scholar] [CrossRef]
2. Ghalandari, M., Bornassi, S., Shamshirband, S., Mosavi, A., Chau, K. W. (2019). Investigation of submerged structures’ flexibility on sloshing frequency using a boundary element method and finite element analysis. Engineering Applications of Computational Fluid Mechanics, 13(1), 519–528. DOI 10.1080/19942060.2019.1619197. [Google Scholar] [CrossRef]
3. Jayavel, S., Tiwari, S. (2010). Finite volume algorithm to study the effect of tube separation in flow past channel confined tube banks. Engineering Applications of Computational Fluid Mechanics, 4(1), 39–57. DOI 10.1080/19942060.2010.11015298. [Google Scholar] [CrossRef]
4. Reddy, K. S., Satyanarayana, G. V. (2008). Numerical study of porous finned receiver for solar parabolic trough concentrator. Engineering Applications of Computational Fluid Mechanics, 2(2), 172–184. DOI 10.1080/19942060.2008.11015219. [Google Scholar] [CrossRef]
5. Salih, S. Q., Aldlemy, M. S., Rasani, M. R., Ariffin, A. K., Ya, T. M. Y. S. T. et al. (2019). Thin and sharp edges bodies-fluid interaction simulation using cut-cell immersed boundary method. Engineering Applications of Computational Fluid Mechanics, 13(1), 860–877. DOI 10.1080/19942060.2019.1652209. [Google Scholar] [CrossRef]
6. Vatani, A., Mohammed, H. A. (2013). Turbulent nanofluid flow over periodic rib-grooved channels. Engineering Applications of Computational Fluid Mechanics, 7(3), 369–381. DOI 10.1080/19942060.2013.11015478. [Google Scholar] [CrossRef]
7. Xu, S., Guo, Z., Hu, G., Chen, W., Lewis, R. et al. (2014). Thermal and flow fields in single board computer cabin systems using CFD analysis. Engineering Applications of Computational Fluid Mechanics, 8(4), 574–585. DOI 10.1080/19942060.2014.11083308. [Google Scholar] [CrossRef]
8. Berner, C., Durst, F., McEligot, D. M. (1984). Flow around baffles. Journal of Heat Transfer, 106(4), 743–749. DOI 10.1115/1.3246747. [Google Scholar] [CrossRef]
9. Webb, B. W., Ramadhyani, S. (1985). Conjugate heat transfer in a channel with staggered ribs. International Journal of Heat and Mass Transfer, 28(9), 1679–1687. DOI 10.1016/0017-9310(85)90142-5. [Google Scholar] [CrossRef]
10. Demartini, L. C., Vielmo, H. A., Möller, S. V. (2004). Numeric and experimental analysis of the turbulent flow through a channel with baffle plates. Journal of the Brazilian Society of Mechanical Sciences and Engineering, 26(2), 153–159. DOI 10.1590/S1678-58782004000200006. [Google Scholar] [CrossRef]
11. Anotoniou, J., Bergeles, G. (1988). Development of the reattached flow behind surface-mounted two-dimensional prisms. ASME Journal of Fluids Engineering, 110(2), 127–133. DOI 10.1115/1.3243524. [Google Scholar] [CrossRef]
12. Tsay, Y. L., Chang, T. S., Cheng, J. C. (2005). Heat transfer enhancement of backward-facing step flow in a channel by using baffle installation on the channel wall. Acta Mechanica., 174(1–2), 63–76. DOI 10.1007/s00707-004-0147-5. [Google Scholar] [CrossRef]
13. Nasiruddin, Siddiqui, M. H. K. (2007). Heat transfer augmentation in a heat exchanger tube using a baffle. International Journal of Heat and Fluid Flow, 28(2), 318–328. DOI 10.1016/j.ijheatfluidflow.2006.03.020. [Google Scholar] [CrossRef]
14. Yongsiri, K., Eiamsa-ard, P., Wongcharee, K., Eiamsa-ard, S. (2014). Augmented heat transfer in a turbulent channel flow with inclined detached-ribs. Case Studies in Thermal Engineering, 3, 1–10. DOI 10.1016/j.csite.2013.12.003. [Google Scholar] [CrossRef]
15. Sahel, D., Ameur, H., Benzeguir, R., Kamla, Y. (2016). Enhancement of heat transfer in a rectangular channel with perforated baffles. Applied Thermal Engineering, 101, 156–164. DOI 10.1016/j.applthermaleng.2016.02.136. [Google Scholar] [CrossRef]
16. Khan, J. A., Hinton, J., Baxter, S. C. (2002). Enhancement of heat transfer with inclined baffles and ribs combined. Enhanced Heat Transfer, 9(3–4), 137–151. DOI 10.1615/JEnhHeatTransf.v9.i3-4. [Google Scholar] [CrossRef]
17. Ary, B. K. P., Lee, M. S., Ahn, S. W., Lee, D. H. (2012). The effect of the inclined perforated baffle on heat transfer and flow patterns in the channel. International Communications in Heat and Mass Transfer, 39(10), 1578–1583. DOI 10.1016/j.icheatmasstransfer.2012.10.010. [Google Scholar] [CrossRef]
18. Ko, K. H., Anand, N. K. (2003). Use of porous baffles to enhance heat transfer in a rectangular channel. International Journal of Heat and Mass Transfer, 46(22), 4191–4199. DOI 10.1016/S0017-9310(03)00251-5. [Google Scholar] [CrossRef]
19. Guerroudj, N., Kahalerras, H. (2010). Mixed convection in a channel provided with heated porous blocks of various shapes. Energy Conversion and Management, 51(3), 505–517. DOI 10.1016/j.enconman.2009.10.015. [Google Scholar] [CrossRef]
20. Sripattanapipat, S., Promvonge, P. (2009). Numerical analysis of laminar heat transfer in a channel with diamond-shaped baffles. International Communications in Heat and Mass Transfer, 36(1), 32–38. DOI 10.1016/j.icheatmasstransfer.2008.09.008. [Google Scholar] [CrossRef]
21. Abene, A., Dubois, V., Le Ray, M., Ouagued, A. (2004). Study of a solar air flat plate collector: Use of obstacles and application for the drying of grape. Journal of Food Engineering, 65(1), 15–22. DOI 10.1016/j.jfoodeng.2003.11.002. [Google Scholar] [CrossRef]
22. Bopche, S. B., Tandale, M. S. (2009). Experimental investigations on heat transfer and frictional characteristics of a turbulator roughened solar air heater duct. International Journal of Heat and Mass Transfer, 52(11–12), 2834–2848. DOI 10.1016/j.ijheatmasstransfer.2008.09.039. [Google Scholar] [CrossRef]
23. Kumar, R., Sethi, M., Chauhan, R., Kumar, A. (2017). Experimental study of enhancement of heat transfer and pressure drop in a solar air channel with discretized broken v-pattern baffle. Renewable Energy, 101, 856–872. DOI 10.1016/j.renene.2016.09.033. [Google Scholar] [CrossRef]
24. Ameur, H., Sahel, D. (2017). Effect of the baffle design and orientation on the efficiency of a membrane tube. Chemical Engineering Research and Design, 117, 500–508. DOI 10.1016/j.cherd.2016.11.005. [Google Scholar] [CrossRef]
25. Li, J. L., Tang, H. W., Yang, Y. T. (2018). Numerical simulation and thermal performance optimization of turbulent flow in a channel with multi V-shaped baffles. International Communications in Heat and Mass Transfer, 92, 39–50. DOI 10.1016/j.icheatmasstransfer.2018.02.004. [Google Scholar] [CrossRef]
26. Yang, S., Chen, Y., Wu, J., Gu, H. (2020). Investigation on shell side performance in half-cylindrical desuperheating zone of ladder type helical baffle heat exchangers. Applied Thermal Engineering, 175, 115334. DOI 10.1016/j.applthermaleng.2020.115334. [Google Scholar] [CrossRef]
27. Tongyote, P., Promvonge, P., Skullong, S. (2019). Thermal behaviors in heat exchanger channel with V-shaped ribs and grooves. Chemical Engineering Research and Design, 150, 263–273. DOI 10.1016/j.cherd.2019.07.025. [Google Scholar] [CrossRef]
28. Ribeiro, F., De Conde, K. E.,Garcia, E. C., Nascimento, I. P. (2020). Heat transfer performance enhancement in compact heat exchangers by the use of turbulators in the inner side. Applied Thermal Engineering, 173, 115188. DOI 10.1016/j.applthermaleng.2020.115188. [Google Scholar] [CrossRef]
29. Promvonge, P., Skullong, S. (2020). Augmented heat transfer in tubular heat exchanger fitted with V-baffled tapes. International Journal of Thermal Sciences, 155, 106429. DOI 10.1016/j.ijthermalsci.2020.106429. [Google Scholar] [CrossRef]
30. Chen, T., Shu, G., Tian, H., Zhao, T., Zhang, H. et al. (2020). Performance evaluation of metal-foam baffle exhaust heat exchanger for waste heat recovery. Applied Energy, 266, 114875. DOI 10.1016/j.apenergy.2020.114875. [Google Scholar] [CrossRef]
31. Muñoz-Cámara, J., Solano, J. P., Pérez-García, J. (2020). Experimental correlations for oscillatory-flow friction and heat transfer in circular tubes with tri-orifice baffles. International Journal of Thermal Sciences, 156, 106480. DOI 10.1016/j.ijthermalsci.2020.106480. [Google Scholar] [CrossRef]
32. Eiamsa-ard, S., Chuwattanakul, V. (2020). Visualization of heat transfer characteristics using thermochromic liquid crystal temperature measurements in channels with inclined and transverse twisted-baffles. International Journal of Thermal Sciences, 153, 106358. DOI 10.1016/j.ijthermalsci.2020.106358. [Google Scholar] [CrossRef]
33. Pourhedayat, S., Pesteei, S. M., Ghalinghie, H. E., Hashemian, M., Ashraf, M. A. (2020). Thermal-exergetic behavior of triangular vortex generators through the cylindrical tubes. International Journal of Heat and Mass Transfer, 151, 119406. DOI 10.1016/j.ijheatmasstransfer.2020.119406. [Google Scholar] [CrossRef]
34. Li, X., Xie, G., Liu, J., Sunden, B. (2020). Parametric study on flow characteristics and heat transfer in rectangular channels with strip slits in ribs on one wall. International Journal of Heat and Mass Transfer, 149, 118396. DOI 10.1016/j.ijheatmasstransfer.2019.07.046. [Google Scholar] [CrossRef]
35. Li, N., Chen, J., Cheng, T., Klemeš, J. J., Varbanov, P. S. et al. (2020). Analysing thermal-hydraulic performance and energy efficiency of shell-and-tube heat exchangers with longitudinal flow based on experiment and numerical simulation. Energy, 202, 117757. DOI 10.1016/j.energy.2020.117757. [Google Scholar] [CrossRef]
36. Abdullah, A. S., Amro, M. I., Younes, M. M., Omara, Z. M., Kabeel, A. E. et al. (2020). Experimental investigation of single pass solar air heater with reflectors and turbulators. Alexandria Engineering Journal, 59(2), 579–587. DOI 10.1016/j.aej.2020.02.004. [Google Scholar] [CrossRef]
37. Mandal, S. K., Deb, A., Sen, D. (2020). A computational study on mixed convection with surface radiation in a channel in presence of discrete heat sources and vortex generator based on RSM. Journal of Thermal Analysis and Calorimetry, 141(6), 2239–2251. DOI 10.1007/s10973-020-09774-w. [Google Scholar] [CrossRef]
38. Barber, J., Brutin, D., Tadrist, L. (2011). A review on boiling heat transfer enhancement with nanofluids. Nanoscale Research Letters, 6(1), 280. DOI 10.1186/1556-276X-6-280. [Google Scholar] [CrossRef]
39. Gupta, M., Arora, N., Kumar, R., Kumar, S., Dilbaghi, N. (2014). A comprehensive review of experimental investigations of forced convective heat transfer characteristics for various nanofluids. International Journal of Mechanical and Materials Engineering, 9(1), 11. DOI 10.1186/s40712-014-0011-x. [Google Scholar] [CrossRef]
40. Najah Al-Shamani, A., Yazdi, M. H., Alghoul, M. A., Abed, A. M., Ruslan, M. H. et al. (2014). Nanofluids for improved efficiency in cooling solar collectors—A review. Renewable and Sustainable Energy Reviews, 38, 348–367. DOI 10.1016/j.rser.2014.05.041. [Google Scholar] [CrossRef]
41. Bozorgan, N., Shafahi, M. (2015). Performance evaluation of nanofluids in solar energy: A review of the recent literature. Micro and Nano Systems Letters, 3(1), 5. DOI 10.1186/s40486-015-0014-2. [Google Scholar] [CrossRef]
42. Lomascolo, M., Colangelo, G., Milanese, M., Risi, A. (2015). Review of heat transfer in nanofluids: Conductive, convective and radiative experimental results. Renewable and Sustainable Energy Reviews, 43, 1182–1198. DOI 10.1016/j.rser.2014.11.086. [Google Scholar] [CrossRef]
43. Sadeghinezhad, E., Mehrali, M., Saidur, R., Mehrali, M., Latibari, S. T. et al. (2016). A comprehensive review on graphene nanofluids: Recent research, development and applications. Energy Conversion and Management, 111, 466–487. DOI 10.1016/j.enconman.2016.01.004. [Google Scholar] [CrossRef]
44. Mukherjee, S., Mishra, P. C., Parashar, S. K. S., Chaudhuri, P. (2016). Role of temperature on thermal conductivity of nanofluids: A brief literature review. Heat and Mass Transfer, 52, 2575–2585. DOI 10.1007/s00231-016-1753-1. [Google Scholar] [CrossRef]
45. Babita, S. M. G., Sharma, S. K., Mital, G. S. (2016). Preparation and evaluation of stable nanofluids for heat transfer application: A review. Experimental Thermal and Fluid Science, 79, 202–2012. DOI 10.1016/j.expthermflusci.2016.06.029. [Google Scholar] [CrossRef]
46. Rasheed, A. K., Khalid, M., Rashmi, W., Gupta, T. C. S. M., Chan, A. (2016). Graphene based nanofluids and nanolubricants—Review of recent developments. Renewable and Sustainable Energy Reviews, 63, 346–362. DOI 10.1016/j.rser.2016.04.072. [Google Scholar] [CrossRef]
47. Yang, L., Dua, K. (2017). A comprehensive review on heat transfer characteristics of TiO2 nanofluids. International Journal of Heat and Mass Transfer, 108, 11–31. DOI 10.1016/j.ijheatmasstransfer.2016.11.086. [Google Scholar] [CrossRef]
48. Colangelo, G., Favale, E., Milanese, M., de Risi, A., Laforgia, D. (2017). Cooling of electronic devices: Nanofluids contribution. Applied Thermal Engineering, 127, 421–435. DOI 10.1016/j.applthermaleng.2017.08.042. [Google Scholar] [CrossRef]
49. Ganvir, R. B., Walke, P. V., Kriplani, V. M. (2017). Heat transfer characteristics in nanofluid—A review. Renewable and Sustainable Energy Reviews, 75, 451–460. DOI 10.1016/j.rser.2016.11.010. [Google Scholar] [CrossRef]
50. Kasaeian, A., Daneshazarian, R., Mahian, O., Kolsi, L., Chamkha, A. J. et al. (2017). Nanofluid flow and heat transfer in porous media: A review of the latest developments. International Journal of Heat and Mass Transfer, 107, 778–791. DOI 10.1016/j.ijheatmasstransfer.2016.11.074. [Google Scholar] [CrossRef]
51. Mohammed, K. A., Abu Talib, A. R., Nuraini, A. A., Ahmed, K. A. (2017). Review of forced convection nanofluids through corrugated facing step. Renewable and Sustainable Energy Reviews, 75, 234–241. DOI 10.1016/j.rser.2016.10.067. [Google Scholar] [CrossRef]
52. Che Sidik, N. A., Samion, S., Ghaderian, J., Yazid, M. N. A. W. M. (2017). Recent progress on the application of nanofluids in minimum quantity lubrication machining: A review. International Journal of Heat and Mass Transfer, 108, 79–89. DOI 10.1016/j.ijheatmasstransfer.2016.11.105. [Google Scholar] [CrossRef]
53. Nadooshan, A. A., Eshgarf, H., Afrand, M. (2018). Evaluating the effects of different parameters on rheological behavior of nanofluids: A comprehensive review. Powder Technology, 338, 342–353. DOI 10.1016/j.powtec.2018.07.018. [Google Scholar] [CrossRef]
54. Angayarkanni, S. A., Philip, J. (2015). Review on thermal properties of nanofluids: Recent developments. Advances in Colloid and Interface Science, 225, 146–176. DOI 10.1016/j.cis.2015.08.014. [Google Scholar] [CrossRef]
55. Mahian, O., Kolsi, L., Amani, M., Estellé, P., Ahmadi, G. (2019). et al. Recent advances in modeling and simulation of nanofluid flows—Part II: Applications. Physics Reports, 791, 1–59. DOI 10.1016/j.physrep.2018.11.003. [Google Scholar] [CrossRef]
56. Raj, P., Subudhi, S. (2018). A review of studies using nanofluids in flat-plate and direct absorption solar collectors. Renewable and Sustainable Energy Reviews, 84, 54–74. DOI 10.1016/j.rser.2017.10.012. [Google Scholar] [CrossRef]
57. Taherian, H., Alvarado, J. L., Languri, E. M. (2018). Enhanced thermophysical properties of multiwalled carbon nanotubes based nanofluids, part 2: Experimental verification. Renewable and Sustainable Energy Reviews, 82, 4337–4344. DOI 10.1016/j.rser.2017.05.117. [Google Scholar] [CrossRef]
58. Zhang, Z., Cai, J., Chen, F., Li, H., Zhang, W. et al. (2018). Progress in enhancement of CO2 absorption by nanofluids: A mini review of mechanisms and current status. Renewable Energy, 118, 527–535. DOI 10.1016/j.renene.2017.11.031. [Google Scholar] [CrossRef]
59. Zendehboudi, A., Saidur, R., Mahbubul, I. M., Hosseini, S. H. (2019). Data-driven methods for estimating the effective thermal conductivity of nanofluids: A comprehensive review. International Journal of Heat and Mass Transfer, 131, 1211–1231. DOI 10.1016/j.ijheatmasstransfer.2018.11.053. [Google Scholar] [CrossRef]
60. Arshad, A., Jabbal, M., Yan, Y., Reay, D. (2019). A review on graphene based nanofluids: Preparation, characterization and applications. Journal of Molecular Liquids, 279, 444–484. DOI 10.1016/j.molliq.2019.01.153. [Google Scholar] [CrossRef]
61. Bumataria, R. K., Chavda, N. K., Panchal, H. (2019). Current research aspects in mono and hybrid nanofluid based heat pipe technologies. Heliyon, 5(5), 1627. DOI 10.1016/j.heliyon.2019.e01627. [Google Scholar] [CrossRef]
62. Wahab, A., Hassan, A., Qasim, M. A., Ali, H. M., Babar, H. et al. (2019). Solar energy systems—Potential of nanofluids. Journal of Molecular Liquids, 298, 111049. DOI 10.1016/j.molliq.2019.111049. [Google Scholar] [CrossRef]
63. Pourmehran, O., Rahimi-Gorji, M., Hatami, M., Sahebi, S. A. R., Domairry, G. (2015). Numerical optimization of microchannel heat sink (MCHS) performance cooled by KKL based nanofluids in saturated porous medium. Journal of the Taiwan Institute of Chemical Engineers, 55, 49–68. DOI 10.1016/j.jtice.2015.04.016. [Google Scholar] [CrossRef]
64. Nazari, S., Toghraie, D. (2016). Numerical simulation of heat transfer and fluid flow of water-CuO nanofluid in a sinusoidal channel with a porous medium. Physica E: Low-dimensional Systems and Nanostructures, 87, 134–140. DOI 10.1016/j.physe.2016.11.035. [Google Scholar] [CrossRef]
65. Biglarian, M., Gorji, M. R., Pourmehran, O., Domairry, G. (2017). H2O based different nanofluids with unsteady condition and an external magnetic field on permeable channel heat transfer. International Journal of Hydrogen Energy, 42(34), 22005–22014. DOI 10.1016/j.ijhydene.2017.07.085. [Google Scholar] [CrossRef]
66. Sheikholeslami, M. (2018). Numerical investigation for CuO-H2O nanofluid flow in a porous channel with magnetic field using mesoscopic method. Journal of Molecular Liquids, 249, 739–746. DOI 10.1016/j.molliq.2017.11.069. [Google Scholar] [CrossRef]
67. Nojoomizadeh, M., D’Orazio, A., Karimipour, A., Afrand, M., Goodarzi, M. (2018). Investigation of permeability effect on slip velocity and temperature jump boundary conditions for FMWNT/water nanofluid flow and heat transfer inside a microchannel filled by a porous media. Physica E: Low-dimensional Systems and Nanostructures, 97, 226–238. DOI 10.1016/j.physe.2017.11.008. [Google Scholar] [CrossRef]
68. Nojoomizadeh, M., Karimipour, A., Firouzi, M., Afrand, M. (2018). Investigation of permeability and porosity effects on the slip velocity and convection heat transfer rate of Fe3O4/water nanofluid flow in a microchannel while its lower half filled by a porous medium. International Journal of Heat and Mass Transfer, 119, 891–906. DOI 10.1016/j.ijheatmasstransfer.2017.11.125. [Google Scholar] [CrossRef]
69. Job, V. M., Gunakala, S. R. (2018). Unsteady hydromagnetic mixed convection nanofluid flows through an L-shaped channel with a porous inner layer and heat-generating components. International Journal of Heat and Mass Transfer, 120, 970–986. DOI 10.1016/j.ijheatmasstransfer.2017.12.112. [Google Scholar] [CrossRef]
70. Ashorynejad, H. R., Zarghami, A. (2018). Magnetohydrodynamics flow and heat transfer of Cu-water nanofluid through a partially porous wavy channel. International Journal of Heat and Mass Transfer, 119, 247–258. DOI 10.1016/j.ijheatmasstransfer.2017.11.117. [Google Scholar] [CrossRef]
71. Saba, F., Ahmed, N., Khan, U., Mohyud-Din, S. T. (2019). Impact of an effective Prandtl number model and across mass transport phenomenon on the AI2O3 nanofluid flow inside a channel. Physica A: Statistical Mechanics and its Applications, 526, 121083. DOI 10.1016/j.physa.2019.121083. [Google Scholar] [CrossRef]
72. Ogunseye, H. A., Sibanda, P. (2019). A mathematical model for entropy generation in a powell-eyring nanofluid flow in a porous channel. Heliyon, 5(5), 1662. DOI 10.1016/j.heliyon.2019.e01662. [Google Scholar] [CrossRef]
73. Bezaatpour, M., Goharkhah, M. (2019). Three dimensional simulation of hydrodynamic and heat transfer behavior of magnetite nanofluid flow in circular and rectangular channel heat sinks filled with porous media. Powder Technology, 344, 68–78. DOI 10.1016/j.powtec.2018.11.104. [Google Scholar] [CrossRef]
74. Fakour, M., Ganji, D. D., Abbasi, M. (2014). Scrutiny of underdeveloped nanofluid MHD flow and heat conduction in a channel with porous walls. Case Studies in Thermal Engineering, 4, 202–214. DOI 10.1016/j.csite.2014.10.003. [Google Scholar] [CrossRef]
75. Shahmohamadi, H., Rashidi, M. M. (2016). VIM solution of squeezing MHD nanofluid flow in a rotating channel with lower stretching porous surface. Advanced Powder Technology, 27(1), 171–178. DOI 10.1016/j.apt.2015.11.014. [Google Scholar] [CrossRef]
76. Saqib, M., Khan, I., Shafie, S. (2018). Application of Atangana–Baleanu fractional derivative to MHD channel flow of CMC-based-CNT’s nanofluid through a porous medium. Chaos, Solitons and Fractals, 116, 79–85. DOI 10.1016/j.chaos.2018.09.007. [Google Scholar] [CrossRef]
77. Siddiqui, A. A., Sheikholeslami, M. (2018). TiO2-water nanofluid in a porous channel under the effects of an inclined magnetic field and variable thermal conductivity. Applied Mathematics and Mechanics, 39(8), 1201–1216. DOI 10.1007/s10483-018-2359-6. [Google Scholar] [CrossRef]
78. Baghsaz, S., Rezanejad, S., Moghimi, M. (2019). Numerical investigation of transient natural convection and entropy generation analysis in a porous cavity filled with nanofluid considering nanoparticles sedimentation. Journal of Molecular Liquids, 279, 327–341. DOI 10.1016/j.molliq.2019.01.117. [Google Scholar] [CrossRef]
79. Gholinia, M., Moosavi, S. A. H. K., Pourfallah, M., Gholinia, S., Ganji, D. D. (2019). A numerical treatment of TiO2/C2H6O2- H2O hybrid base nanofluid inside a porous cavity under impact of shape factor in MHD flow. International Journal of Ambient Energy, 231, 1–8. DOI 10.1080/01430750.2019.1614996. [Google Scholar] [CrossRef]
80. Alsabery, A. I., Chamkha, A. J., Hussain, S. H., Saleh, H., Hashim, I. (2015). Heatline visualization of natural convection in a trapezoidal cavity partly filled with nanofluid porous layer and partly with non-Newtonian fluid layer. Advanced Powder Technology, 26(4), 1230–1244. DOI 10.1016/j.apt.2015.06.005. [Google Scholar] [CrossRef]
81. Astanina, M. S., Sheremet, M. A., Oztop, H. F., Abu-Hamdeh, N. (2018). Mixed convection of Al2O3-water nanofluid in a lid-driven cavity having two porous layers. International Journal of Heat and Mass Transfer, 118, 527–537. DOI 10.1016/j.ijheatmasstransfer.2017.11.018. [Google Scholar] [CrossRef]
82. Chamkha, A. J., Ismael, M. A. (2013). Conjugate heat transfer in a porous cavity filled with nanofluids and heated by a triangular thick wall. International Journal of Thermal Sciences, 67, 135–151. DOI 10.1016/j.ijthermalsci.2012.12.002. [Google Scholar] [CrossRef]
83. Ismael, M. A., Armaghani, T., Chamkha, A. J. (2016). Conjugate heat transfer and entropy generation in a cavity filled with a nanofluid-saturated porous media and heated by a triangular solid. Journal of the Taiwan Institute of Chemical Engineers, 59, 138–151. DOI 10.1016/j.jtice.2015.09.012. [Google Scholar] [CrossRef]
84. Mehryan, S. A. M., Kashkooli, F. M., Ghalambaz, M., Chamkha, A. J. (2017). Free convection of hybrid Al2O3-Cu water nanofluid in a differentially heated porous cavity. Advanced Powder Technology, 28(9), 2295–2305. DOI 10.1016/j.apt.2017.06.011. [Google Scholar] [CrossRef]
85. Miroshnichenko, I. V., Sheremet, M. A., Oztop, H. F., Abu-Hamdeh, N. (2018). Natural convection of alumina-water nanofluid in an open cavity having multiple porous layers. International Journal of Heat and Mass Transfer, 125, 648–657. DOI 10.1016/j.ijheatmasstransfer.2018.04.108. [Google Scholar] [CrossRef]
86. Akhter, R., Ali, M. M., Alim, M. A. (2019). Hydromagnetic natural convection heat transfer in a partially heated enclosure filled with porous medium saturated by nanofluid. International Journal of Applied and Computational Mathematics, 5(3), 52. DOI 10.1007/s40819-019-0638-7. [Google Scholar] [CrossRef]
87. Izadi, M., Hoghoughi, G., Mohebbi, R., Sheremet, M. (2018). Nanoparticle migration and natural convection heat transfer of Cu-water nanofluid inside a porous undulant-wall enclosure using LTNE and two-phase model. Journal of Molecular Liquids, 261, 357–372. DOI 10.1016/j.molliq.2018.04.063. [Google Scholar] [CrossRef]
88. Malik, S., Nayak, A. K. (2017). MHD convection and entropy generation of nanofluid in a porous enclosure with sinusoidal heating. International Journal of Heat and Mass Transfer, 111, 329–345. DOI 10.1016/j.ijheatmasstransfer.2017.03.123. [Google Scholar] [CrossRef]
89. Nithyadevi, N., Begum, A. S. (2017). Effect of magnetic field on mixed convection flow in a porous enclosure using nanofluids. International Journal of Applied Computational Mathematics, 3(4), 3433–3442. DOI 10.1007/s40819-017-0305-9. [Google Scholar] [CrossRef]
90. Mahani, R. B., Hussein, A. K., Talebizadehsardari, P. (2020). Thermal-hydraulic performance of hybrid nanoadditives containing multiwall carbon nanotube— inside a parabolic through solar collector with turbulators. Mathematical Methods in the Applied Sciences, DOI 10.1002/mma.6842, (In press). [Google Scholar] [CrossRef]
91. Mehryan, S. A. M., Ayoubi-Ayoubloo, K., Shahabadi, M., Ghalambaz, M., Talebizadehsardari, P. et al. (2020). Conjugate phase change heat transfer in an inclined compound cavity partially filled with a porous medium: A deformed mesh approach. Transport in Porous media, 132(3), 657–681. DOI 10.1007/s11242-020-01407-y. [Google Scholar] [CrossRef]
92. Mehryan, S. A. M., Ghalambaz, M., Gargari, L. S., Hajjar, A., Sheremet, M. (2020). Natural convection flow of a suspension containing nano-encapsulated phase change particles in an eccentric annulus. Journal of Energy Storage, 28, 101236. DOI 10.1016/j.est.2020.101236. [Google Scholar] [CrossRef]
93. Ho, C. J., Liu, Y. C., Ghalambaz, M., Yan, W. M. (2020). Forced convection heat transfer of nano-encapsulated phase change material (NEPCM) suspension in a mini-channel heatsink. International Journal of Heat and Mass Transfer, 155, 119858. DOI 10.1016/j.ijheatmasstransfer.2020.119858. [Google Scholar] [CrossRef]
94. Mohammed, H., Sardari, P. T., Giddings, D. (2019). Multiphase flow and boiling heat transfer modelling of nanofluids in horizontal tubes embedded in a metal foam. International Journal of Thermal Science, 146, 106099. DOI 10.1016/j.ijthermalsci.2019.106099. [Google Scholar] [CrossRef]
95. Mehdi, D. M., Akhavan-Behabadi, M. A. (2016). Mixed convection of MWCNT–heat transfer Oil nanofluid inside inclined plain and microfin tubes under laminar assisted flow. International Journal of Thermal Sciences, 99, 1–8. DOI 10.1016/j.ijthermalsci.2015.07.025. [Google Scholar] [CrossRef]
96. Gholami, M. R., Akbari, O. A., Marzban, A., Toghraie, D., Shabani, G. A. S. et al. (2017). The effect of rib shape on the behavior of laminar flow of oil/MWCNT nanofluid in a rectangular microchannel. Journal of Thermal Analysis and Calorimetry, 134(3), 1611–1628. DOI 10.1007/s10973-017-6902-3. [Google Scholar] [CrossRef]
97. Pourfattah, F., Motamedian, M., Sheikhzadeh, G., Toghraie, D., Akbari, O. A. (2017). The numerical investigation of angle of attack of inclined rectangular rib on the turbulent heat transfer of water-Al2O3 nanofluid in a tube. International Journal of Mechanical Sciences, 131–132, 1106–1116. DOI 10.1016/j.ijmecsci.2017.07.049. [Google Scholar] [CrossRef]
98. Patankar, S. V. (1980). Numerical heat transfer and fluid flow. New York: McGraw-Hill. [Google Scholar]
99. Leonard, B. P., Mokhtari, S. (1990). Ultra-sharp nonoscillatory convection schemes for high-speed steady multidimensional flow, NASA TM 1-2568. Institute for Computational Mechanics in Propulsion, NASA Lewis Research Center, Case Western Reserve University. [Google Scholar]
 | This work is licensed under a Creative Commons Attribution 4.0 International License, which permits unrestricted use, distribution, and reproduction in any medium, provided the original work is properly cited. |
 generation
 dissipation due to turbulence
 effective-diffusivity