DOI: 10.32604/cmes.2021.013045
ARTICLE
Traffic Anomaly Detection Method Based on Improved GRU and EFMS-Kmeans Clustering
1Science and Technology on Communication Networks Laboratory, The 54th Research Institute of CETC, Shijiazhuang, China
2Department of Military Representative Office of General Military Equipment Development Shijiazhuang, Shijiazhuang, China
3State Key Laboratory of Networking and Switching Technology, Beijing University of Posts and Telecommunications, Beijing, 100876, China
*Corresponding Author: Yang Yang. Email: yyang@bupt.edu.cn
Received: 23 July 2020; Accepted: 04 November 2020
Abstract: In recent years, with the continuous development of information technology and the rapid growth of network scale, network monitoring and management become more and more important. Network traffic is an important part of network state. In order to ensure the normal operation of the network, improve the availability of the network, find network faults in time and deal with network attacks; it is necessary to detect the abnormal traffic in the network. Abnormal traffic detection is of great significance in the actual network management. Therefore, in order to improve the accuracy and efficiency of network traffic anomaly detection, this paper proposes a comprehensive anomaly detection method based on improved GRU traffic prediction and improved K-means clustering, and cascade the traffic prediction and clustering to achieve the purpose of anomaly detection. Firstly, an improved highway-GRU algorithm HS-GRU (An improved Gate Recurrent Unit neural network based on Highway network and STL algorithm, HS-GRU) is proposed, which combines STL decomposition algorithm with highway GRU neural network and uses this improved algorithm to predict traffic. And then, we proposed the EFMS-Kmeans algorithm (An improved clustering algorithm that combined Mean Shift algorithm based on electrostatic force with K-means clustering) to solve the shortcoming of the traditional K-means clustering which cannot automatically determine the number of clustering. The sum of the squared errors (SSE) method and the contour coefficient method were used to double test the clustering effect. After determining the clustering center, the potential energy gradient was directly used for anomaly detection by using the threshold method, which considered the local characteristics of the data and ensured the accuracy of anomaly detection. The simulation results show that the anomaly detection algorithm based on HS-GRU and EFMS-Kmeans clustering proposed in this paper can effectively improve the accuracy of flow anomaly detection and has important application value.
Keywords: Anomaly detection; gated recurrent unit; clustering; mean shift; K-means
In recent years, with the development of Internet technology, the network structure has become increasingly complex and the scale of data has continued to expand. The complex network structure brings huge challenges to network security. Many criminals attack the network to obtain useful information and great wealth. Anomaly detection of network traffic can provide key auxiliary decisions for network management and security early warning, which has very important practical significance.
Anomaly detection refers to the problem of finding patterns in data that do not conform to expected behavior [1]. For network anomaly detection, it means using statistical analysis, data mining, and machine learning methods to find information like abnormal data groups and abnormal interactions in the network, in order to provide support and assistance for subsequent network management. Generally, network anomaly detection requires the use of some data stream processing tools to collect a large amount of network data stream information, and then extract and filter out the data attributes that can be used for anomaly detection, and obtain the classification of the data records, and finally determine whether it is normal by analyzing the data attributes.
The existing methods of network anomaly detection can be mainly divided into the following sorts: unsupervised learning methods, supervised learning methods and semi-supervised learning methods. Supervised anomaly detection methods mainly include neural network, pattern prediction, probability statistics, incremental SVM and other methods; unsupervised anomaly detection methods mainly include AP cluster anomaly detection based on the kernel adaptive algorithm, K-means clustering anomaly detection; semi-supervised anomaly detection methods are mainly a combination of supervised anomaly detection methods and unsupervised anomaly detection methods, and the main way is to improve the clustering-based anomaly detection method [2].
The density-based clustering method is one of the common clustering algorithm. By calculating the density, the density-based clustering method can over-come the shortcoming that the distance-based algorithm can only find spherical clusters, and has better effect for anomaly detection [3]. However, the anomaly detection method based on density clustering has a high time complexity, which usually adopts global parameters and ignores local characteristics of sample distribution, resulting in poor accuracy of anomaly detection. Therefore, density-based and distance-based clustering algorithms are used in this paper. Firstly, the number and center of categories are automatically determined by using the improved Mean Shift algorithm based on electrostatic force, and then the number of clustering clusters obtained is used as the K value of K-means for anomaly detection. It makes up the shortcoming of K-means algorithm to manually specify the number of clustering K.
Aiming at the problem that the traditional method has a poor detection effect on single traffic values for network time series data, a traffic prediction-clustering cascade anomaly detection method is proposed in this paper. Firstly, in view of the periodic characteristics of network traffic data, this paper proposes a traffic prediction algorithm HS_GRU (An improved Gate Recurrent Unit neural network based on Highway network and STL algorithm, HS-GRU) which combines the GRU (Gate Recurrent Unit) neural network with the STL (Seasonal Trend decomposition using Loess) decomposition algorithm after the Box-Cox transformation and highway network to predict the network traffic data. The STL decomposition algorithm extracts the periodic component of the network traffic data and then the remaining component is input into the highway GRU neural network model for prediction. In this way, the model can effectively capture the periodicity characteristics of network traffic data and improve the accuracy of traffic prediction. Secondly, this paper proposes an improved Mean Shift clustering method based on electrostatic force (An improved Mean Shift clustering method-based on electrostatic force, EFMS). The concept of electrostatic force was introduced based on Coulomb’s law, and the K-nearest neighbor thought was used to reduce the computational complexity. Meanwhile, the over-dependence of Mean Shift clustering algorithm on bandwidth was solved. Finally, EFMS is combined with the classical K-means algorithm to obtain the improved K-means anomaly detection algorithm (A K-means detection algorithm based on EFMS, EFMS-Kmeans). Based on the clustering number and clustering center obtained by the EFMS algorithm, the K-means method is used for anomaly detection. The threshold method is adopted to directly use the potential energy gradient for anomaly detection, which not only considers the local characteristics of the data, but also ensures the accuracy of anomaly detection. Finally, the anomaly detection method in this paper is obtained, and the prediction results of HS_GRU are used as one of the inputs of the improved EFMS-Kmeans clustering algorithm to predict the abnormal traffic. The improved anomaly detection algorithm proposed in this paper can effectively improve the detection efficiency and adapt to the actual network data.
The remaining sections of this paper are organized as follows: Section 2 introduces the relevant work, Section 3 introduces the improved algorithm, Section 4 introduces the simulation experiment, and Section 5 summarizes the full text.
Now, information technology is in an era of rapid development. With the rapid development of Internet Technology, the scale of the network is increasing day by day, its structure is becoming more and more complex, the probability of occurrence of failures and abnormalities in the network is greatly increased, and network attacks are common. In order to ensure the normal operation of the network, improve the availability of the network, detect network failures in time, and respond to network attacks, it is necessary to detect abnormal traffic in the network. Anomaly detection is an important data analysis task that can be used to identify network intrusions and network failures [2]. Anomaly detection has been widely used in countless application fields, such as medical and public health, fraud detection, intrusion detection, industrial destruction, image processing, sensor networks, robotic behavior and astronomical data [4].
Abnormal traffic refers to a traffic pattern that is different from the normal network operation when the network is not operating normally or there is network intrusion. Due to various reasons such as equipment failure, data source conflict, abnormal behavior, human error, negligence, etc., abnormal data will be generated in the network. In the network, traffic data is one of the important data that reflects the network status, and statistical analysis of network traffic data can help effectively manage the network. The abnormal value of traffic usually represents the existence of abnormal conditions in the entire network, including network attacks, equipment failures, etc. Such anomalies need to be dealt with as soon as possible; otherwise, it will have a negative impact on the entire network. It can be seen that abnormal traffic detection is of great significance in actual network management.
There are various researches on anomaly detection, because anomaly detection has a very wide range of applications and practical value, many researchers will research suitable anomaly detection methods according to the actual needs of their fields. Dias et al. [5] proposed an anomaly detection framework based on normalized flow. The main application scenario of the framework is trajectory anomaly detection, which can perform complex density estimation based on data through neural networks. The main contribution of this paper is to calculate an accurate model likelihood value for each part of the trajectory, which is an important feature of normalized flow. They aggregated the likelihood of segmentation into a single coherent trajectory anomaly score. Such a strategy enables the processing of potentially large sequences with different lengths. Compared with the traditional anomaly detection effect, this method has better effect.
Almohri et al. [6] applied clustering anomaly detection to anomaly detection of IoT devices. This paper uses binary classifiers and density-based clustering algorithms to model the behavior of benign IoT devices through a real test bed, aiming to capture normal behaviors in the IoT monitoring environment. The results of the IoT test platform show that the classifier and clustering algorithm have good application effects in detecting damaged IoT devices.
Li et al. [7] applied clustering anomaly detection to road anomaly detection. They use spatial clustering methods to group multiple driving test results based on their spatial density patterns. Finally, the optimized detection results are obtained by integrating the member points of each cluster, and the detection results are good.
Cluster-based anomaly detection has a wealth of practical experience and theoretical research accumulation. Anomaly detection in many fields is based on clustering, and the most common is based on K-means. Nogues et al. [8] proposed an abnormal network traffic detection algorithm based on K-means, using similarity and dissimilarity to define clustering criteria. However, this method only uses the basic K-means clustering, and does not improve the K-means, and the effect of the algorithm is not ideal. In the document, the author did not specify the specific experimental procedures.
Aljawarneh et al. [9] proposed an algorithm for incremental clustering dimensionality reduction and intrusion detection based on distance metric. Intrusion detection is a sub-process of anomaly detection. This document uses a clustering feature pattern based on gradually increasing, which can improve the accuracy of intrusion detection.
Hafeez et al. [10] proposed a combination of fuzzy C-means clustering and fuzzy interpolation scheme for anomaly detection in the Internet of Things to analyze network traffic and detect malicious network activities. Once malicious activity is detected, the anomaly detection system will automatically enforce network access restrictions on the IoT device that generates this activity and prevent it from attacking other devices or services. This document has a wealth of experimental data sets and has achieved good simulation results.
Kongshavn et al. [11] applied clustering techniques to diagnose distributed denial of service (DDoS) attacks. Use clustering techniques to create geographic clusters in areas that may contain legitimate traffic. Through extensive experimental results, they believe that the use of clustering algorithms is a better solution.
As a classic and very effective method, clustering algorithm is often combined with other algorithms for anomaly detection. Barletta et al. [12] studied the security of in-vehicle communication networks. An intrusion detection based on distance judgment is proposed. They first used the supervised XY Fusion Kohonen network (XYF), and then combined the XYF network with the K-means clustering algorithm (XYF-K) to improve network efficiency. The model was tested on an open source data set, and the proposed architecture showed high performance in the accuracy of attack message detection.
Since the use of a single clustering method for anomaly detection is not effective, many experts and scholars have adopted a combination of two clustering methods for anomaly detection. Parwez et al. [13] used unsupervised clustering techniques to do anomaly detection, namely K-means clustering and hierarchical clustering. The combination of the two clustering methods can make up for each other’s defects, and the effect of anomaly detection is greatly improved. However, the document does not improve these two basic clustering algorithms, so the effect of anomaly detection needs to be improved.
In recent years, with the rise of artificial intelligence and the in-depth study of neural networks, many neural network models have been applied to anomaly detection. Pandeeswari et al. [14] proposed a cloud anomaly detection system based on fuzzy clustering neural network. In this article, they adopted a hybrid algorithm, which is a hybrid of Fuzzy CMeans clustering algorithm and artificial neural network (FCM-ANN) to improve the accuracy of the detection system. The system proposed in this document has been implemented and compared with the naive Bayes classifier and the classic ANN algorithm. The simulation results show that the system can detect anomalies with high detection accuracy and low false alarm rate even under low-frequency attacks.
In addition to combining with neural networks, clustering algorithms can also be used as a sub-step in a multi-step anomaly detection algorithm for anomaly detection. Bhuyan et al. [15] proposed a method based on multi-step outliers to detect network traffic abnormalities. To support network anomaly recognition based on outliers, they use the following modules: mutual information and feature selection techniques based on generalized entropy to select relevant non-redundant feature subsets; tree-based clustering techniques to identify anomalies.
Alkasassbeh et al. [16] proposed a novel hybrid method to detect DDoS attacks by monitoring abnormal traffic in the network. This method reads the flow data and builds a predictive model based on it, through which future data can be predicted and compared with the observed data in order to detect abnormal flow. This method combines two methods: traffic prediction and change detection. This method first obtains the predicted value through traffic prediction, and then compares the real value to define the upper and lower boundaries to detect anomalies. This method achieves a high accuracy rate.
Yaacob et al. [17] studied a new method of detecting potential attacks that may occur in the network by using the Autoregressive Integrated Moving Average (ARIMA) model technology. The solution can provide feedback through its predictive capabilities to provide early warning. Andrysiak et al. [18] proposed the use of fractional ARIMA (Fractional ARIMA, ARFIMA or FARIMA) model for network anomaly detection. The author selects model parameters based on the representation consistency model and its estimation error, and uses the statistical relationship between the prediction and the original network traffic to determine whether the traffic to be detected is normal or under attack.
In essence, unsupervised anomaly detection using deep learning is mainly hybrid. First, deep neural networks learn complex patterns of data. Then, the output layer representation from the training network is used as the input of traditional anomaly detection algorithms. Inspired by Davis et al. [19], we also adopted a combination of neural network and unsupervised anomaly detection. The main idea of our method is an abnormal flow detection technology based on flow prediction.
At present, there are many methods for flow prediction, which can be roughly divided into two categories: traditional flow prediction method such as FARIMA [20], artificial intelligence method mainly including neural network [21].
Katris et al. [22] compared some forecasting model building procedures like ARIMA, FARIMA and Artificial Neural Networks (ANN) models with Internet traffic data. The experiment shows that, predictions may further be improved if we recognize the non-linear structure, existing sometimes in the time series, with the help of ANN.
Feng et al. [23] proposed Deep Traffic Predictor (DeepTP) to forecast traffic demands from spatial-dependent and long-period cellular traffic, which can be divided into two components: a general feature extractor for modeling spatial dependencies and encoding the external information, and a sequential module for modeling complicated temporal variations.
Zhou et al. [24] proposed a new network traffic prediction method based on improved echo state network to deal with the complex characters of network traffic, such as mutability, chaos, timeliness, and nonlinearity.
In view of the time characteristics of traffic, RNN and its variants are frequently used in traffic forecasting. Liu et al. [25] proposed several TM prediction methods based on Neural Networks (NN) and predict TM from three perspectives: predict the overall TM directly, predict each origin-destination (OD) flow separately and predict the overall TM combined with key element correction. The experiment results show that prediction methods based on Recurrent Neural Networks (RNN) can achieve better prediction accuracy than methods leveraging Convolutional Neural Networks (CNN) and Deep Belief Networks (DBN).
Cao et al. [26] applied the gated recurrent unit (GRU) model and the interactive temporal recurrent convolution network (ITRCN) to single-service traffic prediction and interactive network traffic prediction respectively. The experiments results based on the Yahoo data sets show that the proposed novel method outperforms the conventional GRU and CNN method.
However, due to the complexity of traffic, in some scenarios, a single traffic forecasting method can no longer meet the demand, and decomposition algorithms are gradually being applied in traffic forecasting.
Xiang et al. [27] proposed a new hybrid network traffic prediction method based on the combination of the covariation orthogonal prediction and the artificial neural network prediction to capture the burstiness in the network traffic and the accuracy of the new prediction method has been effectively improved.
Wei et al. [28] introduced a prediction algorithm based on traffic decomposition. The complex correlation structure of the network history traffic is decomposed according to different protocols and then predicted with wavelet method separately. Simulation results show that the combination method can achieve higher prediction accuracy rather than that without traffic decomposition.
Jiang et al. [29] proposed a new prediction algorithm to network traffic in the large-scale communication network. They use signal analysis theory to transform network traffic from time domain to time-frequency domain and built the prediction models of low-frequency and high-frequency components. Simulation results indicate that the algorithm holds much lower prediction error than previous methods.
Yang [30] proposed a network traffic prediction method based on Short Time Fourier Transform (STFT) and traffic modeling and use STFT to decompose network traffic into high-frequency components and low frequency components. From simulations, the proposed prediction method outperforms WABR and PCA.
Network traffic forecasting technology is to predict the changing trend of network traffic in the future. It can provide great help for various important network management functions such as network attack detection, resource allocation, and routing selection. The predicted value obtained according to the traffic forecast can be used for outlier detection. Compared with other anomaly detection methods, the anomaly detection method based on traffic prediction is better in real-time and speed. However, the method of judging abnormalities is usually to judge the flow data only by comparing the actual value and the predicted value, combined with the threshold method. This method based on the flow prediction still has insufficient performance in detecting abnormalities. But, the method based on traffic prediction has the ability to quickly screen out obvious abnormal points, which can provide a guarantee able premise for the cluster-based anomaly detection method. In addition, since the result of traffic prediction is usually obtained through time series data training, it can be considered that the prediction result contains sequence information of past traffic. Adding it to the sample input of clustering detection can add time-series features to clustering samples to achieve detection that is more accurate. Therefore, this article will use traffic prediction technology as a pre processing for anomaly detection.
The anomaly detection method based on unsupervised clustering can adapt to unlabeled traffic scenarios and has good detection performance. However, the cluster-based anomaly detection method requires a large number of data samples for clustering processing, and the speed is slow. In addition, its detection principle is to find outliers in data samples through clustering. It needs to be based on a premise: that anomaly occupies a minority in a large number of clustered data samples. Most of the current researches directly regard it as the default condition without making discussion that is more rigorous and processing to ensure that the condition is established. Moreover, because traffic data is a type of time series data, cluster-based anomaly detection when faced with this type of data, if it only performs cluster detection on time series flow one-dimensional data, it will not be able to find some traffic anomalies related to the time series context. , Which will affect the results of anomaly detection. In addition, the existing solutions still have problems such as insufficient detection accuracy and low time efficiency considerations. In response to these problems, we first introduce the results of traffic prediction into cluster samples to increase the temporal characteristics of cluster samples. Subsequently, based on Mean Shift clustering, the concept of electric potential energy was introduced to highlight local characteristics and improve the accuracy of anomaly detection.
The anomaly detection method based on improved GRU and EFMS-Kmeans clustering proposed in this paper firstly obtains the traffic prediction value through the improved GRU model, and then uses the anomaly detection method based on the improved Mean Shift clustering to detect traffic anomaly. The method proposed in this paper can predict the trend of future network traffic changes and effectively detect abnormalities in network traffic. This is useful for grasping the current and future traffic status of the entire network, assisting in fault warning, routing planning, network monitoring, and network management. Significant significance, with important scientific research and practical value.
3 Anomaly Detection Algorithm Based on HS_GRU and EFMS-Kmeans Clustering
The cascade anomaly detection method based on flow prediction and improved density clustering proposed in this paper is shown in the figure. In this section, we will introduce the flow prediction method and the improved density clustering method in Section 3.1 mainly introduces the improved HS_GRU model, which is used to provide more accurate flow prediction results, so that the latter can be used for anomaly detection based on improved density clustering 3.2. The improved EFMS-Kmeans clustering method is mainly introduced. The traffic prediction results obtained by using the HS_GRU model are introduced into the anomaly detection data as one-dimensional data, so as to add timing characteristics to the clustering samples and achieve more accurate detection.
The cascade anomaly detection method based on flow prediction and improved density clustering proposed in this paper is shown in the Fig. 1 below.

Figure 1: A cascade detection method based on flow prediction and improved density clustering
3.1 Traffic Prediction Method Based on Improved GRU HS_GRU
Considering the periodic characteristics of traffic data and the obstruction of gradient information backflow that may occur during RNN network training, we propose HS_GRU which combines GRU with STL algorithm after the Box-Cox transformation and highway network to predict network traffic.
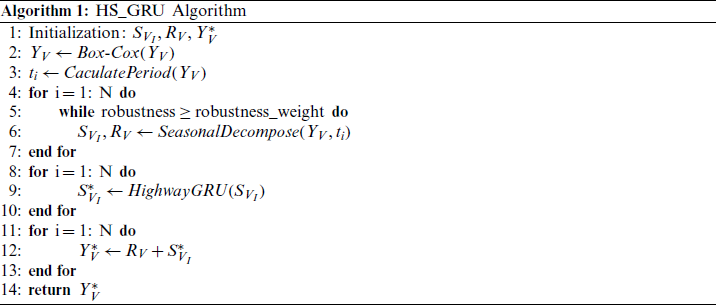
The overall flow of the network traffic prediction algorithm proposed in this paper which called HS_GRU is as follows:
Step 1: Process the original data set. The data is sorted according to the format to form an available data set.
Step 2: Apply Box-Cox transformation to the data to prepare for the next decomposition.
Step 3: Use the STL decomposition algorithm to decompose and extract periodic components from the data set.
Step 4: Save the periodic component. Collate and convert the remainder component into the sequence that can be used as supervise learning input.
Step 5: Input the sequence collated in Step 3 into the highway GRU neural network model. Output the predicted values of the remainder component.
Step 6: Add the predicted value of the remainder component to the periodic component reserved in Step 3 to produce the final network traffic prediction value.
In the above steps, Steps 1–3 are the pre processing part of the data. The part mainly uses the Box-Cox transformation and STL decomposition algorithm to extract and decompose the periodic part of the network traffic sequence. Steps 3–5 are the network traffic prediction parts. In these parts, the highway GRU neural network is used to predict the remainder sequence, and the Adam gradient descent algorithm is used to train the parameters. After outputting the predicted value, the final predicted network traffic value is obtained.
The flow of the algorithm is shown in Algorithm 1 and Fig. 2.
3.1.1 The Improvement with STL Algorithm
In network traffic prediction, it is necessary to master the data characteristics of network traffic to improve the accuracy of network traffic prediction. Due to the strong periodic characteristics of long-term network traffic, this paper intends to decompose and extract it periodically.
Considering the good performance of ARIMA (Autoregressive Integrated Moving Average model) in the prediction of periodic data, this paper adopts and improves its decomposition algorithm STL after applying the Box-Cox transformation to capture more periodic features. The specific method is as follows: Firstly, the network traffic data is decomposed into periodic component and remainder component by using STL decomposition algorithm. Subsequently, the periodic component is retained and the remainder component is input into the HS_GRU neural network model, thereby outputting the predicted value. Finally, the model output of the previous step is added to the retained periodic component to obtain the final network traffic prediction value.

Figure 2: The overview of the HS_GRU
Before STL decomposition, we apply Box-Cox transformation to the data. The Box-Cox transformation is a popular transformation for stabilizing the variance of a time series.
It is defined as:

Depending on the parameter  , the transformation is essentially the identity, the logarithm, or a transformation somewhere between. In this work, we assume that the transformed dependent variable is normally distributed, and then draws a likelihood function about
  . When the likelihood function value is maximum, the value of
  is the value we need here.
Considering that the long-term span network traffic data has multiple periodicities, the traditional STL (Seasonal Trend decomposition using Loess) decomposition algorithm can only extract a certain period when extracting seasonal components. Therefore, this paper improves the addition model of STL, and decomposes the time series into trend component, multiple seasonal component and remainder component. The specific expressions are as follows:

Svi represents the i-th periodic component, Rv represents the remainder component, 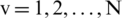 represents a certain moment.
3.1.2 The HS_GRU Neural Network
Gate Recurrent Unit (GRU) neural network [31] is an improved model of long short-term memory (LSTM) neural network. LSTM neural network is a variant model of recurrent neural network, which can well overcome the problem of long dependence in recurrent neural network, and is widely used to predict time series data. But there are still some problems in the LSTM neural network. The internal structure of the LSTM neural network is complex, which may lead to the long training time and long prediction time to predict time series data. GRU neural network is the improvement of LSTM neural network for this problem.
In order to further improve the neural network’s ability to predict traffic; this article combines the GRU algorithm with Highway network. A highway network is an approach to optimizing networks and can help solving the problem in network training due to the obstruction of gradient information backflow. Highway networks use learned gating mechanisms to regulate information flow, which allow neural networks to have paths for information to follow across different layers.
We input the periodic components decomposed by the STL decomposition algorithm into the neural network for prediction. The calculation formula of neurons of the neural network can be expressed as follows:


Among them, rt represents the update gate, zt represents the update gate,  represents the weight of the update gate; ht −1 represents the input of the previous neuron; Xt represents the input of the current neuron;
  represents the pending output in the original GRU neuron value;
  represents the transfer value of the original GRU and the highway network; mt represents the highway network parameter; ht represents the output of the neuron of the current neuron;
  represents the excitation function (Sigmoid function is often used), than represents hyperbolic function tangent function.
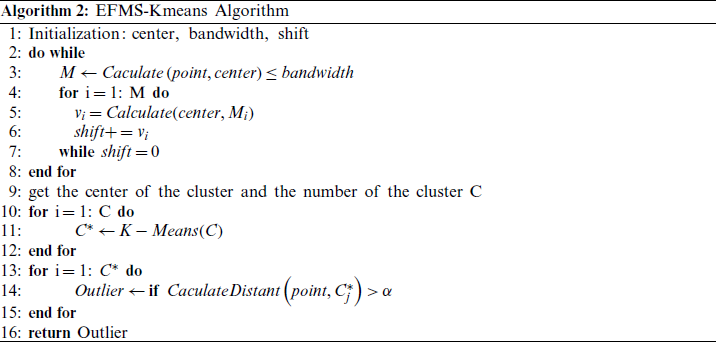
3.2 Anomaly Detection Methods Based on Improved K-means Clustering EFMS-Kmeans
When the cluster-based anomaly detection method is faced with the flow timing data, if only the convective value, a single data feature, is used for clustering detection, the detection effect will be poor because the flow timing information is ignored. Therefore, a cascade detection method based on flow prediction and density clustering is proposed in this paper. Based on flow prediction in the previous section, the prediction result that increases the input sample of clustering detection and implies the flow timing relationship is another one-dimensional feature to improve the accuracy of anomaly detection.
By calculating the density, the density-based clustering method can overcome the shortcoming that the distance-based algorithm can only find spherical clusters, and has better effect for anomaly detection. However, the anomaly detection method based on density clustering has a high time complexity, which usually adopts global parameters and ignores local characteristics of sample distribution, resulting in poor accuracy of anomaly detection. Therefore, density-based and distance-based clustering algorithms are used in this paper.
Mean Shift clustering algorithm can obtain non-spherical clustering results and can cluster different types of data distribution well. The outlier detection method based on Mean Shift clustering algorithm can reduce the influence of clustering results on anomaly detection results. However, Mean Shift clustering algorithm still has some shortcomings. Its bandwidth parameters need to be artificially selected, which will have a great subjective impact on the clustering results. The selection of bandwidth parameters has a great influence on the traditional Mean Shift algorithm, and the selected hour converges slowly. Although the selection of large will accelerate the convergence but the clustering effect will not be very good. Therefore, an improved Mean Shift algorithm of electrostatic power is proposed in this paper. By calculating the electrostatic power between any two points, the appropriate bandwidth is selected and the Mean Shift algorithm is optimized. The improved mean shift algorithm is used to automatically determine the number and center of clusters, and then the center of mass after Mean Shift clustering is used as the initial center of K-means clustering algorithm, which makes up for the shortcoming of K-means algorithm that needs to specify the number of clusters in advance.
Therefore, this article puts forward an improved Mean Shift clustering method based on electrostatic force (An improved Mean Shift clustering method-based on electrostatic force, EFMS). The concept of electrostatic force was introduced based on Coulomb’s law, and the K-nearest neighbor thought was used to reduce the computational complexity. Meanwhile, the over-dependence of Mean Shift clustering algorithm on bandwidth was solved. Finally, EFMS is combined with the classical K-means algorithm to obtain the improved K-means anomaly detection algorithm (A K-means detection algorithm based on EFMS, EFMS-Kmeans). Based on the clustering number and clustering center obtained by the EFMS algorithm, the K-means method is used for anomaly detection. The threshold method is adopted to directly use the potential energy gradient for anomaly detection, which not only considers the local characteristics of the data, but also ensures the accuracy of anomaly detection.
The main flow of this method is as follows.
The traditional Mean Shift algorithm performs clustering by calculating the density and Mean Shift vector of sample points. Its core is the Mean Shift vector, and the Mean Shift vector will continuously move to the region with high density. In order to calculate the drift vector more accurately, points in the neighborhood of the center of mass need to set different weights to calculate the drift, that is, to add the kernel function. After improved kernel function, the Mean Shift vector is:

where Sh refers to a spherical field with a radius of h, defined as follows:

 is the Gaussian kernel function. After improved by the kernel function, the mean drift will move towards the region where the probability density increases.
where h is the bandwidth, the kernel function forms of different bandwidth are also different. Aiming at this problem, this paper presents a improved Mean Shift clustering algorithm based on electrostatic force (An improved Mean Shift clustering method-based on electrostatic force, EFMS), the calculation of any two points, the size of the electrostatic force by any two points of electrostatic force to determine the bandwidth of the average size.
In Coulomb’s law, there is an electrostatic force between any two stationary charged objects, and the force is:

where k is the electrostatic force constant, q1 and q2 are the charges of two points respectively, and r is the distance between two points.
In physics, the energy of an object is related to a force, and the electrostatic force between any two charges has a potential energy, which represents the potential of the position of the charge. To simplify the calculation, we abstract the electric field into an ideal electric field with the same electric potential everywhere. Therefore, the simplified electric potential energy is defined as follows:

where the parameter definition is consistent with the electrostatic force. For each sample point, we believe that its charge amount is equal, q1 and q2 are simplified to 1, and r represents the distance between two points. For the sake of simplicity, let’s also take the electrostatic constant k as 1. Then the gravitational potential energy between each sample point i and sample point j can be expressed as:

It can be seen that the magnitude of electric potential energy tends to 0 gradually with the increase of distance, which also conforms to the concept of electric potential energy 0 at infinite distance in physics. For each sample points, we put forward a new concept of potential energy to help choose the size of the bandwidth. We calculate each sample points to the current sample point of center of mass of potential energy and the average size, get the size of the average potential energy as a basis for the bandwidth, the average of the distance between the two sample points of the potential for bandwidth.
Definition: For a sample point i, the potential energy represents the sum of the potential energies of that point and the others and averages them out. Its calculation formula is as follows:

Bandwidth h is obtained according to the average potential energy, which is defined as follows:

Thus, the improved Mean Shift vector is calculated as follows:

(1) EFMS algorithm steps
Step 1: Randomly select one of the unmarked data points as the starting center point;
Step 2: Find all data points in the area with center as the center radius as the radius, and consider these points to belong to the same cluster C. At the same time, the number of data points in the cluster is recorded plus 1;
Step 3: Take center as the center point, calculate the vectors of each element from center to set M, add these vectors and get the vector  ;
;
Step 4:  . So the center is moving in the shift direction, and the distance is
  ;
;
Step 5: Repeat Steps 2–4 until shift is small (i.e., iteration to convergence), remembering the center. Note that points encountered during this iteration should be categorized as cluster C;
Step 6: If the distance between the center of the current cluster C and the center of other existing clusters C2 is less than the threshold when convergence occurs, then C2 and C are merged, and the occurrence times of data points are merged accordingly. Otherwise, take C as the new cluster;
Step 7: Repeat Steps 1–5 until all points are marked as visited;
Step 8: Classification: according to each class and the access frequency of each point, take the class with the highest access frequency as the class belonging to the current point set.
K-means algorithm is a widely used clustering algorithm. K-means algorithm is an unsupervised algorithm focusing on similarity, taking distance as the criterion for similarity measurement between data objects, that is, the smaller the distance between data objects is, the higher their similarity is, and the more likely they are to be in the same class cluster.
In the traditional K-means algorithm, since the initial “cluster center” points are randomly selected, the final cluster division is related to the randomly selected “cluster center,” that is to say, it may lead to the division of various K clusters. This is because the K-means algorithm converges to the local minimum rather than the global minimum. In order to improve this shortcoming, we will use the clustering center of mass obtained by EFMS algorithm as the initial clustering center of K-means, and the value of K is obtained by EFMS algorithm. Thus, the improved exception detection algorithm EFMS-Kmeans is obtained. The specific process of the algorithm is shown in Fig. 3.

Figure 3: The flowchart of EFMS-Kmeans algorithm
After the EFMS-Kmeans algorithm gets the clustering result, in order to verify the rationality of the clustering result, this paper USES the elbow method SSE (cluster error variance) and contour coefficient to test the K value.
(1) The elbow method (sum of the squared errors, SSE):
SSE uses error variance sum to judge and select the appropriate k value. In theory, the smaller the SSE value is, the better the clustering effect will be. Through data testing, the SSE value will gradually approach a minimum value. Its calculation formula is as follows:

where, Ci is the ith cluster, p is the sample point in Ci, mi is the center of mass of Ci (the mean value of all samples in Ci), and  is the clustering error of all samples, representing the clustering effect.
(2) Silhouette Coefficient:
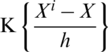
EFMS-Kmeans was used to divide the data to be classified into k clusters. For every vector in the cluster. Their contour coefficients are calculated separately. Its specific definition is as follows:
Calculate the average distance ai between sample i and other sample points in the same cluster. The smaller the ai, the more sample i should be clustered to the cluster. ai is called the incluster dissimilarity of sample i. The ai mean of all samples in cluster C is called cluster dissimilarity of cluster C.
The average distance bij of all samples from sample i to other cluster Cj is calculated, which is called the dissimilarity degree between sample i and cluster Cj is defined as the cluster dissimilarity of sample i:  , the larger bi is, the less sample i belongs to other clusters.
The contour coefficient of sample i was defined according to the intra-cluster dissimilarity ai and inter-cluster dissimilarity bi, and the calculation formula was as follows:

The contour coefficients range from [ −1, 1]. The larger the value is, the more reasonable the clustering result will be. Si is close to 1, which indicates that the clustering of sample i is reasonable; Si is close to −1, indicating that sample i should be classified into another cluster. If Si is approximately 0, then sample i is on the boundary of the two clusters.
After confirming the accuracy of k value by elbow method SSE (cluster error variance) and silhouette coefficient, K-means is used for anomaly detection. The steps are as follows:
(3) Improved EFMS-Kmeans algorithm steps:
Step 1: pass in the EFMS algorithm clustering cluster number K, and set K clustering centers of K-means algorithm according to the EFMS clustering center;
Step 2: repeat the following process until the cluster center is no longer changed;
1. calculate the distance between each sample and each clustering center point, divide the sample to the nearest center point;
2. calculate the mean of all sample features divided into each category, and take the mean as the new clustering center of each class;
Step 3: calculate the distance between each point in the cluster and the center of the cluster based on the result of clustering;
Step 4: compare the distance with the threshold. If it is greater than the threshold, it is considered abnormal; otherwise, it is normal.
The flow of the algorithm is shown in Algorithm 2 and Fig. 2.
3.3 The Traffic Prediction-Clustering Cascade Anomaly Detection Method
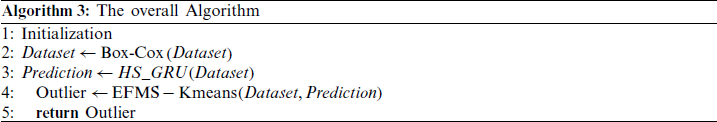
This paper proposes an anomaly detection method based on the HS_GRU algorithm and the EFMS-Kmeans (Automatically specify the clustering center) algorithm. First, the paper proposes an improved GRU HS_GRU model improved for the problems existing in the traditional model. We combine the STL decomposition algorithm after Box-Cox transformation and highway GRU neural network to predict the network traffic data. The STL decomposition algorithm extracts the periodic component of the network traffic data and then the remaining component is input into the highway GRU neural network model for prediction. Then aiming at the problem that the traditional anomaly detection method has a poor detection effect on the clustering of a single traffic value in network-oriented time series data, this paper uses a traffic prediction-clustering cascade anomaly detection method to combine the result of traffic prediction with the original traffic value as an input sample. Given the shortcomings of the traditional clustering algorithm, an improved EFMS-Kmeans algorithm is proposed. The idea of the combination of the density- based and distance-based clustering algorithms are mainly proposed. The anomaly detection method this paper proposed not only considers the local characteristics of the data but also ensures the accuracy of the anomaly detection.
The brief flow of the algorithm is shown in Algorithm 3.
:
This chapter proves the effectiveness of the improved traffic anomaly detection algorithm based on the HS_GRU and EFMS-Kmeans by experiments. In this paper, the python language is used to carry out the simulation experiment on the network traffic prediction algorithm, and the running environment is  . The results are described in detail below.
4.1 Improved GRU Algorithm HS_GRU
We use two real traffic dataset to compare the predictive performance of the HS_GRU algorithm. One is the aggregated traffic (in bits) in the United Kingdom academic network backbone from an ISP. The data is shown in Fig. 4. Another is Internet traffic data (in bits) from a private ISP with centers in 11 European cities. The data is shown in Fig. 5. Both datasets are available for download from the benchmark website.

Figure 4: UK backbone network traffic prediction results
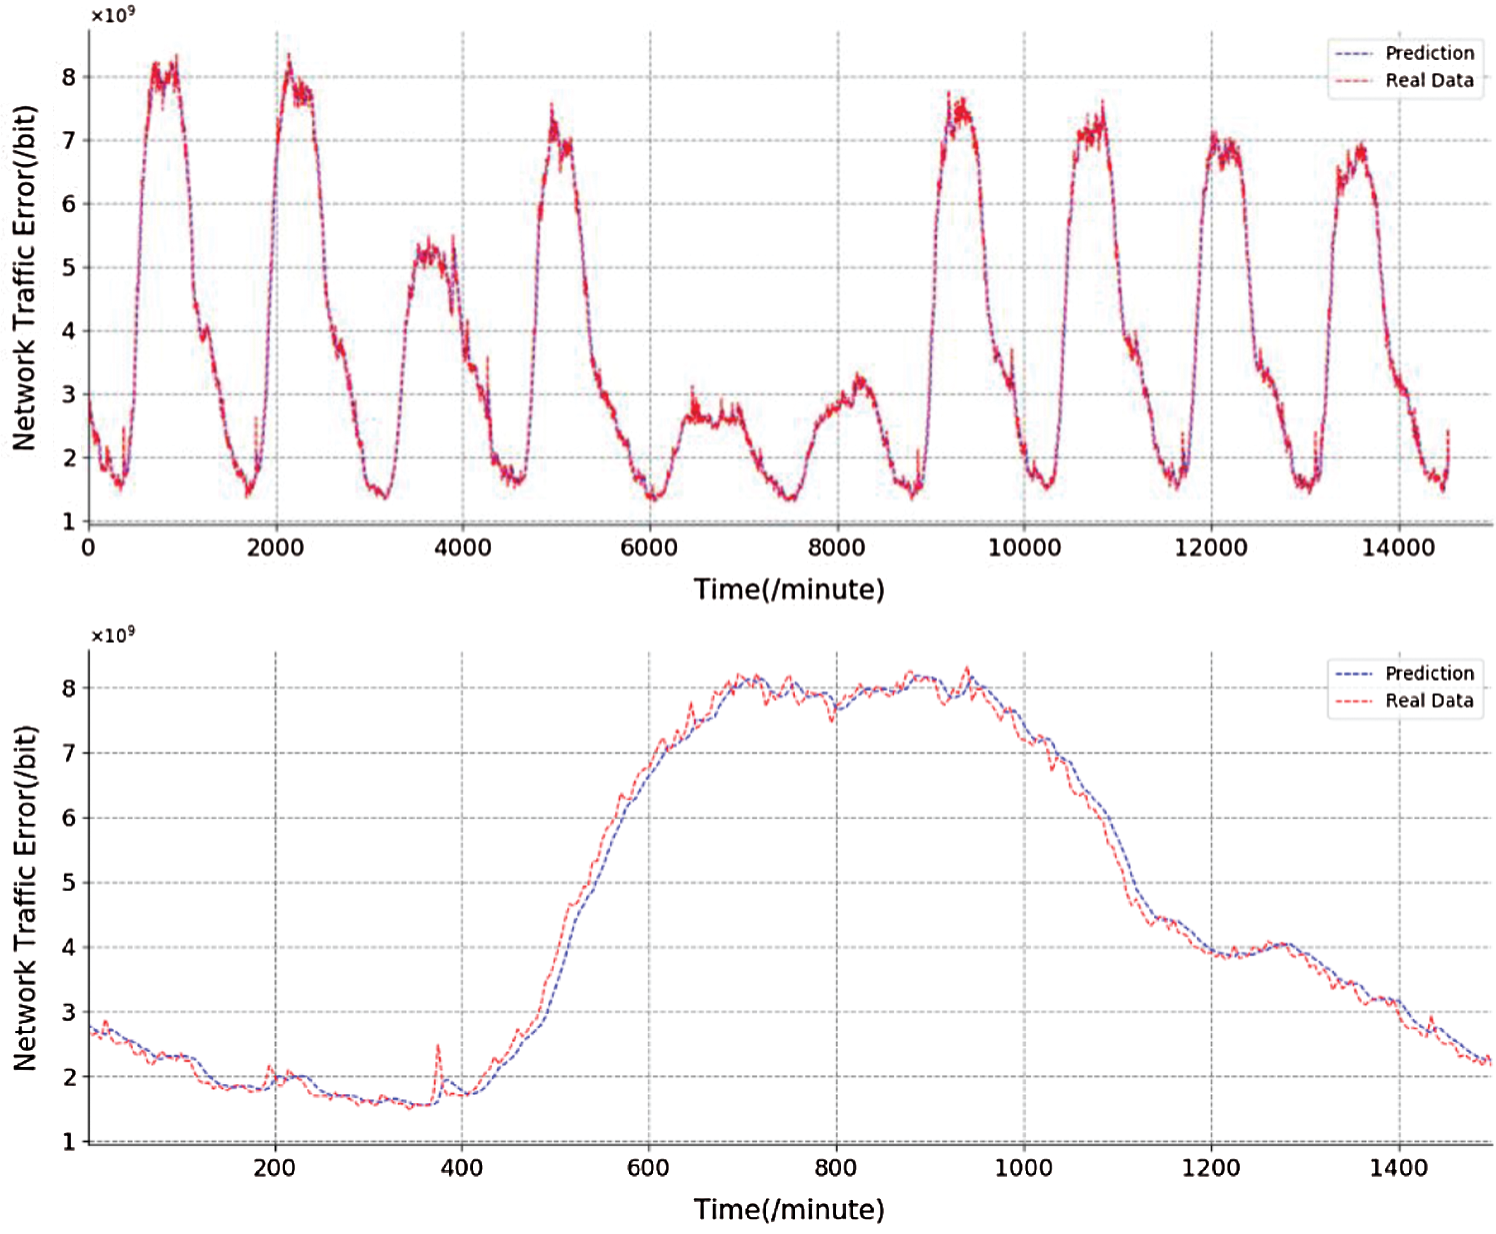
Figure 5: Network traffic prediction results for 11 European cities
In order to make the subsequent anomaly detection results more obvious and accurate, this paper centralized the original data set to form data set Traffic_UK_pre and Traffic_EU_pre. The first to use on the network traffic prediction StatsModels tool for the network traffic data collection cycle component extraction, and then the remaining components processing for monitoring sequence, input to the improved neural network model, the output of the corresponding predicted value, and cycle component addition, restore to the network traffic prediction.
Root-mean-square error and mean absolute error are commonly used to measure the deviation between the predicted value of parameters and the true value of parameters, which can well reflect the prediction accuracy of the prediction model.

where m represents the number of all predicted values, yi represents the actual value of parameters, and  represents the predicted value given by the model.
The mean absolute error is also often referred to as the mean absolute deviation, which is the average of the absolute value of the deviation between the predicted value and the true value of all parameters.

The smaller the root-mean-square error and mean absolute error, the more accurate the predicted value is, and the better the trained neural network fits the actual model.
4.1.3 Comparison of Experimental Results and Performance
In order to compare and evaluate the effect and performance of the algorithm model HS_GRU designed in this paper, we selected the clockwork RNN [21], basic GRU, basic LSTM and ARIMA algorithm for analysis. Adam gradient de-scent algorithm was used to update its parameters. The following figure shows the prediction results of HS_GRU on two data sets (Traffic_UK_pre and Traffic_EU_pre), the below is the detailed display of a part of prediction results.
In order to better demonstrate the prediction effect of each model, we calculated the evaluation indexes RMSE and MAE of each model on two data sets, and showed them in Tab. 1 and Figs. 6 and 7.
Table 1: Comparison of network traffic prediction model performance
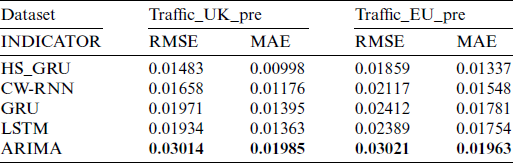
From the above Tab. 1, we can see that the HS_GRU network traffic prediction model proposed in this paper performs better than the other four comparison models in RMSE and MAE.
Specifically, from the perspective of RMSE evaluation indicators: in dataset Traffic_UK_pre, the RMSE indicator of the HS_GRU based traffic prediction model proposed in this paper is better than the CW-RNN model 11.8%, better than the GRU model 32.91%, better than the LSTM model 30.41%. In dataset Traffic_EU_pre, the RMSE index is better than the CW-RNN model 13.88%, better than the GRU model 29.75%, better than the LSTM model 28.51% and better than the ARIMA model 62.51%.
From the perspective of the MAE evaluation index, in dataset Traffic_UK_pre, the MAE index of the flow prediction model based on HS_GRU proposed in this paper is better than that of the CW-RNN model by 17.84%, better than the GRU model 39.78%, better than the LSTM model 36.57% and better than the ARIMA model 98.9%. In dataset Traffic_EU_pre, MAE is better than the CW-RNN model 15.78%, better than the GRU model 33.21%, better than the LSTM model 31.19% and better than the ARIMA model 46.82%. Experiments show that the HS_GRU based traffic prediction model proposed in this paper has a good prediction effect on network traffic data.
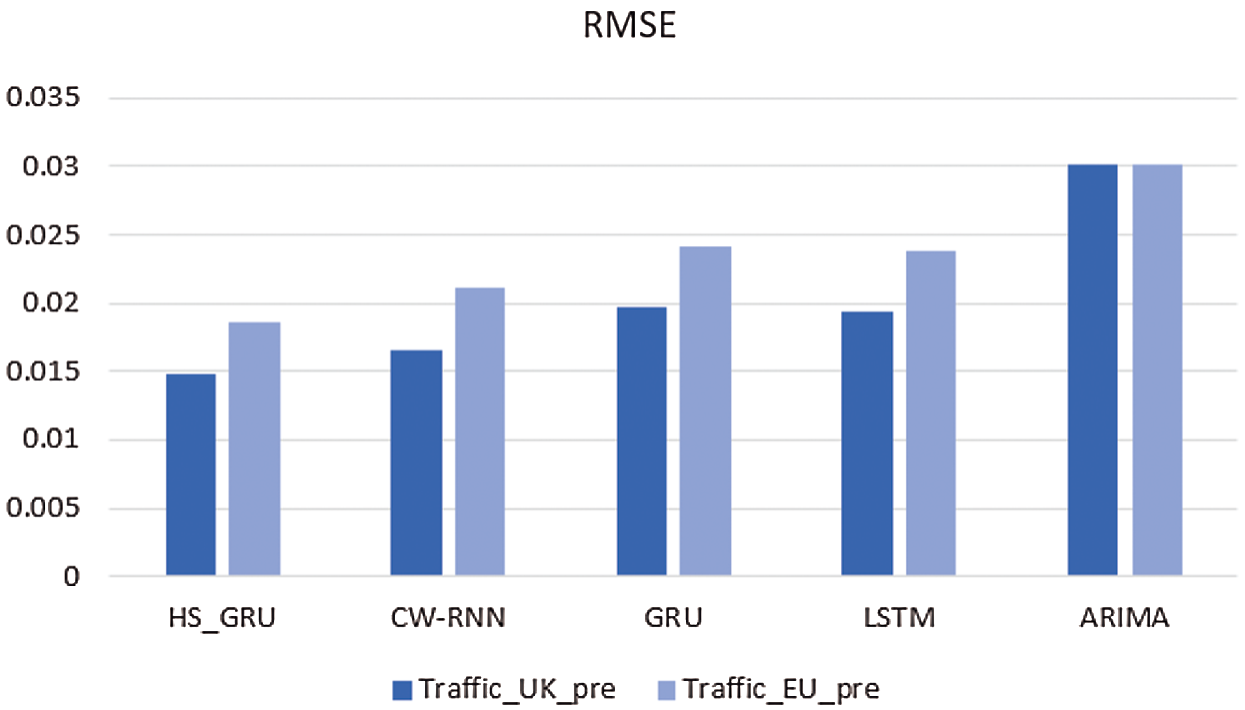
Figure 6: Comparison of RMSE of each flow prediction model
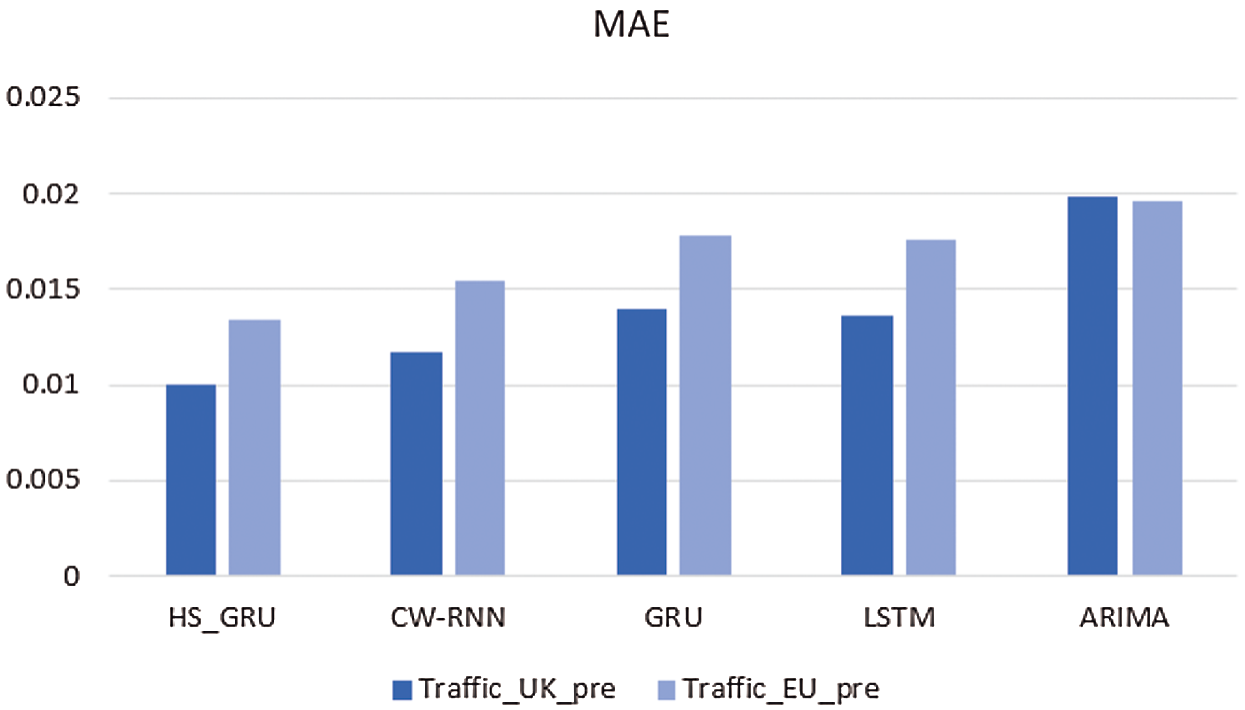
Figure 7: Comparison of MAE of each flow prediction model
4.2 EFMS-Kmeans Algorithm Comparison with Other Clustering Methods
4.2.1 EFMS-Kmeans Algorithm Accuracy Analysis
In order to verify the effectiveness of EFMS-Kmeans method, we used this method to perform clustering and anomaly detection on Traffic_UK and Traffic_EU data sets. The following are pictures of the experimental results.
The figure above shows the number of clusters in Traffic_UK’s traffic data set and the location of the cluster center, which is where the EFMS method makes sense. The method automatically determines the number of clusters and the cluster center of any data set, which can effectively avoid the error caused by manually specifying the number of clusters.
When EFMS algorithm is used to confirm the number of clustering, the SSE and contour coefficient algorithms built in the method will evaluate the clustering effect. According to the evaluation results, the optimal number of clustering is determined. Below, we choose the evaluation effect of SSE as an example.
Obviously, when k value is 5, the curvature is the highest, so for the clustering of this data set, the optimal clustering number should be 5. This is consistent with the clustering number of EFMS algorithm, which shows the effectiveness of EFMS algorithm.
In Fig. 8, Traffic_UK data set is automatically divided into 5 clusters. The Fig. 9 proves the correctness of the number of clusters by SSE algorithm. According to the number of clusters already divided and the center of the cluster, anomaly detection is carried out. In Fig. 10, the black points are the abnormal points.
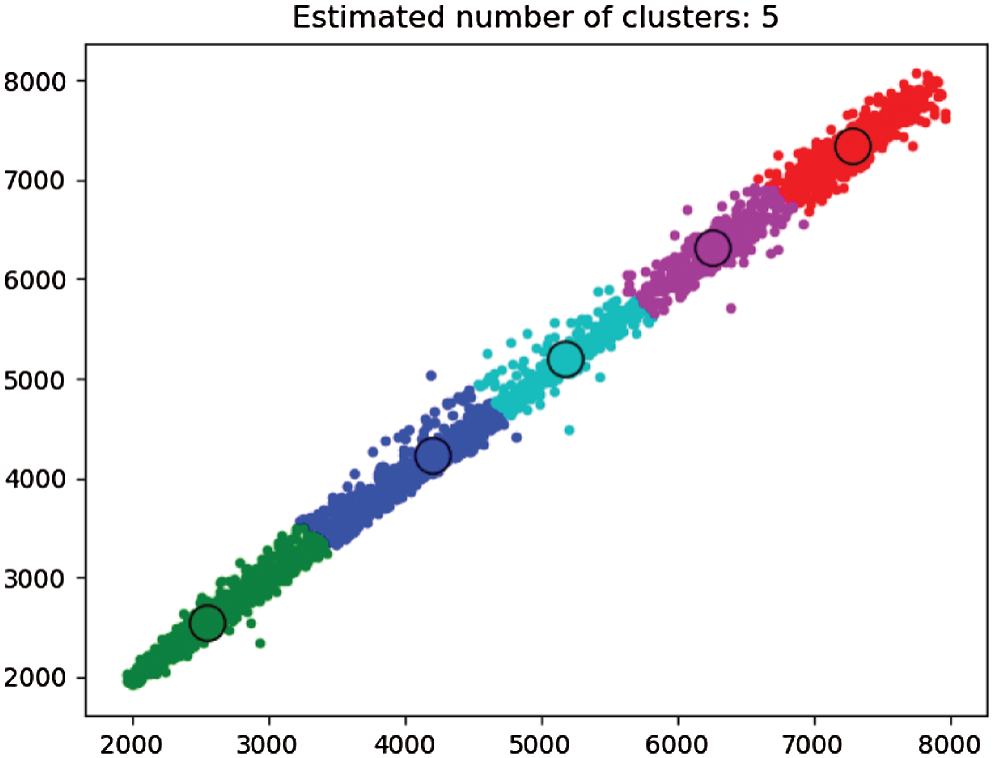
Figure 8: EFMS intelligence calculates the number of clusters of Traffic_UK
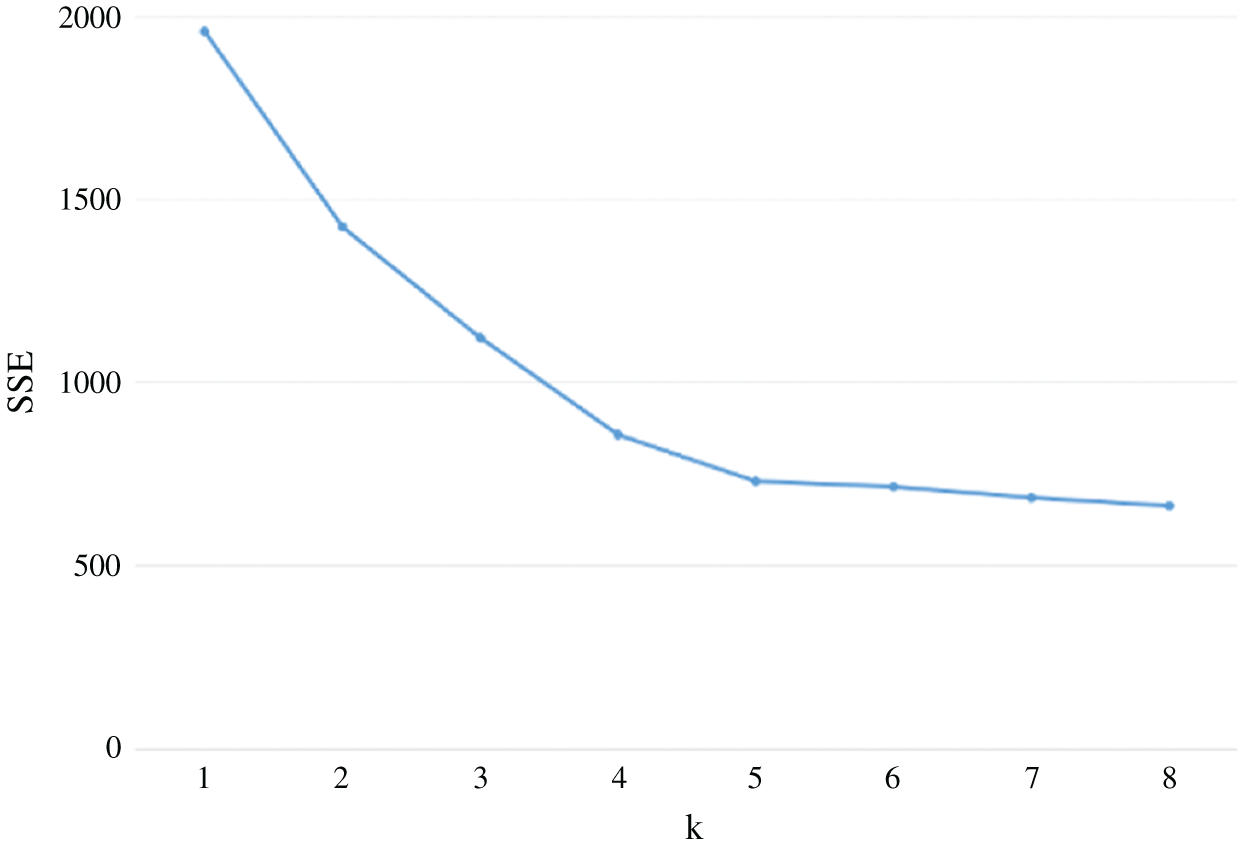
Figure 9: SSE of Traffic_UK
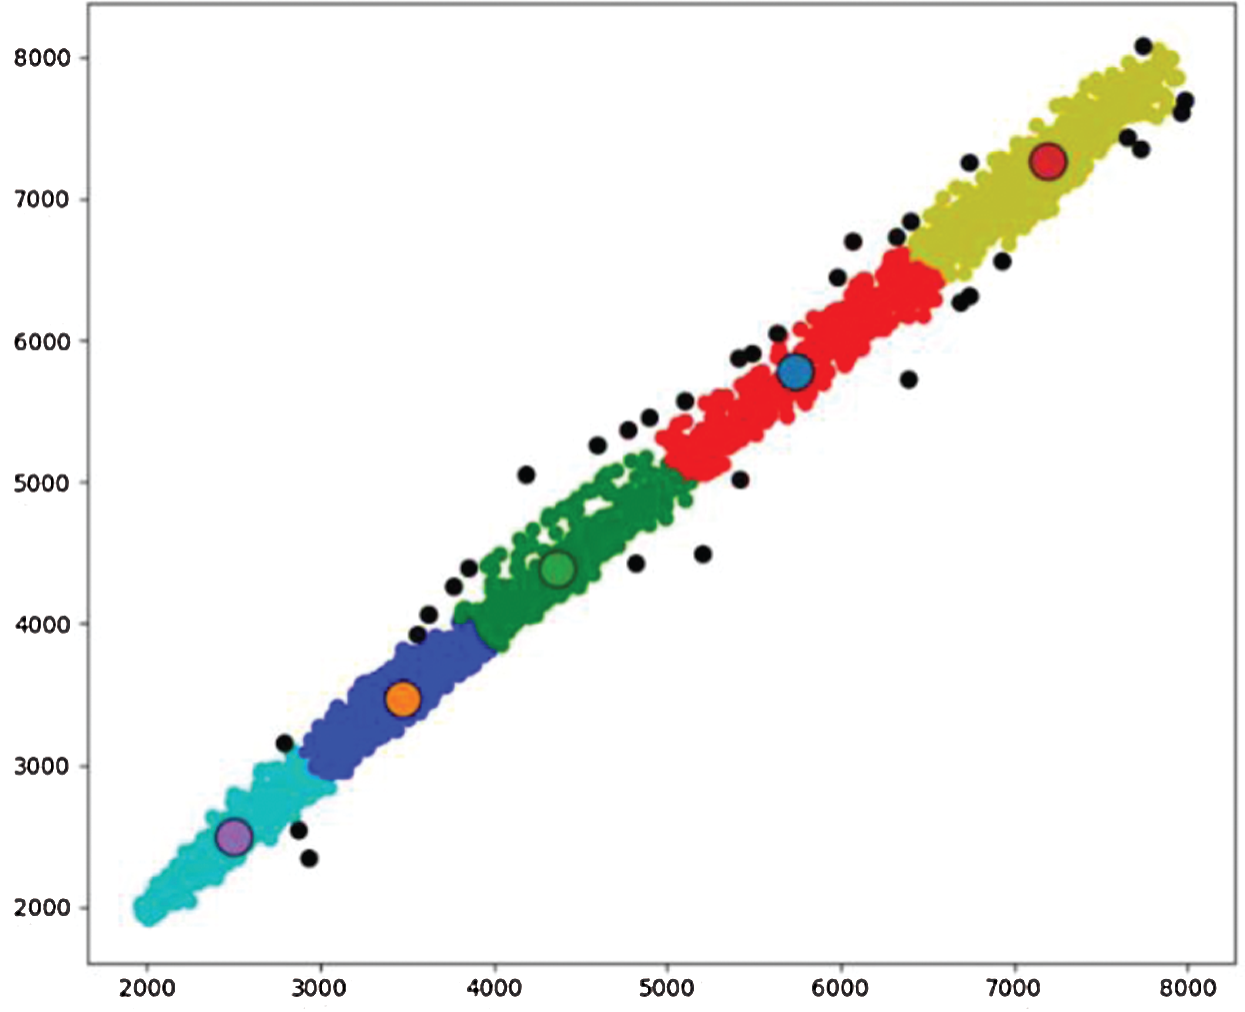
Figure 10: EFMS-Kmeans identifies Traffic_UK’s abnormal points (the black dots are the outliers)
The figure above shows the number of clusters in Traffic_EU’s traffic data set and the location of the cluster center, which is where the EFMS method makes sense. The method automatically determines the number of clusters and the cluster center of any data set, which can effectively avoid the error caused by manually specifying the number of clusters.
For the clustering results of this data set, the evaluation effect of SSE is as follows:
Obviously, when k value is 4, the curvature is the highest, so for the clustering of this data set, the optimal clustering number should be 4. This is consistent with the clustering number of EFMS algorithm, which shows the effectiveness of EFMS algorithm.
In Fig. 11, Traffic_EU data set is automatically divided into 4 clusters. The Fig. 12 proves the correctness of the number of clusters by SSE algorithm. According to the number of clusters already divided and the center of the cluster, anomaly detection is carried out. In Fig. 13, the black points are the abnormal points.
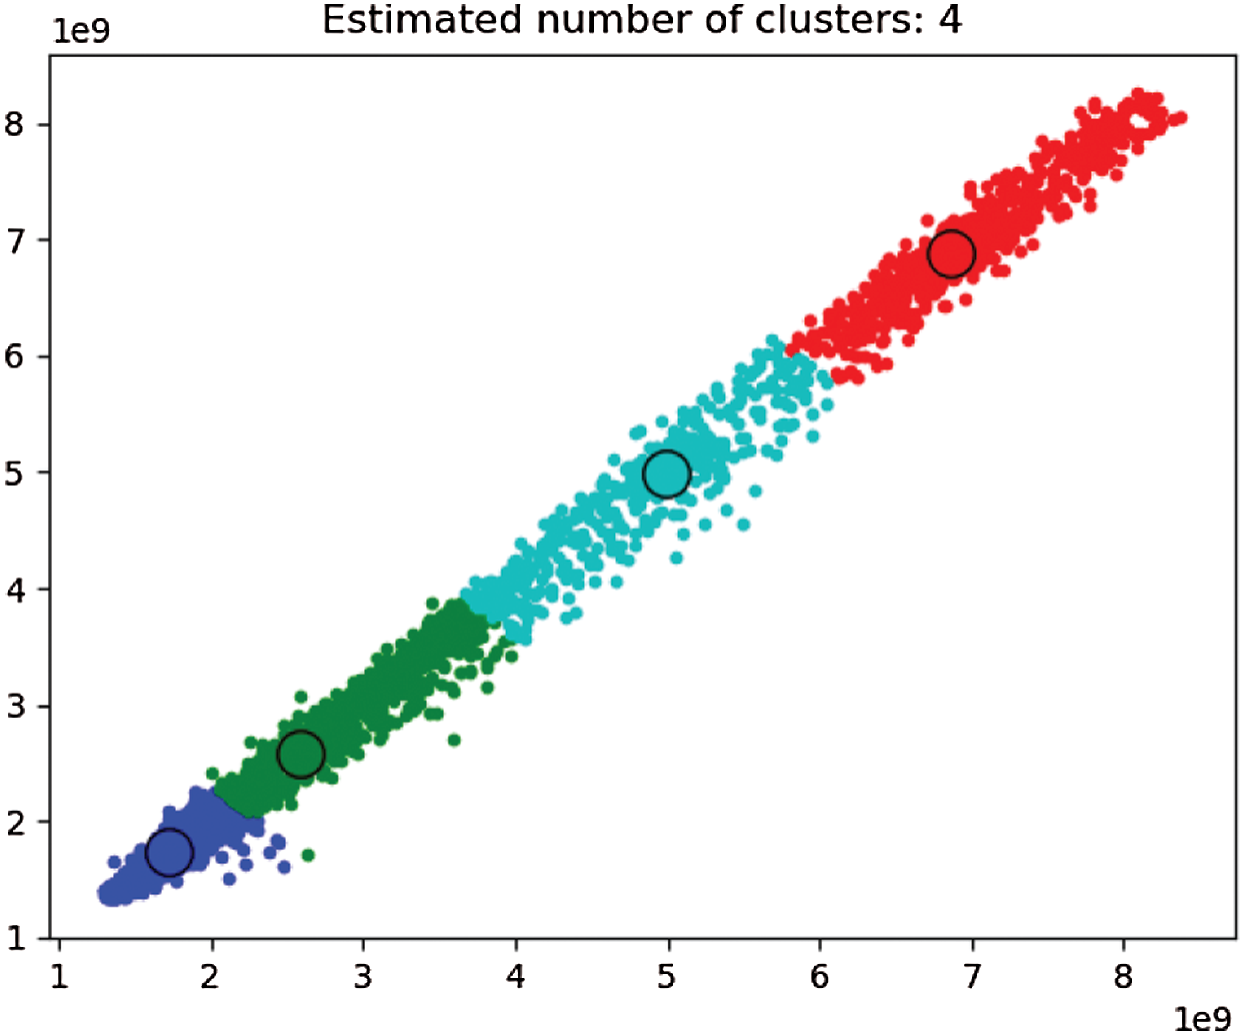
Figure 11: EFMS intelligence calculates the number of clusters of Traffic_EU

Figure 12: SSE of Traffic_EU
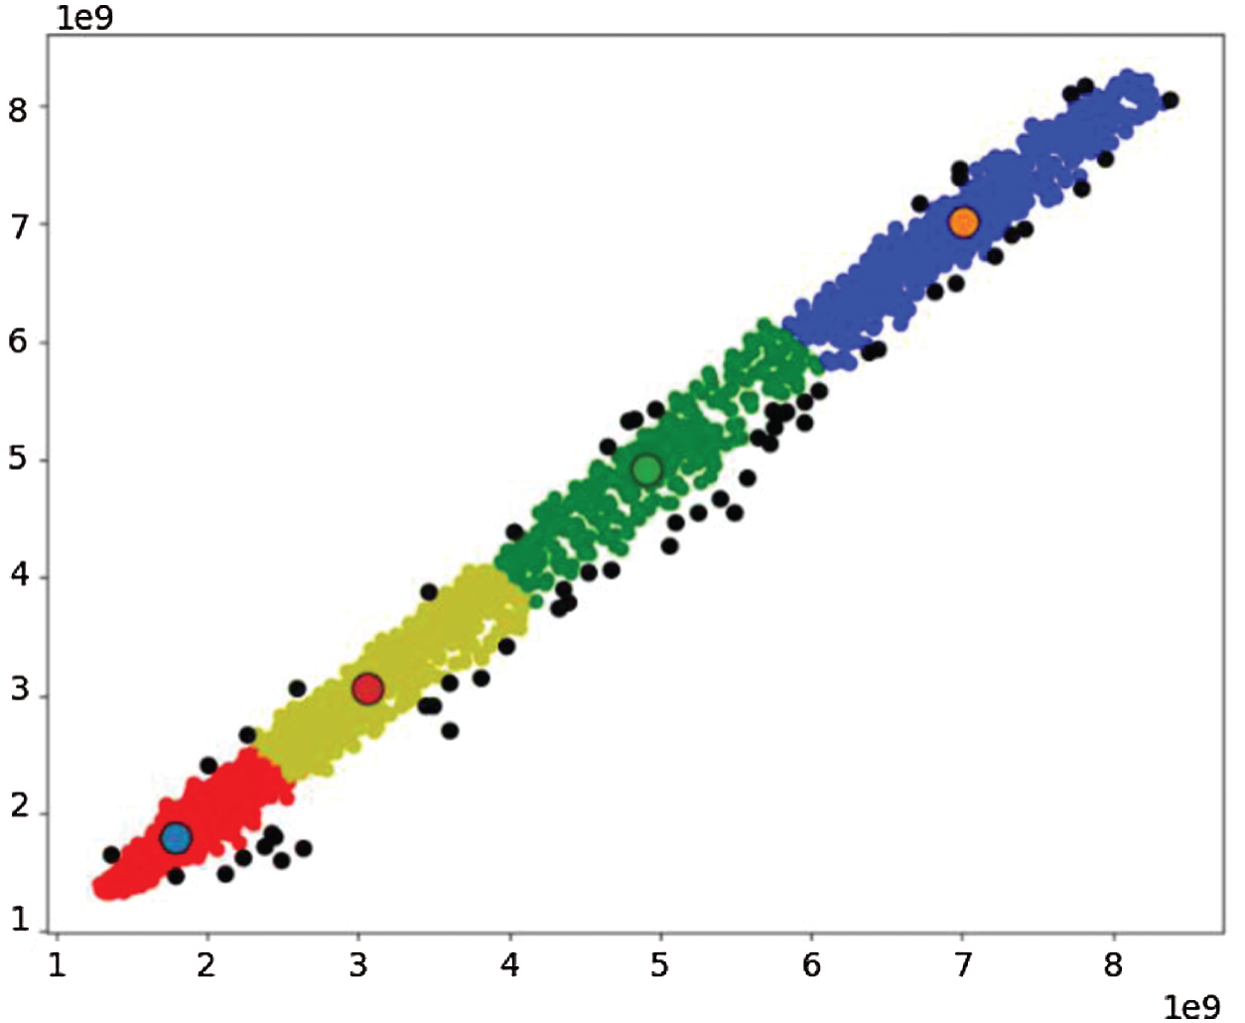
Figure 13: EFMS-Kmeans identifies Traffic_EU’s abnormal points (The black dots are the outliers)
As can be seen from the figure above, EFMS-Kmeans has a good clustering and anomaly detection effect. It can get rid of the disadvantages of manual calculation of classification number and category center, and it can effectively and accurately identify the number and cluster center of clusters, thus greatly improving the accuracy of anomaly detection.
Firstly, we compare the EFMS-Kmeans algorithm with other clustering algorithms to prove the feasibility and superiority of this method. The specific data sets used are as follows:
The CIC Dataset, which is from the Canadian Network Security Dataset Institute, used the 2017 dataset provided by the Institute in this paper.
The KDD99 Dataset, which was a network environment simulating the USAF LAN, collected network connection and system audit data for 9 weeks, simulating various user types, various network traffic and attack methods.
The Honeypot dataset is a hacker attack dataset collected by HoneyNet, which can well reflect the hacker attack pattern. The dataset includes 11 months of Snort alarm data from April 2000–February 2001, with about 60–3000 Snort alarm records per month.
The Sigfox IoT dataset, the Sigfox IoT Dataset is a sample dataset with the communication activity recorded from the real Internet-of-Things (IoT) network deployed by Sigfox. It can be used for anomaly detection in communication networks and other related tasks.
The WIDE data set, which is derived from the traffic data warehouse project maintained by MAWI Working Group. In this experiment, we used the traffic data from 2018 to 2019.
These data sets are publicly available on the network. These data sets are all from real networks, and the data collection period is different, almost including all kinds of exception types in the network, which provides good data support for testing our algorithm.
Three popular metrics were used to evaluate the performance of the anomaly detection method, including the recall rate (Re), the accuracy value (Pr), and the F1 value. Specifically, these indicators range from 0 to 1, and the higher the score, the more accurate the detection results.
4.2.4 Compared Methods and Results
Several existing clustering methods for anomaly detection are compared with our method. Specifically, traditional methods, including K-means, K-MEDOIDS, CLARANS, OPTICS, and DBSCAN are used for comparison.
In the comparison experiment, we used the above five methods and the algorithm proposed in this paper to cluster the same data, and we found five different data sets. The specific process is as follows: first, the data set is clustered with the original method; then, according to the clustering results, the traditional K-means method is passed in for anomaly detection by using the distance threshold, calculating the distance from each point to the clustering center, and setting the threshold to detect the anomaly points. The purpose of comparing the original K-means algorithm is to test the clustering effect of manually specifying the clustering center, and to prove the effectiveness of our method based on the comparison. The other four clustering methods cover the improved K-means method, density-based clustering method and hierarchical clustering method, and compare different clustering methods to prove the superiority of the method in this paper. In order to exclude the possibility of experiment, we conducted 3 tests for each method with the same data. The specific results are as follows:
As can be seen from the below Tab. 2, among many clustering methods, EFMS-Kmeans has excellent advantages in recall rate, accuracy and F1. In order to show the comparison of methods more intuitively, we plotted the Re value, Pr value and F1 value of different methods on each data set.
Table 2: The Anomaly detection results of the compared methods on the experimental datasets
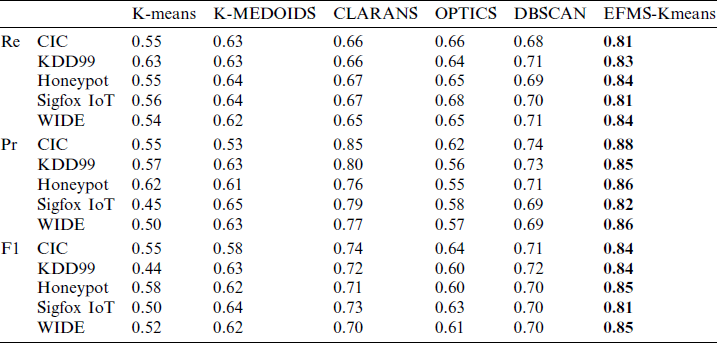
Fig. 14a is a comparison of Re values of different algorithms on the CIC data set. After data analysis, Re value of EFMS-Kmeans algorithm is higher than that of any other method. Compared with K-means algorithm, Re value is increased by 26%. Compared with K-MEDOIDS algorithm, Re value is increased by 18%. Compared with CLARANS algorithm, Re value is increased by 15%. Compared with OPTICS algorithm, Re value is increased by 15%. Compared with DBSCAN algorithm, Re value is increased by 13%.
Fig. 14b is a comparison of Pr values of different algorithms on the CIC data set. Compared with K-means algorithm, Pr value is increased by 33%. Compared with K-MEDOIDS algorithm, Pr value is increased by 35%. Compared with CLARANS algorithm, Pr value is increased by 3%. Compared with OPTICS algorithm, Pr value is increased by 26%. Compared with DBSCAN algorithm, Pr value is increased by 14%. After data analysis, Pr value of EFMS-Kmeans algorithm is higher than that of any other method.
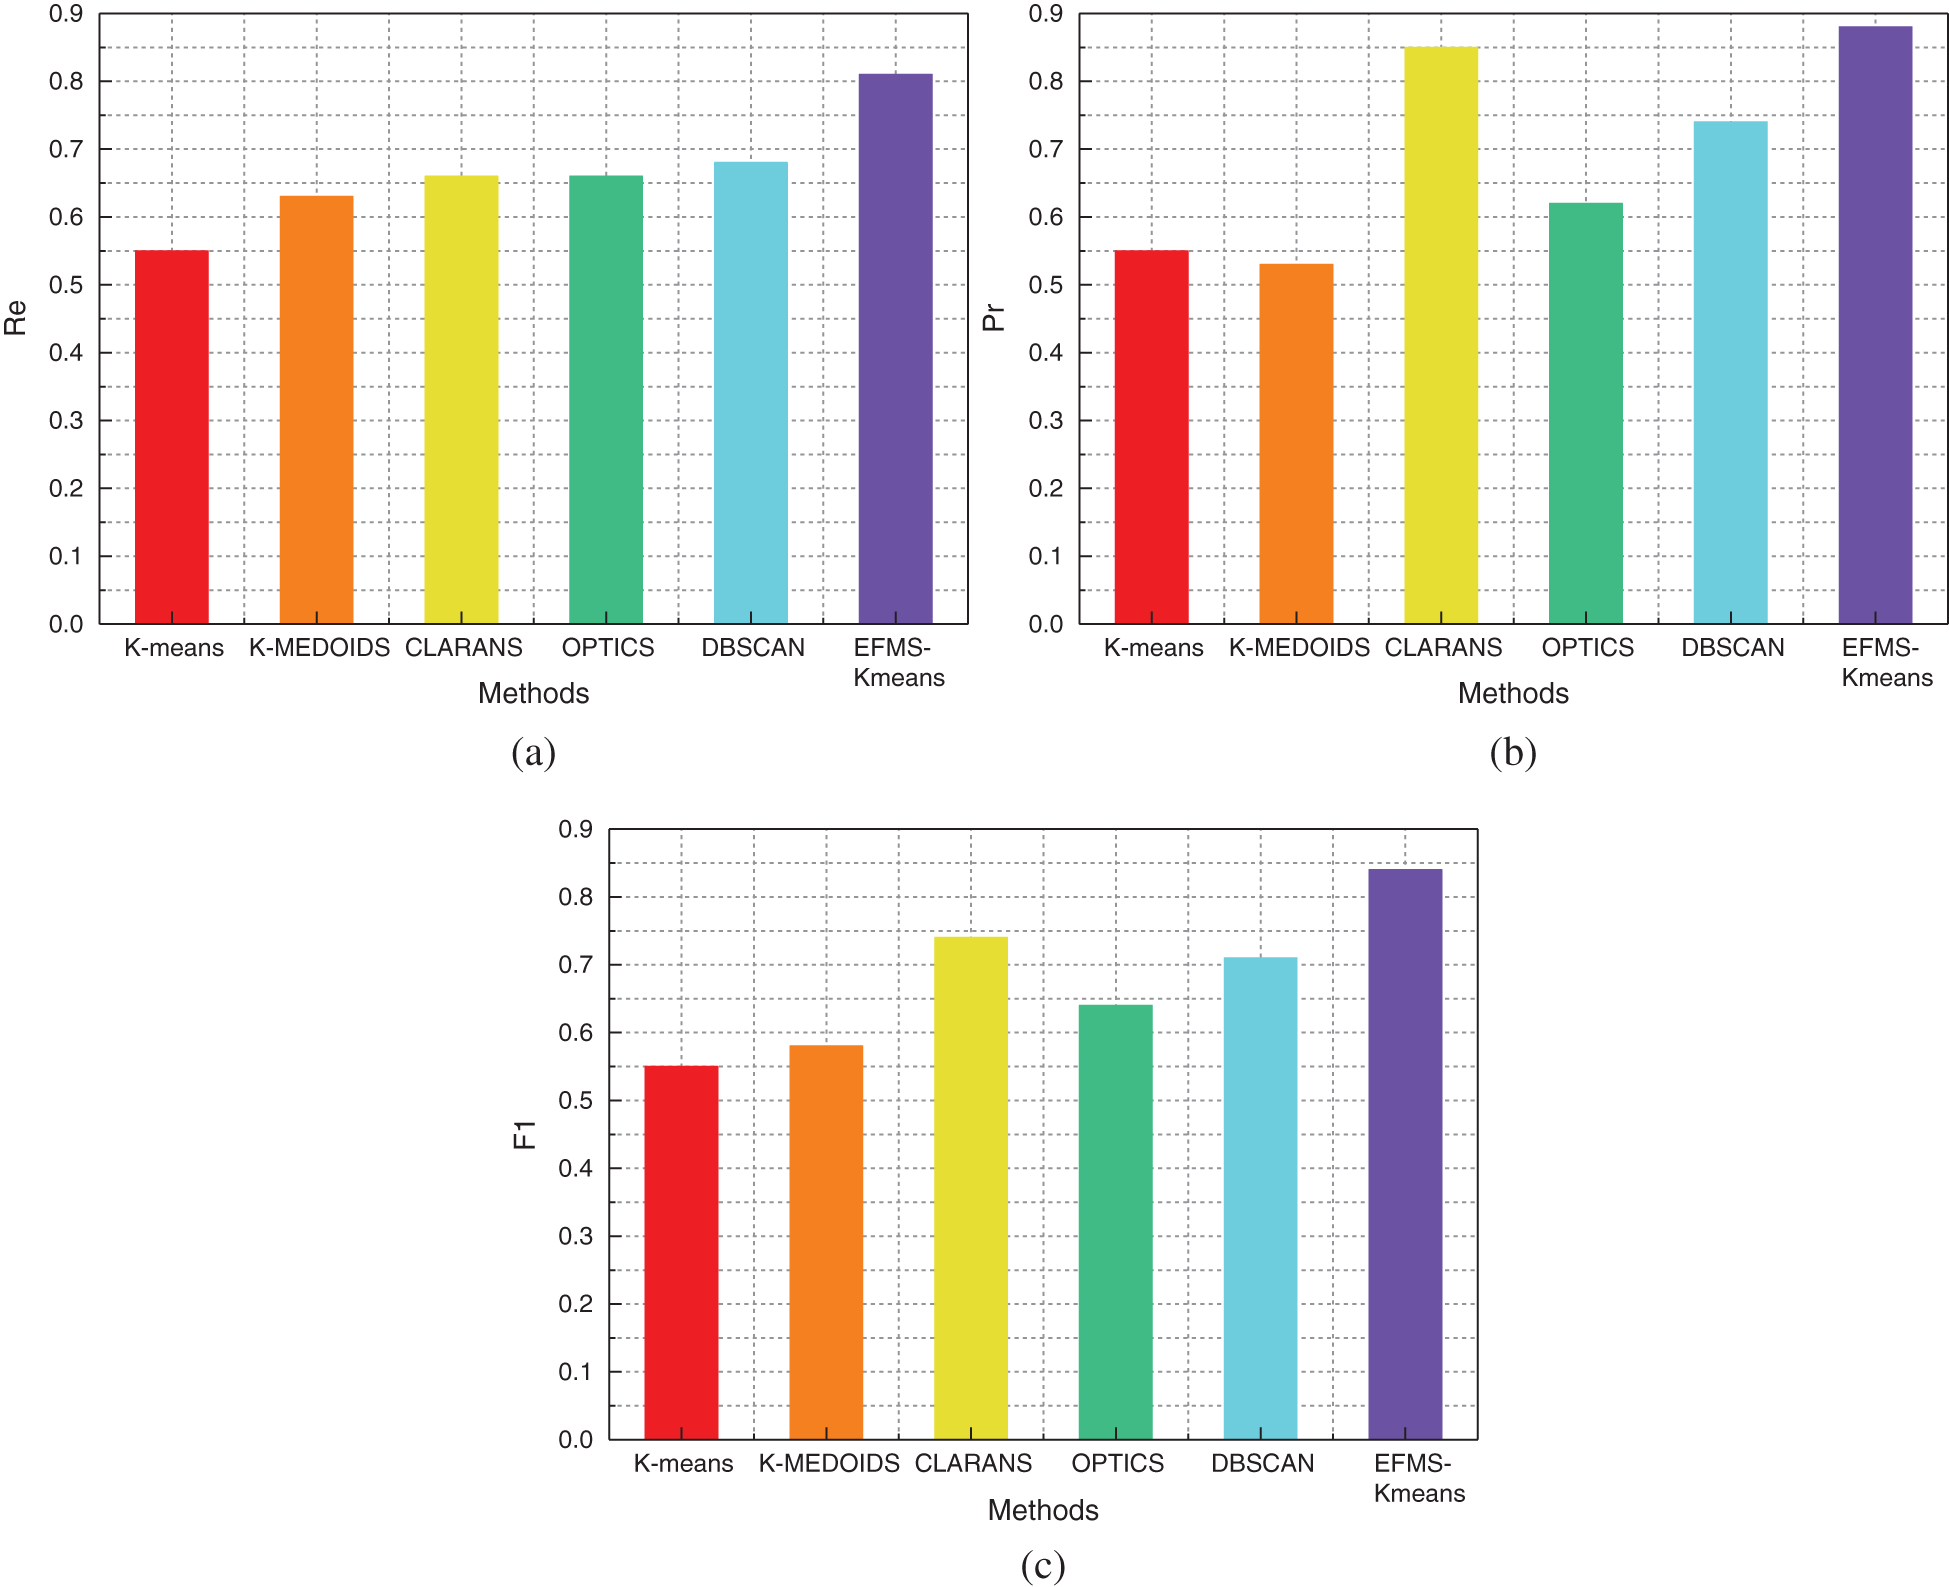
Figure 14: Re(a), Pr(b), F1(c) of different methods on CIC dataset
Fig. 14c is a comparison of F1 values of different algorithms on the CIC data set. Compared with K-means algorithm, F1 value is increased by 29%. Compared with K-MEDOIDS algorithm, F1 value is increased by 26%. Compared with CLARANS algorithm, F1 value is increased by 10%. Compared with OPTICS algorithm, F1 value is increased by 20%. Compared with DBSCAN algorithm, F1 value is increased by 13%. After data analysis, F1 value of EFMS-Kmeans algorithm is higher than that of any other method.
Fig. 15a is a comparison of Re values of different algorithms on the KDD99 data set. Compared with K-means algorithm, Re value is increased by 20%. Compared with K-MEDOIDS algorithm, Re value is increased by 20%. Compared with CLARANS algorithm, Re value is increased by 17%. Compared with OPTICS algorithm, Re value is increased by 19%. Compared with DBSCAN algorithm, Re value is increased by 12%. After data analysis, Re value of EFMS-Kmeans algorithm is higher than that of any other method.
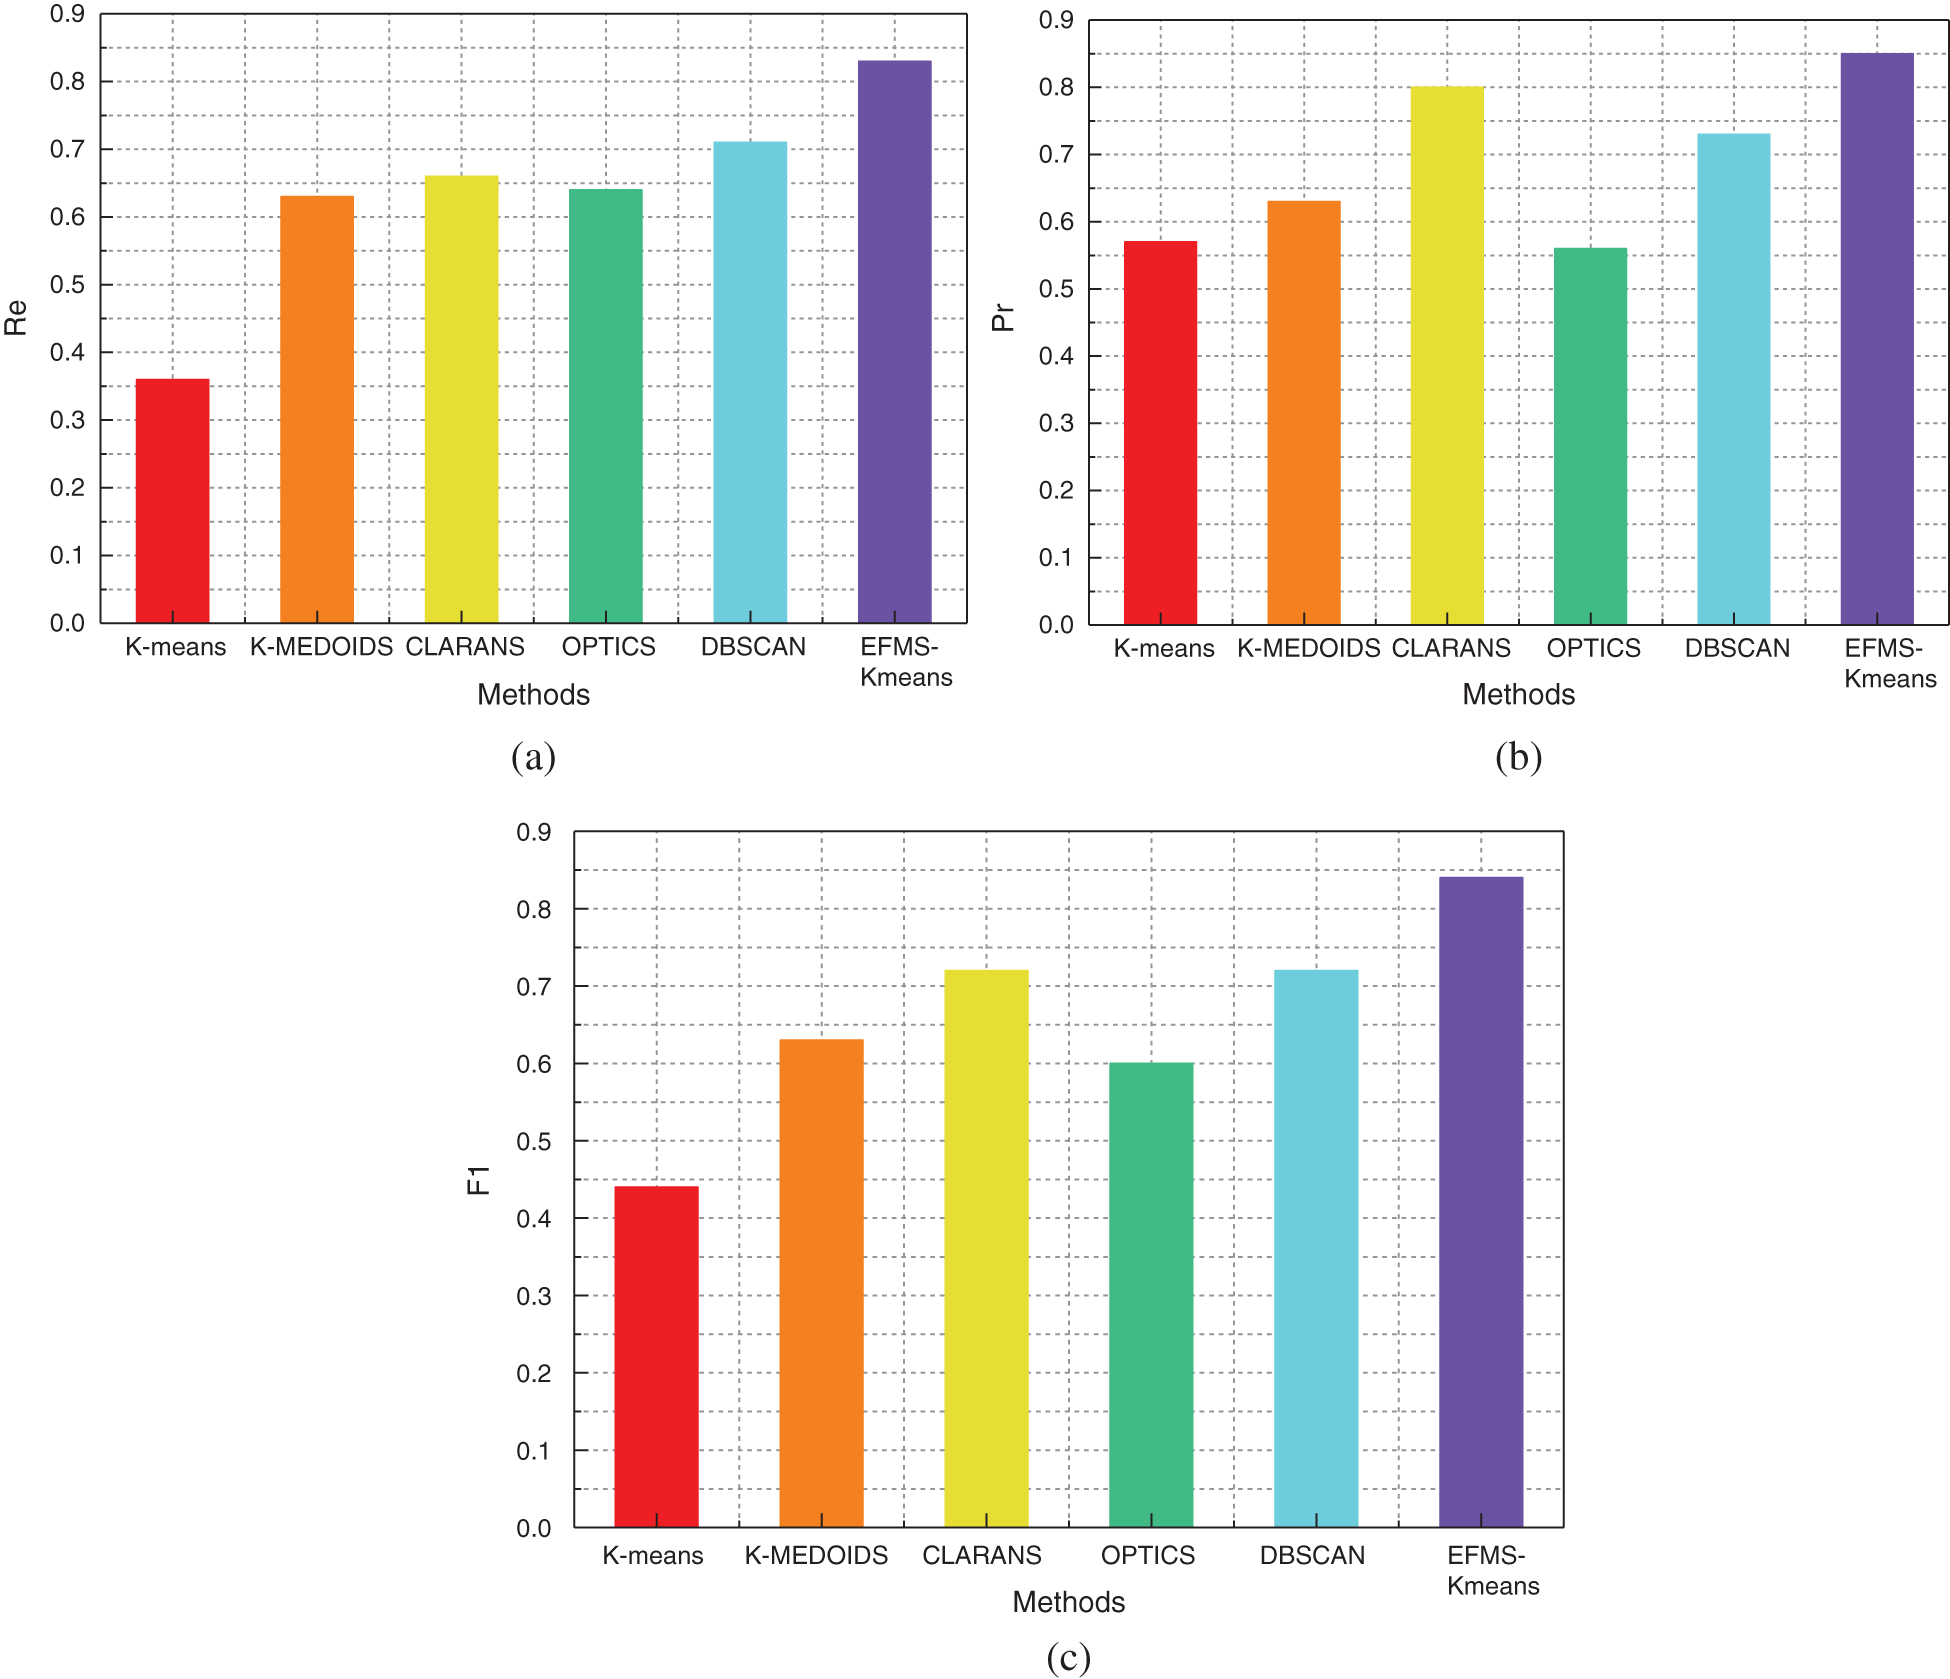
Figure 15: Re(a), Pr(b), F1(c) of different methods on KDD99 dataset
Fig. 15b is a comparison of Pr values of different algorithms on the KDD99 data set. Compared with K-means algorithm, Pr value is increased by 28%. Compared with K-MEDOIDS algorithm, Pr value is increased by 22%. Compared with CLARANS algorithm, Pr value is increased by 5%. Compared with OPTICS algorithm, Pr value is increased by 29%. Compared with DBSCAN algorithm, Pr value is increased by 12%. After data analysis, Pr value of EFMS-Kmeans algorithm is higher than that of any other method.
Fig. 15c is a comparison of F1 values of different algorithms on the KDD99 data set. Compared with K-means algorithm, F1 value is increased by 40%. Compared with K-MEDOIDS algorithm, F1 value is increased by 21%. Compared with CLARANS algorithm, F1 value is increased by 12%. Compared with OPTICS algorithm, F1 value is increased by 24%. Compared with DBSCAN algorithm, F1 value is increased by 12%. After data analysis, F1 value of EFMS-Kmeans algorithm is higher than that of any other method.
Fig. 16a is a comparison of Re values of different algorithms on the Honeypot data set. Compared with K-means algorithm, Re value is increased by 29%. Compared with K-MEDOIDS algorithm, Re value is increased by 20%. Compared with CLARANS algorithm, Re value is increased by 17%. Compared with OPTICS algorithm, Re value is increased by 19%. Compared with DBSCAN algorithm, Re value is increased by 15%. After data analysis, Re value of EFMS-Kmeans algorithm is higher than that of any other method.
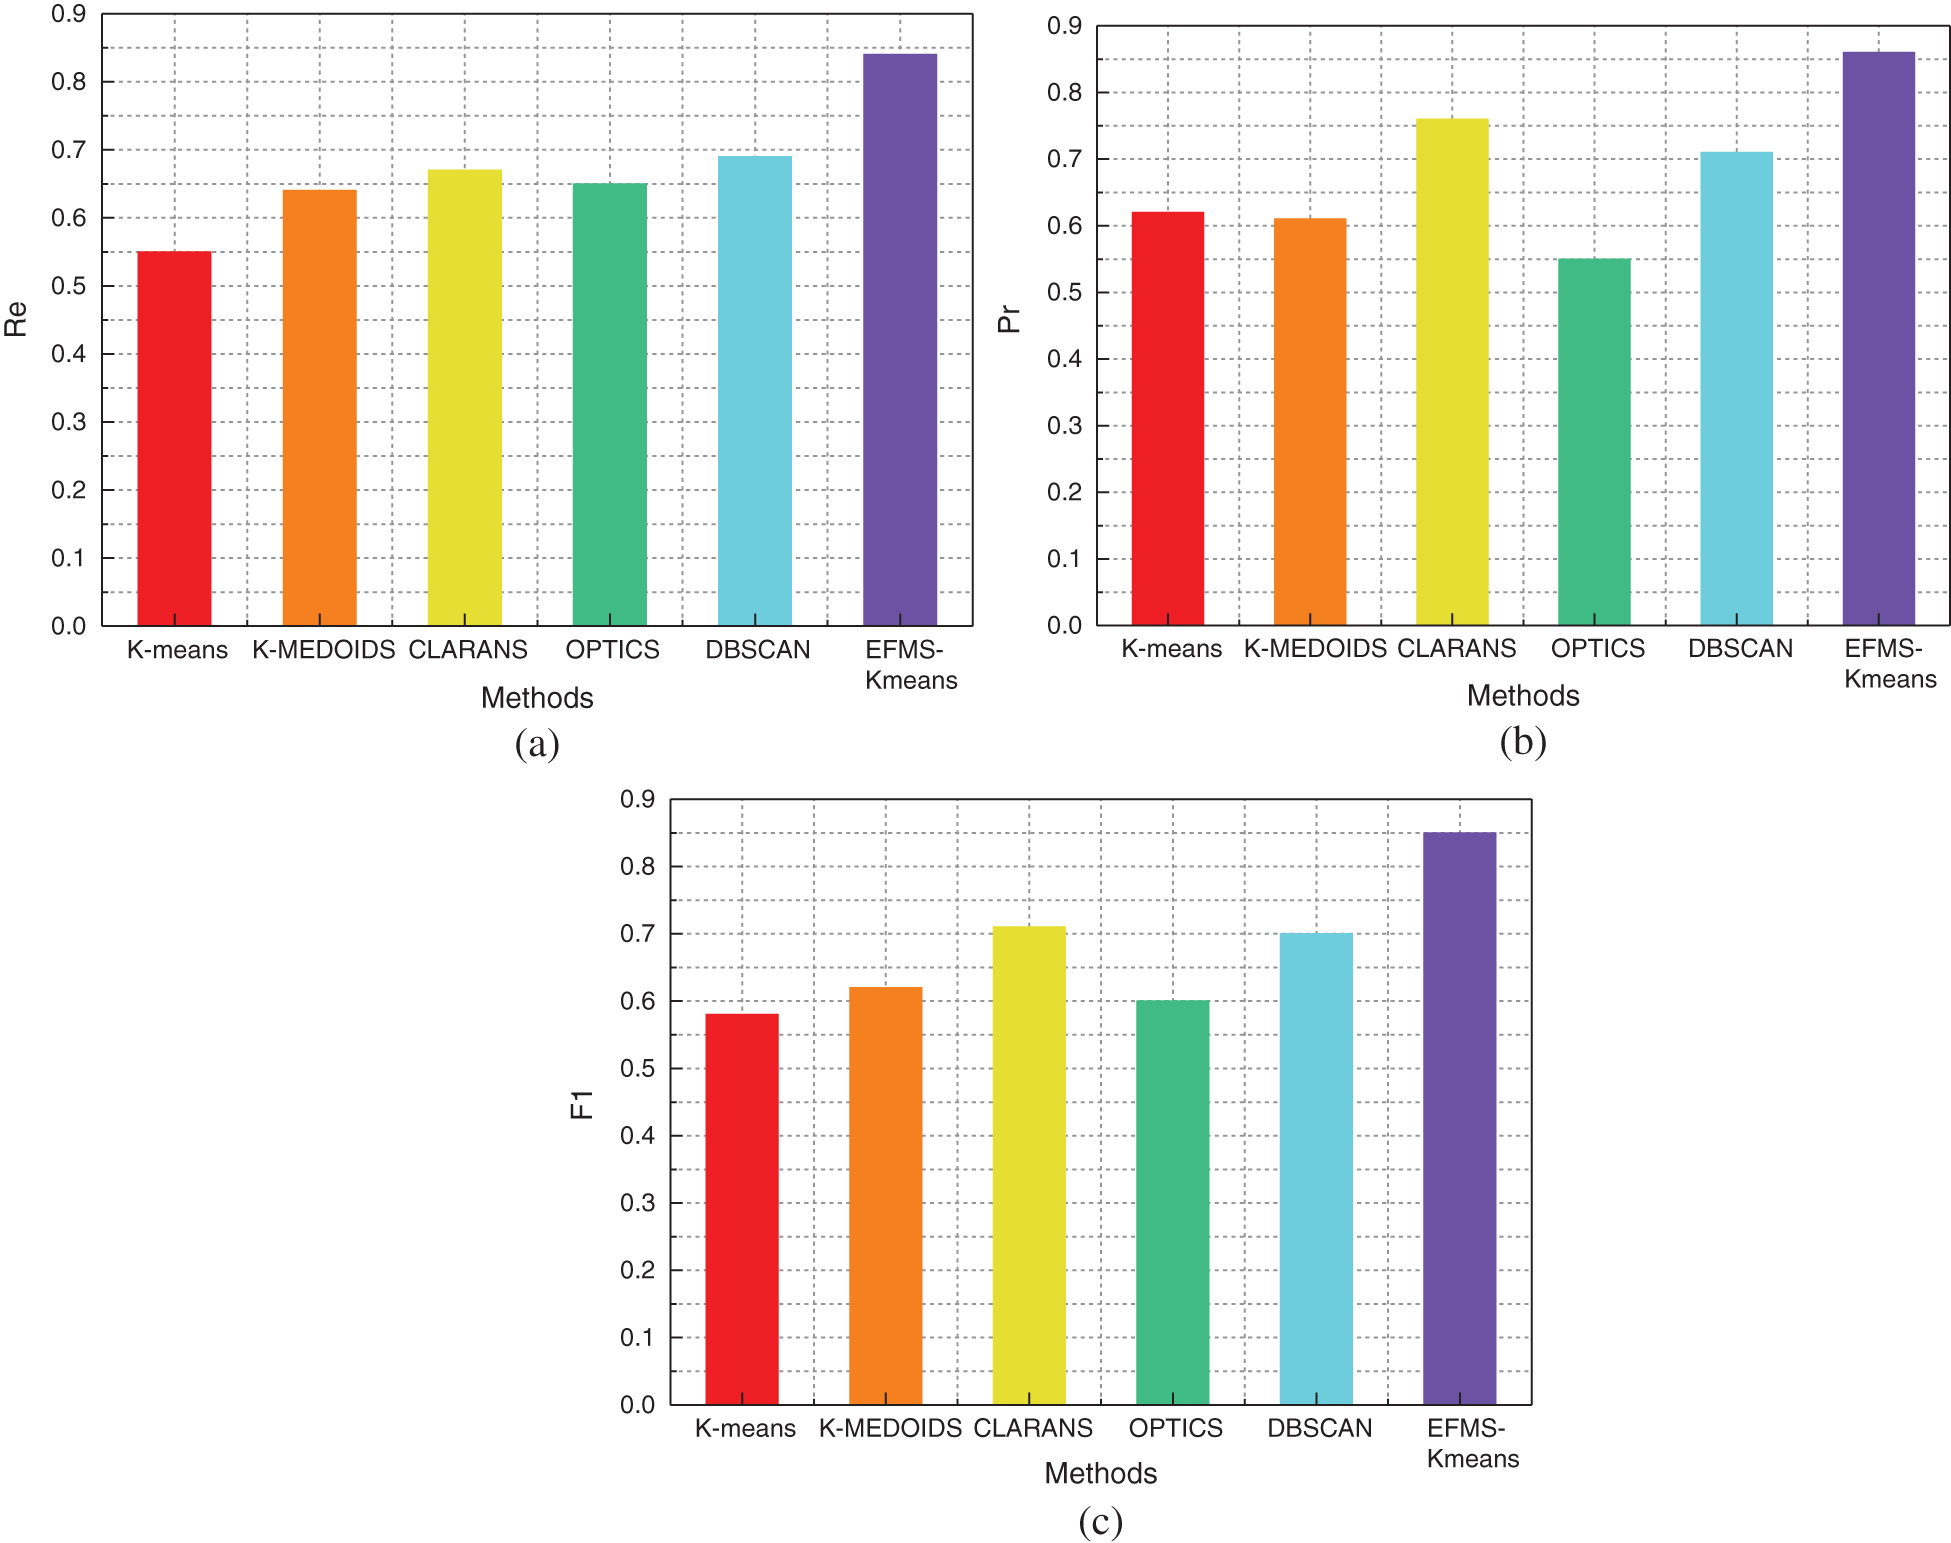
Figure 16: Re(a), Pr(b), F1(c) of different methods on Honeypot dataset
Fig. 16b is a comparison of Pr values of different algorithms on the Honeypot data set. Compared with K-means algorithm, Pr value is increased by 24%. Compared with K-MEDOIDS algorithm, Pr value is increased by 25%. Compared with CLARANS algorithm, Pr value is increased by 10%. Compared with OPTICS algorithm, Pr value is increased by 31%. Compared with DBSCAN algorithm, Pr value is increased by 15%. After data analysis, Pr value of EFMS-Kmeans algorithm is higher than that of any other method.
Fig. 16c is a comparison of F1 values of different algorithms on the Honeypot data set. Compared with K-means algorithm, F1 value is increased by 27%. Compared with K-MEDOIDS algorithm, F1 value is increased by 23%. Compared with CLARANS algorithm, F1 value is increased by 14%. Compared with OPTICS algorithm, F1 value is increased by 25%. Compared with DBSCAN algorithm, F1 value is increased by 15%. After data analysis, F1 value of EFMS-Kmeans algorithm is higher than that of any other method.
Fig. 17a is a comparison of Re values of different algorithms on the Sigfox IoT data set. Compared with K-means algorithm, Re value is increased by 25%. Compared with K-MEDOIDS algorithm, Re value is increased by 17%. Compared with CLARANS algorithm, Re value is increased by 14%. Compared with OPTICS algorithm, Re value is increased by 13%. Compared with DBSCAN algorithm, Re value is increased by 11%. After data analysis, Re value of EFMS-Kmeans algorithm is higher than that of any other method.
Fig. 17b is a comparison of Pr values of different algorithms on the Sigfox IoT data set. Compared with K-means algorithm, Pr value is increased by 37%. Compared with K-MEDOIDS algorithm, Pr value is increased by 17%. Compared with CLARANS algorithm, Pr value is increased by 3%. Compared with OPTICS algorithm, Pr value is increased by 24%. Compared with DBSCAN algorithm, Pr value is increased by 13%. After data analysis, Pr value of EFMS-Kmeans algorithm is higher than that of any other method.
Fig. 17c is a comparison of F1 values of different algorithms on the Sigfox IoT data set. Compared with K-means algorithm, F1 value is increased by 31%. Compared with K-MEDOIDS algorithm, F1 value is increased by 17%. Compared with CLARANS algorithm, F1 value is increased by 8%. Compared with OPTICS algorithm, F1 value is increased by 18%. Compared with DBSCAN algorithm, F1 value is increased by 11%. After data analysis, F1 value of EFMS-Kmeans algorithm is higher than that of any other method.
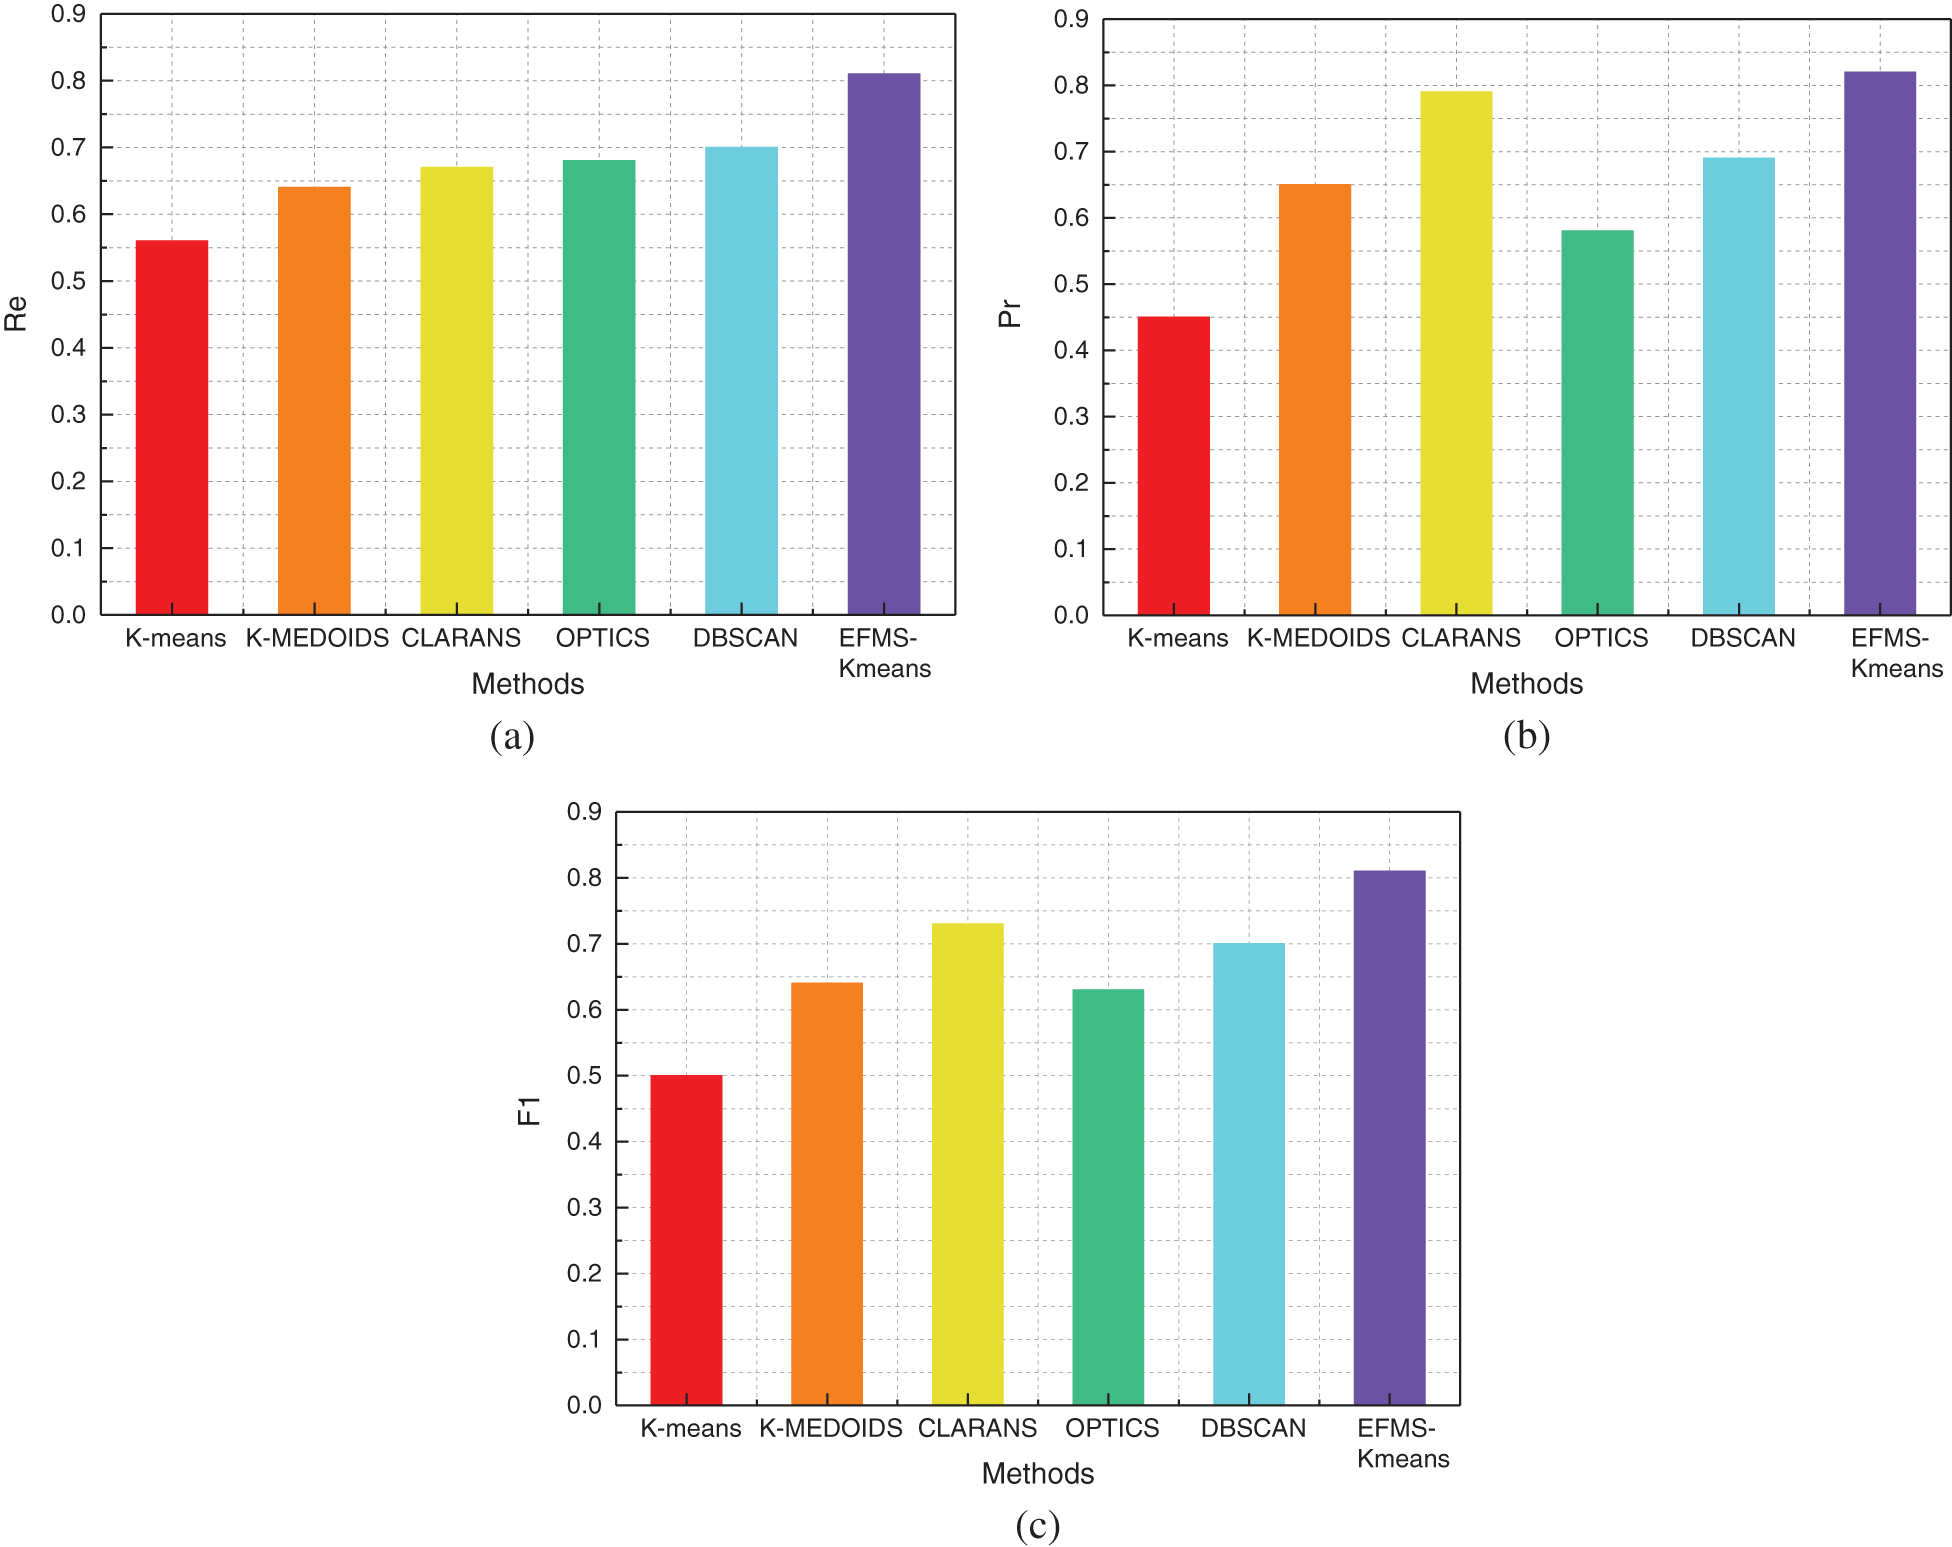
Figure 17: Re(a), Pr(b), F1(c) of different methods on Sigfox IoT dataset
Fig. 18a is a comparison of Re values of different algorithms on the WIDE data set. Compared with K-means algorithm, Re value is increased by 30%. Compared with K-MEDOIDS algorithm, Re value is increased by 22%. Compared with CLARANS algorithm, Re value is increased by 19%. Compared with OPTICS algorithm, Re value is increased by 19%. Compared with DBSCAN algorithm, Re value is increased by 13%. After data analysis, Re value of EFMS-Kmeans algorithm is higher than that of any other method.
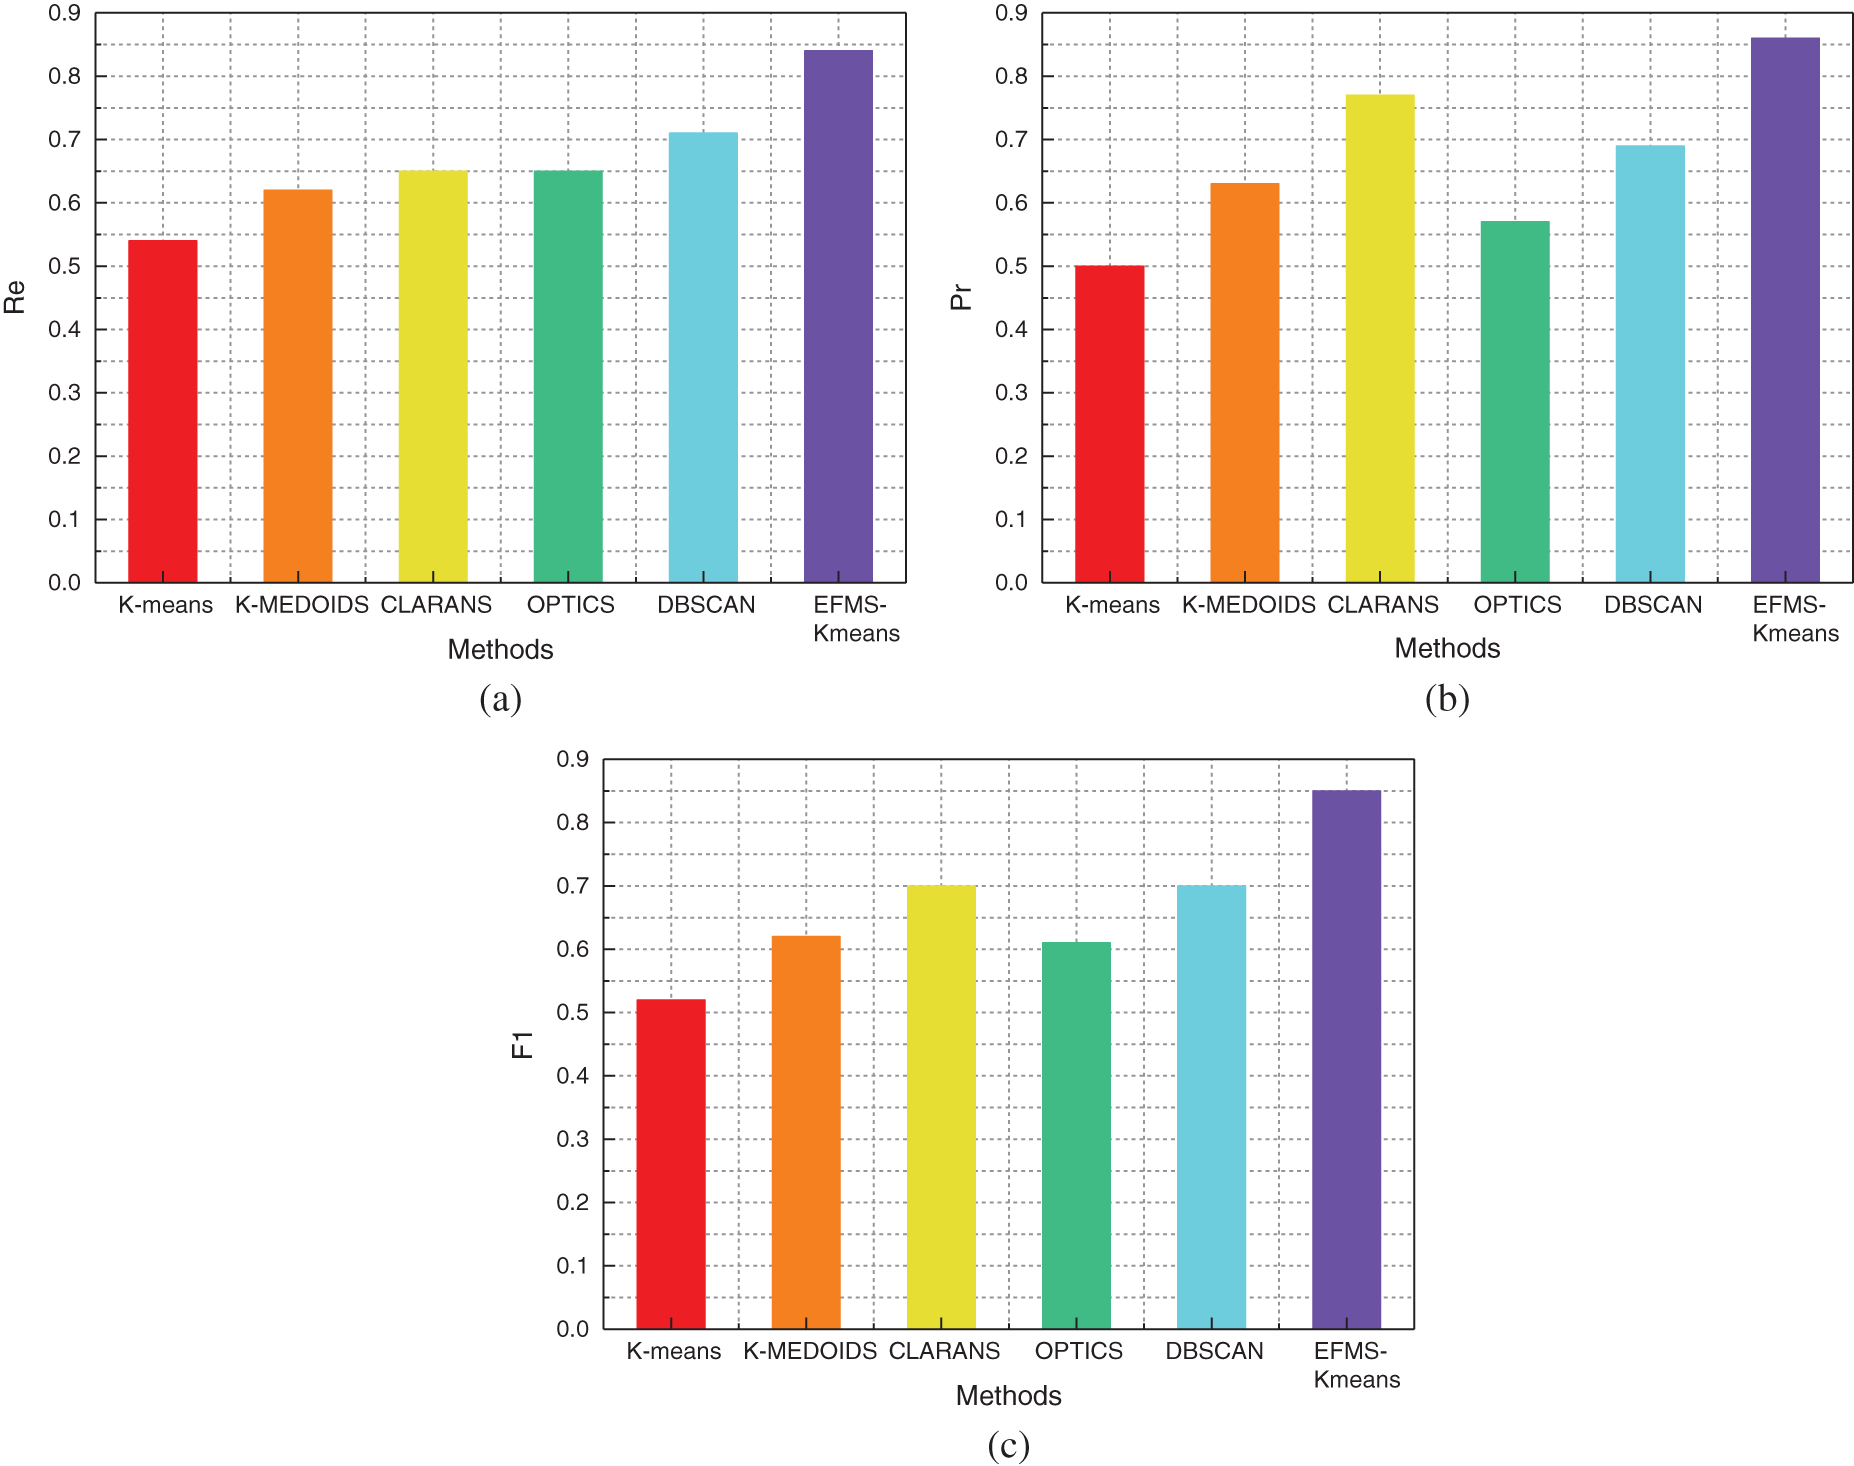
Figure 18: Re(a), Pr(b), F1(c) of different methods on WIDE dataset
Fig. 18b is a comparison of Pr values of different algorithms on the WIDE data set. Compared with K-means algorithm, Pr value is increased by 16%. Compared with K-MEDOIDS algorithm, Pr value is increased by 23%. Compared with CLARANS algorithm, Pr value is increased by 9%. Compared with OPTICS algorithm, Pr value is increased by 29%. Compared with DBSCAN algorithm, Pr value is increased by 17%. After data analysis, Pr value of EFMS-Kmeans algorithm is higher than that of any other method.
Fig. 18c is a comparison of F1 values of different algorithms on the WIDE data set. Compared with K-means algorithm, F1 value is increased by 33%. Compared with K-MEDOIDS algorithm, F1 value is increased by 23%. Compared with CLARANS algorithm, F1 value is increased by 15%. Compared with OPTICS algorithm, F1 value is increased by 24%. Compared with DBSCAN algorithm, F1 value is increased by 15%. After data analysis, F1 value of EFMS-Kmeans algorithm is higher than that of any other method.
As can be seen from the above figure, as far as a single EFMS-Kmeans clustering anomaly detection algorithm is concerned, compared with the traditional anomaly detection algorithm, EFMS-Kmeans shows its own advantages on data sets of different dimensions and has a high anomaly detection effect.
4.3 Combine HS_GRU with EFMS-Kmeans Algorithm
For experimental data set, in order to validate the proposed based on the combination of the HS_GRU helped and EFMS-Kmeans network traffic prediction cascade advantages, feasibility and performance of anomaly detection algorithm, there is a lesson on the part of traffic forecast results in the introduction to this section of the anomaly detection, flow value size and with the error of predicted value as input for outlier detection based on clustering. In this paper, 10 and 12 outliers were injected into the two flow data sets by manual injection, which mainly included two types of outliers, such as the occurrence of flow value being 0 or abnormal high value, and the large error caused by flow deviation from the normal trend. In this paper, some NSL-KDD data sets (including 20% abnormal data) and NAB data sets (including 15% abnormal data) are also used for comparison experiments to prove the effectiveness of EFMS-Kmeans clustering algorithm.
In order to quantify the experimental results and better see the experimental effect of the algorithm, we adopted the common abnormal detection evaluation indexes: Recall rate (Re), accuracy rate (Pr) and F1 value. It is assumed that there are TP true outliers detected correctly, FP normal outliers incorrectly marked as outliers, FN undetected outliers and TN normal outliers detected correctly.
The recall rate Re represents the ratio of the detected outliers to all the outliers contained in the data set, which reflects the detection status of the outliers in the data set. Its definition is as follows

Accuracy Pr represents the ratio of detected true abnormal points to all detected abnormal points, which reflects the accuracy of detected abnormal points. Its definition is as follows:

F1 value is the harmonic mean of precision rate and recall rate and the comprehensive evaluation index of precision rate and recall rate. Its definition is as follows:

The ranges of recall rate Re, accuracy rate Pr, and F1 are all between 0 and 1. The larger the value of these indicators, the better the abnormal detection results.
4.3.3 Experimental and Comparative Results
In order to verify the feasibility and optimization performance of the EFMS-Kmeans algorithm proposed in this paper, we compared it with the cloud environment anomaly detection scheme (En-ABC) based on integrated artificial colony [32].
(1) Clustering and anomaly detection results on commonly used clustering data sets.
NLL_KDD dataset is an updated version of KDD99 dataset, which solves the problem of KDD99 data redundancy. It can be used as an effective baseline data set to help researchers compare different intrusion detection methods. NAB is a novel benchmark for evaluating algorithms for anomaly detection in streaming, real-time applications. It is comprised of over 50 labeled real-world and artificial time series data files plus a novel scoring mechanism designed for real-time applications.
First, we adopted the classical NSL-KDD (including 20% abnormal data) anomaly detection data set and NAB (including 15% abnormal data) anomaly detection data set for the experiment, and obtained the experimental comparison results as follows according to the commonly used anomaly detection evaluation indicators.
From the data in the below Tab. 3, we can see the superiority of EFMS-Kmeans algorithm. In order to make it more intuitive, we show it by means of histograms.
Table 3: Comparison of EFMS-Kmeans and En-ABC anomaly detection algorithms
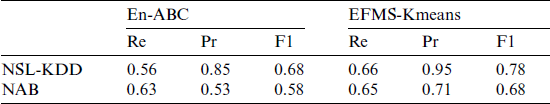
As can be seen from the Fig. 19a, the EFMS-Kmeans-based detection method proposed in this paper has a higher abnormal recall rate than the En-ABC detection method on both data sets. In the above two data sets, the algorithm in this paper improves the recall rate by 10.1% and 2.1% respectively compared with En-ABC, with an average increase of 6.1%.
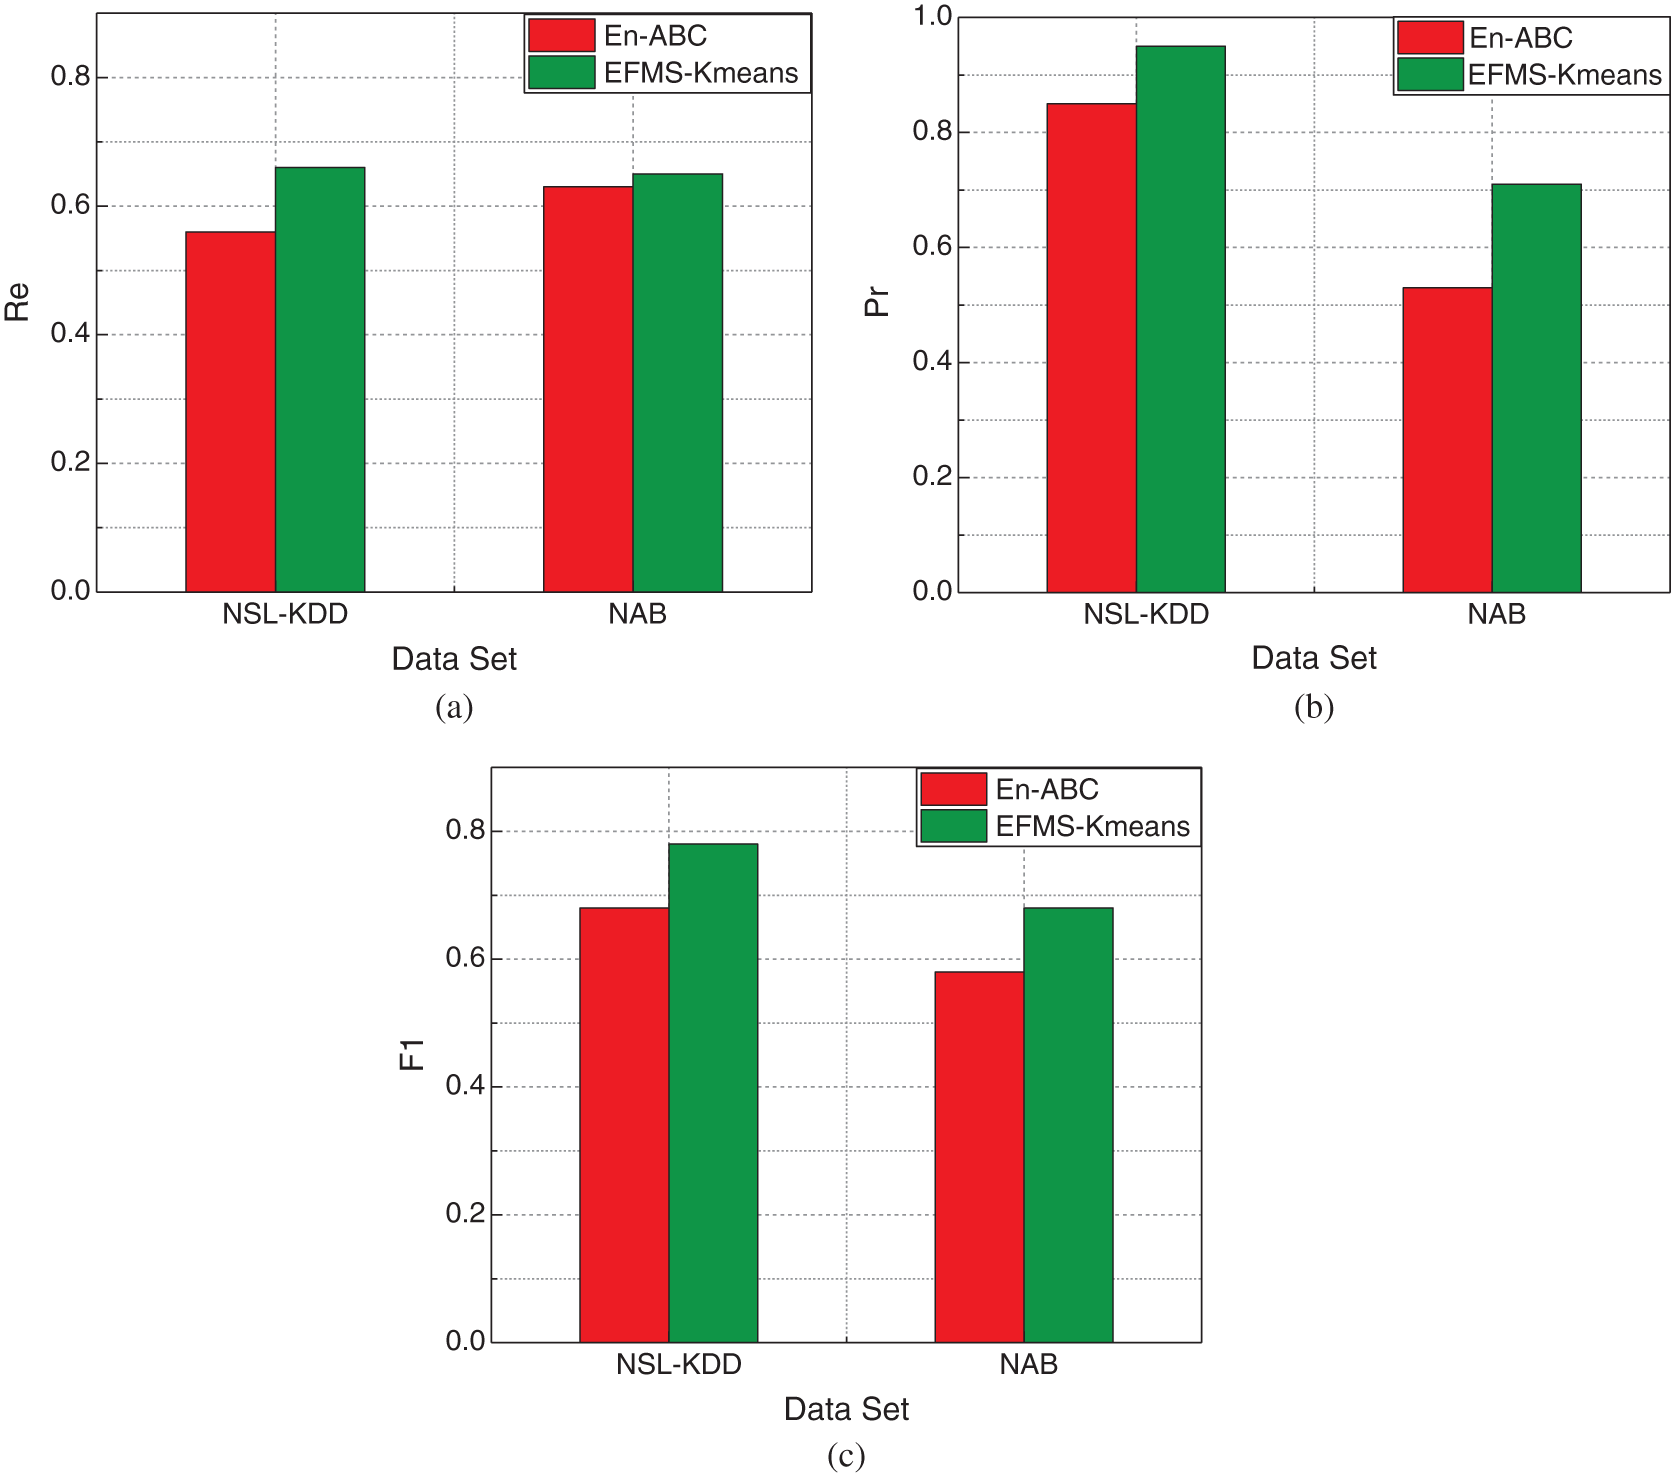
Figure 19: Comparison of EFMS-Kmeans and En-ABC anomaly detection performance on NSL-KDD and NAB data sets (a) recall rate, (b) accuracy, (c) F1
As can be seen from Fig. 19b, the detection method of EFMS-Kmeans proposed in this paper is more accurate than that of EN-ABC detection method in both data sets. In the above two data sets, compared with EN-ABC, the accuracy of this algorithm is improved by 10.7% and 18.1% respectively, with an average increase of 14.4%.
As can be seen from the Fig. 19c, by comparing the F1 values of the two algorithms, it can be found that the improved detection algorithm based on EFMS-Kmeans in this paper has a high level, while the comprehensive F1 values based on En-ABC method are all lower than those in this paper. On the two data sets, the algorithm in this paper improves the comprehensive F1 value by 4.4% and 10.3% respectively compared with the detection method based on En-ABC, with an average increase of 7.35%. Therefore, it can be considered that the anomaly detection method based on EFMS-Kmeans in this paper has better comprehensive performance.
(2) Abnormal detection results in the flow data set.
In addition, in order to validate the proposed anomaly detection based on EFMS-Kmeans algorithm, and the advantages of the proposed based on traffic prediction - density clustering feasibility and performance of the cascade way, we will be in front of the traffic prediction results, using the HS_GRU helped 11 European city respectively predicted traffic data sets (Traffic_Euro) and the forecast traffic data sets (Traffic_UK) was introduced to the anomaly detection, which will flow value size and with the error of predicted value as input for outlier detection based on clustering. In this paper, 10 and 12 outliers were injected into the two data sets by manual injection, mainly including two types of outliers, such as the occurrence of flow value of 0 or abnormal high value, and large error caused by flow deviation from the normal trend.
The essence of En-ABC is an exception detection method based on clustering. In this paper, we adopt a cascade anomaly detection method based on flow prediction-improved density clustering. In order to test the algorithm capability more fairly, the CW-RNN method is used for traffic prediction, and the predicted data is passed into the En-ABC method as one-dimensional data, and then the anomaly detection is carried out. The result type of CW-RNN is the same as that of HS_GRU. En-ABC method and EFMS-Kmeans are both clustering algorithms in essence, so the combination is feasible. According to our experiment, the results are as follows:
In order to more clearly demonstrate the feasibility and superiority of the traffic prediction-cluster anomaly detection model proposed in this paper, we used CW-RNN model to predict traffic Traffic_Euro and Traffic_UK data sets, and added the predicted results to the En-ABC anomaly detection algorithm for anomaly detection. Tab. 4 shows the detection results of the improved HS_GRU and EFMS-Kmeans combined flow prediction-clustering cascading anomaly detection method in this paper, and the combined CW-RNN and En-ABC based flow prediction-clustering cascading anomaly detection method in these two predicted flow data sets.
As can be seen from the below Tab. 4, the flow prediction-anomaly detection model proposed in this paper based on HS_GRU and EFMS-Kmeans has better anomaly detection effect than the model based on CW-RNN and En-ABC. We can make more intuitive comparison through the histograms of each abnormal indicator.
Table 4: Comparison of network traffic prediction and anomaly detection model performance
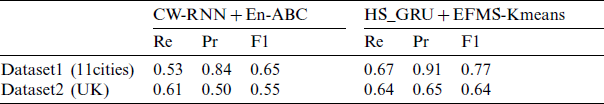
As can be seen from the Fig. 20a, the abnormal recall rate of the traffic forecast-anomaly detection method proposed in this paper based on HS_GRU and EFMS-Kmeans is higher than the result of the traffic forecast-anomaly detection method based on CW-RNN and En-ABC in the two predicted traffic data sets. On the two data sets, the algorithm in this paper improves the recall rate by 14.3% and 3.6%, respectively, compared with the CW-RNN and En-ABC combined methods, with an average increase of 8.95%.
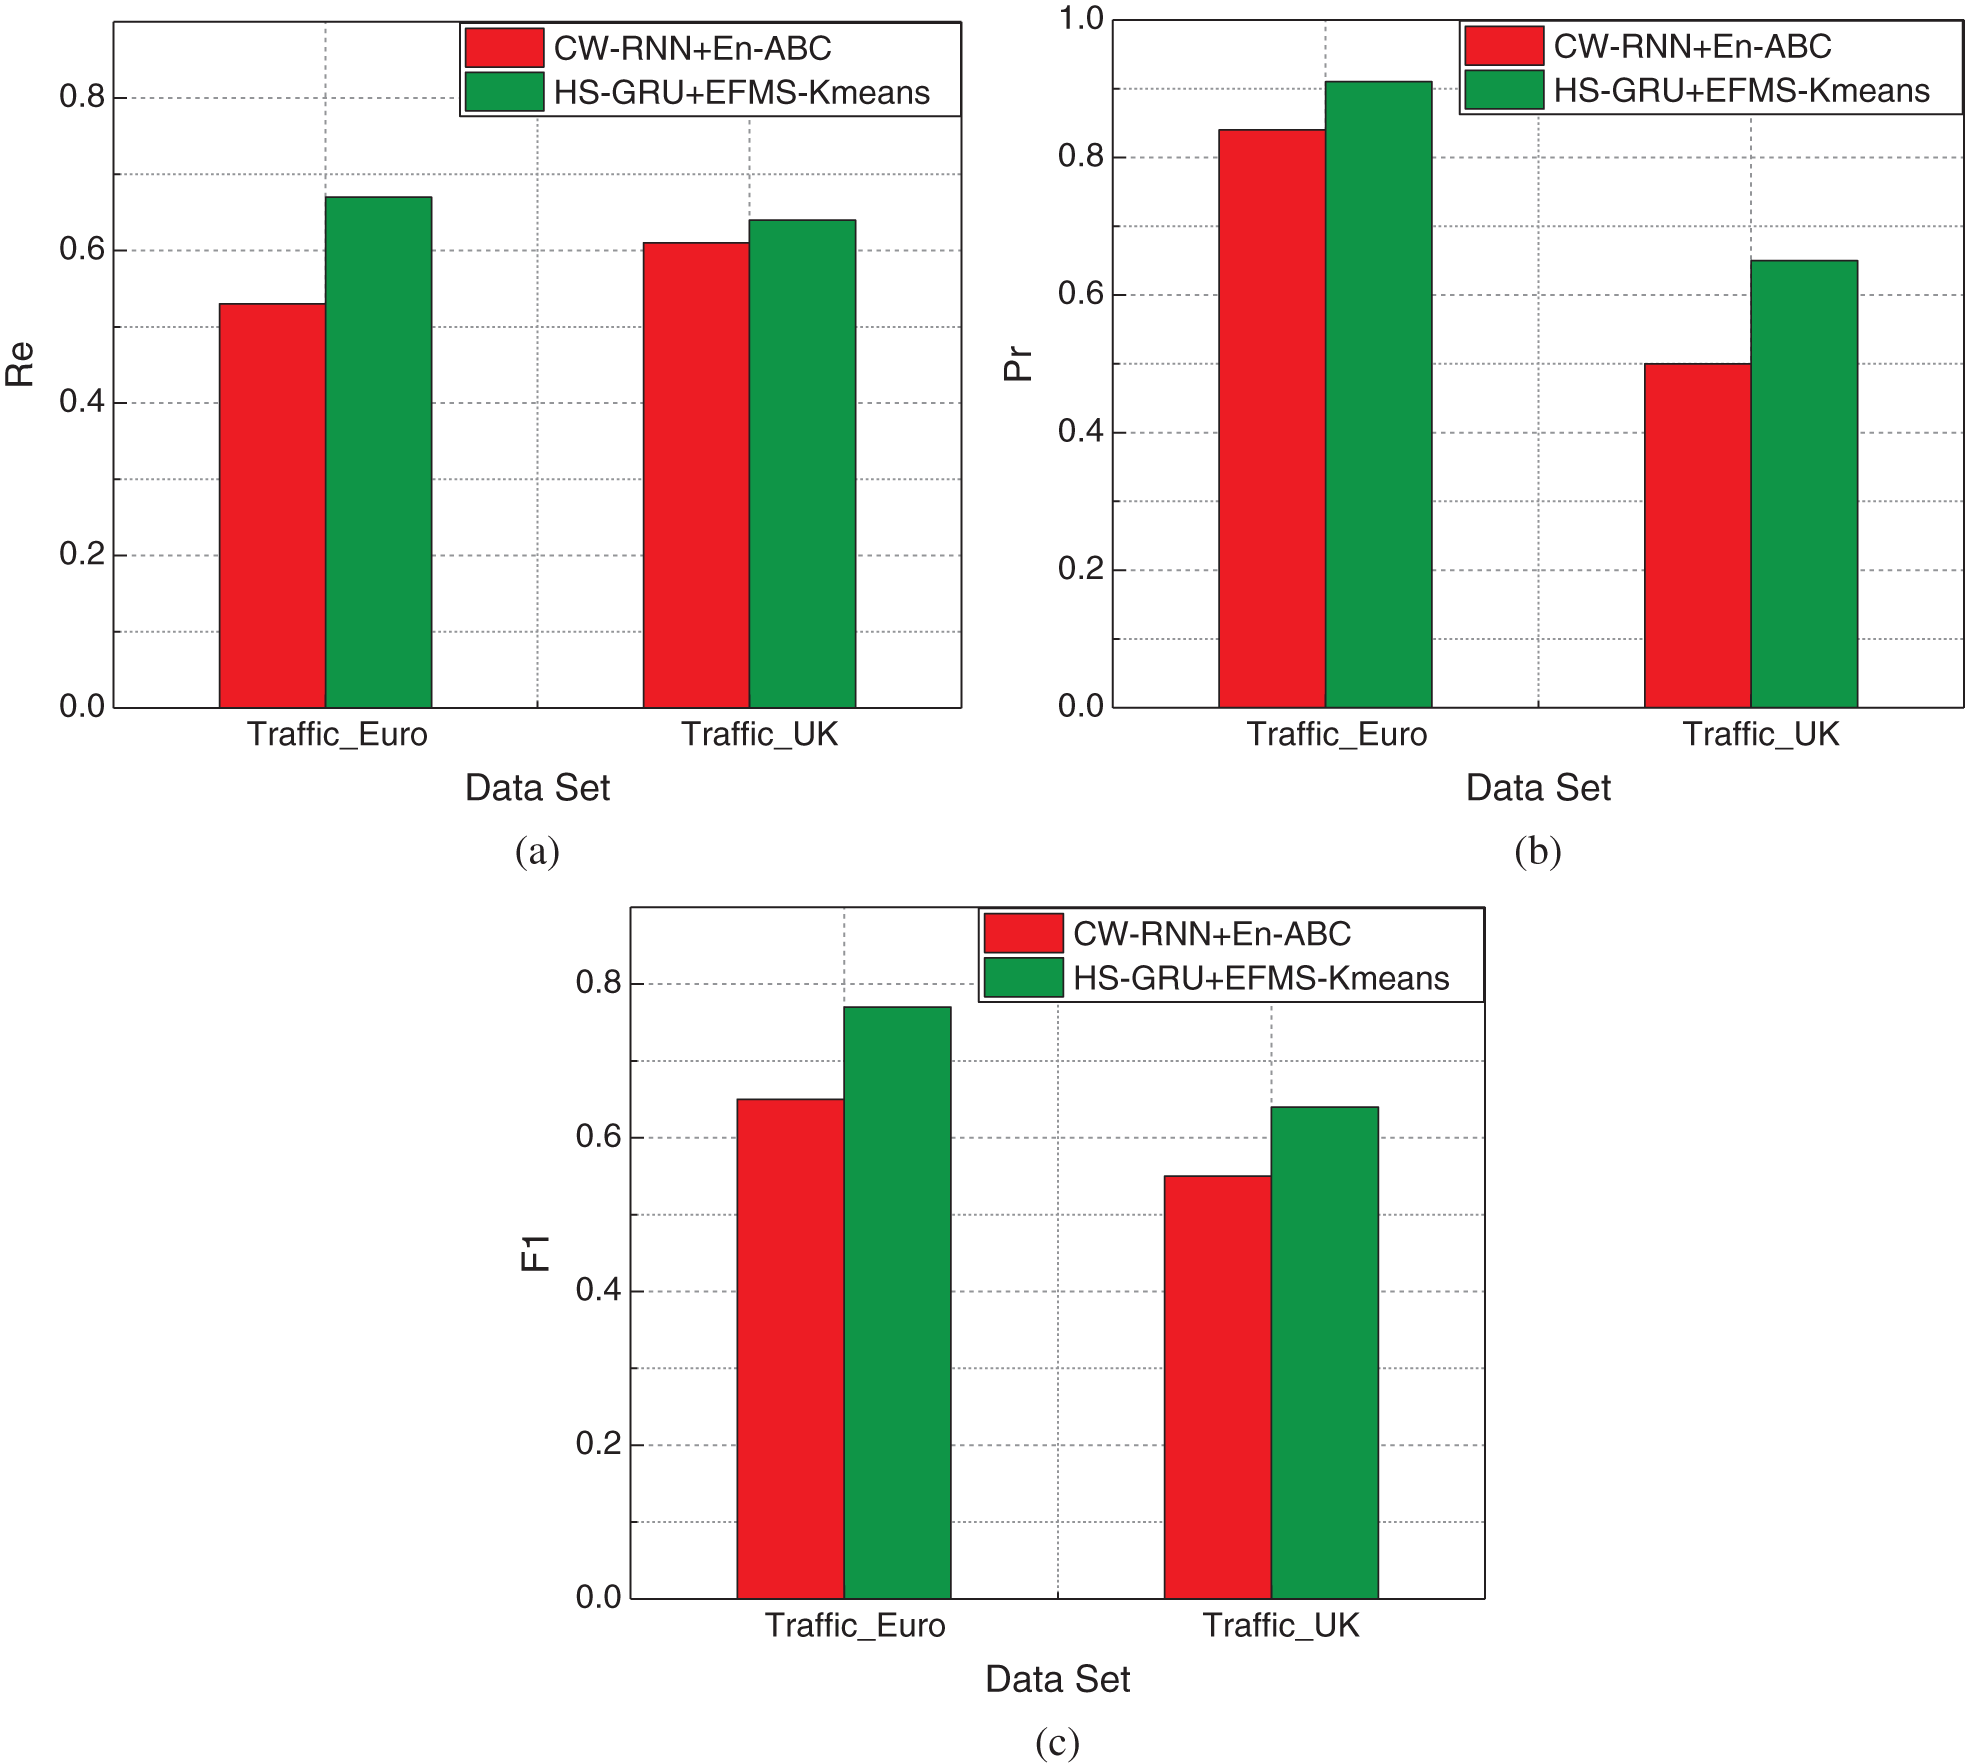
Figure 20: Comparison of network traffic prediction and anomaly detection model performance (a) recall rate, (b) accuracy, (c) F1
As can be seen from Fig. 20b, the detection method of EFMS-Kmeans proposed in this paper is more accurate than that of EN-ABC detection method in both data sets. In the above two data sets, compared with EN-ABC, the accuracy of this algorithm is improved by 7.6% and 15.2% respectively, with an average improvement of 11.4%.
As can be seen from the Fig. 20c, by comparing the F1 values of the two algorithms, it can be found that the improved detection algorithm based on the combination of HS_GRU and EFMS-Kmeans in this paper has the highest level. On the two data sets, compared with the detection method based on CW-RNN and En-ABC, the algorithm in this paper improves the comprehensive F1 value by 8.7% and 9.2% respectively, with an average increase of 8.95%. Therefore, it can be considered that the anomaly detection method based on the combination of HS_GRU and EFMS-Kmeans in this paper has better comprehensive performance.
Taking network traffic as the research object, this paper proposes an anomaly detection method based on improved HS_GRU and EFMS-Kmeans clustering. This paper summarizes the situation of network abnormal traffic detection. By analyzing the problems existing in the current flow anomaly detection methods, a flow anomaly detection method based on flow prediction and clustering is proposed. This method first proposes an improved highway GRU algorithm HS_GRU, which combines the STL decomposition algorithm with the highway GRU neural network, and uses this improved algorithm to predict traffic. Aiming at the deficiency of K-means clustering algorithm, an EFMS-Kmeans algorithm combining density clustering and distance clustering is proposed. By means of Mean Shift algorithm, the number and center of mass of clusters are obtained, and the number and center of mass are transferred to K-means algorithm, so as to make up for the shortage of artificial K value. Finally, we used real British backbone network and 11 European city traffic data sets as well as some NSL-KDD and NAB data sets to verify the performance of the proposed anomaly detection algorithm. The results show that HS_GRU can effectively capture the periodicity of network traffic data and improve the accuracy of traffic prediction. The exception detection method based on HS_GRU and EFMS-Kmeans proposed by us, compared with the traditional exception detection algorithm, can improve the accuracy and recall rate of exception detection more accurately. It has practical application value and significance to practical network.
Funding Statement: This work was supported by National Key R&D Program of China (2019YFB2103202, 2019YFB2103200), Open Subject Funds of Science and Technology on Communication Networks Laboratory (6142104200106).
Conflicts of Interest: The authors declare that they have no conflicts of interest to report regarding the present study.
1. Tran, K. P., Du Nguyen, H., Thomassey, S. (2019). Anomaly detection using long short term memory networks and its applications in supply chain management. International Federation of Automatic Control-Papers Online, 52(13), 2408–2412. [Google Scholar]
2. Ahmed, M., Mahmood, A. N., Hu, J. (2016). A survey of network anomaly detection techniques. Journal of Network and Computer Applications, 60, 19–31. DOI 10.1016/j.jnca.2015.11.016. [Google Scholar] [CrossRef]
3. Wang, P., Yang, L. T., Nie, X., Ren, Z., Li, J. et al. (2020). Data–driven software defined network attack detection: State-of-the-art and perspectives. Information Sciences, 513, 65–83. DOI 10.1016/j.ins.2019.08.047. [Google Scholar] [CrossRef]
4. Bhuyan, M. H., Bhattacharyya, D. K., Kalita, J. K. (2014). Network anomaly detection: Methods, systems and tools. IEEE Communications Surveys and Tutorials, 16(1), 303–336. DOI 10.1109/SURV.2013.052213.00046. [Google Scholar] [CrossRef]
5. Dias, M. L., Mattos, C. L. C., da Silva, T. L., de Macedo, J. A. F., Silva, W. C. (2020). Anomaly detection in trajectory data with normalizing flows. International Joint Conference on Neural Networks, pp. 1–8. Glasgow, UK. [Google Scholar]
6. Almohri, H. M., Watson, L. T., Evans, D. (2020). An attack-resilient architecture for the internet of things. IEEE Transactions on Information Forensics and Security, 15, 3940–3954. DOI 10.1109/TIFS.2019.2924555. [Google Scholar] [CrossRef]
7. Li, X., Huo, D., Goldberg, D. W., Chu, T., Yin, Z. et al. (2019). Embracing crowdsensing: An enhanced mobile sensing solution for road anomaly detection. ISPRS International Journal of Geo-Information, 8(9412. [Google Scholar]
8. Nogues, D. (2017). Anomaly detection in network traffic with a relationnal clustering criterion. Geometric Science of Information, 127–134. [Google Scholar]
9. Aljawarneh, S. A., Vangipuram, R., GARUDA: Gaussian dissimilarity measure for feature representation and anomaly detection in internet of things. Journal of Supercomputing, 76(6), 4376–4413. [Google Scholar]
10. Hafeez, I., Antikainen, M., Ding, A. Y., Tarkoma, S. (2020). IoT-KEEPER: Detecting malicious IoT network activity using online traffic analysis at the edge. IEEE Transactions on Network and Service Management, 17(1), 45–59. DOI 10.1109/TNSM.2020.2966951. [Google Scholar] [CrossRef]
11. Kongshavn, M., Haugerud, H., Yazidi, A., Maseng, T., Hammer, H. (2020). Mitigating DDoS using weight-based geographical clustering. Concurrency and Computation-Practice & Experience, 32(115679. [Google Scholar]
12. Barletta, V. S., Caivano, D., Nannavecchia, A., Scalera, M. (2020). A Kohonen SOM architecture for intrusion detection on in-vehicle communication networks. Applied Sciences-Basel, 10(155062. [Google Scholar]
13. Parwez, M. S., Rawat, D. B., Garuba, M. (2017). Big data analytics for user-activity analysis and user-anomaly detection in mobile wireless network. IEEE Transactions on Industrial Informatics, 13(4), 2058–2065. DOI 10.1109/TII.2017.2650206. [Google Scholar] [CrossRef]
14. Pandeeswari, N., Kumar, G. (2016). Anomaly detection system in cloud environment using fuzzy clustering based ANN. Mobile Networks & Applications, 21(3), 494–505. [Google Scholar]
15. Bhuyan, M. H., Bhattacharyya, D. K., Kalita, J. K. (2016). A multi-step outlier-based anomaly detection approach to network-wide traffic. Information Sciences, 348, 243–271. [Google Scholar]
16. Alkasassbeh, M. (2018). A novel hybrid method for network anomaly detection based on traffic prediction and change point detection. Journal of Computer Science, 14(2), 153–162. [Google Scholar]
17. Yaacob, A. H., Tan, I. K., Chien, S. F., Tan, H. K. (2010). ARIMA based network anomaly detection. 2010 Second International Conference on Communication Software and Networks, pp. 205–209, IEEE. [Google Scholar]
18. Andrysiak, T., Saganowski, Ł., Choraś, M., Kozik, R. (2014). Network traffic prediction and anomaly detection based on ARFIMA model. DeLaPuerta, J. G. et al. (Eds.International Joint Conference Soco’14-Cisis’14-Iceute’14, pp. 545–554, Springer, Charm. [Google Scholar]
19. Davis, N., Raina, G., Jagannathan, K. (2020). A framework for end-to-end deep learning-based anomaly. Transportation Research Interdisciplinary Perspectives, 5, 100112. [Google Scholar]
20. Wang, P., Zhang, S., Chen, X. (2009). SFARIMA: A new network traffic prediction algorithm. First International Conference on Information Science and Engineering, pp. 1859–1863, Nanjing. [Google Scholar]
21. Koutnik, J., Greff, K., Gomez, F., Schmidhuber, J. (2014). A clockwork. Computer Science, 1863–1871. [Google Scholar]
22. Katris, C., Daskalaki, S. (2014). Prediction of internet traffic using time series and neural networks. Proceedings of International Work-Conference on Time Series Analysis (ITISE 2014vol. 1, pp. 594–605. [Google Scholar]
23. Feng, J., Chen, X., Gao, R., Zeng, M., Li, Y. (2018). DeepTP: An end-to-end neural network for mobile cellular traffic prediction. IEEE Network, 32(6), 108–115. DOI 10.1109/MNET.2018.1800127. [Google Scholar] [CrossRef]
24. Zhou, J., Yang, X., Sun, L., Han, C., Xiao, F. (2018). Network traffic prediction method based on improved echo state network. IEEE Access, 6, 70625–70632. DOI 10.1109/ACCESS.2018.2880272. [Google Scholar] [CrossRef]
25. Liu, Z., Wang, Z., Yin, X., Shi, X., Guo, Y. et al. (2019). Traffic matrix prediction based on deep learning for dynamic traffic engineering. IEEE Symposium on Computers and Communications, pp. 1–7, IEEE. [Google Scholar]
26. Cao, X., Zhong, Y., Zhou, Y., Wang, J., Zhu, C. et al. (2017). Interactive temporal recurrent convolution network for traffic prediction in data centers. IEEE Access, 6, 5276–5289. DOI 10.1109/ACCESS.2017.2787696. [Google Scholar] [CrossRef]
27. Xiang, L., Ge, X. H., Liu, C., Shu, L., Wang, C. X. (2010). A new hybrid network traffic prediction method. IEEE Global Telecommunications Conference GLOBECOM 2010, pp. 1–5, Miami, FL. [Google Scholar]
28. Wei, Y., Wang, J., Wang, C., Wang, J. (2012). Network traffic prediction by traffic decomposition. Fifth International Conference on Intelligent Networks and Intelligent Systems, pp. 158–161, IEEE. [Google Scholar]
29. Jiang, D., Xu, Z., Xu, H. (2015). A novel hybrid prediction algorithm to network traffic. Annals of Telecommunications - Annales Des Télécommunications, 70(9–10), 427–439. DOI 10.1007/s12243-015-0465-8. [Google Scholar] [CrossRef]
30. Yang, Y. (2019). A new network traffic prediction approach in software defined networks. Mobile Networks and Applications, 1–10. [Google Scholar]
31. Fu, R., Zhang, Z., Li, L. (2016). Using LSTM and GRU neural network methods for traffic flow prediction. 31st Youth Academic Annual Conference of Chinese Association of Automation, pp. 324–328, IEEE. [Google Scholar]
32. Garg, S., Kaur, K., Batra, S., Aujla, G. S., Morgan, G. et al. (2020). En-ABC: An ensemble artificial bee colony based anomaly detection scheme for cloud environment. Journal of Parallel and Distributed Computing, 135, 219–233. DOI 10.1016/j.jpdc.2019.09.013. [Google Scholar] [CrossRef]
 | This work is licensed under a Creative Commons Attribution 4.0 International License, which permits unrestricted use, distribution, and reproduction in any medium, provided the original work is properly cited. |