DOI: 10.32604/cmes.2021.012562
ARTICLE
A User-Transformer Relation Identification Method Based on QPSO and Kernel Fuzzy Clustering
1China Southern Power Grid Research Institute Co., Ltd., Guangzhou, 510663, China
2China Southern Power Grid Co., Ltd., Guangzhou, 510663, China
3School of Materials Science and Engineering, South China University of Technology, Guangzhou, 510641, China
4School of Electronics and Information, South China University of Technology, Guangzhou, 510641, China
*Corresponding Author: Yanhua Shen. Email: shenyh@scut.edu.cn
Received: 04 July 2020; Accepted: 20 August 2020
Abstract: User-transformer relations are significant to electric power marketing, power supply safety, and line loss calculations. To get accurate user-transformer relations, this paper proposes an identification method for user-transformer relations based on improved quantum particle swarm optimization (QPSO) and Fuzzy C-Means Clustering. The main idea is: as energy meters at different transformer areas exhibit different zero-crossing shift features, we classify the zero-crossing shift data from energy meters through Fuzzy C-Means Clustering and compare it with that at the transformer end to identify user-transformer relations. The proposed method contributes in three main ways. First, based on the fuzzy C-means clustering algorithm (FCM), the quantum particle swarm optimization (PSO) is introduced to optimize the FCM clustering center and kernel parameters. The optimized FCM algorithm can improve clustering accuracy and efficiency. Since easily falls into a local optimum, an improved PSO optimization algorithm (IQPSO) is proposed. Secondly, considering that traditional FCM cannot solve the linear inseparability problem, this article uses a FCM (KFCM) that introduces kernel functions. Combined with the IQPSO optimization algorithm used in the previous step, the IQPSO-KFCM algorithm is proposed. Simulation experiments verify the superiority of the proposed method. Finally, the proposed method is applied to transformer detection. The proposed method determines the class members of transformers and meters in the actual transformer area, and obtains results consistent with actual user-transformer relations. This fully shows that the proposed method has practical application value.
Keywords: User-transformer relation identification; zero-crossing shift; fuzzy C-means clustering; quantum particle swarm optimization; attractor multiple update strategy; dynamic crossover strategy; perturbation strategy of potential-well characteristic length
User-transformer relation refers to the power supply membership between electricity users and the transformer that serves them [1]. Unclear user-transformer relations would cause significant errors between data from area line losses and split-phase line losses, and irrational load increases based on business expansion, affecting the load balance and lowering the success rate of remote cost controls and remote recharge systems. While influencing fundamental business, it would also curb implementing further business applications. When a power failure occurs and an immediate repair is needed, wrong loads and membership data could impair the practicality and safety of the repair strategy and timeliness of the repair project [2]. Due to changing user information, replacing malfunctioning meters, upgrading station areas, and more, user-transformer relations change frequently. In the meanwhile, under the “null wire shared” and coupling conditions, cross-area communications and readings are attainable in low voltage power line carrier and micropower wireless communications. All of the above make it very challenging to resolve user-transformer relations [3].
User-transformer relation identification is a new field that has just recently emerged in China. With small populations and simply-structured low-voltage station areas, it is not a problem for developed Western countries; nor is it a problem for ordinary developing countries. Despite big populations, they have fewer grid terminal equipment, and thus can manually resolve user-transformer relations. On the contrary, most parts of China are densely-populated. With growing power demand and an increasing number of terminal equipment, it is urgent for user-transformer relations to be accurately resolved. At present, this is usually done by patrol persons during their routine on-site patrols and thus is time-consuming and laborious. In addition, energy meters placed in intersecting station areas can’t be distinguished unless the power is cut off. The operations are not only difficult but bound to cause huge economic losses. Since 2016, many organizations in the power system have tried to apply big data to energy meter currents, power, power frequency zero-crossing shifts, and power frequency zero-crossing distortions to identify user-transformer relations. However, affected by the equipment sampling accuracy, data synchronization, and high distinguishing costs, the big data method has not proved to be effective [4].
User-transformer relations identification is a typical classification problem. The commonly-used clustering analysis methods primarily include: Mean clustering [5], kernel subtraction clustering [6], hierarchical clustering [7], and graph theory clustering [8]. The clustering algorithms avoid solutions for complex gradients and adjoint equations and have no strict requirements on model expression and continuity. They can effectively extract system features for classifications and are easy to implement. Hajek et al. [9] proposed a clustering method based on semidefinite programming, which implemented a binary symmetric stochastic block model to deal with stochastic graph classification and solved the problem of semidefinite programming relaxation with a maximum likelihood estimation to obtain accurate cluster boundaries. Wade et al. [10] proposed a clustering method based on Bayesian analysis, where appropriate point estimates and confidence intervals were set to determine the clustering structure based on the decision-making and information theory and techniques. Javadi et al. [11] implemented the K-means clustering method to cluster underground aquifer vulnerabilities, where vulnerability maps were created based on on-site data features to substitute for conventional fixed indicators, such as weights and ratios and accurately classify groundwater contamination. Combining principal component analysis and hierarchical clustering analysis, Granato et al. [12] presented relevant classifications for multiple compounds in food based on data characteristics.
However, conventional methods are not applicable to all data structures and are unable to solve the linear inseparability problem. By introducing kernel functions into the standard kernel mean clustering algorithm, kernel fuzzy C-Means clustering (KFCM) [13] maps the original problem to a high-dimensional space for clustering analysis. It can effectively achieve clustering for various data structures and solve the linear inseparability problem, thus widely applicable to engineering practices. However, a lack of theoretical guidance in selecting kernel functions, overly sensitive to the initial cluster center and kernel parameters, and long in computation time [14], standard KFCM needs to be further improved. To solve the image segmentation problem, Chen and his team proposed the kernel fuzzy C-means clustering algorithm, established a kernel function library, and adaptively selected the optimal kernel function through pixel feature information [15]. Ding et al. [16] used the Genetic Algorithm to optimize KFCM kernel parameters and increased clustering accuracy and efficiency. Likewise, Liu et al. [17] introduced the good-point set theory and speed weight to improve the Bat Algorithm (BA) and optimize KFCM. Combining the knowledge and theory of Quantum Mechanics and Particle Swarm Optimization, and Quantum Particle Swarm Optimization (QPSO) absorbed the strengths of both. It has advantages, such as few optimization parameters, fast convergence, strong generalization, a simple evolution and global convergence. QPSO is thus introduced in this paper to optimize KFCM cluster center and kernel parameters. To summarize, to identify the user-transformer relations in the grid, this paper proposes an improved KFCM algorithm, where the clustering analysis of zero-crossing shift data inherent in voltage signals in low-voltage station areas are made to identify user-transformer relations. To improve clustering accuracy and efficiency, we adopt QPSO to optimize the cluster center and kernel parameters. Meanwhile, we also define the intra-class distance and inter-class distance to improve the fitness function and introduce the Attractor Multiple Update Strategy to solve the problem of “prematurity”. Through simulation tests and application verifications, the method has proved to be effective in identifying real user-transformer relationships in low-voltage station areas.
For the actual low-voltage distribution network shown in Fig. 1, the AC signals are transmitted to each low-voltage station area along the medium-voltage line through a 10 KV/380 V transformer. When the electrical signals are passing through the transformer, or when the capac-itive or inductive loads are being connected to or disconnected from the power line, the phase of the AC electrical signal will exhibit voltage zero-crossing shift, phase distortion, and other characteristics. The specific shift is shown in Fig. 2.
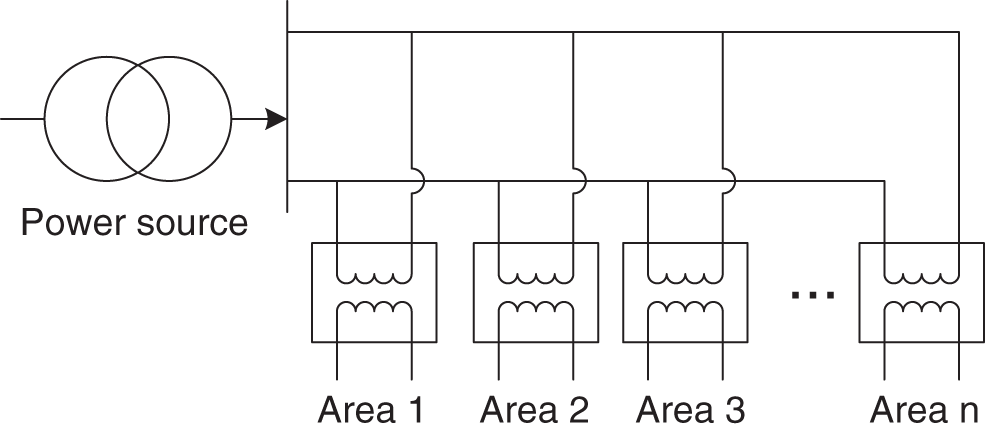
Figure 1: Topological graph for low-voltage area network
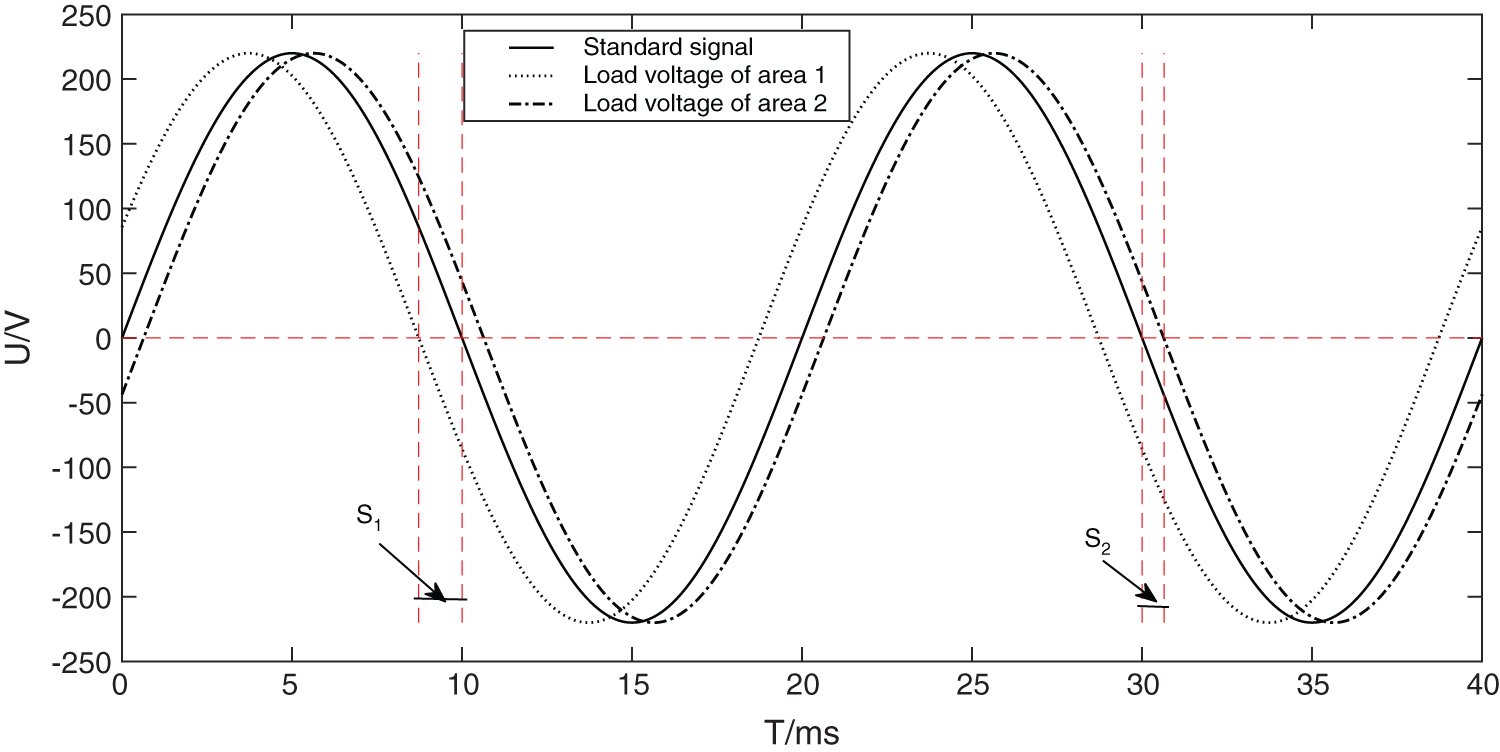
Figure 2: Sketch map for phase shift
Zero-crossing shift refers to the time or phase deviation of the AC sine wave signal at the point where the amplitude changes positively or negatively (that is, the zero-crossing point) with the standard frequency signal. Less affected by the load, the voltage signal is often used for analysis. In Fig. 2, the solid line represents the power frequency voltage signal (standard signal) with an effective value of 220 V and a frequency of 50 HZ. The dotted line and the dash line are the load voltages of station area 1 and station area 2 respectively. S1 and S2 are the zero-crossing shift data of the voltage signals in the two station areas respectively.
In order to verify the influences of different inductances and capacitances on the zero-crossing shift, a simulation circuit, as shown in Fig. 3, is constructed. Module 1 is used to generate a 220 V power frequency power supply and simulate a transformer; Module 2 is used to generate a zero-crossing signal on the transformer side; Module 3 is used to simulate the impedance environment of the power network. The impedance range is simulated between 2  and 50
  . The transmission line resistor is 1
  ; Module 4 is used to generate a zero-crossing signal on the energy meter side. Let R3 = R4 = 1
  , adjust differences in L1 and L2, and record the zero-crossing shifts in Tab. 1. It can be observed that inductance and zero-crossing shift are positively correlated.

Figure 3: Artificial circuit of zero-crossing shift
Table 1: Zero-crossing shift under different inductance values

In an actual scenario affected by the inductance of the medium-voltage line, the capacitance to the ground, the primary-side equipment, and the transformer, the zero-crossing shift characteristics vary between different station areas. The phases in different station areas vary as well. In addition, the distributions of transformers and transmission lines are inherently inductive and capacitive, hence further highlighting the characteristics of each station area.
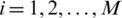
Assume that there are M low-voltage station areas (corresponding to M transformers) in the target power grid, and a total of N energy meters. The zero-crossing shift of the voltage signal corresponding to the jth energy meter is:

where Tj and T are the time between two adjacent zero crossings of the jth energy meter and the standard signal respectively.
Similarly, the zero-crossing shift of the ith transformer is:

where  represents the time between two adjacent zero crossings of the ith transformer.
By performing cluster analysis on the zero-crossing shifts of the energy meter xj and comparing them with the zero-crossing shifts of the transformer in the station area  , we can identify the class membership between the Nth energy meter and the Mth low-voltage station area. Therefore, in this paper, an improved KFCM algorithm is proposed, where the quantum idea, optimization and clustering algorithms are combined, and the QPSO algorithm is adopted to optimize the KFCM algorithm cluster center and kernel parameters. It enables us to make accurate and fast classifications of zero-crossing shifts and hence obtain authentic user-transformer relations.
Mapping the original problem into a high-dimensional space, KFCM achieves clustering analysis based on the fuzzy theory and distance objective function. With this method, the phasors composed of N sample points, namely xj,  , can be classified into M classes. For a general classification problem, suppose the center of the ith cluster is vi,
  , the membership degree that the jth sample belongs to for the ith class is
  ,
,  ,
,  , then the following calculation Formula can be obtained [18]:

The given data needs to be mapped into a high-dimensional space for processing. Selecting the Gaussian function here as the kernel function will achieve:

where 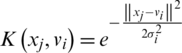 .
.
Membership degree:

where the membership degree satisfies the constraint of  ,
,  .
.
Cluster center:

The clustering process is [18]:
1. Parameter settings: Ambiguity as m , Error Threshold of Objective Function as  , Maximum Number of Iterations as
  ;
;
2. Initialization: Randomly select M data points in the feasible domain as the initial cluster center;
3. For the tth iteration, compute Objective Function  . Determine whether
  is true. If it is true, stop the clustering. Otherwise, update the membership matrix and cluster center according to Formulae (5) and (6) and continue with clustering until the optimal cluster center is obtained;
4. Defuzzy to get the final clustering result.
KFCM is very sensitive to cluster center settings and kernel parameters. However, in standard KFCM, the initial cluster center is randomly determined, and the kernel parameters are set according to experience. This greatly affects clustering accuracy and efficiency. Thus QPSO is introduced in this paper to seek the optimal cluster centers and kernel parameters.
Quantum Particle Swarm Optimization (QPSO) is a new intelligent optimization algorithm proposed by Sun and other scholars on the basis of particle swarm optimization and quantum mechanics [19]. Particle swarm optimization updates positions according to particle flight speeds. Based on the  potential well theory, QPSO obtains the probability density functions for particles appearing at certain points by solving the Schrödinger equation and performs inverse-transformation alongside it to obtain particle positions. Compared with conventional algorithms, QPSO can search for the optimal solution in the entire feasible domain, with fast convergence and robustness [20,21].
In QPSO, assume the position vector of particle  , W represents the number of particles) in the tth generation is
  , where N is the dimension of the target problem,
  represents the historically best position of Particle K and
  is the optimal position of the swarm. As known from Chen et al. [22], as particles evolve, a particle would take Pk, t, the weighted average position of its historically best position and the optimal position of its swarm, as the attraction point and gravitate towards that point. The specific weighted average position (or attractor) is:

where  is a weighting factor, subject to uniform distribution, i.e.,
  .
.
The mean value of the historically best positions of all particles (average optimal position) is:

To update particle positions, the particles need to be collapsed from the quantum state to the classic state, and the Monte Carlo random simulation is used to obtain the next-generation particle position.

where  , represents the contraction-expansion coefficient,
  is the maximum number of iterations, u is the random number,
  [23].
[23].
The Schrodinger equation [24] informs us that the state of the system cannot be determined with specific values but needs to be described with a wave function. Particle K moves in potential well  centered on position Pk, t in the jth dimension, with a wave function
  that can be described as:

where  represents the characteristic length of potential well
  in the jth dimension and satisfies

The probability density function of Particle K in the jth dimension is

Through iterative solutions from Formulae (7) to (9), the optimal values can be obtained. In the later iteration period, with less space for the possible distributions of particle attraction points and insufficient swarm diversity, the aforementioned QPSO algorithm is difficult to jump out of local extrema and hence trapped in the “prematurity” problem. Focusing on the QPSO problems in the optimization solution, this paper proposes an Improved Quantum Particle Swarm Optimization algorithm (IQPSO), striving to improve upon the QPSO in three aspects and better the algorithm searching performance.
1. Attractor Multiple Update Strategy
The QPSO algorithm obtains the retained good positions from the historically best positions of individuals and optimal positions of the swarm through the attractor shown in Formula (7), and gradually gravitates towards the global optimal position. However, as the iteration progresses, it causes a fast decline in swarm diversity and a degradation in the searching performance for the multi-extrema optimization problem, thus becoming stuck in the local optimal solution [21]. To solve this problem, the Attractor Multiple Update Strategy was introduced. Suppose the neighborhood optimal position of Particle j is  , and
, and  represents the neighborhood weighing factor, replace the updated Formula with:


Formula (13) is the original attractor update Formula that can select and retain the optimal solutions from the swarm’s best position. Formula (14) selects the better solution from the neighborhood optimal position. Formula (15) selects and retains the better solution from the global optimal position and neighborhood best position. In the Attractor Multiple Update Strategy, the update is conducted based on comprehensive consideration for the swarm’s optimal positions, the individual historically best positions and neighborhood best position. It helps increase swarm diversity effectively and enables searching for the global optimal solution. In practice, an auxiliary random weight  is introduced. If
  , the attractor will be updated according to Formula (14). If
  , the attractor will be updated according to Formula (13). Otherwise, Formula (15) will be utilized. In practice,
  is often selected.
2. Perturbation Strategy of Potential-Well Characteristic Length
Integrating Formulae (9) and (11), we will get:

It shows that the Potential-Well characteristic length  is directly related to the algorithm search speed and convergence performance. The QPSO algorithm adopts the swarm’s average position to update the position, which fails to present search information for the entire group. When the swarm’s best position
  is only the local best, almost all particles only conduct local searches and are hardpressed to jump out of local extrema. Therefore, considering the information from different individuals, this paper introduces the Perturbation Strategy. For the swarm composed of W particles, we select
  particles randomly proportional to
  and perform perturbation to the Potential-Well characteristic length according to the Formula:

where  and
and  represent two randomly-selected particles respectively.
3. Dynamic Crossover Strategy
To further enhance the global swarm search ability, we introduce the crossover operation of the genetic algorithm into QPSO. During the algorithm iteration, for the tth iteration, firstly, we obtain Xk, t+1, the particle position in the (t + 1)th iteration according to Formula (8) and Formulae (13) to (17). Then, we perform crossover operations on  and the individual’s historically best position
  , and generate the new individual position
 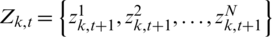 . To perform crossover operations on the particle position according to the following Formula, we will get:

where  is the random number, satisfying
  , and
, and  is the crossover probability. The crossover operation of the particle’s historically best position is:

where  is the fitness function.
Large crossover probability can fully retain the individual’s empirical knowledge and speed up algorithm convergence. While retaining individual information, small crossover probability increases swarm diversity and enhances the global search ability. Therefore, this paper introduces it in the middle and late iteration periods. The dynamic crossover strategy is defined as:

where  ,
,  and
and  represent respectively the given minimum and maximum crossover probabilities, and e is the natural base.
The QPSO algorithm is improved according to the strategy stated in Section 3.3.3 and is used to optimize the cluster center and kernel parameters of fuzzy c-means clustering. This is the main idea of the IQPSO-KFCM algorithm proposed in this paper. As is shown in Formula (4), generally, KFCM determines the cluster center by minimizing the intra-class distance. The inter-class distance is thus ignored, and clustering accuracy is reduced. Therefore, this paper comprehensively considers the intra-class distance and inter-class distance and improves the fitness function.
3.3.1 Fitness Function Construction
According to Formula (2), the inter-class distances of different samples in KFCM are defined as:

The objective function is:

where Di represents the sum of the inter-class distances and describes the relation between relevant classes; Ji is the sum of intra-class distances and the objection function of the original clustering algorithm. In the objective function, a smaller Ji leads to a greater Di and a smaller Ei will be. It indicates that a closer intra-class distance leads to a more distant inter-class distance and better clustering. Therefore, the fitness function is constructed as:

Thus, a bigger  leads to better clustering.
The basic process of IQPSO-KFCM is: In improved quantum particle swarm optimization, the particle positions represent the feasible solutions to the optimization problem, and each position is composed of a group of cluster centers. The IQPSO and KFCM algorithms are executed in an alternating fashion to obtain the kernel parameters of the optimal cluster center and Gaussian kernel function. The detailed steps are:
Step 1: Parameter settings: Determines the number of clusters as M , variable dimension as N , error threshold as  , maximum number of iterations as
  , and maximum and minimum crossover probability as
  and
and  respectively;
Step 2: Initialization: Swarm size is W , particle position is Xk, 0, cluster center is vi, and the particle historically best position and swarm best position is 0;
Step 3: Calculate the fitness function according to Formulae (4) and (21) to (23), sort the historically best fitness functions in descending order (find the maximum value) and update the particle historically optimal position  and swarm best position
  according to the calculation result;
Step 4: Execute Steps 5 to 9 on each particle in swarm  ;
;
Step 5: Determine the neighborhood optimal position of each particle according to the fitness function  , execute the attractor multiple update strategy according to Formulae (13) to (15) to obtain local attractor Pk, t;
Step 6: Execute the perturbation strategy of the Potential-Well characteristic length and update the particle position Xk, t+1 according to Formulae (16) and (17);
Step 7: Execute the dynamic crossover strategy and update the particle positions according to Formula (18);
Step 8: Update the particle historically best position  according to Formula (19);
Step 9: Compare the fitness functions and update the swarm best position  ;
;
Step 10: Update the crossover probability according to Formula (20);
Step 11: Keep repeating Steps 4 to 10 until the two fitness functions of two adjacent iterations meet the error threshold, or the maximum number of iterations is reached. Stop the iterations and the final result  will be the optimal solution obtained by IQPSO-KFCM and
  the corresponding best indicator.
The IQPSO-KFCM algorithm proposed in this paper consists of two parts, the improved quantum particle swarm optimization and IQPSP-based kernel fuzzy C-means clustering. The two parts will be validated respectively. All validation tests and simulations are based on Windows 10 Pro Edition ( 64), configured with an i7-8550U CPU, 1.80 GHz CPU Frequency, 8 GB RAM and Matlab R2016b.
3.4.1 Algorithm Validation of IQPSO
To illustrate the improvements in the IQPSO algorithm in its ability to search for optimal solutions, this paper introduces 6 commonly-used benchmark functions [25,26], as shown in Tab. 2, uses QPSO and IQPSO for optimization and conducts tests with the maximum number of iterations, and the error threshold of the objective function as the termination condition respectively.
Table 2: Benchmark function set
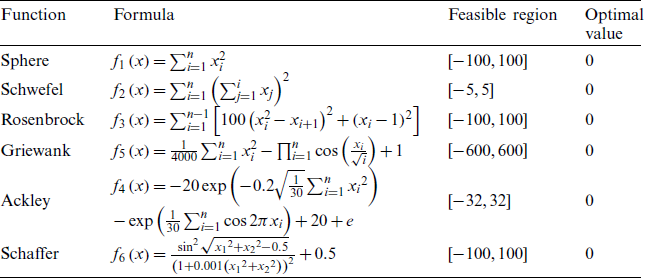
Take the number of iterations as the only termination conditions. Set the maximum number of iterations as 1000 and the swarm size as 50. Employ QPSO and IQPSO and run them 50 times each. Take the statistical mean of the mean and standard deviation of the objective function as the performance evaluation metrics for the algorithms. Parameter settings: The feasible region of variable initialization is shown in Tab. 2, where the crossover probability  ,
,  . The optimization problem for different variable dimensions is solved, and the optimization results are recorded in Tab. 3. By contrast, it can be found that, whether it is mean or standard deviation, the results obtained from IQPSO optimization are smaller than that from QPSO optimization, and IQPSO archives strike improvements in optimization accuracy. For the solution to the low-dimensional optimization problem, all test functions achieve good optimization effects. For the solution to the high-dimensional problem, all functions, except the Rosenbrock function can obtain the ideal optimal solution. For the Rosenbrock function, although the improved method in this paper can further approximate the optimal solution, there are still some errors. Hence, the IQPSO algorithm proposed in this paper is good enough to solve the low-dimensional optimization problem but slightly deficient for solving the high-dimensional problem. To demonstrate the specific search process for the optimal solution, one result of the 50-dimension solutions is randomly chosen and graphed for analysis, as shown in Figs. 4 to 9. By comparison, it is found that, whether in mean or standard deviation, the IQPSO algorithm proposed in this paper achieves better accuracy than QPSO. In the later iteration period, the QPSO algorithm is stuck in the local extrema. On the contrary, thanks to the introduction of the improvement strategy, IQPSO enjoys better swarm diversity, hence it is able to jump out of the local extrema, search, and obtain the global best solution.
Table 3: Statistical analysis of optimization results


Figure 4: Fitness curve of Sphere function

Figure 5: Fitness curve of Schwefel function
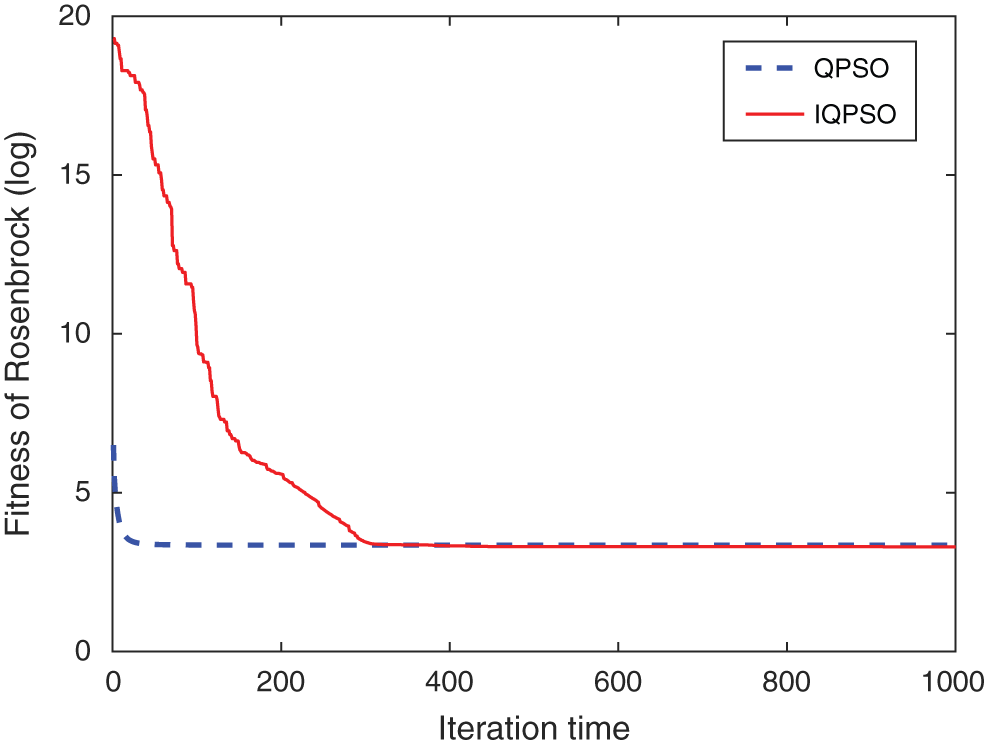
Figure 6: Fitness curve of Rosenbrock function

Figure 7: Fitness curve of Griewank function
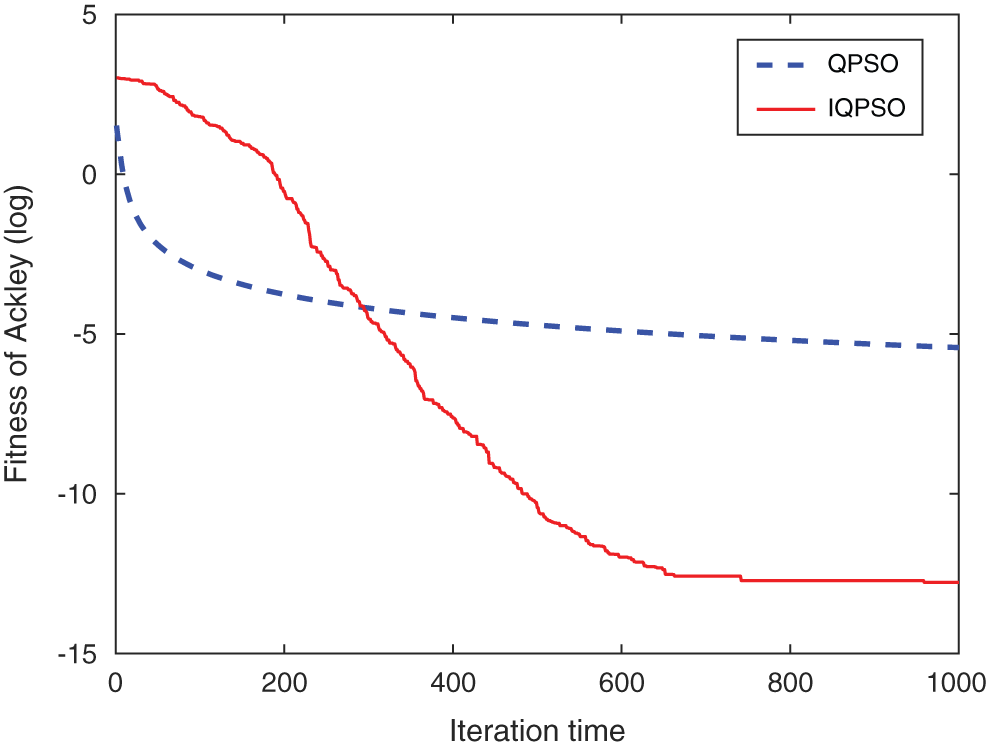
Figure 8: Fitness curve of Ackley function

Figure 9: Fitness curve of Schaffer function
Take the error threshold of the objective functions as the only termination condition and set the specific parameters as above. Run QPSO and IQPSO independently 100 times, and record the average number of iterations and success rates for each solution in Tab. 4, where the success rate  is calculated by Formula (24).

where ly is the number of successful tests, and  is the total number of tests.
Table 4: Statistics of average iteration number and average optimization success rate

By comparing the data in Tab. 4 it can be seen that based on the premise of meeting target accuracy, the average number of iterations for the IQPSO algorithm proposed in this paper is significantly less than that of the QPSO algorithm. This is because the QPSO algorithm lacks a corresponding strategy to ensure swarm diversity in the late iterations of the algorithm. As a result, the algorithm tends to fall into local extrema, and thus often fails to find the optimal solution under the conditions of a given accuracy and satisfy accuracy threshold conditions. By contrast, the IQPSO algorithm can obtain the optimal solution properly. Therefore, the IQPSO algorithm proposed in this paper has a better convergence speed and accuracy.
3.4.2 Algorithm Validation of IQPSO-KFCM
To validate the effect of IQPSO-KFCM in clustering applications, the UCI Dataset, including Iris, Wine, Blance-archive, Vote, Heart, and Australia, are introduced to conduct clustering tests on the algorithm [27]. The parameters of the dataset are shown in Tab. 5.

KFCM and IQPSO-KFCM are used to conduct clustering analysis on the aforementioned UCI dataset. Clustering is performed 100 times. The success rate index is defined as:

where Ny is the number of accurate clustering samples,  is the total number of samples. The average accuracy of 100 tests is recorded in Tab. 6.
Table 6: Clustering result comparisons

The experimental data in Tab. 6 shows the clustering results of 3 clustering algorithms on 6 UCI data. The proposed algorithm shows the best clustering performance on all UCI data sets. It is easy to observe that the data in columns 3 and 4 in Tab. 6 prove that the KFCM clustering performance based on the optimized algorithm has been greatly improved. This shows that the optimization algorithm can indeed find a good clustering center, thereby improving the final clustering effect from the algorithm. The data in the fourth column of Tab. 6 is slightly improved compared to the third column, which shows that IQPSO can indeed prevent QPSO from falling into local extreme values, thereby improving IQPSP-KFCM clustering performance.
4 Membership Identification of Low-Voltage Station Areas Based on IQPSO-KFCM
The IQPSO-KFCM algorithm proposed in this paper is adopted to find identification solutions to the user-transformer relations based on the zero-crossing shift data of on-site low-voltage energy meters and transformers. As shown in Fig. 10, the data is collected based on the existing equipment from the energy meters and concentrators at some station areas in some coastal city and pooled at the main station for further processing. There are four transformers connected to 234 energy meters. The specific zero-crossing shift data at the transformer side and energy meter side are shown in Tabs. 7 and 8. Thus, the problem is about how to use the IQPSOKFCM algorithm to conduct clustering analysis and classify the dataset composed of 234 energy meters into 4 classes.
Parameter settings: Number of clustering M = 4 , variable vector N = 234 , error threshold  , maximum number of iterations
  , minimum crossover probability
  , maximum crossover probability
  , Gaussian function as kernel function, swarm size W = 300, initial position of the particle Xk, 0 and cluster center vi are determined randomly. When the algorithm satisfies either one of the conditions, the error threshold or the maximum number of iterations, the clustering process can be stopped and the optimal solution obtained. To compare the clustering effect, KFCM is introduced to compare with the proposed algorithm. The specific clustering results are shown in Fig. 11.

Figure 10: Schematic diagram of field data acquisition
Table 7: Zero-crossing shift field data on transformer side

Table 8: Zero-crossing shift field data on electric energy meter side


Figure 11: Result of user-transformer relation identification
In Fig. 11, the actual user-transformer relation refers to the class membership of the physical energy meters to the transformer, which can be determined by switch-in and switch-out operations. To facilitate data analysis, the results are categorized and recorded in Tab. 9. Through comparison, it can be seen that the cluster centers obtained by KFCM and IQPSOKFCM clustering are basically consistent with the zero-crossing shifts at the transformer side. By using the proposed method, the clustering results show an accuracy of 99.15%, different from the authentic user-transformer relation of only two energy meters. Compared with that of the KFCM algorithm, the accuracy is increased by 10.26% with running time shortened by 37.35 s, an indication that the proposed method has a higher accuracy and computing efficiency. The zero-crossing shift data is fundamentally consistent in the same station area but significantly different in different station areas. To classify the user-transformer relations according to this theory, the IQPSO-KFCM algorithm proposed in this paper is very effective in identifying user-transformer relations in two station areas that are quite similar. It can be seen through analysis that in both clustering analysis methods, the energy meters in question are very close in the zero-crossing shift data. In reality, they are usually energy meters located at the junctions between two station areas. With the development of the power supply, distribution network and on-site line transformation, there are many intersections in the actual station areas, making it hard to distinguish the station areas clearly. However, the method proposed in this paper can handle this well, and thus will have an extremely wide range of application scenarios where it can actually identify the user-transformer relations.
Table 9: Statistics result of user-transformer relations identification

Observing the intricate low-voltage power grid, messy user-transformer relations, and management difficulty in China, the paper proposes an identification method for user-transformer relations based on IQPSO and KFCM. Its main contributions includes the following parts: (1) An improved PSO optimization algorithm (IQPSO) is proposed. The Attractor Multiple Update Strategy, Perturbation Strategy of Potential-Well Characteristic Length and Dynamic Crossover Strategies are introduced in IQPSO, which avoids PSO from falling into local optimal problems and improves global optimization of the optimization algorithm. (2) An improved FCM algorithm (KFCM) is proposed. KFCM introduced a kernel function to solve the linear inseparability problem. To make full use of data, KFCM introduces a fitness function based on the distance between classes to improve clustering performance for the clustering algorithm. (3) Adopting 6 benchmark functions and 5 UCI datasets to simulate the IQPSO algorithm and IQPSO-KFCM algorithm respectively, and fully explaining the superiority of the algorithm in global optimization and cluster analysis; (4) Adopting the IQPSO-KFCM algorithm to solve the problem of identifying the actual user-transformer relations and properly achieving the goal.
However, based on zero-crossing shift data, the proposed method can only determine the class membership of the energy meters to the transformer but cant sort the membership phases of energy meters. Next, we are going to analyze the grid voltages and current data and explore applying the fuzzy clustering algorithm in phase splitting of energy meters.
Funding Statement: This work was supported by the National Natural Science Foundation of China (61671208).
Conflicts of Interest: The authors declare that they have no conflicts of interest to report regarding the present study.
1. Yuan, C. (2014). The development and manufacture of a multi-function equipment for low voltage area identified. Dalian, China: Master. Dalian University of Technology. [Google Scholar]
2. Zhao, Y. D. (2016). An automatic determination method of smart meters transformer area distinguish. North China Electric Power, 5, 22–28. [Google Scholar]
3. Zhao, G., Jiang, C., Liu, J. (2019). Research on the system and control strategy of an AC–DC hybrid single-phase electric energy router. Electronics, 8(9), 970–989. DOI 10.3390/electronics8090970. [Google Scholar] [CrossRef]
4. Ye, A., Gu, J., Zhang, X. (2018). Intelligent transformer room recognition technology based on temporal and spatial data correlation. Modern Electronics Technique, 41, 30–33. [Google Scholar]
5. Zhang, L., Lu, W., Liu, X., Pedrycz, W., Zhong, C. (2016). Fuzzy C-means clustering of incomplete data based on probabilistic information granules of missing values. Knowledge-Based System, 99(C), 51–70. DOI 10.1016/j.knosys.2016.01.048. [Google Scholar] [CrossRef]
6. Liao, L., Zhou, J., Zou, Q. (2013). Weighted fuzzy kernel-clustering algorithm with adaptive differential evolution and its application on flood classification. Natural Hazards, 69(1), 279–293. DOI 10.1007/s11069-013-0707-x. [Google Scholar] [CrossRef]
7. Arslan, O., Dan, P. G., Koditschek, D. E. (2017). Coordinated robot navigation via hierarchical clustering. IEEE Transactions on Robotics, 32(2), 352–371. DOI 10.1109/TRO.2016.2524018. [Google Scholar] [CrossRef]
8. DePrince, A. E., III, Kennedy, M. R., Sumpter, B. G., Sherrill, C. D. (2014). Density-fitted singles and doubles coupled cluster on graphics processing units. Molecular Physics, 112(5–6), 844–852. DOI 10.1080/00268976.2013.874599. [Google Scholar] [CrossRef]
9. Hajek, B., Wu, Y. H., Xu, J. M. (2014). Achieving exact cluster recovery threshold via semidefinite programming. IEEE Transactions on Information Theory, 62(5), 2788–2797. DOI 10.1109/TIT.2016.2546280. [Google Scholar] [CrossRef]
10. Wade, S., Ghahramani, Z. (2018). Bayesian cluster analysis: Point estimation and credible balls (with discussion). Stastics, 13, 559–626. [Google Scholar]
11. Javadi, S., Hashemy, S. M., Mohammadi, K., Howard, K. W. F., Neshat, A. (2017). Classification of aquifer vulnerability using K-means cluster analysis. Journal of Hydrology, 549, 27–37. DOI 10.1016/j.jhydrol.2017.03.060. [Google Scholar] [CrossRef]
12. Granato, D., Santos, J. S., Escher, G. B., Ferreira, B. L., Maggio, R. M. (2018). Use of principal component analysis (PCA) and hierarchical cluster analysis (HCA) for multivariate association between bioactive compounds and functional properties in foods: A critical perspective. Trends in Food Science & Technology, 72, 83–90. DOI 10.1016/j.tifs.2017.12.006. [Google Scholar] [CrossRef]
13. Jin, L., Fu, M. Y. (2013). Images segmentation based on genetic_kernel fuzzy C-means clustering algorithm. Pattern Recognition & Artificial Intelligence, 26(2), 205–210. [Google Scholar]
14. Liu, Y., Liu, F., Hou, T., Zhang, X. (2016). Kernel-based fuzzy C-means clustering method based on parameter optimization. Journal of Jilin University (Engineering Science), 46(1), 246–251. [Google Scholar]
15. Chen, L., Chen, C. L. P., Lu, M. (2011). A multiple-kernel fuzzy C-means algorithm for image segmentation. IEEE Transactions on Systems, Man, and Cybernetics, Part B (Cybernetics), 41(5), 1263–1274. DOI 10.1109/TSMCB.2011.2124455. [Google Scholar] [CrossRef]
16. Ding, Y., Fu, X. (2015). Kernel-based fuzzy C-means clustering algorithm based on genetic algorithm. Neurocomputing, 188, 233–238. DOI 10.1016/j.neucom.2015.01.106. [Google Scholar] [CrossRef]
17. Liu, Y. L., An, J. C. (2018). Optimized kernel fuzzy C-means clustering algorithm. Microelectronics & Computer, 35(2), 79–83. [Google Scholar]
18. Huang, B. M. (2014). Researches in kernel-based fuzzy C-means clustering algorithm based on GA optimization. Wuhan, China: Master, Wuhan University of Science and Technology. [Google Scholar]
19. Sun, J., Feng, B., Xu, W. B. (2004). Particle swarm optimization with particles having quantum behavior. Proceedings of the 2004 Congress on Evolutionary Computation, pp. 325–331, Portland, OR, USA. [Google Scholar]
20. Zhang, Y. Y., Jin, Z. G. (2018). Quantum particle swarm optimization algorithm for high-dimensional multi-modal optimization. Journal of Harbin Institute of Technology, 50(11), 50–58. [Google Scholar]
21. Li, Y. C., Li, Z. P., Yang, L. Q., Wang, B. (2017). An improved quantum differential evolution algorithm for optimization and control in power systems including DGs. Acta Automatica Sinica, 43(7), 195–203. [Google Scholar]
22. Chen, H., Zhu, J., Ruan, Y., Liu, Z., Zhao, S. (2016). Quantum particle swarm optimization algorithm with crossover operator. Journal of Southeast University (Natural Science Edition), 46(1), 23–29. [Google Scholar]
23. Zhang, L., Nie, Y. (2016). Quantum behaved particle swarm optimization algorithm merging differential evolution. Computer Simulation, 33(2), 313–316. [Google Scholar]
24. Duan, Q., Li, Q. (2017). Rational solutions of the general nonlinear schrödinger equation with derivative. Mathematics in Practice and Theory, 47(3), 224–230. [Google Scholar]
25. Xie, B., Feng, X. (2017). Toward efficient and accurate interface capturing on arbitrary hybrid unstructured grids: The THINC method with quadratic surface representation and Gaussian quadrature. Journal of Computational Physics, 349, 415–440. DOI 10.1016/j.jcp.2017.08.028. [Google Scholar] [CrossRef]
26. Sun, X. Y., Chen, S. S., Gong, D. W., Zhang, Y. (2014). Weighted multi-output gaussian process-based surrogate of interactive genetic algorithm with individual 0s interval fitness. Acta Automatica Sinica, 40(2), 172–184. [Google Scholar]
27. Pang, N., Zhang, J. F., Qin, X. (2018). A subspace clustering algorithm of categorical data using multiple attribute weights. Acta Automatica Sinica, 44(3), 517–532. [Google Scholar]
 | This work is licensed under a Creative Commons Attribution 4.0 International License, which permits unrestricted use, distribution, and reproduction in any medium, provided the original work is properly cited. |