| Computer Modeling in Engineering & Sciences |
DOI: 10.32604/cmes.2021.013674
ARTICLE
GPU-Based Simulation of Dynamic Characteristics of Ballasted Railway Track with Coupled Discrete-Finite Element Method
1State Key Laboratory of Structural Analysis for Industrial Equipment, Dalian University of Technology, Dalian, 116023, China
2School of Civil Engineering, Dalian Jiaotong University, Dalian, 116028, China
3Transportation Institute, Inner Mongolia University, Hohhot, 010070, China
*Corresponding Author: Shunying Ji. Email: jisy@dlut.edu.cn
Received: 17 August 2020; Accepted: 04 November 2020
Abstract: Considering the interaction between a sleeper, ballast layer, and substructure, a three-dimensional coupled discrete-finite element method for a ballasted railway track is proposed in this study. Ballast granules with irregular shapes are constructed using a clump model using the discrete element method. Meanwhile, concrete sleepers, embankments, and foundations are modelled using 20-node hexahedron solid elements using the finite element method. To improve computational efficiency, a GPU-based (Graphics Processing Unit) parallel framework is applied in the discrete element simulation. Additionally, an algorithm containing contact search and transfer parameters at the contact interface of discrete particles and finite elements is developed in the GPU parallel environment accordingly. A benchmark case is selected to verify the accuracy of the coupling algorithm. The dynamic response of the ballasted rail track is analysed under different train speeds and loads. Meanwhile, the dynamic stress on the substructure surface obtained by the established DEM-FEM model is compared with the in situ experimental results. Finally, stress and displacement contours in the cross-section of the model are constructed to further visualise the response of the ballasted railway. This proposed coupling model can provide important insights into high-performance coupling algorithms and the dynamic characteristics of full scale ballasted rail tracks.
Keywords: Ballasted track; coupled discrete element-finite element method; GPU parallel algorithm; dynamic characteristics
As a traditional railway transportation structure, ballasted railway tracks typically comprise steel rails, fastening systems, sleepers, ballast, sub-ballasts, embankments, and foundations. Owing to the advantages of low price, easy maintenance, sufficient drainage, and vibration reduction, ballasted railways are still the most typical used railway structure [1]. When a rail is operating on a track, the impact force exerted by wheels on a rail is transmitted to the ballast layer and foundation through sleepers. Owing to the discrete feature of the ballast layer, ballast rearrangement, edge breakage, abrasion, and fragmentation occur during the long-term operation of tracks [2]. The ballast layer forms accumulated deformation and degradation, which causes an uneven settlement of the ballasted bed and affects passenger comfort and driving safety [3–5].
The finite element method (FEM) can be used to represent different ballasted railway structures as continuums on a macro scale. By adopting different element types and material properties, the continuums can be used to study the dynamic response between structures [6]. Therefore, the FEM provides invaluable insight into the understanding of the macro dynamic response of ballasted railway tracks under traffic loading. However, the ballast bed is composed of many discrete granules. Under traffic loading, the contact state and local motion between ballast granules affect the dynamic behaviour of a ballasted track [7]. Due to the discontinuity, inhomogeneity and random characteristic of ballast assemblies, the finite element model of a ballasted track is limited by the effects of ballast gradation, porosity, shape, and other important parameters on the degradation of ballast. These significant factors are the main reasons that affect the uneven settlement and deterioration of ballasted railway track.
Proposed by Cundall et al. in 1979 [8], the DEM (discrete element method) is an efficient simulation method for the study of discrete media. The method for simulating the ballast bed can remedy the shortcoming of FEM in characterizing the meso-mechanical behaviour of ballast. Henceforth, it has been employed widely to studies regarding mechanical behaviours, such as ballast degradation [9–11], ballast fouling [12], ballast breakage [13,14], and polyurethane-reinforced ballasts [15] in ballasted railway tracks. The model constructions of irregular ballasts involve primarily the clump of overlapped spheres [16], cluster formed by bonding spheres [17], polyhedrons [18–20], and dilated polyhedron elements [21]. It is noteworthy that polyhedral particles are much closer to the real shape of ballast, but most researchers prefer clump and cluster methods for discrete elements modelling containing a large number of ballasts for high computational efficiency and convenient business software [22–24]. However, the basic units in DEM are particles and rigid wall elements. If the concrete sleeper and substructure are simplified as clump/cluster model and rigid wall element with different stiffness respectively, its elastic and plastic deformation is not considered, which can lead to ballast movement and force chain redistribution.
As mentioned above, the sleepers and substructure in a ballasted railway structure can be considered as continuous media, whereas the ballast bed is a discrete medium. The interaction between sleeper, ballast bed and substructure can be regarded as a contact problem between continuum and discrete materials. The coupled DEM-FEM combined the advantages in simulating granular and continuum materials and avoided the disadvantages of DEM and FEM alone for the ballasted railway track studies. So, the coupled method can more reasonably and efficiently simulate the dynamic response of ballasted railways at the macro and meso levels.
For coupled DEM-FEM method, it is particularly important to develop coupling algorithms for contact interfaces of different media. Recently, to achieve a contact interaction between a continuum material and a discrete ballast material, interface elements [25–27] and surface coupling elements [28] have been introduced to achieve parameter transfer between the two media through the particle flow code (PFC) and FLAC software. Additionally, the coupled QDEM-FEM can be used to study the impact response of ballasted railway structures [29]. Moreover, based on the Fortran language, a three-dimensional combined discrete-finite element model can be developed to analyse the dynamic behaviour of ballasted railway tracks under cyclic loads [30]. However, considering the large dimension of the ballasted railway model, the low computational efficiency cannot be ignored in simulation process based on CPU serial program.
With the development of computer hardware and the demand for large-scale engineering simulations, CUDA (compute unified device architecture) as a parallel computing platform is released by NVIDIA Company, which overcome the limitations of traditional GPU hardware architecture. It highlights the advantages of GPU in high-performance computing and reduces the difficulty of programming [31]. Therefore, the implementation of a GPU-based parallel procedure becomes possible using CUDA [32]. In DEM simulation, contact search and motion update between particles take up tremendous calculation time in the entire simulation process. Using GPU parallel computing, the time-consuming process will be greatly shortened [14]. However, for the simulation of the coupled discrete-finite element model, the contact search between discrete particles and finite element surfaces and the transfer process of contact parameters are also more time-consuming in the coupling calculation. A higher requirement has been proposed for the computational efficiency of the coupled DEM-FEM [33]. It is necessary to develop a coupled DEM-FEM based on GPU parallel computing and apply it to ballasted railway track studies.
In this study, a coupled DEM-FEM with GPU-based parallel framework was proposed to analyse the dynamic characteristics of a sleeper, ballast bed and substructure (embankment and foundation). A parameter transfer algorithm was developed between the DEM and FEM in a GPU parallel environment. A benchmark case was selected to verify the precision and reliability of the proposed coupled algorithm. Under different traffic speeds and loads, the dynamic response of the sleeper, ballast layer and the substructure were analysed, which provided invaluable references for high-performance coupling algorithms and the dynamic characteristics of full scale ballasted railway tracks.
2 Coupled Discrete-Finite Element Method of Ballasted Railway Track
2.1 DEM of Ballast Bed Based GPU Parallel Computing
In ballasted railway structures, as natural ballasts appear in complex geometrical shapes, the interlocking effect between adjacent ballasts upon loading can significantly increase the carrying capacity of the ballast layer, thereby resulting in the permanent deformation of the ballast bed. Hence, the clump formed by overlapping spheres was used to simulate the approximate geometry of a ballast. Because the particles in contact with the large overlap in the clump can overlook its contact force, the clump can be regarded as an unbreakable rigid element of irregular shape.
Considering the randomness of the effective size of ballast, the ballast particles were classified firstly according to the Chinese railway special ballast grading standards. To precisely establish the discrete element model of a natural ballast, three-dimensional laser scanning technique was employed to extract and reconstruct the ballast appearance in high-speed railways because this method can accurately reproduce the irregular geometry, sharp edges, and rough surface texture of the scanned ballast. Due to the time-consuming laser scanning process, 143 representative ballasts with different textures and sizes were scanned to establish a ballast library containing clump model. As shown in Fig. 1, the surface of the reconstructed ballasts is composed of a series of triangular meshes. The more faces formed by the triangular meshes, the more accurate is the closed ballast model. Subsequently, based on the particle expansion method, multiple spherical particles are filled into the ballast model with closed boundaries to obtain a clump of ballasts. In the filling method, the smaller the filled particle size and the larger the number, the closer is the clump to the natural ballast; however, the large number of filled particles will cause the lower computational efficiency. Hence, each ballast model was filled with 5–15 spherical particles of diameter 18–30 mm in this study.
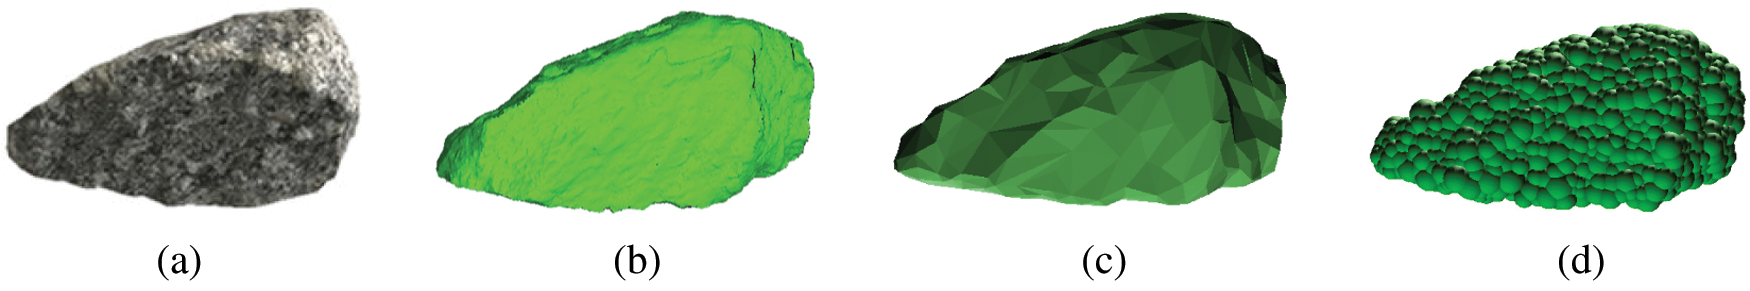
Figure 1: Clump model generation of ballast (a) ballast (b) surface scanning (c) mesh boundary (d) clump model
For the contact law of ballast clump model, the linear spring model [8] and simplified Hertz–Mindlin model [34] were used generally. Besides, there is also a Conical Damage Model (CDM) that is more suitable for the simple clump model was reported [35,36]. In this paper, the contact force between particles in contact was calculated using a nonlinear viscoelastic model. Fig. 2 showed the contact model between spherical particles in DEM. The Hertz contact theory is generally used to calculate the normal contact force between spherical particles, including the elastic force and viscous force, which can be expressed as follows:

where  is the normal contact force,
  the normal stiffness,
  the normal overlap,
  the normal relative velocity between the particles in contact; A is a dimensionless coefficient that depends on four factors, i.e., the material’s elastic modulus, viscosity coefficient, and Poisson’s ratio, and coefficient of restitution when particle collision occurs [37].
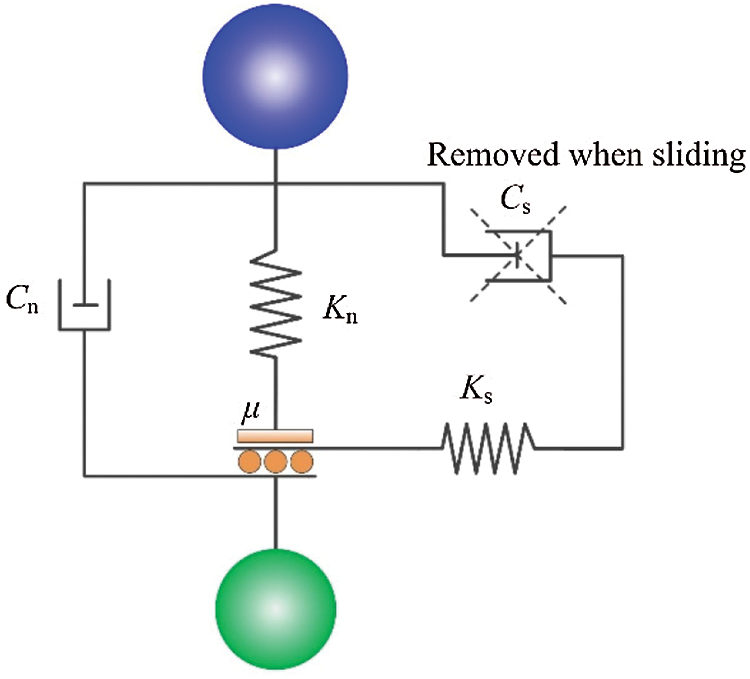
Figure 2: Contact model between spherical particles in DEM
Without considering the viscous force, the tangential contact force between particles can be calculated incrementally based on the Mohr-Coulomb friction law, as follows [38]:


where  is the tangential contact force,
  the tangential stiffness,
  the tangential overlap between the particles in contact, and
  the static friction coefficient.
The normal and tangential stiffness of the particles  and
and  can be calculated as follows, respectively:


where  ,
,  ,
,  , and
, and  ; E,
; E,  , and G are the elastic modulus, Poisson’s ratio, and shear modulus of the particles, respectively; RA and RB are the radii of the two particles in contact.
During the computational process of the discrete element, the formula for calculating the maximum time step  is [39]

where  is the minimum radius of the particle, and
  is the density of the particle. In the actual simulation calculation, the time step
  is smaller than the maximum value, i.e.,

where the coefficient  is an empirical coefficient. Generally, when the coordination number of the particles is high (> 4),
  ; on the contrary, when the particle coordination number is low (< 4),
  [39]. Because of the dense arrangement of the ballast particles,
  .
.
In the DEM simulation, the central difference method was used to solve the dynamic equation. During the movement of the irregular ballast, the ballast mass and moment of inertia are important parameters. The finite segmentation method can be used to obtain the ballast mass accurately. Meanwhile, the movement parameters, such as the moment and angular velocity of the ballast, can be calculated and updated using the quaternion method, which can convert between global and local coordinate systems [40].
It is well known that neighbour search and contact judgment between particles in DEM is the key parts which affect calculating efficiency. In discrete element simulation based on GPU parallel computing, the cell list method is used to make the contact judgment between particles [41]. Calculation domain of discrete particles is divided into many space cells whose size is slightly larger than particle diameter. In this way, each particle only interacts with other particles in the same cell or adjacent cells. Therefore, the cell number is independent of the size of the simulation model when neighbour search between particles has been done. In the contact search between particles, take the cell where the particle is located as the central cell,  cells are adopted to determine the neighbour particle list. The search algorithm can obtain a higher speedup ratio on a multi-core processor with shared memory. Moreover, in GPU-based parallel computing, it can show high computational efficiency both particle search and contact force transmission [41]. The process of the search algorithm is as follows:
1. Determine space cell of computing domain and cell label where particles are located, as shown in Fig. 3;
2. Obtain sorted particle label based on the cell label and recorded the minimum and maximum particle labels  ,
,  in each cell, as shown in Fig. 4;
3. Create a neighbour particle array  for particle i and obtain the number of neighbour particles with j > i which is stored in the array
  ;
;
4. The prefix sum  is computed for the array
  ,
,  ;
;
5. Obtain contact candidate pair list  (
( ) and contact candidate pairs
  and
and  for contacting two particles;
6. Compute contact force between contacting particles;
7. Update particle information (displacement, velocity, etc.)
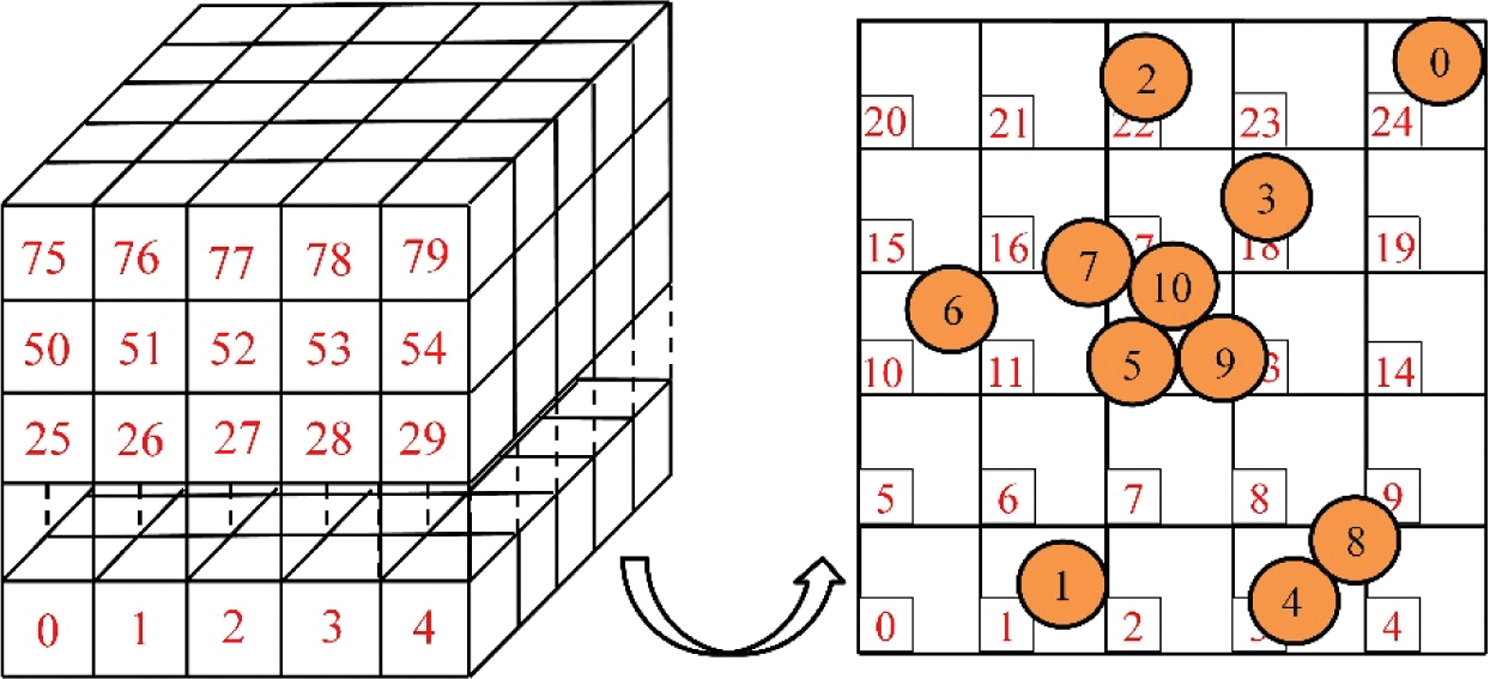
Figure 3: Particle position in the space cell
Figure 4: Sorted particle and the maximum and minimum particle labels in each cell. (a) Soted particle. (b) Maximum and minimum particle lables in each cells
2.2 FEM of Sleeper and Substructure
Concrete sleepers and substructures in railway structures demonstrate excellent rigidity and bearing capacity. Macroscopically, because both of them can be regarded as continuous media, based on the FEM, a 20-node hexahedral solid element was applied to construct the sleeper and substructure (embankment and foundation), as shown in Fig. 5.
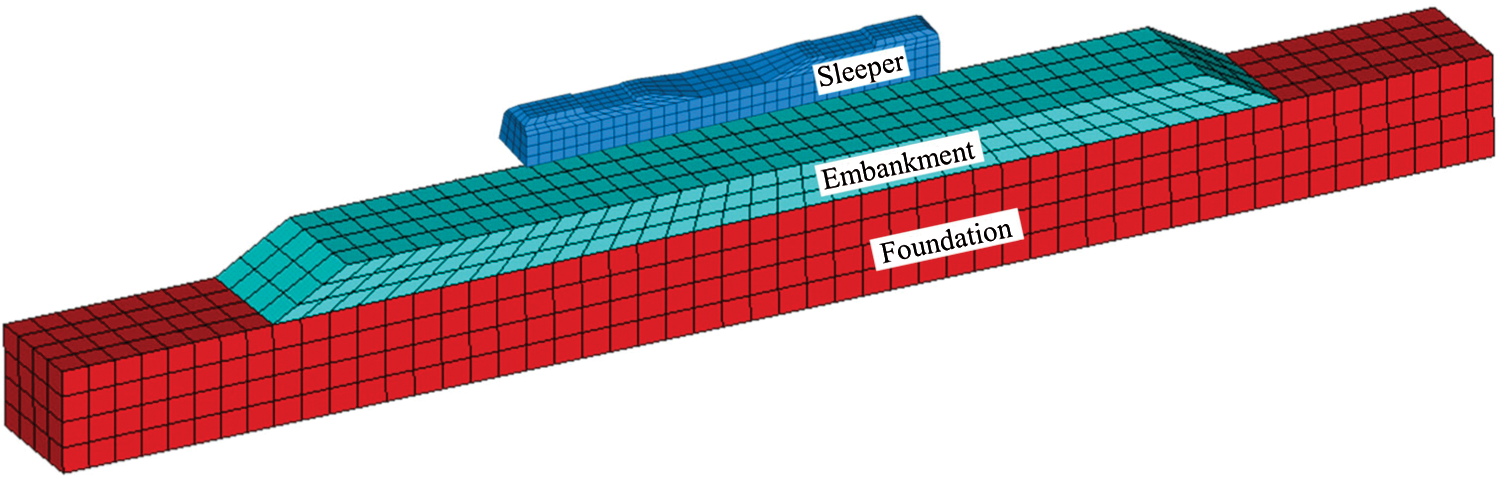
Figure 5: The FEM model of sleeper and substructure
Besides, the Newmark method [42] was used to solve the dynamic equation. On the nonlinear dynamic analysis of the embankment, the Newton–Raphson method was employed for an iterative calculation at each time step [42].
2.3 Coupled Algorithm of the Discrete-Finite Element Based on GPU Parallel Computing
Regarding the simulation calculation of the coupled discrete-finite element model of the ballasted railway, the most critical aspect is to contact search and transfer the calculation parameters on the contact interface. Fig. 6 shows the flow chart of the coupled DEM-FEM method used in this study. The code in the DEM was based on the CUDA/C++ language and compiled in the GPU parallel environment [41], whereas a serial compilation based on the C++ language was adopted in the FEM.
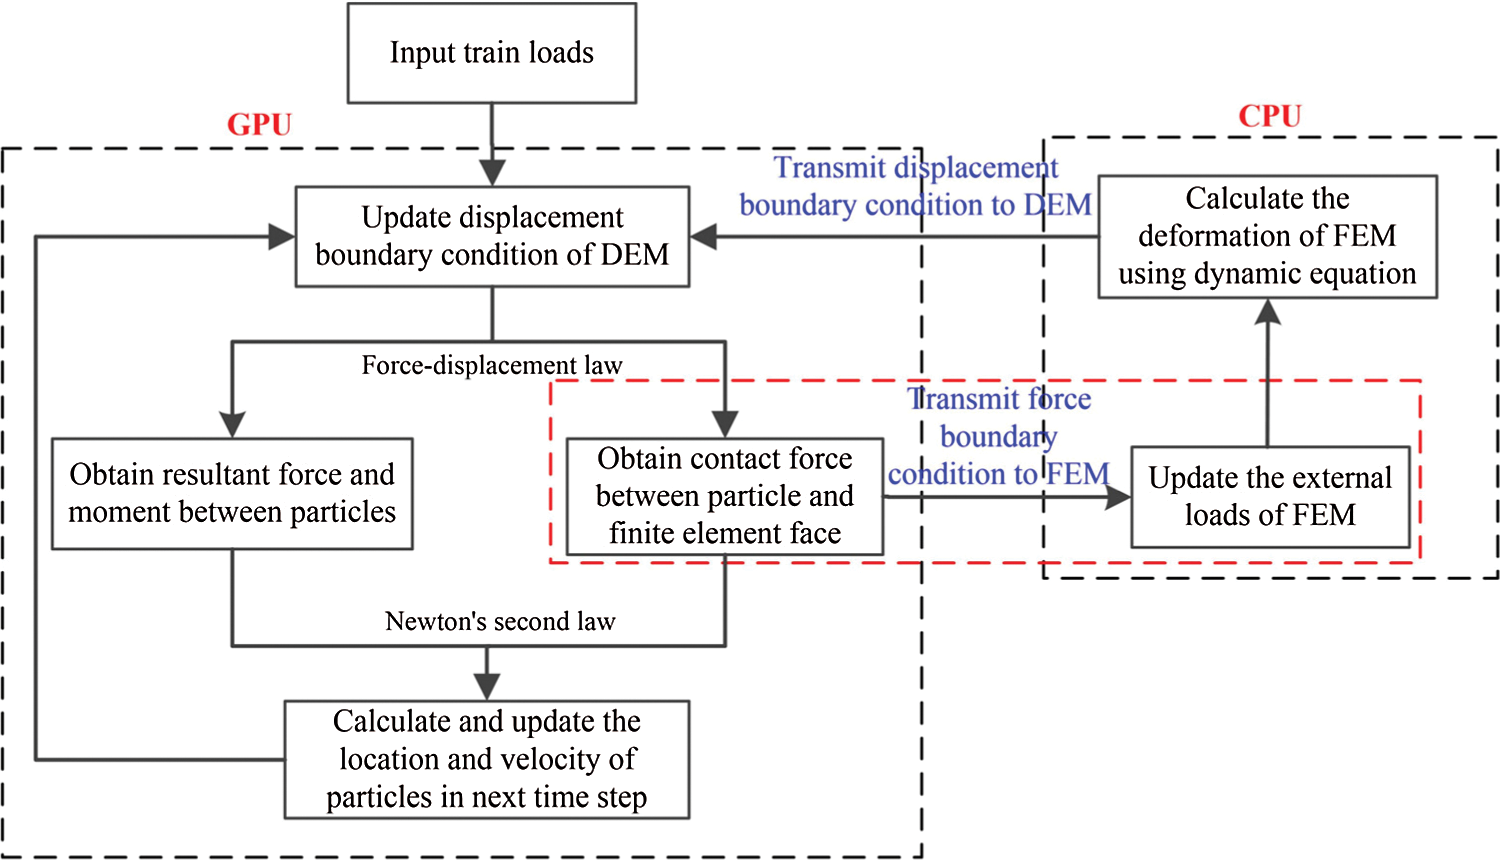
Figure 6: The flow chart of the coupled DEM-FEM
During coupling, as the force boundary condition for the dynamic calculation, the contact force  of the discrete particles applied on the structure can be equivalent to the nodal force
  and transferred to the continuum zone. Subsequently, as the displacement boundary condition, the interface displacements
  and velocities
  can be obtained from the continuum zone and transferred to the discrete zone. The coupling idea is typical in discrete and continuous coupling methods [25].
For the coupling model between the ballast grain and hexahedral solid element in three dimensions, the corresponding coupling interfaces must first be extracted, as shown in Fig. 7. Because the particles are in contact with only the surface of the structure meshed by solid elements, only the surface of the structure need to be extracted as the coupling interface between the discrete and finite elements, without considering the shared faces of the solid element. This pretreatment will significantly reduce the number of finite element faces that need to perform a contact search and improve the search efficiency between particles and finite element faces in GPU-based parallel simulation. Finally, the interface coupling between the ballast element and the hexahedral solid element can be transformed into an interface coupling between the spherical particle and quadrilateral element face.
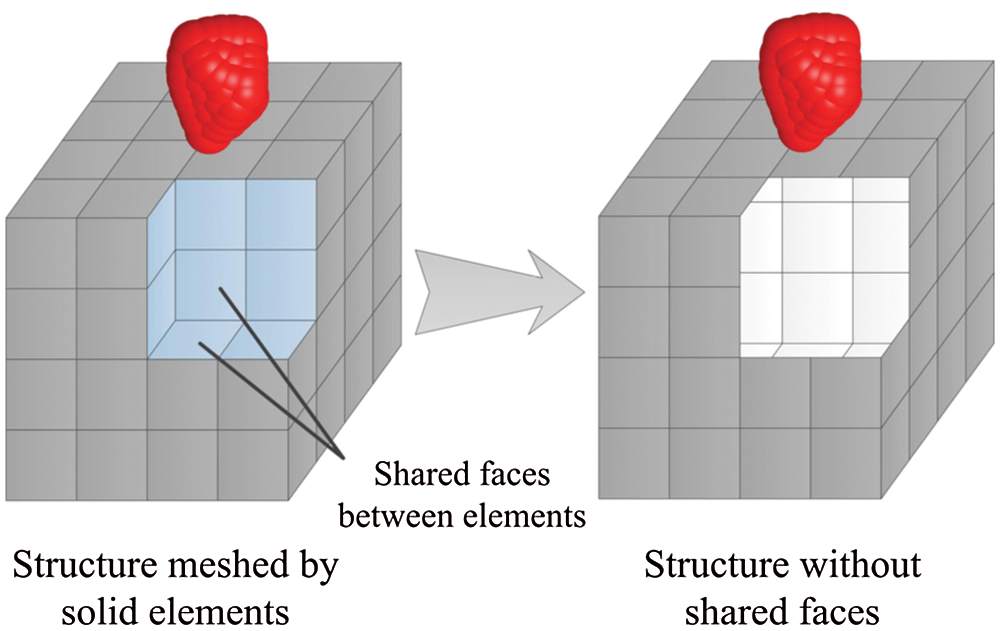
Figure 7: Coupling interface extraction between ballast clump model and hexahedral element
During coupling, contact information between particles and element faces can be obtained, such as the number of contacts, contact force, contact position and the serial number of element face in a GPU parallel computation. The information must be transferred accurately to the finite element model and a dynamic calculation of the continuum zone must be performed in a CPU. However, the calculation results in DEM are distributed randomly in GPU memory, which increases the difficulty in transferring the contact parameters accurately. In the study, the sort function in the Trust library of CUDA was used to reorder the calculation results of the discrete zone. Using a highly optimised radix sorting algorithm, this function is faster than sorting algorithms based on data comparisons.
Fig. 8 illustrates the algorithm of contact search and parameter transfer in the GPU-based parallel environment. First, a contact search based on the inside–outside method [43] is performed on the element faces in the continuum zone, where each element face is assigned to a thread in the GPU. Based on the spatial grid method, each finite element face can only search the discrete element particles in the neighbour grid. If the particles established contact with the finite element face, relevant calculation parameters must be stored in the corresponding array. Such as the array ContactN and ContactF are used to store the contact number and contact force. The array Sort_ Num which defaults to 1 records the negative thread ID (thread.x). Subsequently, the inclusive_ scan and sort_by_key functions in the Thrust library in CUDA are adopted to sort the contact information. The inclusive_scan function is performed to sort the array ContactN in the form of prefix sum, where the last cell represents the total number of DE-FE contacts. The sort_ by_key function can be easily parallelized to determine the effective date (e.g., contact force and contact position). The detailed sorted process of contact information is shown in Fig. 9. Finally, the sorted contact parameters are transmitted to the dynamic calculation of the finite element simulation. Hence, with the Thrust library in CUDA, it is easy to transmit the contact numbers, contact forces, and contact position to the corresponding array stored in the CPU.
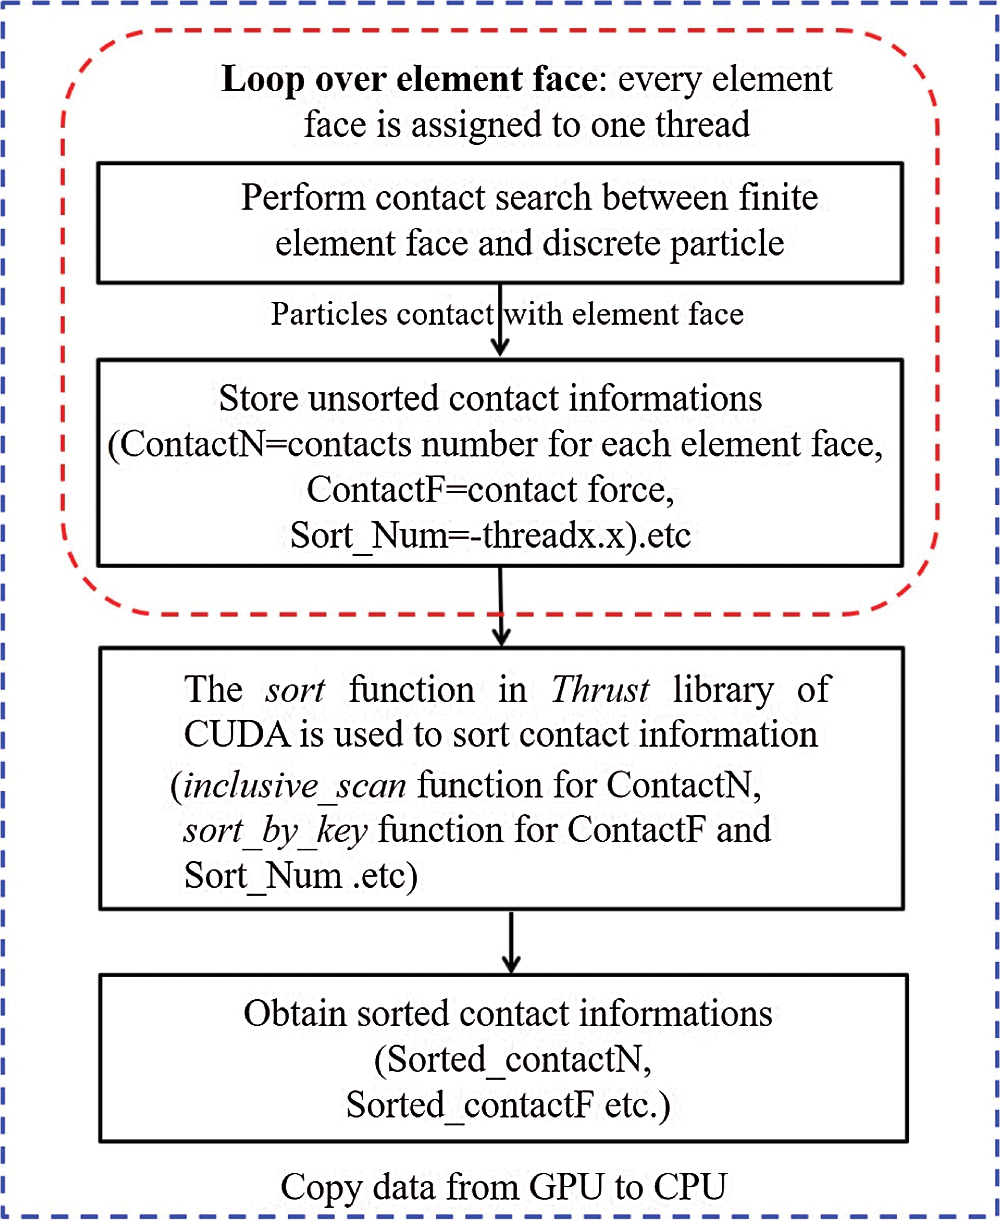
Figure 8: Contact search and parameter transfer scheme on the coupled surface based on GPU parallel computing
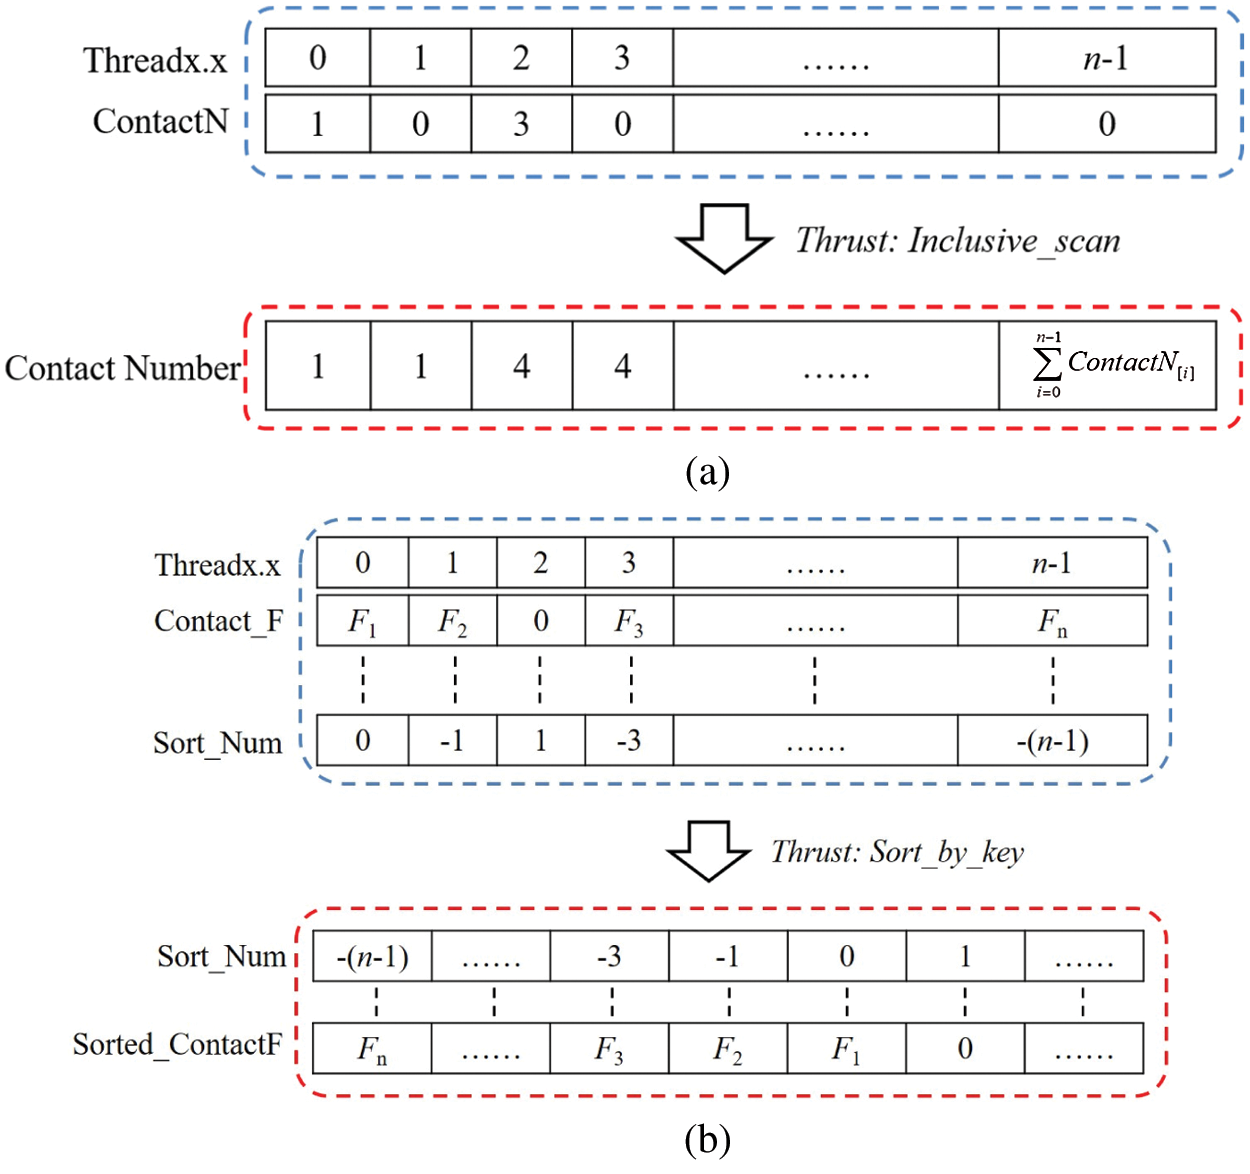
Figure 9: The sorted process of contact information using the sort function in the Trust library of CUDA (a) inclusive_scan function (b) sort_by_key function
For the discrete-continuous model of the ballasted railway, when the ballast grains are in contact with the quadrilateral surface of the solid element, the contact point is typically not located on the node of the element face. Therefore, the contact force must be equivalent to each node on the contact surface. For the isoparametric element with 20 nodes, the appropriate shape function is required for the calculation of the equivalent nodal force on the coupling interface. By referring to the method for solving the shape function of triangular elements by area coordinates, the area coordinate applied to the quadrilateral face with eight nodes [44] can be used to obtain the equivalent nodal forces between the sphere and hexahedral solid elements. This method can avoid time-consuming iterative calculations because it can obtain directly the shape function without the local coordinates of the contact point by the Newton iteration [30].
As shown in Fig. 10,  denotes the coordinates of the contact point in the Cartesian coordinate system when the discrete sphere is in contact with the quadrilateral face. The corner points and midpoints of the side of the quadrilateral are represented by numbers 1–4 and 5–8, respectively. Four dimensionless parameters
  ,
,  ,
,  , and
, and  , the shape feature parameters of the quadrilateral can be expressed as follows:


where A is the area of the quadrilateral;  and
and  represent the areas of triangles of ‘
 124’ and ‘
 123’, respectively.
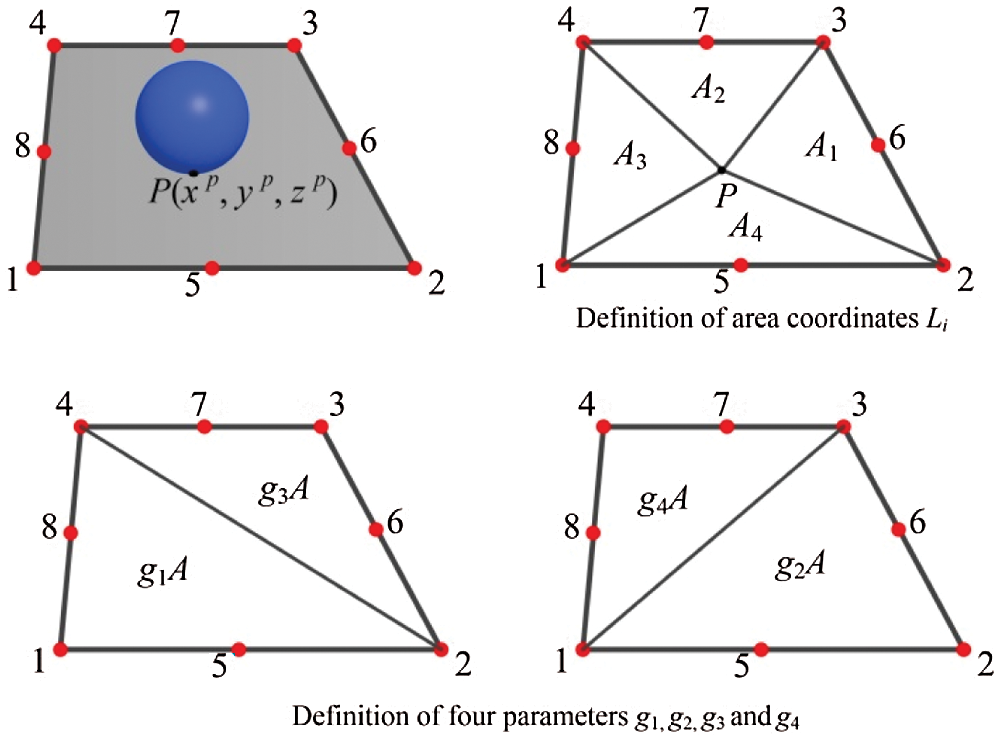
Figure 10: Equivalent nodal force calculation diagram for a quadrilateral face with eight nodes
The area coordinates of the contact point P are defined as follows:

where  is the area of the ith triangle formed by the contact point P and the sides of the quadrilateral.
The relationship between the contact force at contact point P and the equivalent nodal force of the finite element face can be obtained as follows:

where  is the shape function of the ith node on the quadrilateral face;
  is the equivalent nodal force;
  is the contact force at contact point P.
The shape function of the four corner points on the quadrilateral face can be expressed as:
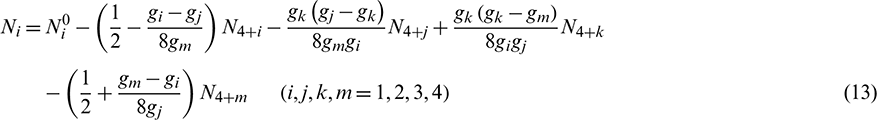
The shape function of the midpoint on the sides is

In the coupling calculation of the discrete–finite element model, the global coordinates 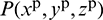 and contact force
  can be easily obtained when the ballast grains are in contact with the quadrilateral face. Subsequently, by combining Eqs. (9)–(14), the equivalent nodal force on the coupling surface can be obtained by interpolating the shape function.
3 Verification of Coupled Algorithm and Establishment of the Coupled Model
To verify the reliability of the coupled algorithm when the particles in the discrete zone contact with element face in the continuum zone, a benchmark case [45] was selected. As shown in Fig. 11, the case chosen is an elastic thin plate which served to enforce a granular ensemble. The deformation and stress of plate under the mass of the granular material was obtained by constraining a certain of displacement boundaries (note that though the finite element faces in Fig. 11 were displayed as triangle face, it does not represent the type of finite element). The elastic plate with a size of  meshed by 20-node hexahedral solid elements. The origin of the coordinate system is located at the centre of the free section at 4 m along the length of the plate. For boundary conditions, the deformations uz in the z-direction are fixed for
  . Meanwhile, in the x-direction, there is
  . Besides, the entire plate in the y-direction is fixed. This result in a free deforming plate for
  .
.
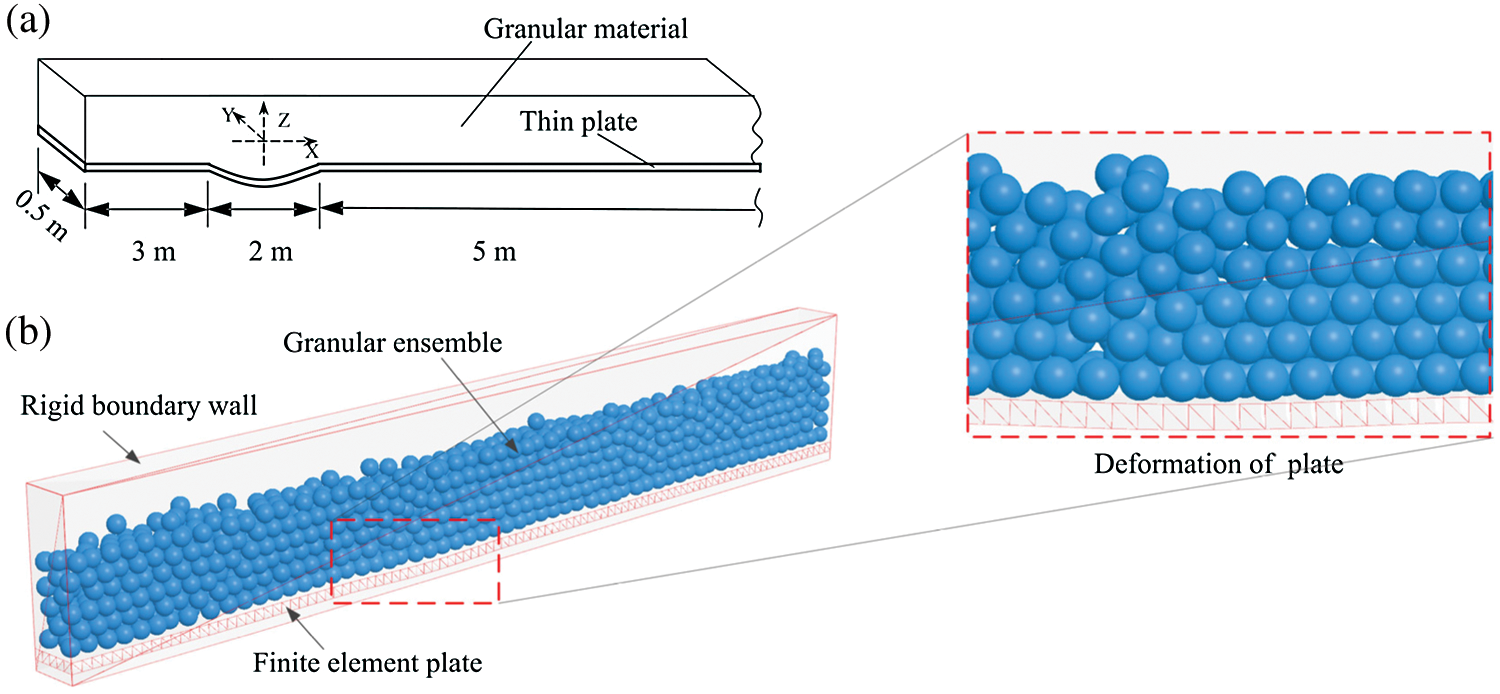
Figure 11: Benchmark case (a) model configuration (b) coupled DEM-FEM model
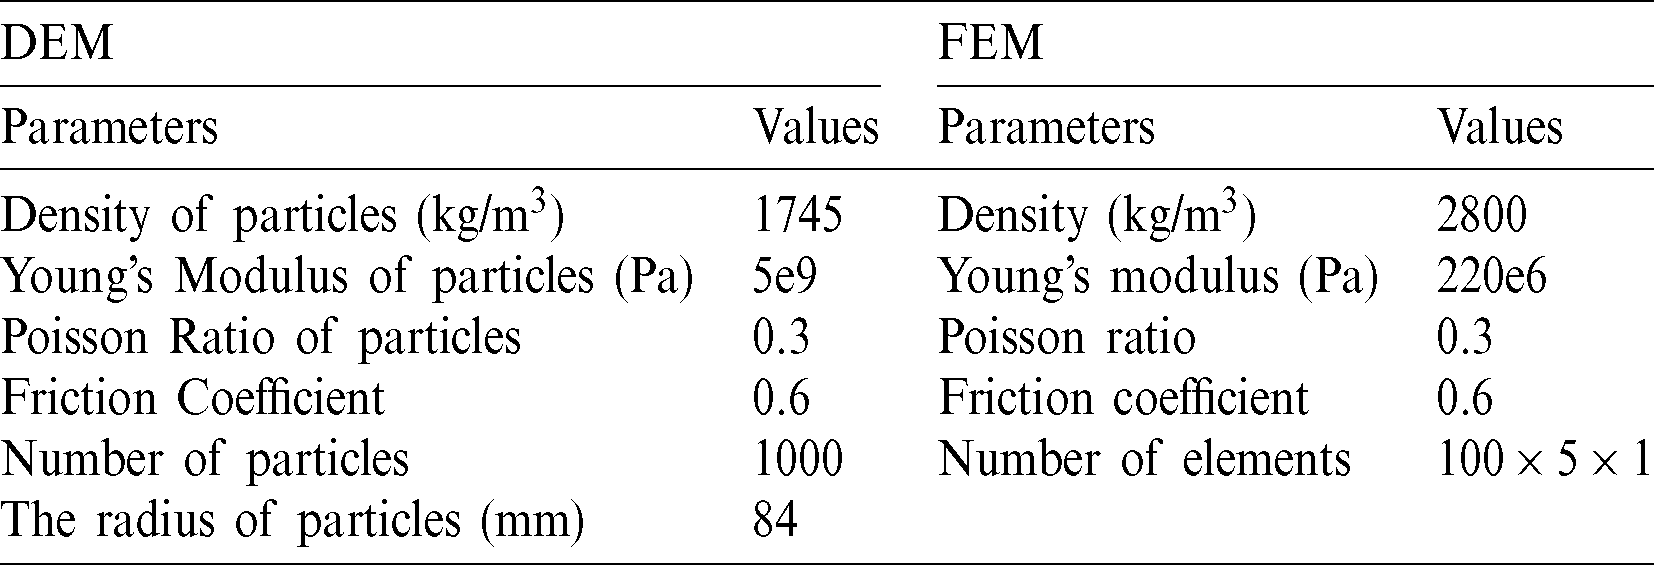
The mass of the granular ensemble is kept constant. So the upper surface of the plate is always subjected to a constant stress load q. Here, take q = 8.5 kPa as an example, the corresponding calculation parameters of the plate and granular material are listed in Tab. 1. Meanwhile, the relationship between particle density  and radius
  can be expressed as:

where As is the upper face area of the plate.  is the acceleration of gravity.
  is the number of particles.
Table 1: Main parameters of the benchmark case
Figs. 12 and 13 show the comparisons of vertical displacement and Vonmise stress distribution between the coupled DEM-FEM simulation and the static analysis using Ansys software. The coupled DEM-FEM results were obtained by the coupled DEM-FEM program developed by authors and displayed using Tecplot software (FEM components were all displayed by this software in the paper). It can be seen that taking into account the load errors caused by the random arrangement of particles on the plate, the distribution and amplitude of displacement and stress calculated by the coupling model are consistent in the static analysis results of Ansys software. Meanwhile, by the comparing displacement curve of the plate in the vertical direction in Fig. 14, the accuracy and reliability of the coupled algorithm were verified.
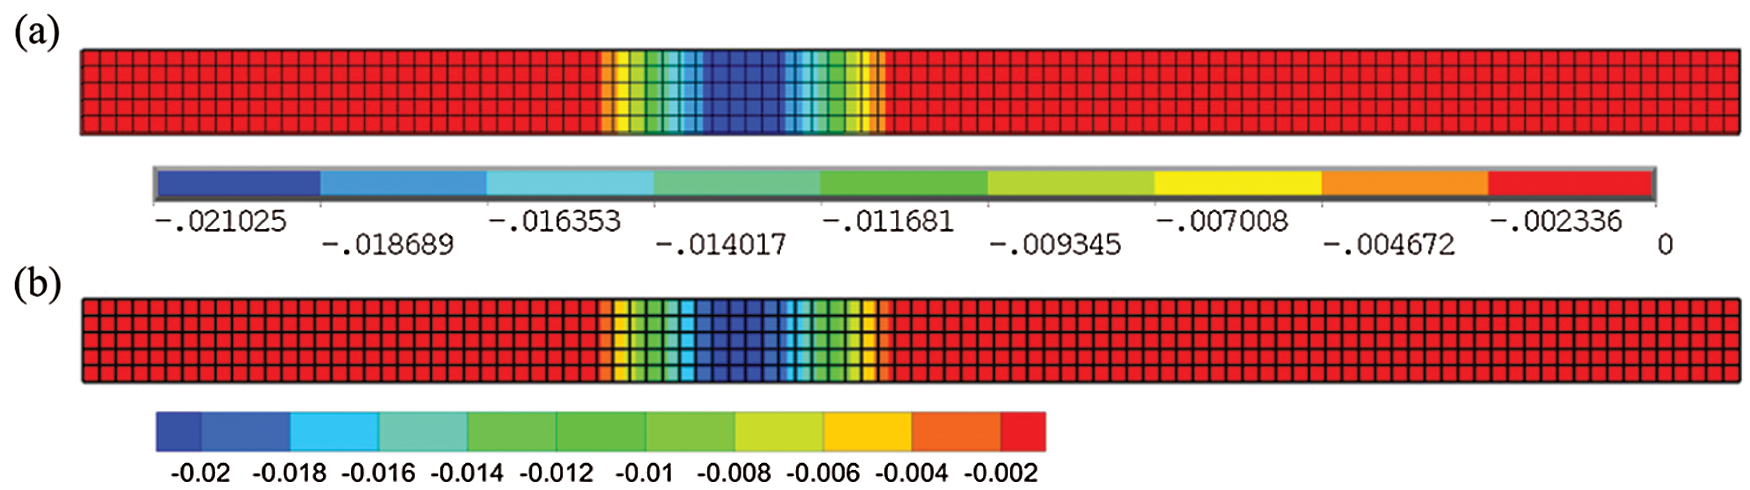
Figure 12: Vertical displacement (a) Ansys result (b) coupled DEM-FEM result
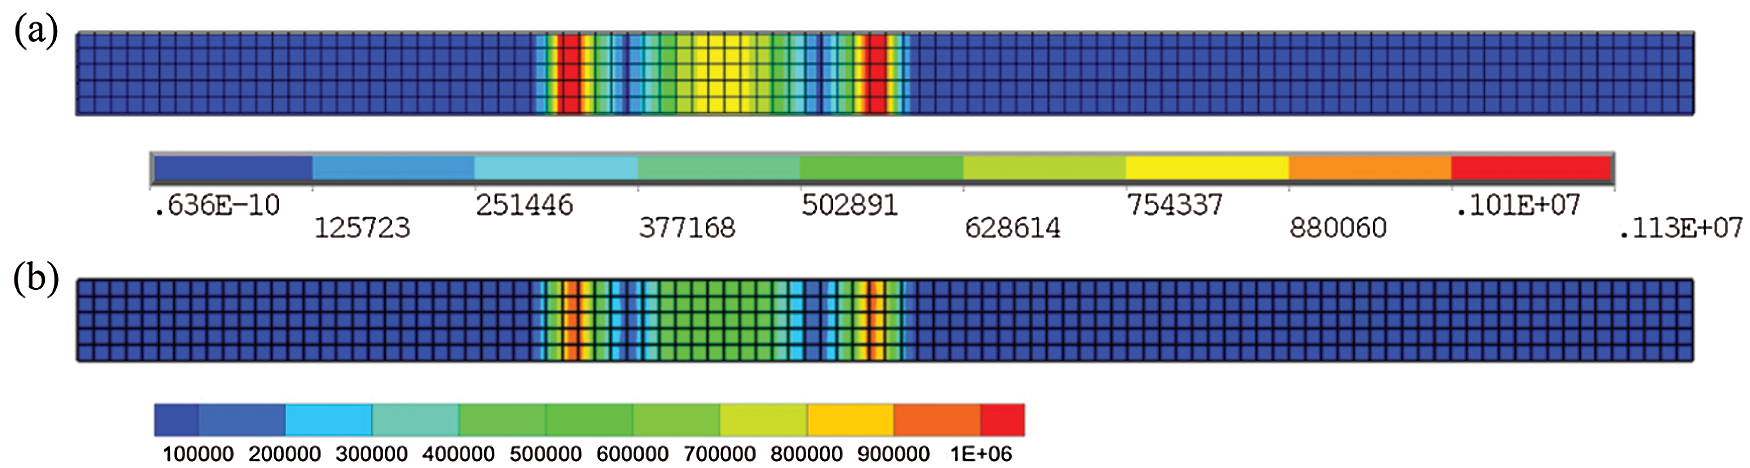
Figure 13: Vonmise stress (a) Ansys result (b) coupled DEM-FEM result
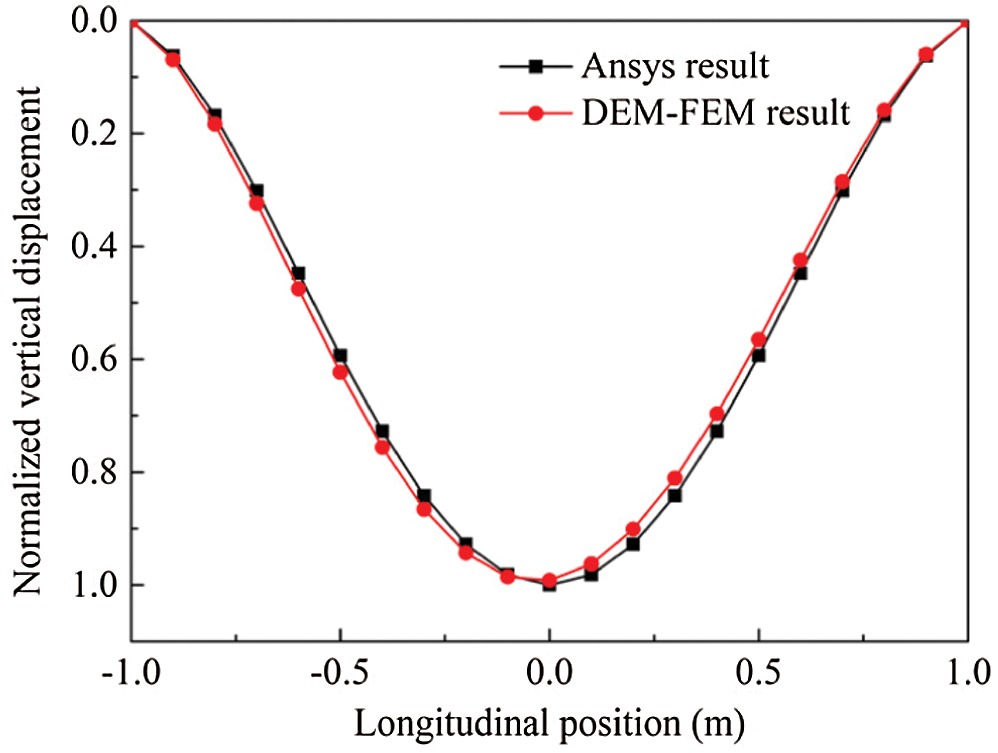
Figure 14: Vertical displacement along longitudinal X-direction
3.2 Coupled Model of Ballasted Railway Track
Based on the proposed DEM-FEM coupling algorithm with GPU-based parallel computing, a calculation model of a ballasted railway track is established, as shown in Fig. 15. The model displayed by SDEM software developed by authors comprises a sleeper, ballast layer, embankment, and foundation from the top to bottom. The sleeper constructed with a solid element measured  in a continuum zone. Meanwhile, the total number of ballast grains in the ballast layer was 31286, and the gradation of the ballast assembly satisfied the Chinese railway special ballast grading standards, as shown in Fig. 16. For the generation method of the ballast bed, a dense spherical particle assembly was firstly generated in the specified area. And then, replace the spherical particles with the clump models of ballast in established ballast library. By setting a lower friction coefficient between the ballasts, the ballast stacking has carried out using gravity sedimentation method, which results in a sufficiently dense granular ballast assembly. Finally, a reasonable ballast bed was generated by geometry clipping method. Detail information of the ballast bed is as follows. The thickness of the ballast layer was 0.35 m; the length of the model was 0.8 m along the longitudinal track line; the slope of the ballast bed was 1:1.75; the height of the shoulder was 0.15 m. A fixed rigid wall boundary was applied to ballast bed. The influence of confining pressure and elastic constraints generated by adjacent sleepers and ballast on the ballast vibration and trainload dispersion were not considered. Zhai et al. [46] indicated through the coupled vehicle-track dynamics simulation that if the shear and damping effects between adjacent ballast bed were ignored, the simulated ballast vibration acceleration could be overestimated by about 6%. Additionally, the embankment and foundation were constructed using an isoparametric solid element with 20 nodes. The total height of the substructure was 1 m. The length of the embankment was 6 m, the height was 0.3 m, and the slope was 1:1.75. The length of the foundation was 10 m and the width was 0.8 m. Besides, the boundary conditions of the finite element model were displacement constraints. The upper surface of the embankment was free. The left and right faces (x−/+ directions) and the front and back faces (y−/+ directions) of the model were constrained with zero displacements in the normal directions. A displacement constraint in the z-direction was applied to the bottom surface.
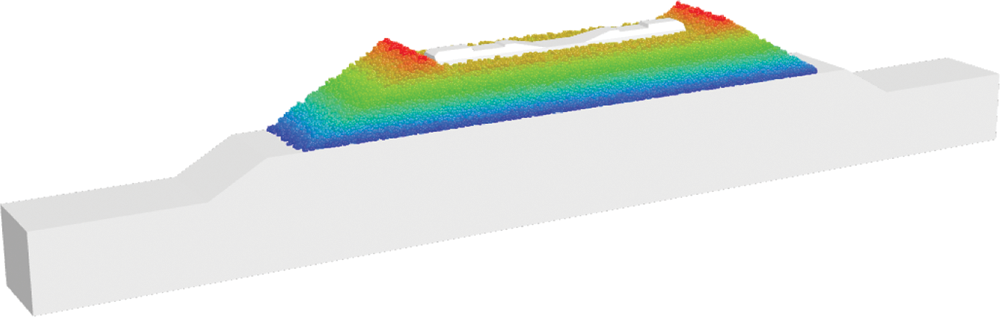
Figure 15: Coupled DEM-FEM of a full-scale ballasted railway track
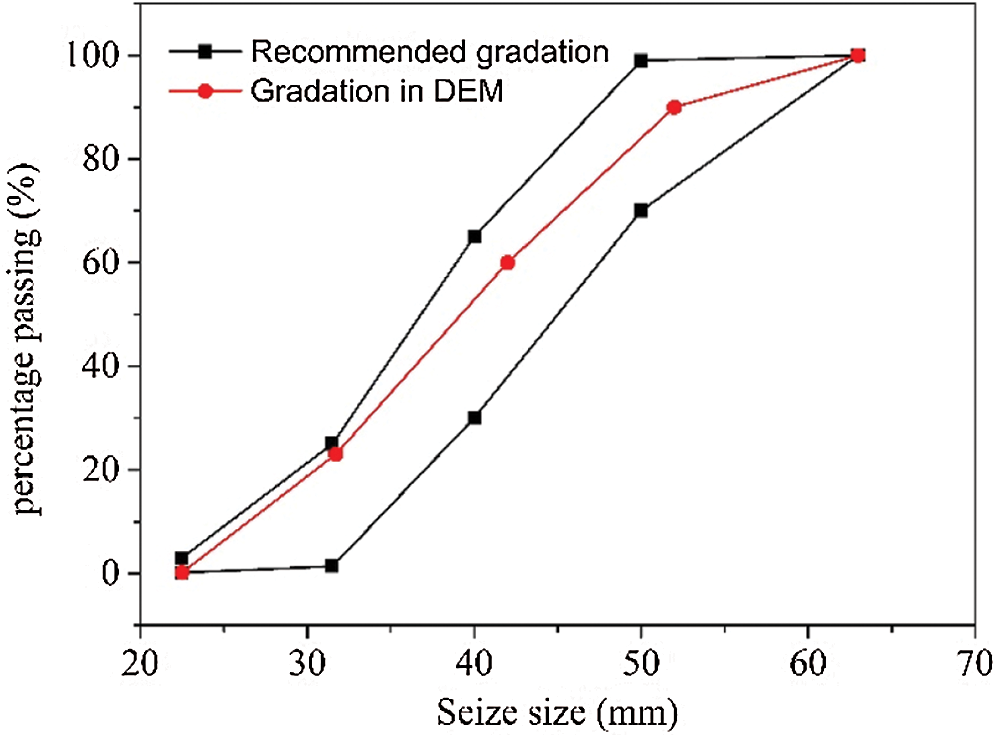
Figure 16: Ballast size grading curve in DEM modelling of ballasted track
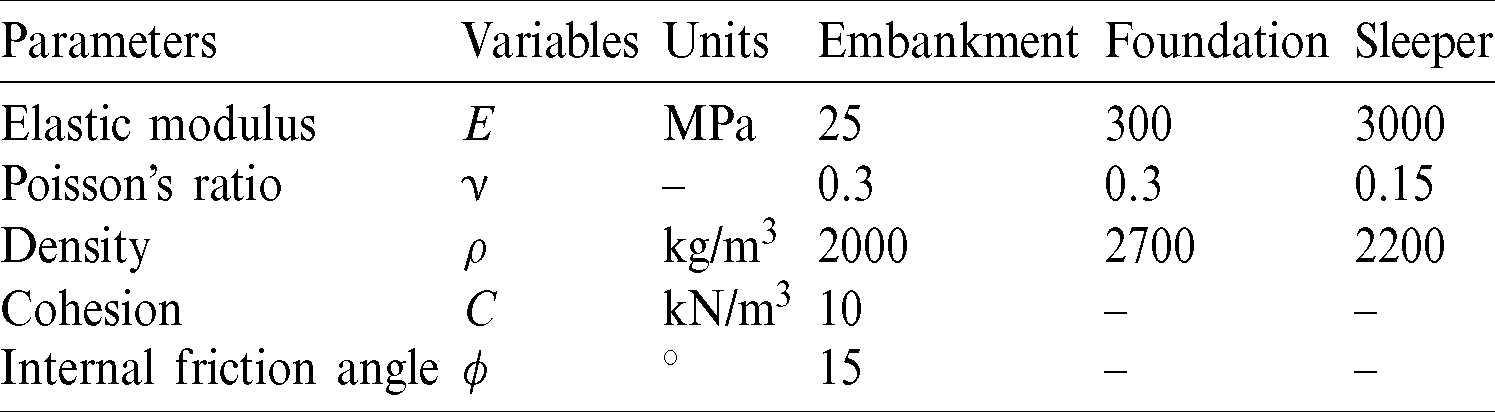
Because the embankment strength is much lower than those of the sleeper and foundation, the Drucker–Prager yield criterion was used for the elastoplastic analysis of the embankment. Furthermore, the linear elastic model was applied to the response behaviour of the sleeper and foundation. In the initialization of coupled simulation, the timestep in DEM was determined firstly (the value is generally about 10−6 s on the time scale). And then given the calculation efficiency and communication between discrete and finite zone, the timestep in FEM was taken as integer multiples of that in DEM (40 times in the paper). Therefore, in the coupled process, the exchanged time interval of contact information on the coupled interface is determined by timestep in FEM. The calculation parameters in the coupling model are shown in Tabs. 2 and 3, respectively.
Table 2: Major computational parameters of ballast in DEM [30]
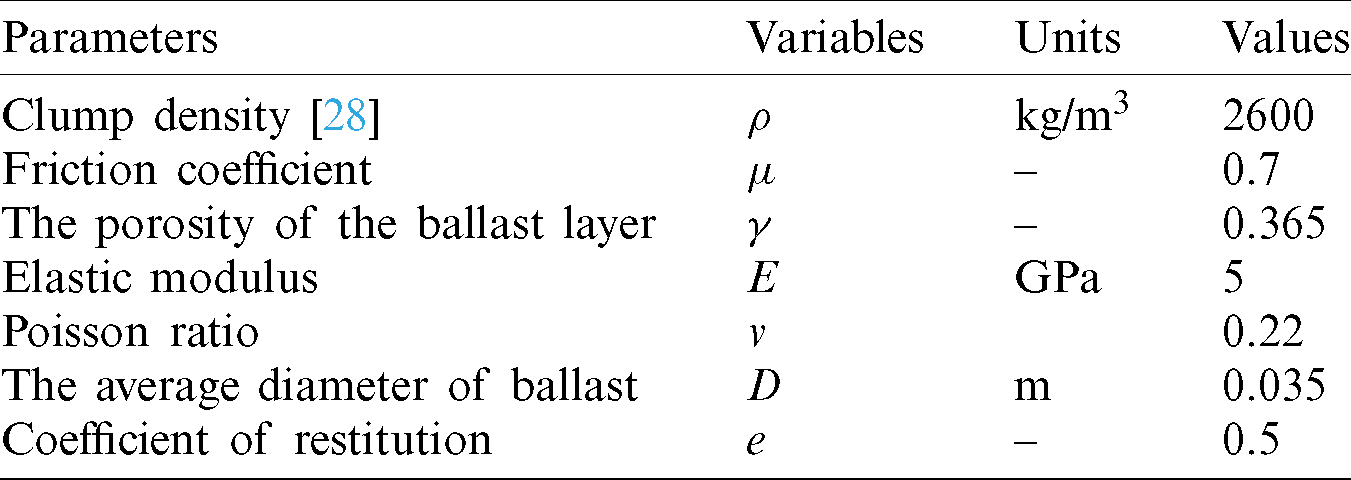
Table 3: Major computational parameters in FEM [30]
4 Numerical Simulation Results and Discussions
The high-speed train load impacts on the rails in the form of wheel-rail forces and is then transmitted to the granular ballast bed through a fastening system and sleeper. In this study, five kinds of the train speeds with 160, 200, 250, 300 and 350 km/h and four cyclic loads with 16, 18, 20 and 22 t were considered and applied to the sleeper. The time-history curve of the cyclic load in a cycle was obtained using a coupled dynamic model of a high-speed train-ballasted track, as shown in Fig. 17 [47]. As four sets of wheels were used for each carriage, this curve included four loading peaks. In the loading process of the coupling model, it will undergo the process of non-loading, initial loading, maximum loading and unloading process, as shown in Fig. 18. The dynamic responses between the different structures in the coupled model of the ballasted railway track are discussed in detail.
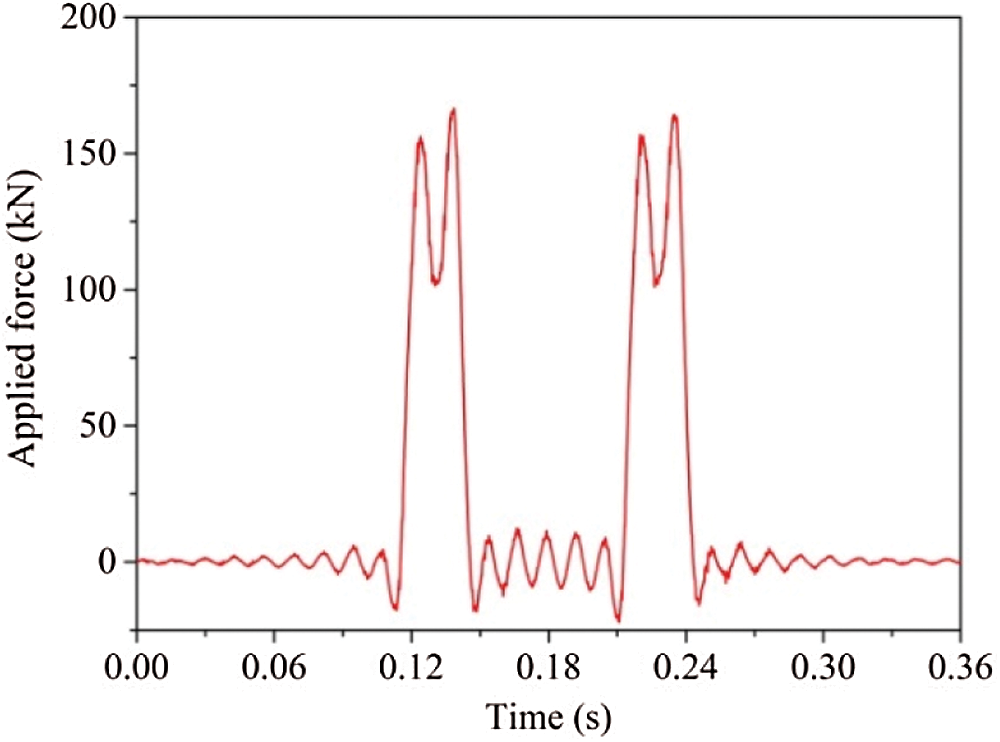
Figure 17: A cyclic load applied to sleeper
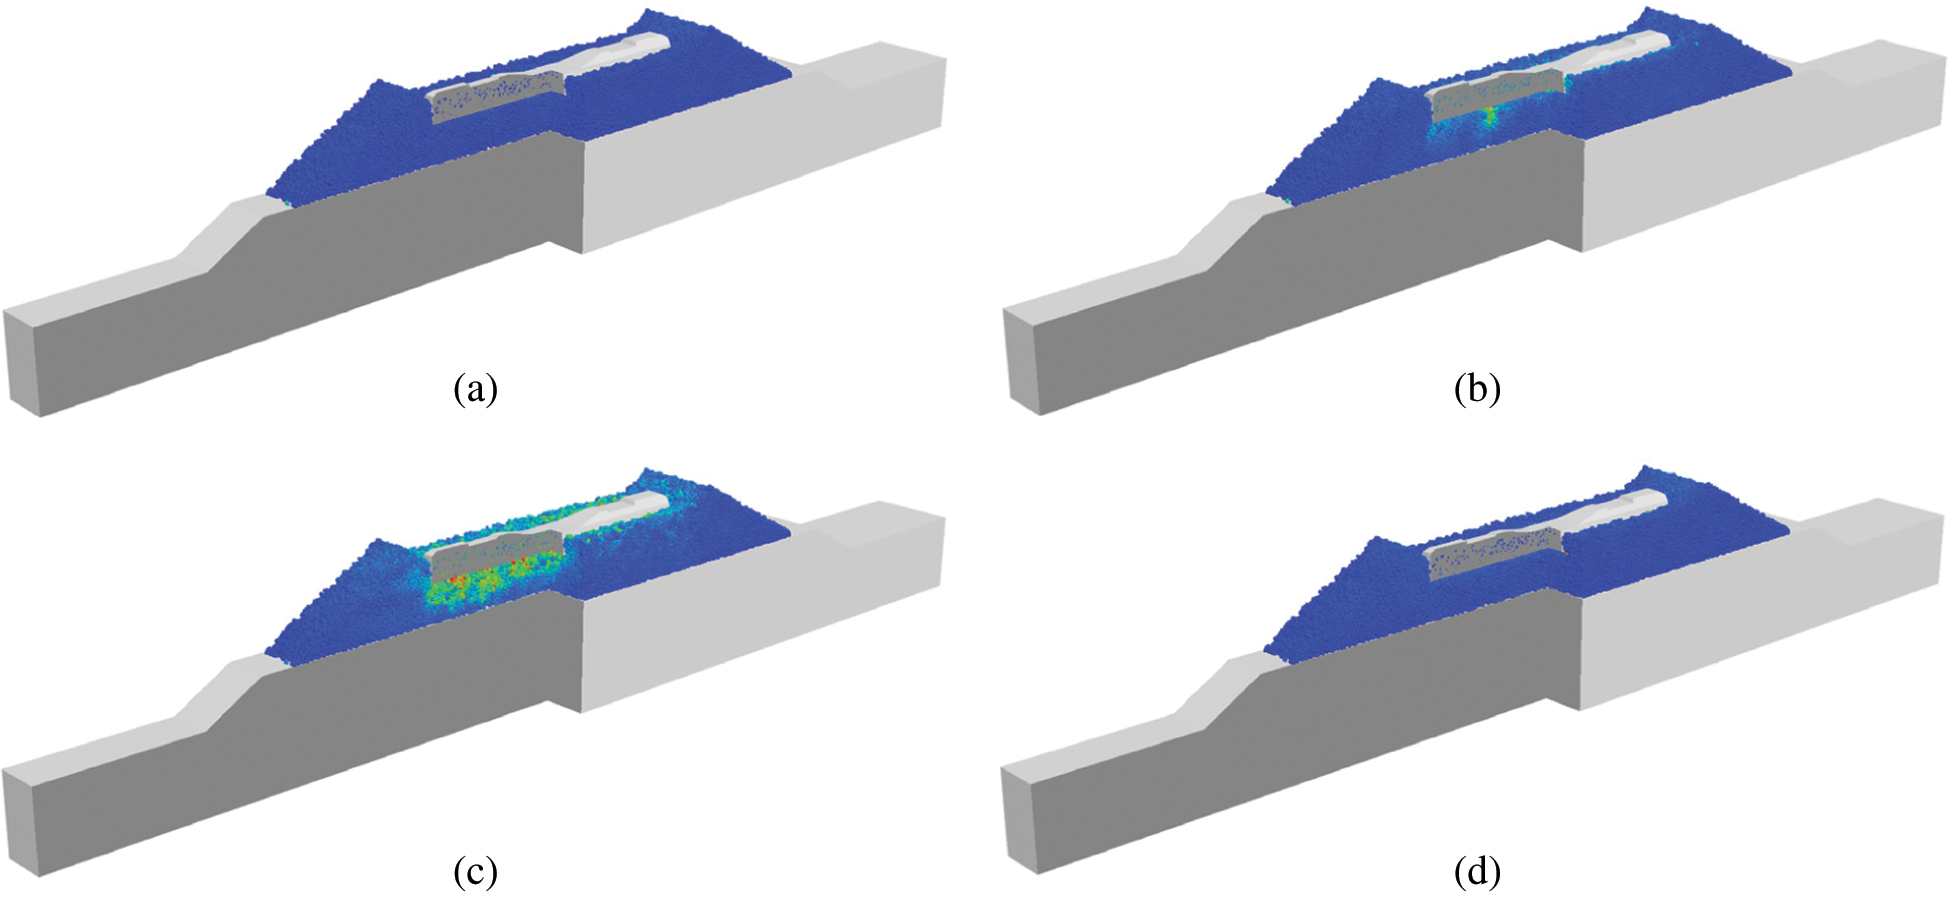
Figure 18: The numerical process under a train cyclic load. (a) Non loading. (b) Initial loading. (c) Maximum loading. (d) unloading
4.1 Dynamic Characteristic of Sleeper
Fig. 19 shows the settlement curve of the sleeper under 100 times of 16 t loading cycles. As shown, in the initial loading cycles, the accumulated settlement of the sleeper was relatively large. This was because both the sleeper and fresh ballast were not insufficient contact. Furthermore, the local gap between the adjacent ballast below the sleeper was large, which resulted in the unstable spatial position of the ballast layer under loading. With cyclic loading, the gap of the ballast below the sleeper became denser gradually. The sleeper settlement decelerated under the interlocking effect between adjacent ballasts.
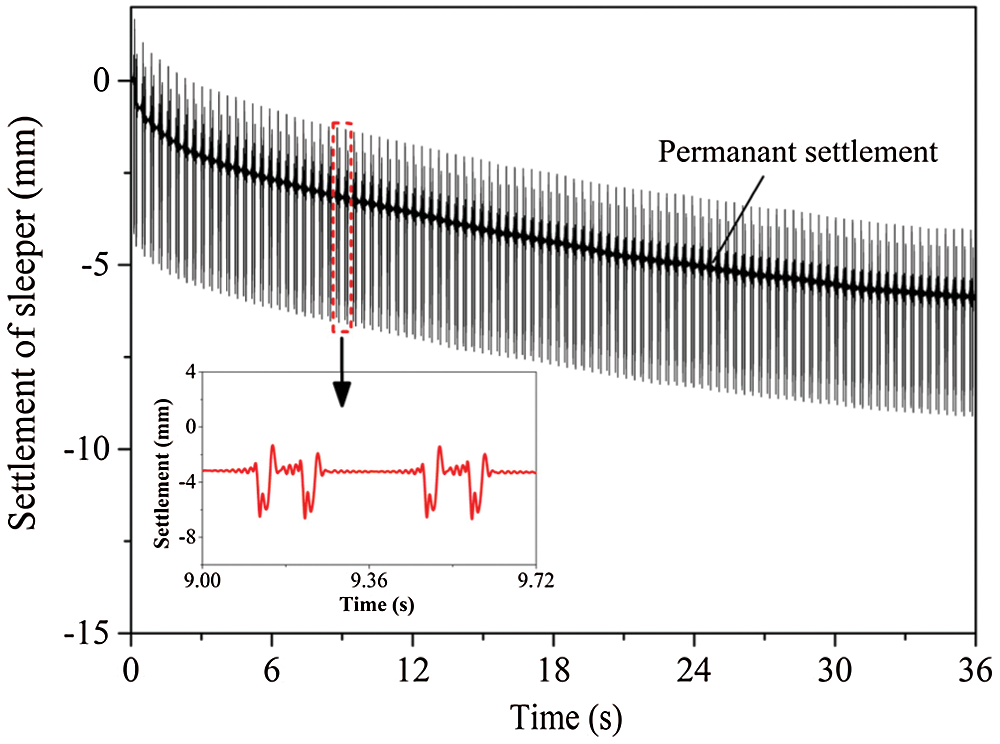
Figure 19: Settlement curve of the sleeper at 250 km/h speed and 16 t train load
Fig. 20 shows the vibration curves of the sleeper at different speeds under a load of 16 t. It can be seen that sleeper vibration caused by the passing of four wheelsets can be identified. The waveforms of the simulation results agree with the experimental results from the literature [27]. Besides, Fig. 21 shows the vertical acceleration amplitude of the sleeper under different speeds and axle loads. As the train speed and load increases, the vertical vibration acceleration gradually increases. It will affect the stability of ballasted bed due to dynamic effect between sleeper and ballast layer, especially when the train speed exceeds 250 km/s.
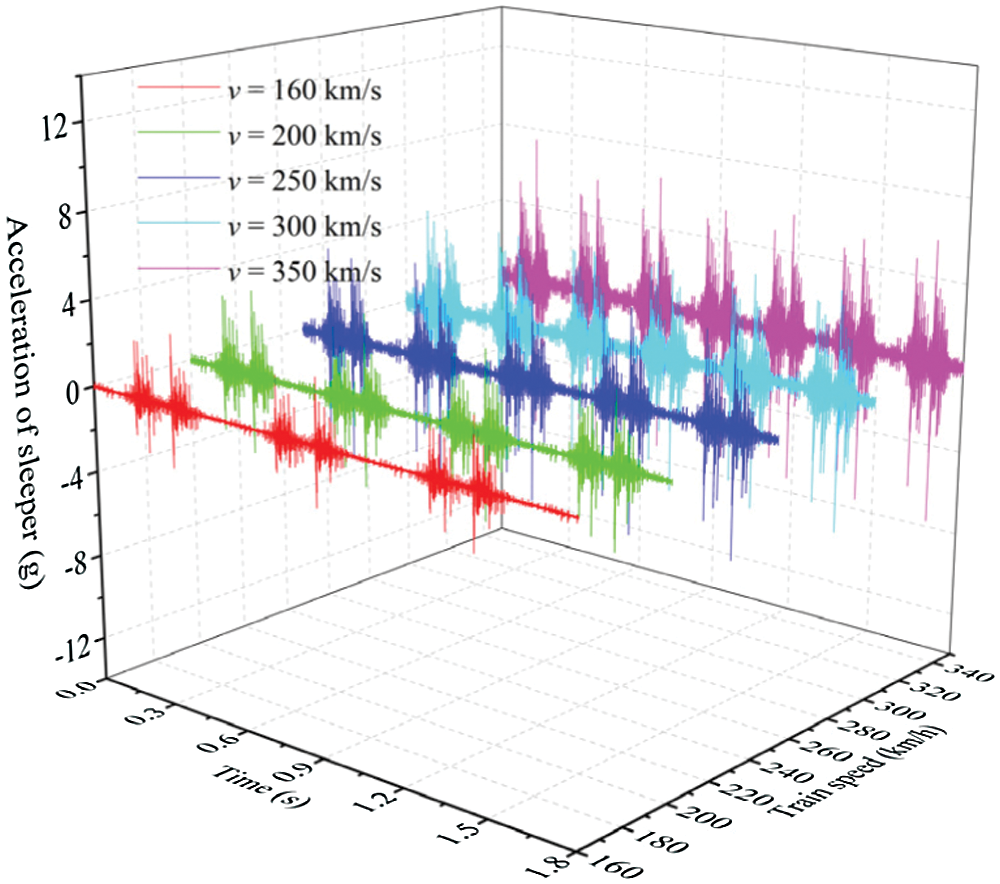
Figure 20: Acceleration of sleeper at different train speeds under 16 t train load
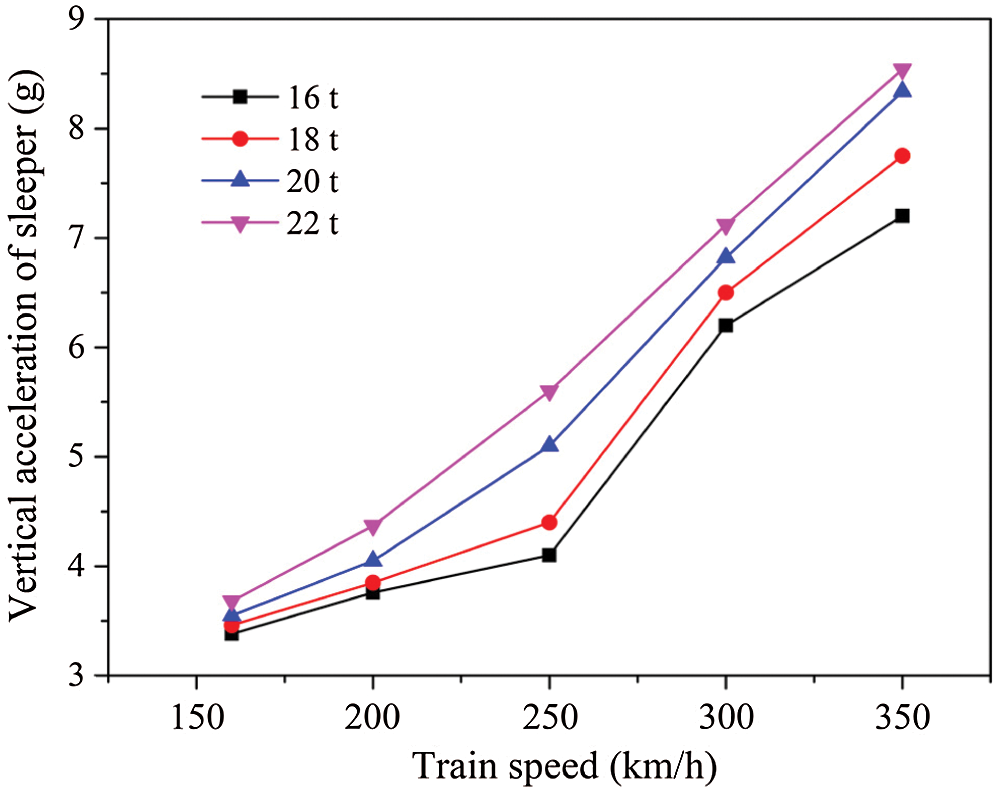
Figure 21: Acceleration amplitude of sleeper under different train speeds and loads
4.2 Vibration Response of Ballast Bed
The macroscopic degradation and deformation of the ballast bed are closely related to the dynamic characteristic of the ballast at the mesoscopic scale. To study the vibration response of the ballast layer under a train load, six clumps with similar sizes and shapes were selected as the monitoring points in the discrete element model of the ballast bed, as shown in Fig. 22. Points 1–3 beneath the sleeper were located below the supporting point of the rail. Meanwhile, points 4–6 were located on the slope of the ballast bed, distributing from the ballast shoulder to the slope bottom.
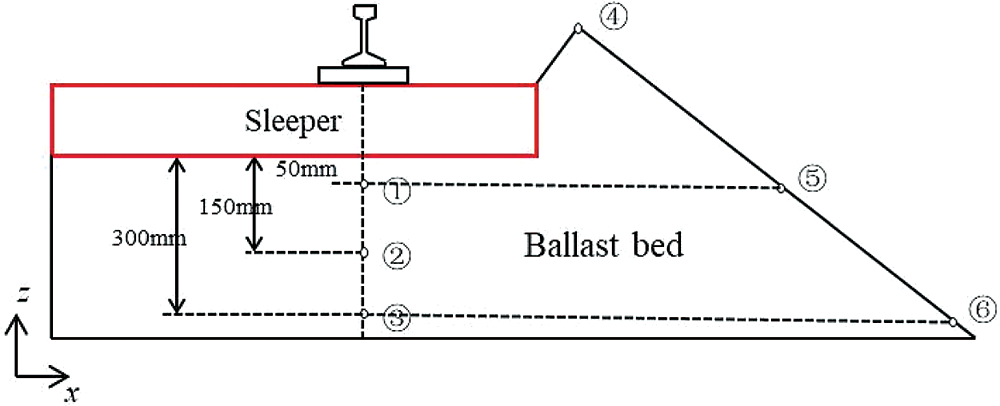
Figure 22: Distribution of ballast monitoring points
Fig. 23 shows the simulation results of the ballast vibration acceleration at 250 km/h train speed and 16 t load. As shown, the waveform of acceleration is similar to the previous experimental results [46]. The acceleration amplitudes of monitoring points 1–3 were large relatively, in which that of point 1 near the sleeper bottom was the largest, i.e., approximately 40 m2/s. As the ballast was far from the bottom of the sleeper, the ballast acceleration amplitude decreased gradually. Also, the ballast acceleration amplitudes at monitoring points 4–6 were small because the points were far from the trapezoidal compression zone beneath the sleeper. Furthermore, the smallest amplitude was exhibited by point 6 located at the bottom of the slope. Fig. 24 shows the vertical acceleration amplitude of the No. 2 monitoring point below the sleeper under different train speeds and axle loads. It can be seen that the increasing train speed and axle load will lead to an increase in the vertical acceleration of the ballast. Besides, when the train speed exceeds 250 km/h, the growth rate of the vertical acceleration increases obviously, thereby accelerating the settlement and degradation of the ballast bed. In conclusion, the simulation results demonstrated the excellent performance of the vibration absorption and compression resistance of the granular ballast layer. Moreover, the simulation results were consistent with those of the previous discrete element simulation [48] and the experimental results [49], which verified the feasibility of the established coupled model in the simulation of the ballast dynamic response.
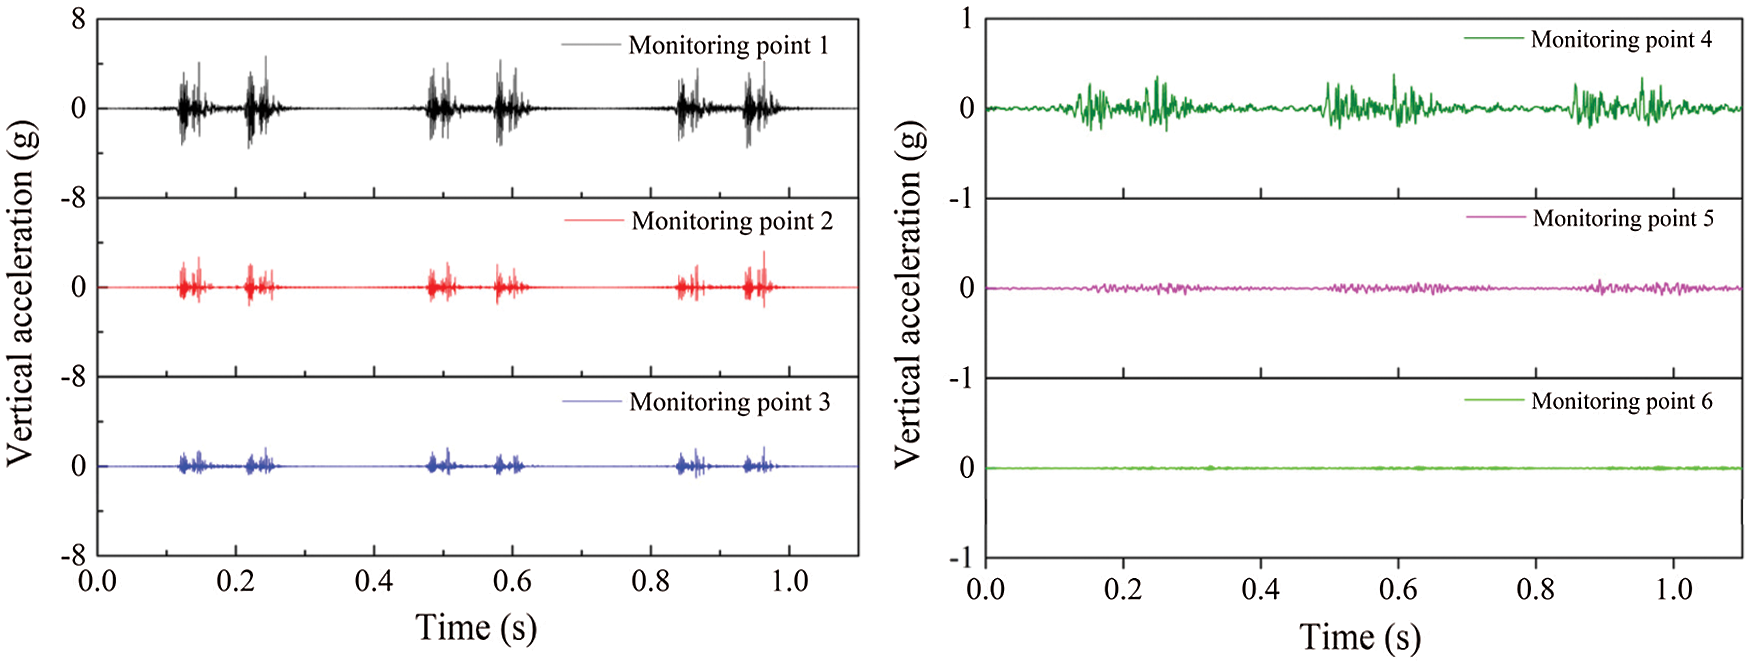
Figure 23: Ballast vibration acceleration at different monitoring points
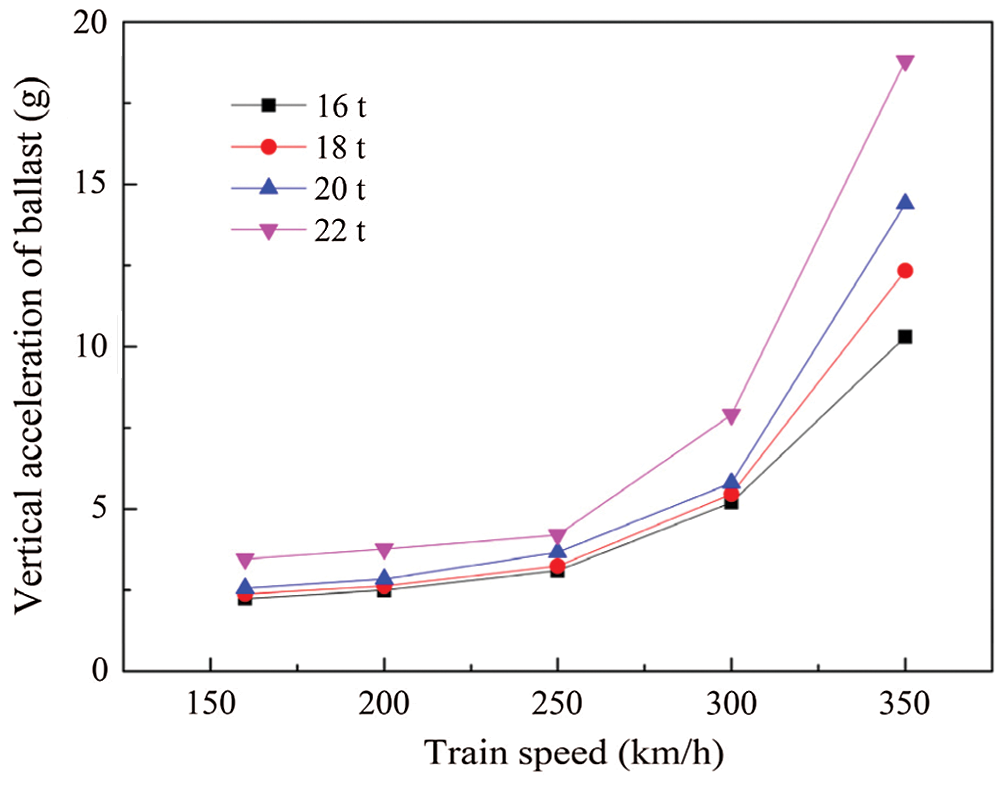
Figure 24: Vertical acceleration amplitude of ballast under different train speeds and loads
4.3 Stress and Displacement Analysis of Substructure
The vibration excitation generated by train operation will be transmitted to the substructure through the sleeper and ballast layer. The study of the substructure response when the train wheel passes is very important for subgrade design and evaluation. Fig. 25 shows the dynamic stress at the substructure surface under the 250 km/s train speed and 16 t load. It can be seen that the dynamic stress waveform obtained by the coupling model is similar to that of in situ measurement [50]. Meanwhile, according to field measurement of DJJ2 series in Qinhuangdao–Shenyang high-speed railway in China [51,52], the measured dynamic stress amplitude on the subgrade surface ranges from 50–100 kPa in ballasted railway track, which indicated the maximum dynamic stress amplitude obtained by the coupled model is reasonable.
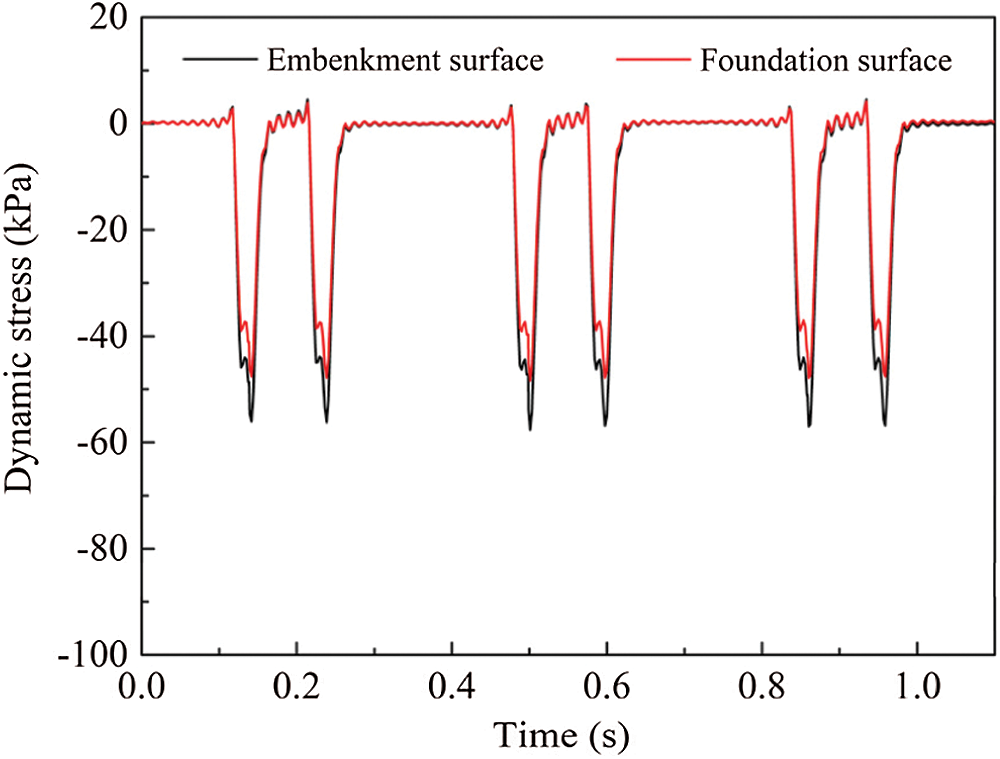
Figure 25: Dynamic stress at substructure surface
Besides, Studies [51] have shown that the amplitude of substructure dynamic stress is related to both train speed and axle load. Fig. 26 shows the maximum dynamic stress of embankment surface under the different train loads and the train speeds. It can be found that the maximum dynamic stress changes in the range of 50–70 kPa and increases linearly with the increasing train speed and load. Fig. 27 shows the relationship between the ratio of dynamic stress to axle load and train speed. It can be seen that the fitting curve obtained by the DEM-FEM coupling model are similar in trend to the experimental results and the finite element results [53]. However, the growth trends of dynamic stress obtained from the coupled DEM-FEM model and the finite element model are greater than the actual measured results. The reason perhaps is that the subgrade and track conditions of the field test section are different from that of the assumption in the calculation due to the influence of the smoothness of line.
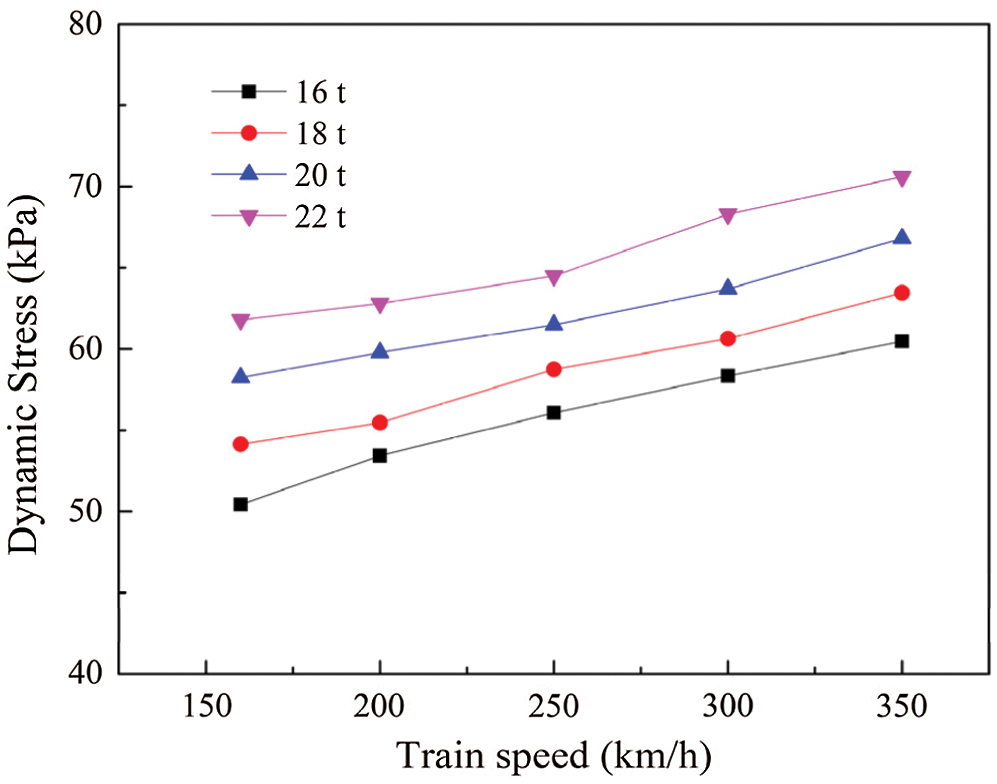
Figure 26: The relationship between dynamic stress and train speed
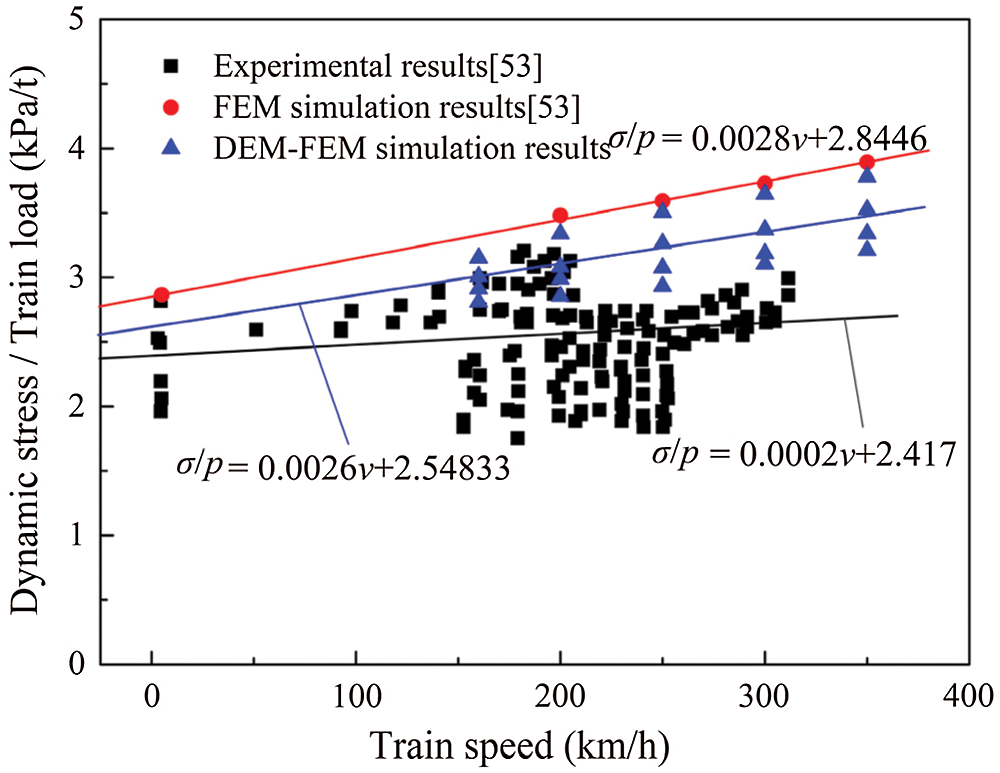
Figure 27: The ratio of dynamic stress to train load at different train speeds
To further visualise the response of the ballasted railway, Fig. 28 shows the cross-section stress distribution of the coupled model under the maximum loads. The contact force between ballasts is represented by the force chain. As shown, the red force chain which means large contact force located under the sleeper. Meanwhile, the stress concentration in the substructure model was located on the embankment surface below steel rail. The maximum stress of the contacted surface was much smaller than the stress applied to the sleeper. This indicates that the granular ballast bed can absorb most of the train load from the sleeper and transfer the load to the substructure, which is important for the stability of the ballasted track structure.
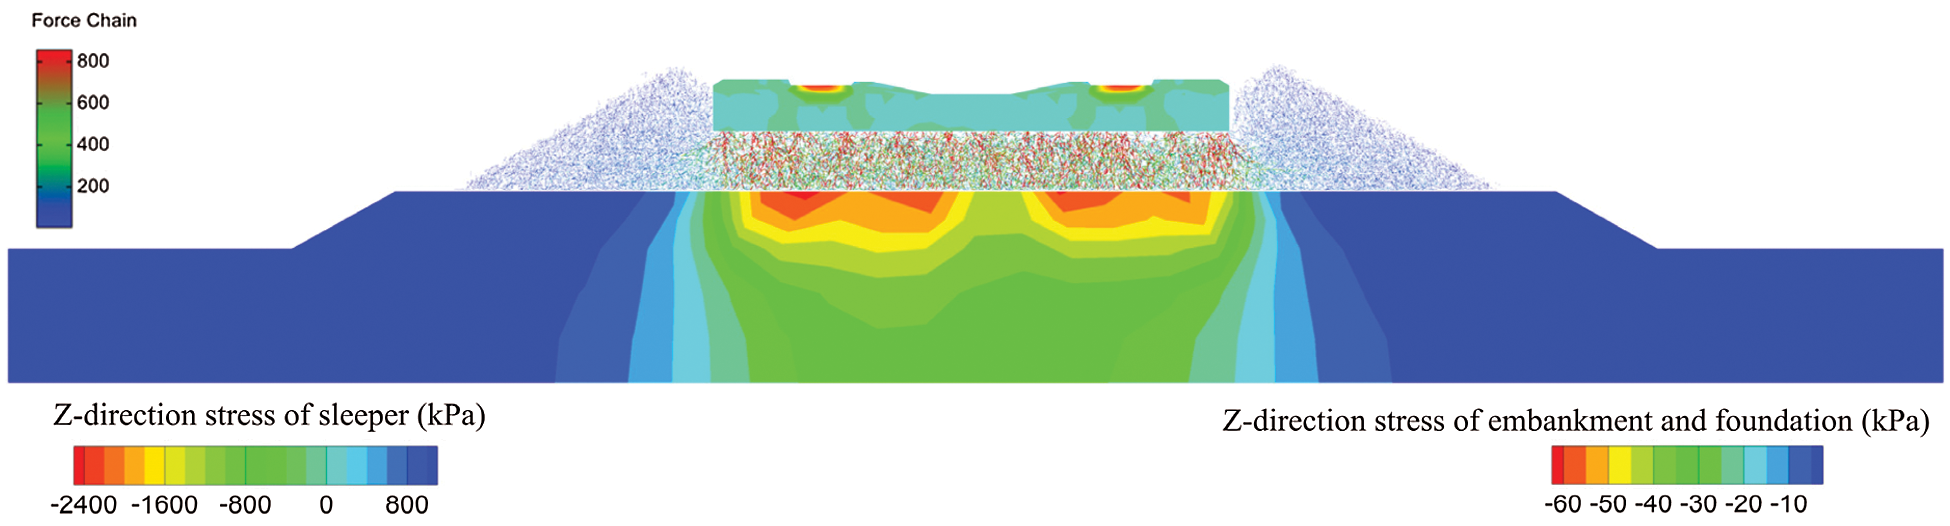
Figure 28: Cross-section stress distribution of the coupled model
As shown by the displacement distribution of the coupled model in Fig. 29, the displacement of the substructure is located primarily below the sleeper. Because the embankment is in direct contact with the ballast layer and its strength is lower than that of the foundation, a large displacement is generated in the embankment surface.
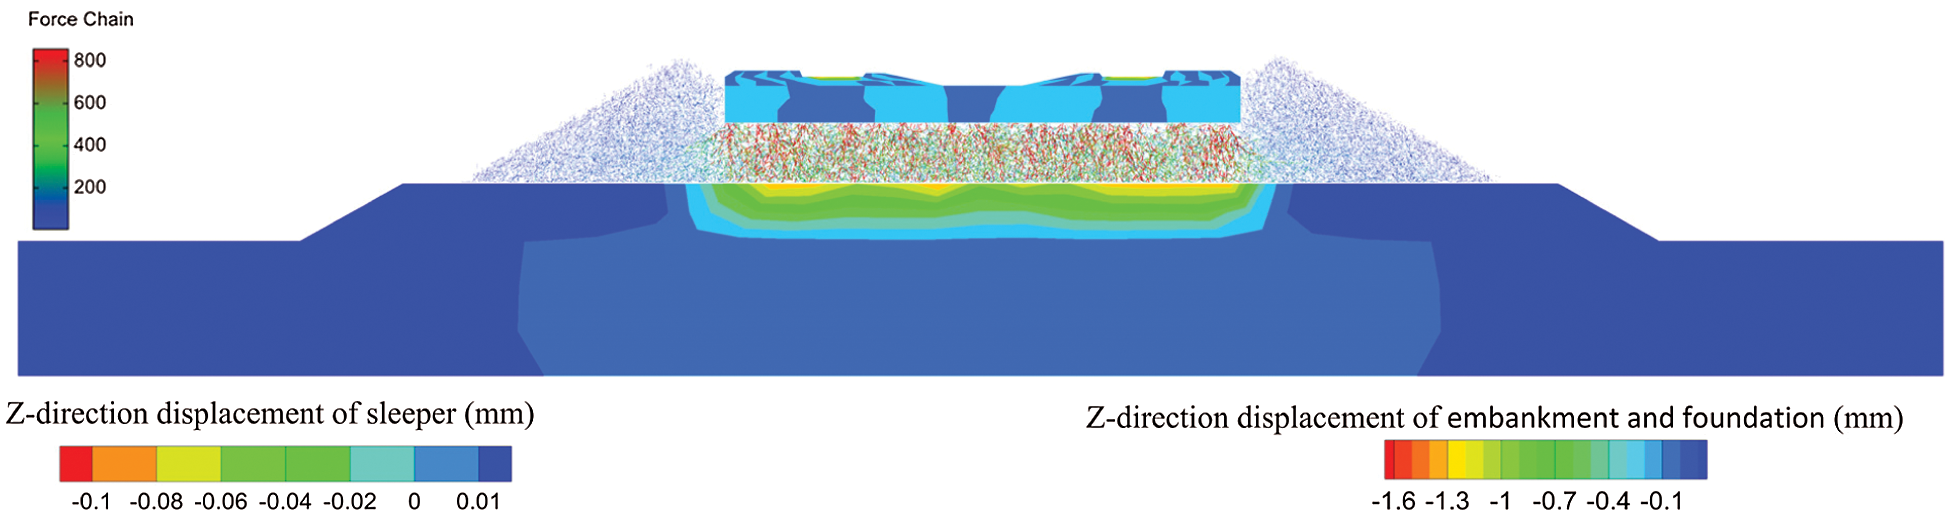
Figure 29: Cross-section displacement distribution of the coupled model
As shown in Fig. 30, the unrecoverable plastic strain zone is located at the largest displacement of the upper surface of the embankment. Owing to the discrete nature of the granular ballast bed, the ballast grains established a point-facet contact with the upper surface of the embankment, resulting in an unevenly distributed contact force on the upper surface of the embankment.
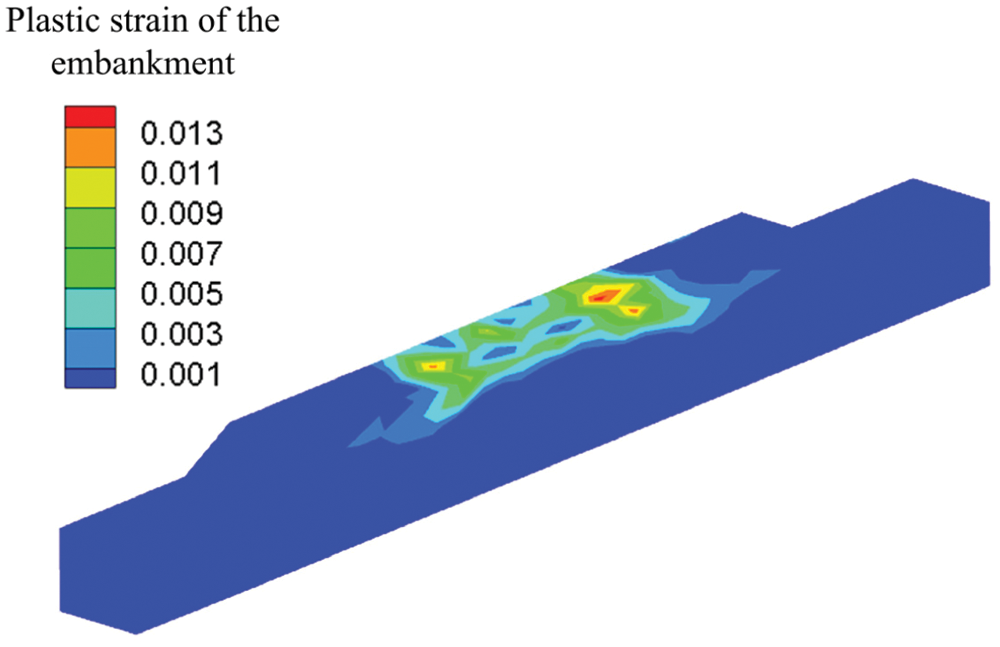
Figure 30: Plastic strain of the embankment surface
In this paper, a three-dimensional ballasted railway track model is established based on coupled DEM-FEM. To improve computational efficiency, a GPU-based parallel framework was applied to the discrete element simulation of ballast bed. Meanwhile, an algorithm containing contact search and parameter transfer were developed and verified in the GPU parallel environment. Finally, the dynamic characteristics of the ballasted railway were analyzed at the macro–meso scale. The relevant conclusions are as follows:
1. The established coupling model can reflect the settlement and vibration characteristics of sleeper under train load. With the increasing train speed and load, the vertical acceleration of sleeper gradually increases.
2. The vibration acceleration of ballast near the sleeper bottom was the largest (i.e., approximately 40 m2/s at 250 km/h train speed and 16 t load) and then decreased gradually with the increasing depth of the ballast layer. Increasing train speed and axle load will lead to an increase in the vertical acceleration of the ballast. When the train speed exceeds 250 km/h, the growth rate of the vertical acceleration increases obviously.
3. The maximum dynamic stress on substructure changes in the range of 50–70 kPa and increases linearly with the increasing train speed and load. The simulation results of dynamic stress obtained from the coupled DEM-FEM model were consistent with the previous in-situ measured results.
4. The stress and displacement concentration area in the substructure model were located on the embankment surface below steel rail. Owing to the discrete nature of the granular ballast bed, the ballast grains established a point-facet contact with the upper surface of the embankment, resulting in an unevenly distributed contact force on the upper surface of the embankment.
Funding Statemnt: This work was supported by the National Natural Science Foundation of China (Grant Nos. 11872136, 11802146 and 11772085) and the Fundamental Research Funds for the Central Universities (Grant Nos. DUT19GJ206 and DUT19ZD207).
Conflicts of Interest: The authors declare that they have no conflicts of interest to report regarding the present study.
1. Zhai W., Wang K., Cai C. (2009). Fundamentals of vehicle-track coupled dynamics. Vehicle System Dynamics, 47(11), 1349–1376. DOI 10.1080/00423110802621561. [Google Scholar] [CrossRef]
2. Jerónimo, P., Resende, R., Fortunato, E. (2020). An assessment of contact and laser-based scanning of rock particles for railway ballast. Transportation Geotechnics, 22, 100302. DOI 10.1016/j.trgeo.2019.100302. [Google Scholar] [CrossRef]
3. Koohmishi, M., Palassi, M. (2020). Degradation of railway ballast under compressive loads considering particles rearrangement. International Journal of Pavement Engineering, 21(2), 157–169. DOI 10.1080/10298436.2018.1449949. [Google Scholar] [CrossRef]
4. Indraratna, B., Thakur, P. K., Vinod, J. S. (2009). Experimental and numerical study of railway ballast behavior under cyclic loading. International Journal of Geomechanics, 10(4), 136–144. DOI 10.1061/(ASCE)GM.1943-5622.0000055. [Google Scholar] [CrossRef]
5. Fischer, S. (2017). Breakage test of railway ballast materials with new laboratory method. Periodica Polytechnica Civil Engineering, 61(4), 794–802. [Google Scholar]
6. Shih, J. Y., Grossoni, I., Bezin, Y. (2019). Settlement analysis using a generic ballasted track simulation package. Transportation Geotechnics, 20, 100249. DOI 10.1016/j.trgeo.2019.100249. [Google Scholar] [CrossRef]
7. Kumar, N., Suhr, B., Marschnig, S., Dietmaier, P. Marte, C. et al. (2019). Micro–mechanical investigation of railway ballast behavior under cyclic loading in a box test using DEM: Effects of elastic layers and ballast types. Granular Matter, 21(4), 106. DOI 10.1007/s10035-019-0956-9. [Google Scholar] [CrossRef]
8. Cundall, P. A., Strack, O. D. L. (1979). A discrete numerical model for granular assemblies. Geotechnique, 29(1), 47–65. DOI 10.1680/geot.1979.29.1.47. [Google Scholar] [CrossRef]
9. Tutumluer, E., Qian, Y., Hashash, Y. M. A., Ghaboussi, J., Davis, D. D. (2013). Discrete element modelling of ballasted track deformation behaviour. International Journal of Rail Transportation, 1(1–2), 57–73. DOI 10.1080/23248378.2013.788361. [Google Scholar] [CrossRef]
10. Feng, B., Park, E. H., Huang, H., Li, W. Tutumluer, E. et al. (2019). Discrete element modeling of full-scale ballasted track dynamic responses from an innovative high-speed rail testing facility. Transportation Research Record, 2673(9), 107–116. DOI 10.1177/0361198119846475. [Google Scholar] [CrossRef]
11. Vizcarra, G. C., Nimbalkar, S., Casagrande, M. (2016). Modeling behaviour of railway ballast in prismoidal apparatus using discrete element method. Procedia Engineering, 143, 1177–1184. DOI 10.1016/j.proeng.2016.06.125. [Google Scholar] [CrossRef]
12. Huang, H., Tutumluer, E. (2011). Discrete element modeling for fouled railroad ballast. Construction and Building Materials, 25(8), 3306–3312. DOI 10.1016/j.conbuildmat.2011.03.019. [Google Scholar] [CrossRef]
13. Yan, Y., Zhao, J., Ji, S. (2014). Discrete element analysis of breakage of irregularly shaped railway ballast. Geomechanics and Geoengineering, 10(1), 1–9. DOI 10.1080/17486025.2014.933891. [Google Scholar] [CrossRef]
14. Liu, G. Y., Xu, W. J., Sun, Q. C., Govender, N. (2020). Study on the particle breakage of ballast based on a GPU accelerated discrete element method. Geoscience Frontiers, 11(2), 461–471. DOI 10.1016/j.gsf.2019.06.006. [Google Scholar] [CrossRef]
15. Jing, G., Zhang, X., Jia, W. (2019). Lateral resistance of polyurethane-reinforced ballast with the application of new bonding schemes: Laboratory tests and discrete element simulations. Construction and Building Materials, 221, 627–636. DOI 10.1016/j.conbuildmat.2019.06.114. [Google Scholar] [CrossRef]
16. Zhang, X., Zhao, C., Zhai, W. (2019). Importance of load frequency in applying cyclic loads to investigate ballast deformation under high-speed train loads. Soil Dynamics and Earthquake Engineering, 120, 28–38. DOI 10.1016/j.soildyn.2019.01.023. [Google Scholar] [CrossRef]
17. Hossain, Z., Indraratna, B., Darve, F., Thakur, P. K. (2007). DEM analysis of angular ballast breakage under cyclic loading. Geomechanics and Geoengineering: An International Journal, 2(3), 175–181. DOI 10.1080/17486020701474962. [Google Scholar] [CrossRef]
18. Eliá, J. (2014). Simulation of railway ballast using crushable polyhedral particles. Powder Technology, 264, 458–465. [Google Scholar]
19. Aikawa, A. (2015). Dynamic characterisation of a ballast layer subject to traffic impact loads using three-dimensional sensing stones and a special sensing sleeper. Construction and Building Materials, 92, 23–30. DOI 10.1016/j.conbuildmat.2014.06.005. [Google Scholar] [CrossRef]
20. Huang, H., Chrismer, S. (2013). Discrete element modeling of ballast settlement under trains moving at “Critical Speeds”. Construction and Building Materials, 38(Supplement C), 994–1000. DOI 10.1016/j.conbuildmat.2012.09.007. [Google Scholar] [CrossRef]
21. Ji, S., Sun, S., Yan, Y. (2017). Discrete element modeling of dynamic behaviors of railway ballast under cyclic loading with dilated polyhedra. International Journal for Numerical and Analytical Methods in Geomechanics, 41(2), 180–197. DOI 10.1002/nag.2549. [Google Scholar] [CrossRef]
22. Coetzee, C. J. (2017). Calibration of the discrete element method. Powder Technology, 310, 104–142. DOI 10.1016/j.powtec.2017.01.015. [Google Scholar] [CrossRef]
23. Ngamkhanong, C., Kaewunruen, S., Baniotopoulos, C. (2017). A review on modelling and monitoring of railway ballast. Structural Monitoring and Maintenance, 4(3), 195–220. [Google Scholar]
24. Guo, Y., Zhao, C., Markine, V., Jing, G., Zhai, W. (2020). Calibration for discrete element modelling of railway ballast: A review. Transportation Geotechnics, 23, 100341. DOI 10.1016/j.trgeo.2020.100341. [Google Scholar] [CrossRef]
25. Ngo, N. T., Indraratna, B., Rujikiatkamjorn, C. (2017). Simulation ballasted track behavior: Numerical treatment and field application. International Journal of Geomechanics, 17(6), 04016130. DOI 10.1061/(ASCE)GM.1943-5622.0000831. [Google Scholar] [CrossRef]
26. Li, L., Liu, W., Ma, M., Jing, G., Liu, W. (2019). Research on the dynamic behaviour of the railway ballast assembly subject to the low loading condition based on a tridimensional DEM-FDM coupled approach. Construction and Building Materials, 218, 135–149. DOI 10.1016/j.conbuildmat.2019.05.102. [Google Scholar] [CrossRef]
27. Shi, C., Zhao, C., Zhang, X., Guo, Y. (2020). Coupled discrete-continuum approach for railway ballast track and substructure macro–meso analysis. International Journal of Pavement Engineering, 5, 1–16. DOI 10.1080/10298436.2020.1721498. [Google Scholar] [CrossRef]
28. Song, W., Huang, B., Shu, X., Stránský, J., Wu, H. (2019). Interaction between railroad ballast and sleeper: A DEM-FEM approach. International Journal of Geomechanics, 19(5), 04019030. DOI 10.1061/(ASCE)GM.1943-5622.0001388. [Google Scholar] [CrossRef]
29. Nishiura, D., Sakai, H., Aikawa, A., Tsuzuki, S., Sakaguchi, H. (2018). Novel discrete element modeling coupled with finite element method for investigating ballasted railway track dynamics. Computers and Geotechnics, 96, 40–54. DOI 10.1016/j.compgeo.2017.10.011. [Google Scholar] [CrossRef]
30. Shao, S., Yan, Y., Ji, S. (2017). Combined discrete-finite element modeling of ballasted railway track under cyclic loading. International Journal of Computational Methods, 14(5), 1750047. DOI 10.1142/S0219876217500475. [Google Scholar] [CrossRef]
31. Cook, S. (2013). CUDA Programming: A developer’s guide to parallel computing with GPUs. 1st edition. San Francisco, CA, USA: Morgan Kaufmann Publishers Inc. [Google Scholar]
32. Ma, Z. S., Feng, C., Liu, T. P., Li, S. H. (2011). A GPU accelerated continuous-based discrete element method for elastodynamics analysis. Advanced Materials Research, 320, 329–334. DOI 10.4028/www.scientific.net/AMR.320.329. [Google Scholar] [CrossRef]
33. Wang, L., Li, S., Zhang, G., Ma, Z., Zhang, L. (2013). A GPU-based parallel procedure for nonlinear analysis of complex structures using a coupled FEM/DEM approach. Mathematical Problems in Engineering, 2013, 1–15. DOI 10.1155/2013/618980. [Google Scholar] [CrossRef]
34. Thornton, C., Yin, K. K. (1991). Impact of elastic spheres with and without adhesion. Powder Technology, 65(1–3), 153–166. DOI 10.1016/0032-5910(91)80178-L. [Google Scholar] [CrossRef]
35. Suhr, B., Six, K. (2017). Parametrisation of a DEM model for railway ballast under different load cases. Granular Matter, 19(4), 126. DOI 10.1007/s10035-017-0740-7. [Google Scholar] [CrossRef]
36. Suhr, B., Marschnig, S., Six, K. (2018). Comparison of two different types of railway ballast in compression and direct shear tests: Experimental results and DEM model validation. Granular Matter, 20(4), 713. DOI 10.1007/s10035-018-0843-9. [Google Scholar] [CrossRef]
37. Ramírez, R., Pöschel, T., Brilliantov, N. V., Schwager, T. (1999). Coefficient of restitution of colliding viscoelastic spheres. Physical review E, 60(4), 4465–4472. DOI 10.1103/PhysRevE.60.4465. [Google Scholar] [CrossRef]
38. Di Renzo, A., Di Maio, F. P. D. (2005). An improved integral non-linear model for the contact of particles in distinct element simulations. Chemical Engineering Science, 60(5), 1303–1312. DOI 10.1016/j.ces.2004.10.004. [Google Scholar] [CrossRef]
39. Kremmer, M., Favier, J. F. (2001). A method for representing boundaries in discrete element modelling-Part II: Kinematics. International Journal for Numerical Methods in Engineering, 51(12), 1423–1436. DOI 10.1002/nme.185. [Google Scholar] [CrossRef]
40. Yan, Y., Ji, S. (2010). Discrete element modeling of direct shear tests for a granular material. International Journal for Numerical and Analytical Methods in Geomechanics, 34(9), 978–990. DOI 10.1002/nag.848. [Google Scholar] [CrossRef]
41. Nishiura, D., Sakaguchi, H. (2011). Parallel-vector algorithms for particle simulations on shared-memory multiprocessors. Journal of Computational Physics, 230(5), 1923–1938. DOI 10.1016/j.jcp.2010.11.040. [Google Scholar] [CrossRef]
42. Winkel, B. (2010). Viscous nonlinearity in central difference and Newmark integration schemes. Acta Mechanica, 209(3–4), 179–186. DOI 10.1007/s00707-009-0176-1. [Google Scholar] [CrossRef]
43. Wang, S. P., Nakamachi, E. (2015). The inside-outside contact search algorithm for finite element analysis. International Journal for Numerical Methods in Engineering, 40(19), 3665–3685. DOI 10.1002/(SICI)1097-0207(19971015)40:19¡3665::AID-NME234¿3.0.CO;2-K. [Google Scholar] [CrossRef]
44. Ai-Kah, S., Yuqiu, L., Song, C. (2000). Development of eight-node quadrilateral membrane elements using the area coordinates method. Computational Mechanics, 25(4), 376–384. DOI 10.1007/s004660050484. [Google Scholar] [CrossRef]
45. Villard, P., Chevalier, B., Le Hello, B., Combe, G. (2009). Coupling between finite and discrete element methods for the modelling of earth structures reinforced by geosynthetic. Computers and Geotechnics, 36(5), 709–717. DOI 10.1016/j.compgeo.2008.11.005. [Google Scholar] [CrossRef]
46. Zhai, W. M., Wang, K. Y., Lin, J. H. (2004). Modelling and experiment of railway ballast vibrations. Journal of Sound and Vibration, 270(4–5), 673–683. DOI 10.1016/S0022-460X(03)00186-X. [Google Scholar] [CrossRef]
47. Zhai, W., He, Z., Song, X. (2010). Prediction of high-speed train induced ground vibration based on train-track-ground system model. Earthquake Engineering and Engineering Vibration, 9(4), 545–554. DOI 10.1007/s11803-010-0036-y. [Google Scholar] [CrossRef]
48. Zhang, X., Zhao, C., Zhai, W. (2017). Dynamic behavior analysis of high-speed railway ballast under moving vehicle loads using discrete element method. International Journal of Geomechanics, 17(7), 4016157. DOI 10.1061/(ASCE)GM.1943-5622.0000871. [Google Scholar] [CrossRef]
49. Li, W., Bian, X., Duan, X., Tutumluer, E. (2018). Full-scale model testing on ballasted high-speed railway: Dynamic responses and accumulated settlements. Transportation Research Record, 2672(10), 125–135. DOI 10.1177/0361198118784379. [Google Scholar] [CrossRef]
50. Nie, Z. H., Li, L., Liu, B. C., Ruan, B. (2005). Testing and analysis on vibration of subgrade for Qinhuangdao–Shenyang railway. Chinese Journal of Rock Mechanics and Engineering, 24(6), 1067–1071, (In Chinese). [Google Scholar]
51. Chen, Y. M., Bian, X. C. (2018). The review of high-speed railway track foundation dynamics. China Civil Engineering Journal, 51(6), 1–13 (in Chinese). [Google Scholar]
52. Mei, H., Leng, W., Nie, R., Liu, W. Chen, C. et al. (2019). Random distribution characteristics of peak dynamic stress on the subgrade surface of heavy–haul railways considering track irregularities. Soil Dynamics and Earthquake Engineering, 116, 205–214. DOI 10.1016/j.soildyn.2018.10.013. [Google Scholar] [CrossRef]
53. Dong, L., Zhao, C. G., Cai, D. G., Zhang, Q. L., Ye, Y. S. (2008). Method for dynamic response of subgrade subjected to high-speed moving load. Engineering Mechanics, 25(11), 231–240 (In Chinese). [Google Scholar]
 | This work is licensed under a Creative Commons Attribution 4.0 International License, which permits unrestricted use, distribution, and reproduction in any medium, provided the original work is properly cited. |