| Computer Modeling in Engineering & Sciences |
DOI: 10.32604/cmes.2021.013179
ARTICLE
Shear Induced Seepage and Heat Transfer Evolution in a Single-Fractured Hot-Dry-Rock
1Beijing Key Laboratory for Precise Mining of Intergrown Energy and Resources, China University of Mining and Technology (Beijing), Beijing, 100083, China
2School of Energy and Mining Engineering, China University of Mining and Technology (Beijing), Beijing, 100083, China
3Key Laboratory of Deep Coal Resource Mining (CUMT), Ministry of Education of China, School of Mines, China University of Mining & Technology, Xuzhou, 221116, China
*Corresponding Author: Yulong Chen. Email: chenyulong@cumtb.edu.cn; Junhui Wang. Email: wangjunhui@cumt.edu.cn
Received: 28 July 2020; Accepted: 11 September 2020
Abstract: In the enhanced geothermal system (EGS), the injected fluid will induce shear sliding of rock fractures (i.e., hydroshearing), which consequently, would increase the fracture aperture and improve the heat transfer efficiency of the geothermal reservoir. In this study, theoretical analysis, experimental research and numerical simulation were performed to uncover the permeability and heat transfer enhancement mechanism of the Hot-Dry-Rock (HDR) mass under the impact of shearing. By conducting the direct shear test with the fractured rock samples, the evolution process of fracture aperture during the shearing tests was observed, during which process, cubic law was adopted to depict the rock fracture permeability. To investigate the seepage characteristics and temperature distribution of the fractured HDR under the influence of shearing, a simulation study of shear-seepage-heat transfer in a fractured rock mass has been conducted to validate the observed shear-induced fracture dilation during the direct shear test. The results demonstrate that (1) the hydroshearing increases the dilation of granite fracture and enhances the permeability of the HDR rock mass, while the temperature around the HDR fracture will reduce. (2) Fracture roughness is of vital importance to enhance the permeability during the shearing tests. To be more specific, a rougher fracture always implies a higher permeability and a greater heat extraction efficiency. (3) The shear induced heat extracting efficiency is dominated by the increased fluid flux in the earlier period of the EGS reservoir, and this efficiency is controlled by the outlet water temperature since the fluid flux becomes stable after the shearing test. Therefore, balancing the hydroshearing enhanced heat extraction efficiency and EGS reservoir lifespan would be significant to the sustainable development and utilization of geothermal energy.
Keywords: Geothermal energy; EGS reservoir; direct shear test; permeability; HDR
Geothermal energy is renewable energy stored in the Earth’s crust. The most important consideration for geothermal energy development in non-hydrothermal scenarios is to build the Enhanced/Engineered Geothermal System (EGS) using hydraulic fracturing and hydroshearing techniques and thus establishing an effective network pathway to conduct fluid flow and extracting heat [1,2]. Hydroshearing is considered as a promising technique to improve the EGS reservoir permeability, which involves the injection-induced shear activation of preexisting fractures [3–5]. The underlying mechanism is known as shearing a natural fracture by reducing the effective stress of rock, after which process, the permeability of natural fractures will be enhanced (Fig. 1). Therefore, understanding the shear enhanced permeability mechanism is of particular importance for energy recovery of the EGS.
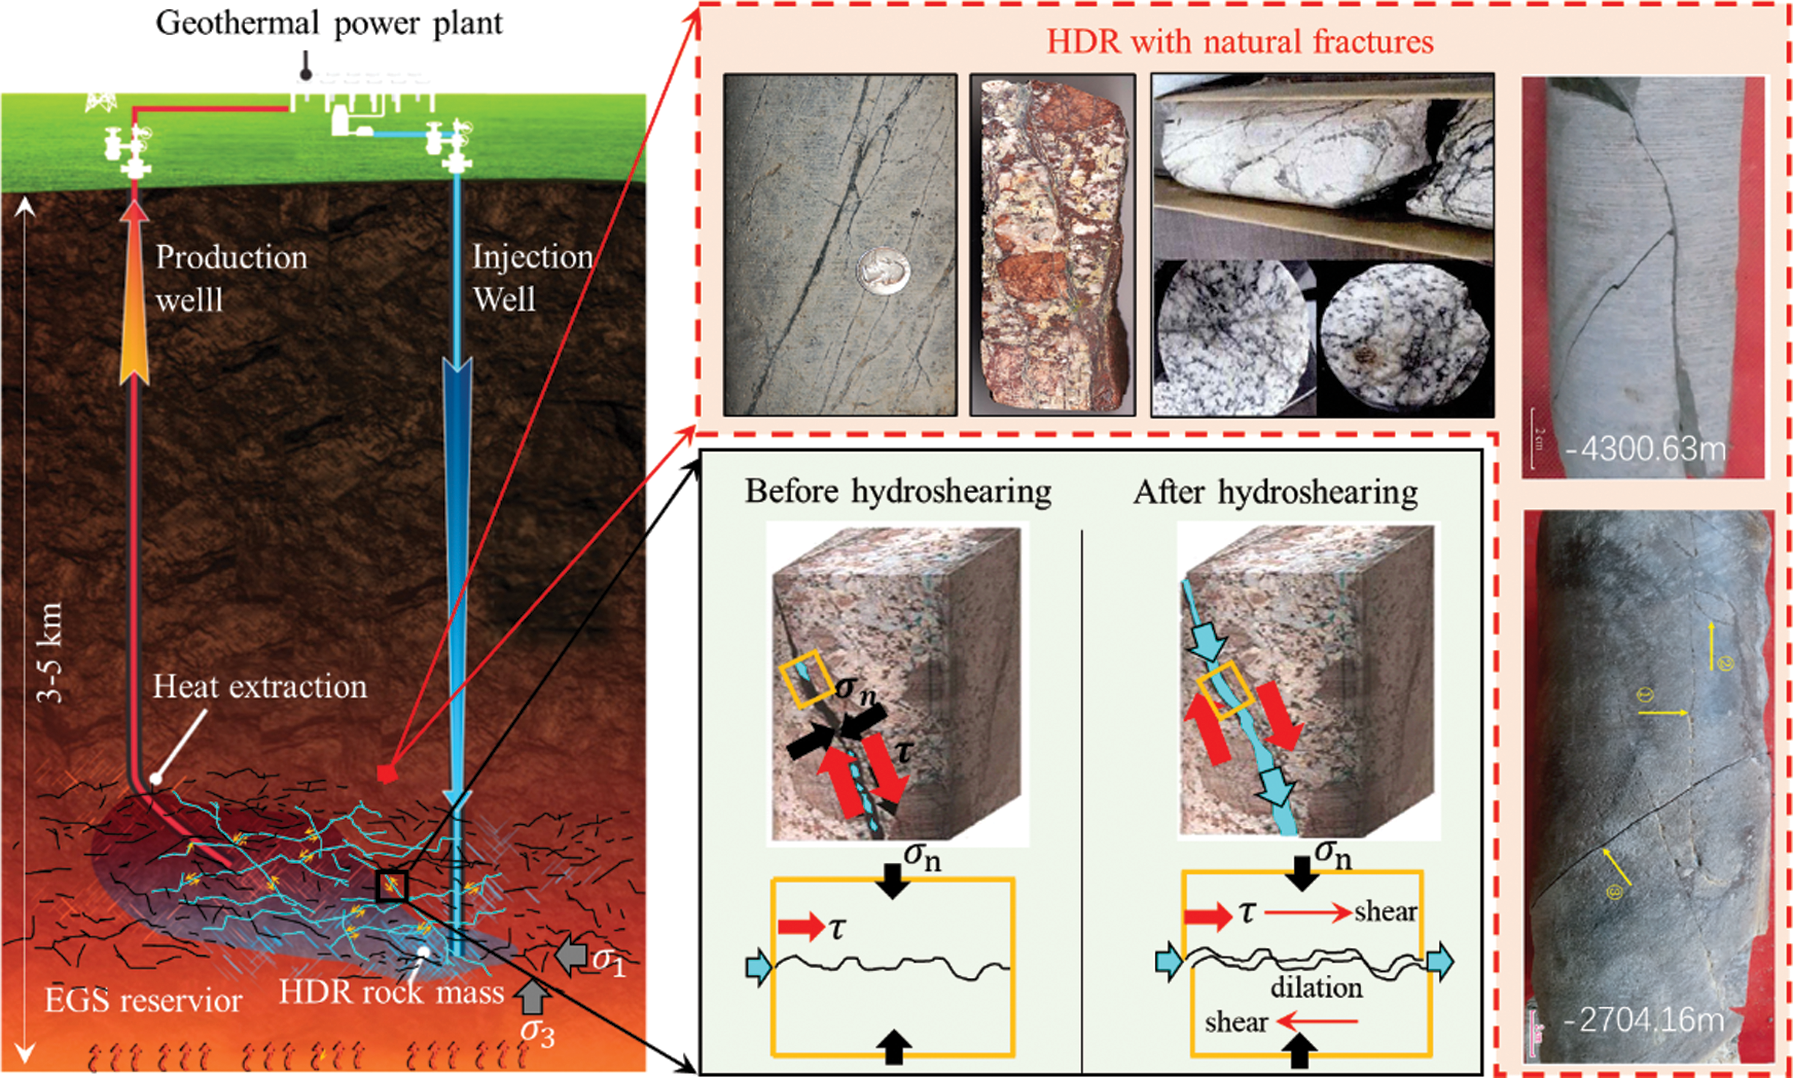
Figure 1: Schematic of hydroshearing in EGS reservoir and HDR with natural fractures
To date, the hydroshearing has been gradually employed as a reservoir stimulation technique in many EGS demonstration projects. In United States, the Department of Energy (DOE) has promoted the application of this technique in several EGS projects, such as the Desert Peak and the Brady’s Hot Springs EGS projects in Nevada, the Geysers EGS project in California, in the Newberry Volcano EGS project in Oregon and the Raft River EGS project in Utah [6]. However, the majority of these studies on hydroshearing focused on the aspects of the injection-triggered rock shearing mechanism, permeability evolution, injection-induced seismicity, etc. Hao et al. [7] investigated the effects of hydro-fracturing on heat transfer in geothermal reservoirs using a dual-continuum (matrix-fracture) model, which confirmed that the heat transfer/production efficiency of an EGS could be greatly improved through fracture aperture dilation. Ruqvist [8] and Dieterich [9] reported the permeability of fractured rock can be greatly increased under a few millimeters of shear displacement. The surface roughness of fracture has an important influence on the seepage characteristics of the samples [10], and the temperature of water can affect the contact area of the fracture after sliding shear [11]. Cold water injection can also lead to fractured rock shear slip due to thermal stress [2]. Dempsey et al. [12] established the shear-permeability mathematical model by using the results obtained by Lee et al. [10]. Then, they simulated hydroshearing using the geological information of the Desert Peak EGS project. Various simulations have been performed to investigate the EGS process, for instance, by adopting the SHIFT numerical simulation software, Tezuka et al. [13] simulated the permeability enhancement process of hydroshearing in rock mass, and proposed the injection-induced rock shear principle. Rutqvist et al. [14] numerically studied the shear-enhanced permeability evolution of the Newberry EGS reservoir by using the TOUGH-FLAC software. Riahi et al. [15] investigated the seepage characteristics of fractured rock mass during shear through UDEC numerical software, which implies that a low water injection rate is favorable to trigger fracture shear in the early period of hydroshearing process.
To sum up, previous researchers have focused mainly on the hydroshearing triggering mechanism, shear-permeability evolution of fractured rock, etc. [16–22] while less attention has been paid to the seepage-heat transfer coupling characteristics of fractured rock under hydroshearing process. The seepage-heat transfer characteristics of fractured rock mass under hydroshearing process is of vital importance because it can reveal the efficiency of the hydroshearing technique in a straightforward manner, which would be helpful to the reasonable EGS system design. Therefore, we will investigate the shear-induced seepage and heat transfer evolution of a single-fractured hot-dry-rock. First, the adopted methodology in this manuscript, including experimental test and numerical modeling methods is introduced. Then, the obtained results and discussion section is given. Last, several significant conclusions are drawn and it is hoped that this study can contribute to the efficient EGS production.
2.1 Sample Preparation and Testing Methods
(1) Sample preparation and Joint Roughness Coefficient (JRC) calibration
The Shandong gray granite samples with the dimension of  were selected to conduct the direct shear test. The high-precision rock engrave machine is adopted to prefabricate a rough fracture in the middle of the sample thus formatting the fracture rock sample. The profile of rough fracture surface is prefabricated according to the Joint Roughness Coefficient (JRC) curves provided by Barton et al. [23]. In this study, three fracture profiles were utilized to make fractured rocks and the JRC values of the three samples are
  6,
6,  and
and  respectively. For convenience, these three types of fracture surfaces are named with JRC1, JRC2 and JRC3, respectively in the following sections.
The engraving process of the granite samples is described as follows: (1) By employing the profile curve provided by Barton, three-dimensional profile diagrams were generated, and then these diagrams were uploaded to the software of engraving machine (Fig. 2b); (2) Placing the granite block on the engraving platform (Fig. 2c); (3) Installing the drilling bit and adjusting its position; (4) Connecting cooling water and engraving the rock block. Finally, the granite with prefabricated fracture surface were formed (Fig. 2d).
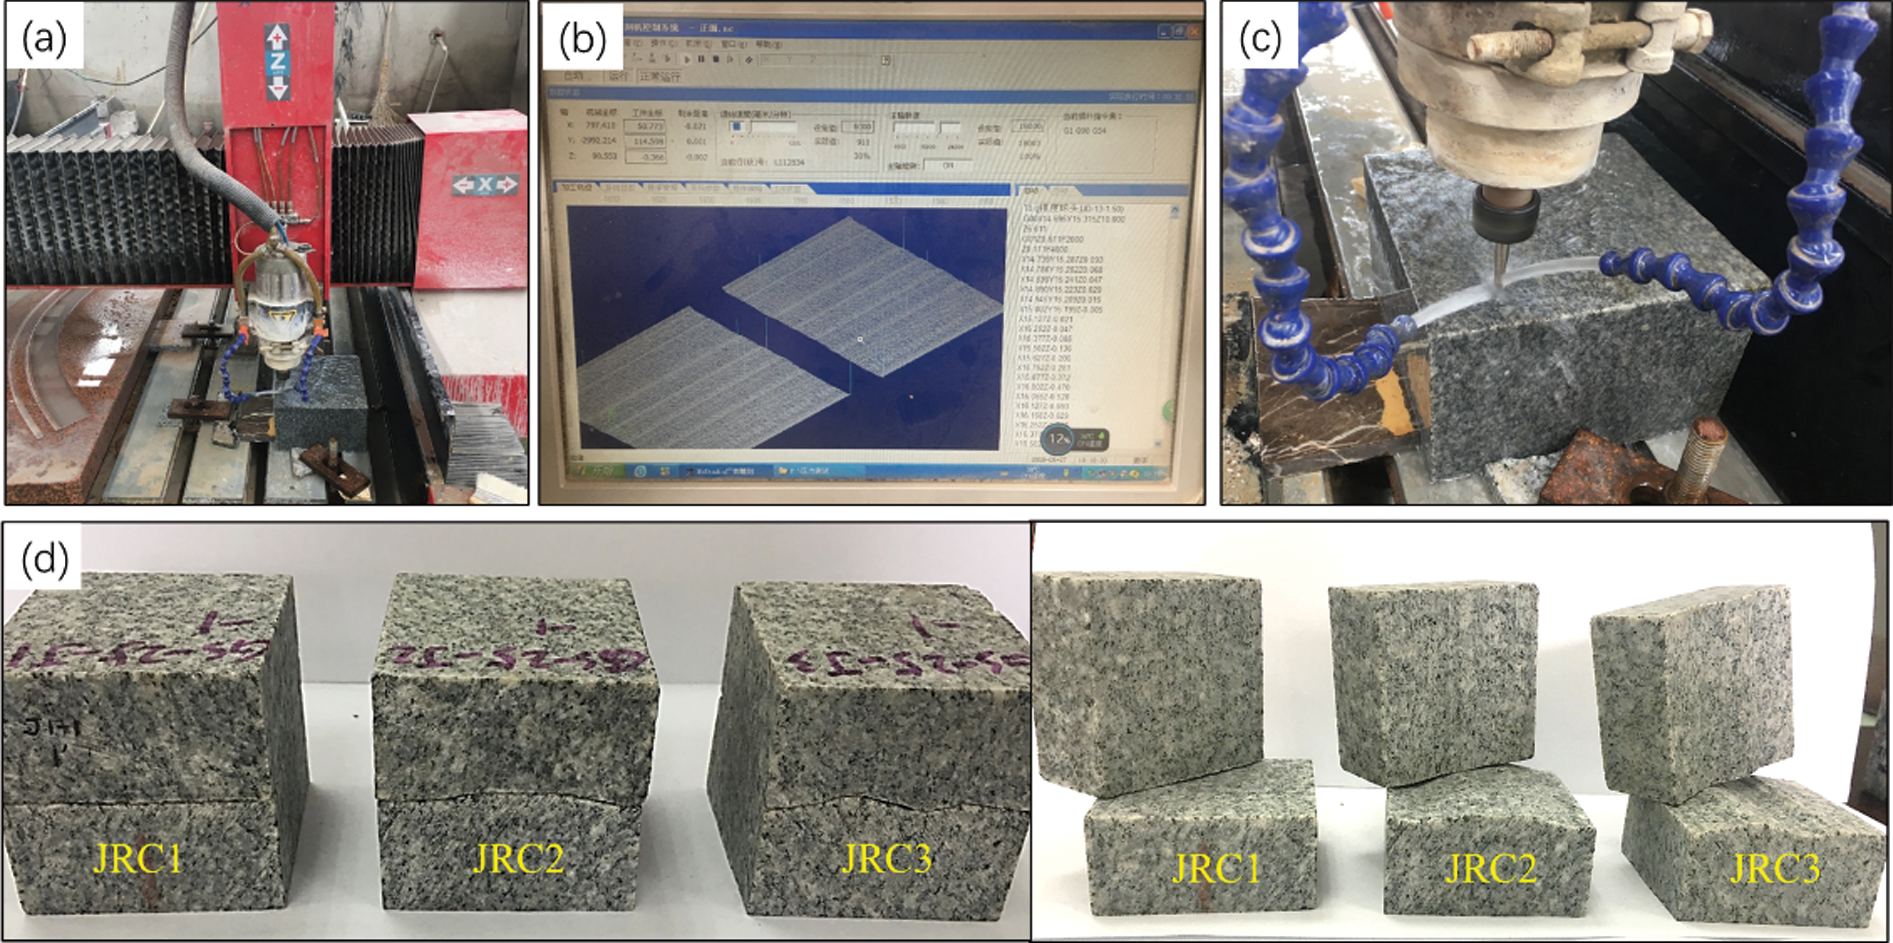
Figure 2: Engraving method and process of fractured granite sample. (a) Rock engrave machine; (b) Engraving software with uploaded profile; (c) Drilling bit and installed rock block; (d) Fractured rock samples
It should be noted that the engraved rock surface should be scanned and recalculated to obtain the actual JRC values because errors may arise during the machine engraving process as well as due to the heterogeneity of granite rocks. Therefore, the 3D surface scanning machine is employed to obtain the position data cloud of the fracture surfaces and the actual JRC value of the processed granites is calculated using the following equation [24]:

where M is the interval of the data cloud; xi and yi are x and y coordinates of these points, respectively.
After scanning and recalculating, the corresponding actual values of JRC are 5.1, 10.7 and 14.4 respectively.
(2) Test setups and methods
The rock direct shear test system is employed to obtain the shear stress and dilation of fractured rock. As shown in Fig. 3, the test system contains a normal loading cylinder, a shear cylinder and some corresponding sensors (Fig. 3). The fractured rock sample is placed in the shear box and the sample can be divided into two parts (i.e., the upper and the lower boxes) (Fig. 3c). At the beginning of the direct shear test, a constant servo-pressure of 15 MPa is applied to the sample. Then, the fractured rock is sheared with a constant displacement rate of 0.15 mm/min (Figs. 3b and 3c). During the test, the normal and shear displacements are recorded by the LVDT sensors simultaneously.
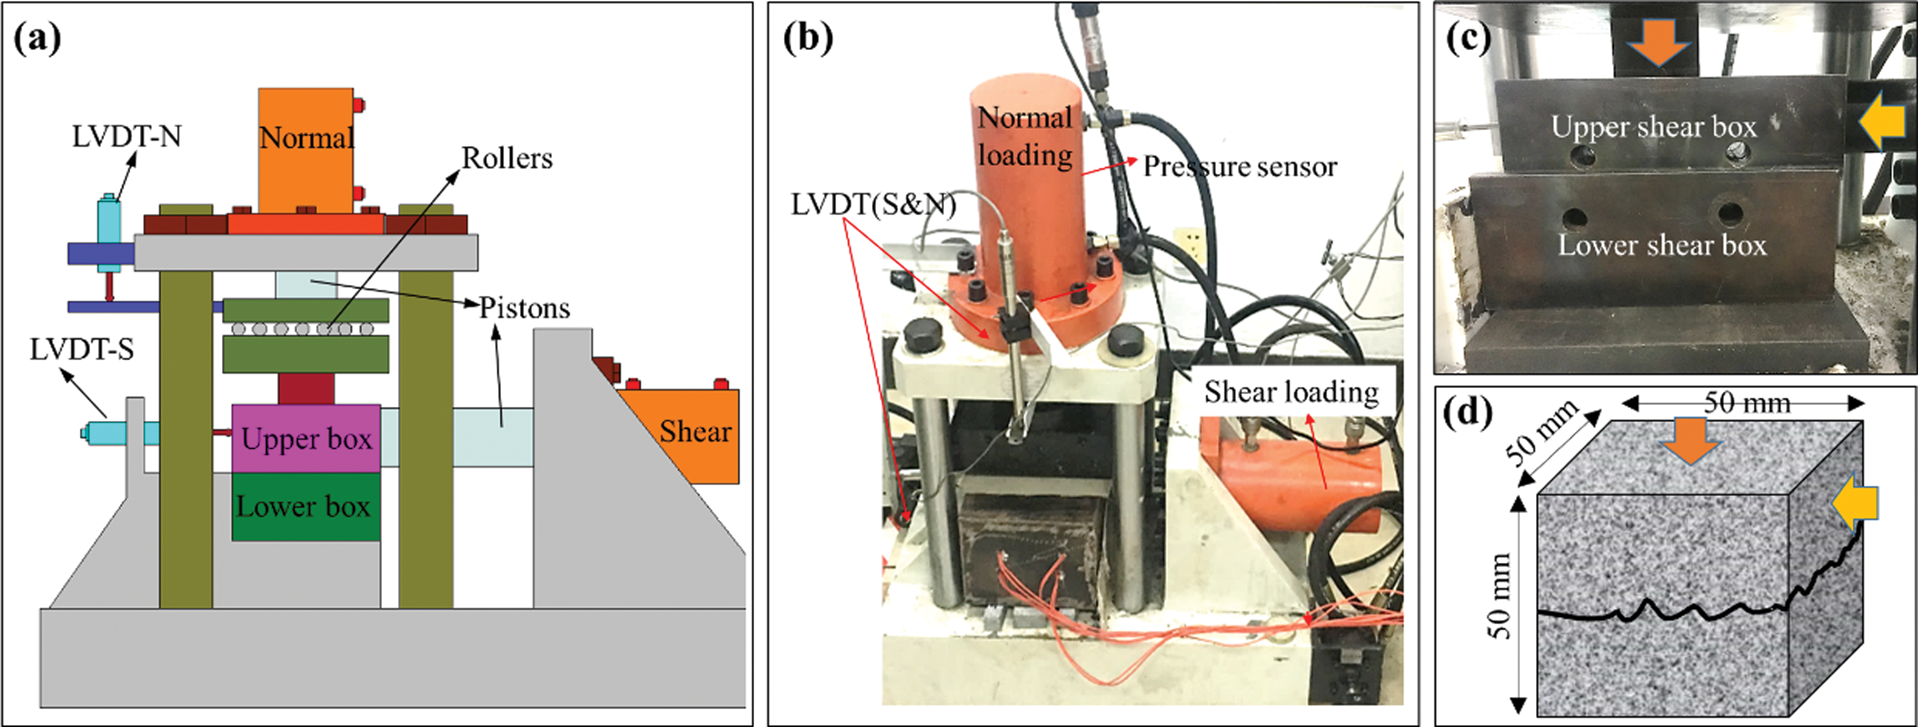
Figure 3: Test setups and the installation process of shearing box. (a) Schematic diagram of direct shear test machine; (b) Photograph of test machine; (c) Rock shearing box; (d) Fractured rock sample
In the numerical modeling, we focused on the coupled seepage and heat transfer characteristics of fractured HDR instead of the triggering mechanism of hydroshearing (i.e., mechanical parts). Since the coupled Thermal-Hydro-Mechanical (THM) processes in underground fractured rock are complex, reasonable assumptions should be given before numerical modeling. (1) The rock is linearly elastic and homogeneous; (2) Fluid flow obeys the Darcy’s Law; (3) Rock mass is fully saturated and there is no water phase transformation under injection pressure. Fractures are the main channel for fluid flow and the rock matrix do not store and transfer fluid; (4) Heat conduction obeys the Fourier’s Law.
(1) Fluid flow governing equation in rock fractures
Fluid flow in the HDR rock mass obeys the Darcy’s Law:

where q is the average velocity (fluid flux per unit area); Kfrac is hydraulic conductivity;  is fluid pressure;
  is fluid density; g is the gravity acceleration; z is the coordinate of the vertical direction.
The hydraulic conductivity can be written as:

where v is the kinematic viscosity; g is the gravity acceleration; b is the fracture aperture, which can be obtained from the direct shear tests.
(2) Heat conduction governing equation
In the fractured rock, the heat transfer between water and rock mainly includes two types, i.e., heat conduction and heat convection. In the rock matrix, the heat conduction governing equation can be described by Fourier’s Law, which is expressed as:

where qh represents the heat flux intensity vector (heat flow per unit area);  is the heat conduction coefficient (related to the material properties and temperature);
  is the temperature gradient.
In rock mass, the thermal conductivity differential equation can be controlled by the combined energy conservation law and the Fourier’s Law, which can be described as Eq. (5.1). When considering fluid flow along fractures, the thermal conductivity differential equation for fluid in the direction of fluid flow is described as Eq. (5.2):

where  and
and  are the density of rock and fluid, respectively; crock and
  are the specific heat capacity at constant pressure of rock and fluid, respectively;
  and
and  are the heat conduction coefficient of rock and fluid, respectively.
2.2.2 Building Numerical Models
We paid our main attention to the coupled seepage and heat transfer characteristics of the large-scale single fractured rock under shear scenario in this manuscript. Specifically, the main concern is to what extent can heat extraction efficiency be enhanced by employing the hydroshearing technique in EGS reservoirs. For convenience, we simplify the 2D fracture profile as wave shape or sinusoidal shape. As shown in Fig. 4a, fracture curves are in the same period but in different undulations. The generated length of these three fractures is 500 m and the expand lengths of these fractures are 505.3 m, 512.1 m and 520.2 m, respectively. During the fracture generation process, we controlled the JRC values of fractures in our simulations to be consistent with the engraved JRC values in the experimental test. Namely, the JRC values of the numerical generated fractures are 5.1, 10.7 and 14.4, respectively.
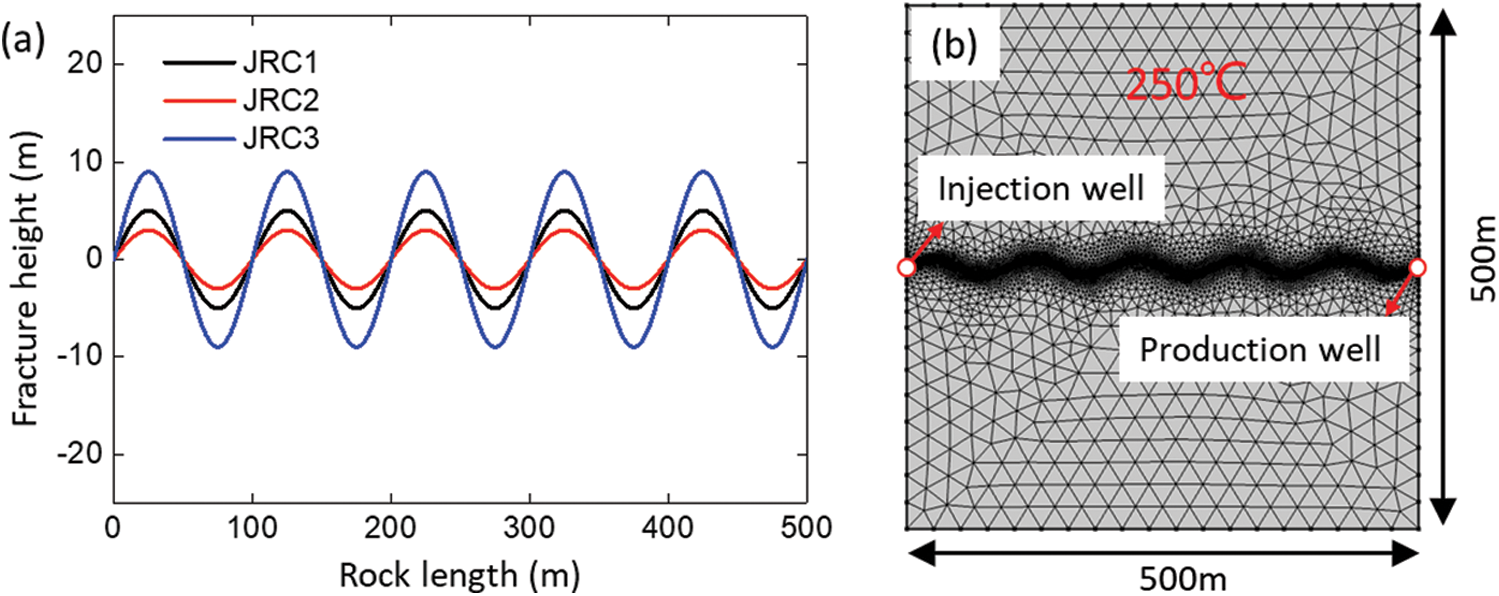
Figure 4: Numerical generated rock fractures (a) and numerical model (b)
The generated fracture curves are then imported to the COMSOL Multiphysics simulation software. The dimension of the 2D numerical model is  and the fracture lies in the middle of the simulated reservoir (Fig. 4b). The temperature values of the rock for the boundary and the injected water are set to be 250
 C and 30
 C, respectively. The injected fluid flows from the injection well to the production well and the heat can be extracted from the rock matrix due to the temperature difference. The initial aperture width of the simulated fracture is set to be 1.0 mm, and the fracture dilation caused by shearing is consistent with the experimental test results, which indicates the rationality of our numerical model. The simulation production time of the EGS is 60 years and the parameters in the numerical simulation are shown in Tab. 1.
Table 1: Numerical simulation parameters

3 Experimental Results: Shear Induced Aperture Evolution
Fig. 5 demonstrates the shear stress, normal displacement vs. shear displacement curves of the three simulated fractures. It can be found that the normal displacement vs. shear displacement curve can be divided into three stages: displacement adjustment stage, increasing stage and stable stage. The displacement adjustment stage and the increasing stage often occur before the occurrence of the peak stress. In the displacement adjustment stage, the surfaces of the fracture are fit and compact with each other showing an oscillating or concave trend. In the normal displacement increasing stage, the curve grows almost linearly, indicating the occurrence of the shear dilation. This dilation has a direct impact on the seepage of the EGS reservoir. To be more specific, a greater dilation implies a better hydraulic conductivity. After the peak stress or normal displacement dilation, the normal displacement tends to be stable with increasing of shear displacement. The reason for the downward trend of the normal displacement curve in Fig. 5c is the failure of rock, in which shear induced fractures divide the top rock and the down rock to four parts.
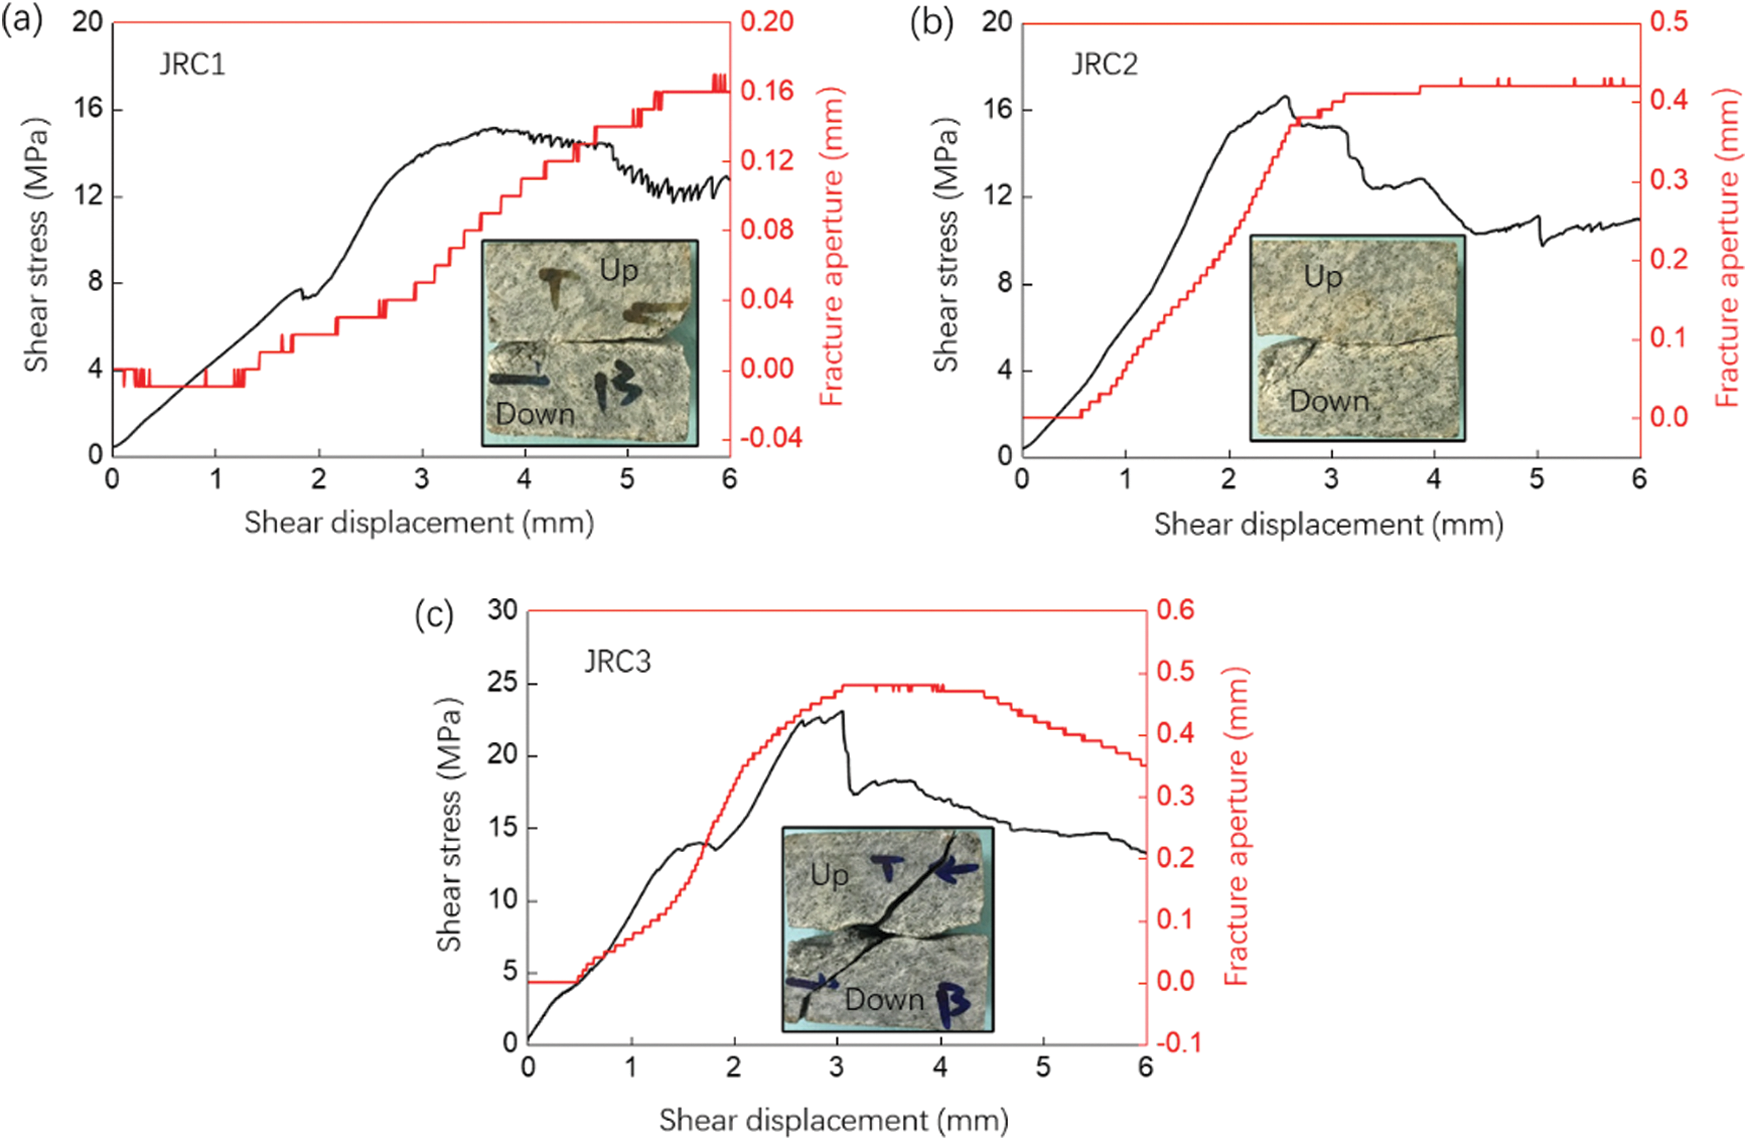
Figure 5: Shear stress, normal displacement vs. shear displacement curves of JRC1, JRC2 and JRC3 rocks
For the JRC1 curves ( ), the normal displacement tends to be stable at the shear displacement of 5–7 mm and the maximum normal displacement is about 0.16 mm (Fig. 5a). For the JRC2 curves (
 ), the normal displacement-shear displacement curve reflects the change characteristics of the aforementioned three stages. The stress drop process after the peak point indicates the interlocking of fracture asperity and the normal displacement curve tends to be stable (the maximum value is 0.4). Fig. 5c shows the shear stress and normal displacement curves during the shear of the granite fracture with the JRC of 14.4. It can be seen that after the sudden stress drop, the normal displacement tends to be stable for a while (the maximum value is 0.5) and then followed by a sudden displacement drop.
4 Numerical Results and Discussion
4.1 Numerical Results of the Thermal Distribution of a Single Fractured HDR
Fig. 6 presents the seepage and heat transfer results of the single fractured rock mass at the 10th year. The temperature near the injection well decreases with time, and moves towards the production well direction. With the injection of cold water, heat is transferred from the bedrock to fluid in fracture and taken away by fluid flowing, thus decreasing the temperature of HDR. However, due to the minor difference in the expansion length of the three fractures, the temperature distribution is the same in the 10th year, which can be seen on the left side of Fig. 6.
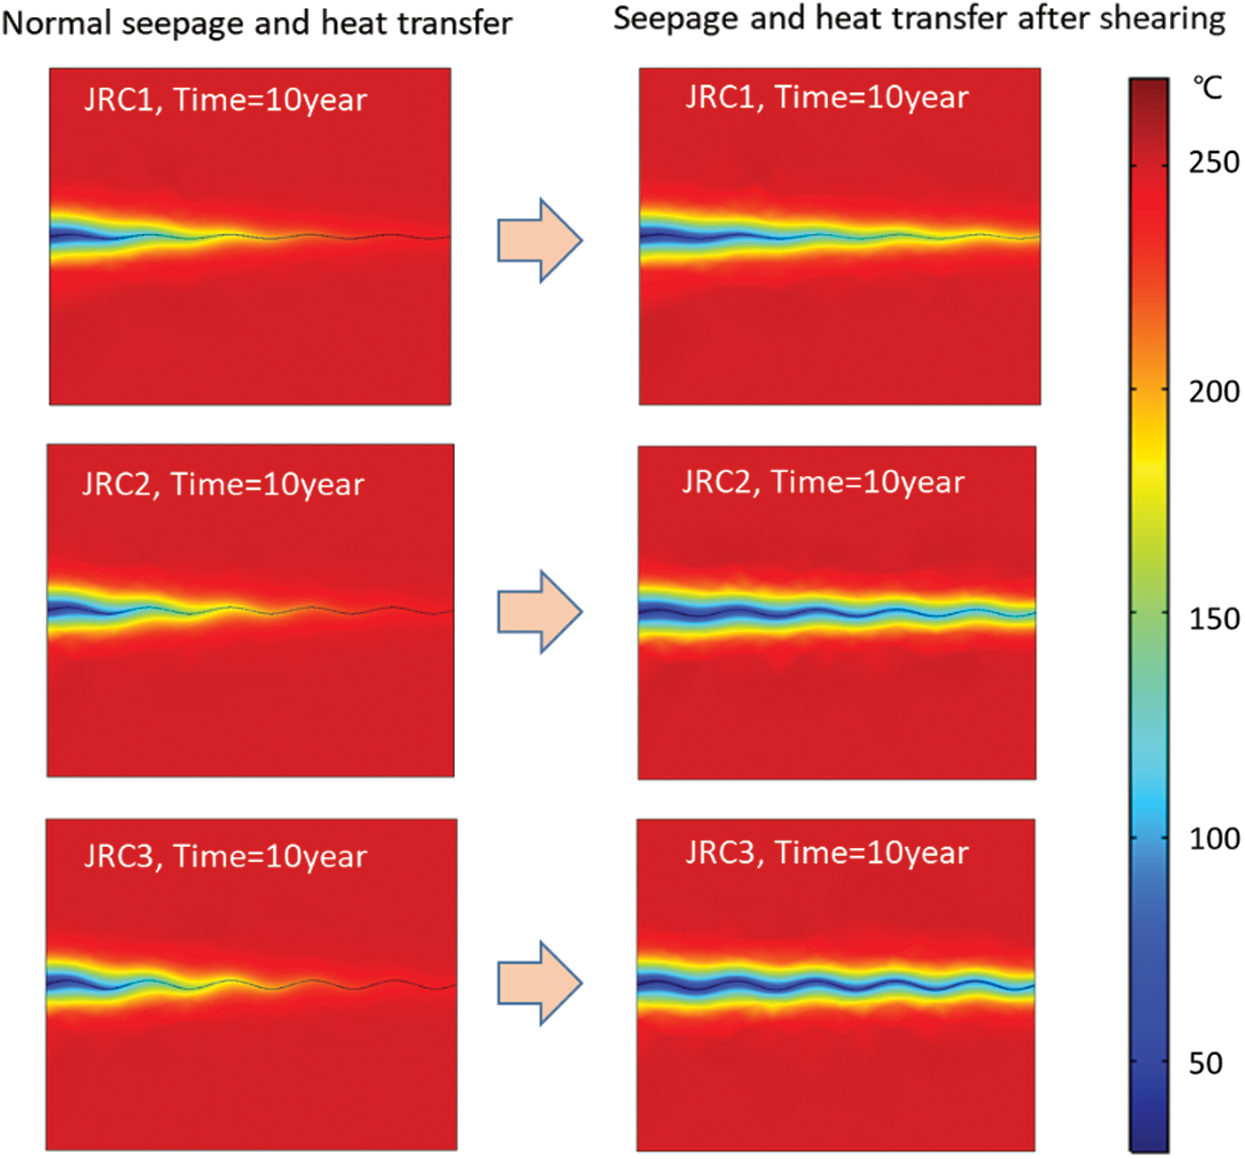
Figure 6: Temperature distribution cloud of fractured HDR before and after shearing
The seepage and heat transfer simulation results of the single fractured HDRs after shearing are shown on the right side in Fig. 6. With the occurrence of shearing, the fracture opening increases gradually, which leads to a greater change of temperature distribution along the fracture. Since the shear induced fracture opening of fracture is related to its surface roughness which has been illustrated in the experimental result, the hydraulic conductivity of fractures JRC1, JRC 2 and JRC3 changed obviously, resulting in a greater difference in temperature field of around fractures. Specifically, the shear-induced temperature drop of scenario JRC3 ( ) is the largest, and that of scenario JRC1 (
 ) is relatively smaller.
4.2 Temperature of Outlet Water and Heat Extraction Efficiency
Figs. 7a and 7b show the temperature vs. time curves of outlet fluid before and after shearing of rock fracture. Generally, the outlet fluid temperature curve shows a decreasing trend during the heat extracting period (0 to 60 years). Normally, the curves of fractures JRC1, JRC2 and JRC3 are the same. However, after shearing, a large difference in outlet temperature can be seen. For the outlet temperature-time curve of fractures JRC, JRC2 and JRC3 without shear, the outlet temperature does not change at the 12.5th year, and maintains at 250 C. However, for the sheared rock fractures, the outlet temperatures of fractures with JRC, JRC2 and JRC3 decrease to 246
 C, 235
 C and 221
 C at the 12.5th year respectively.
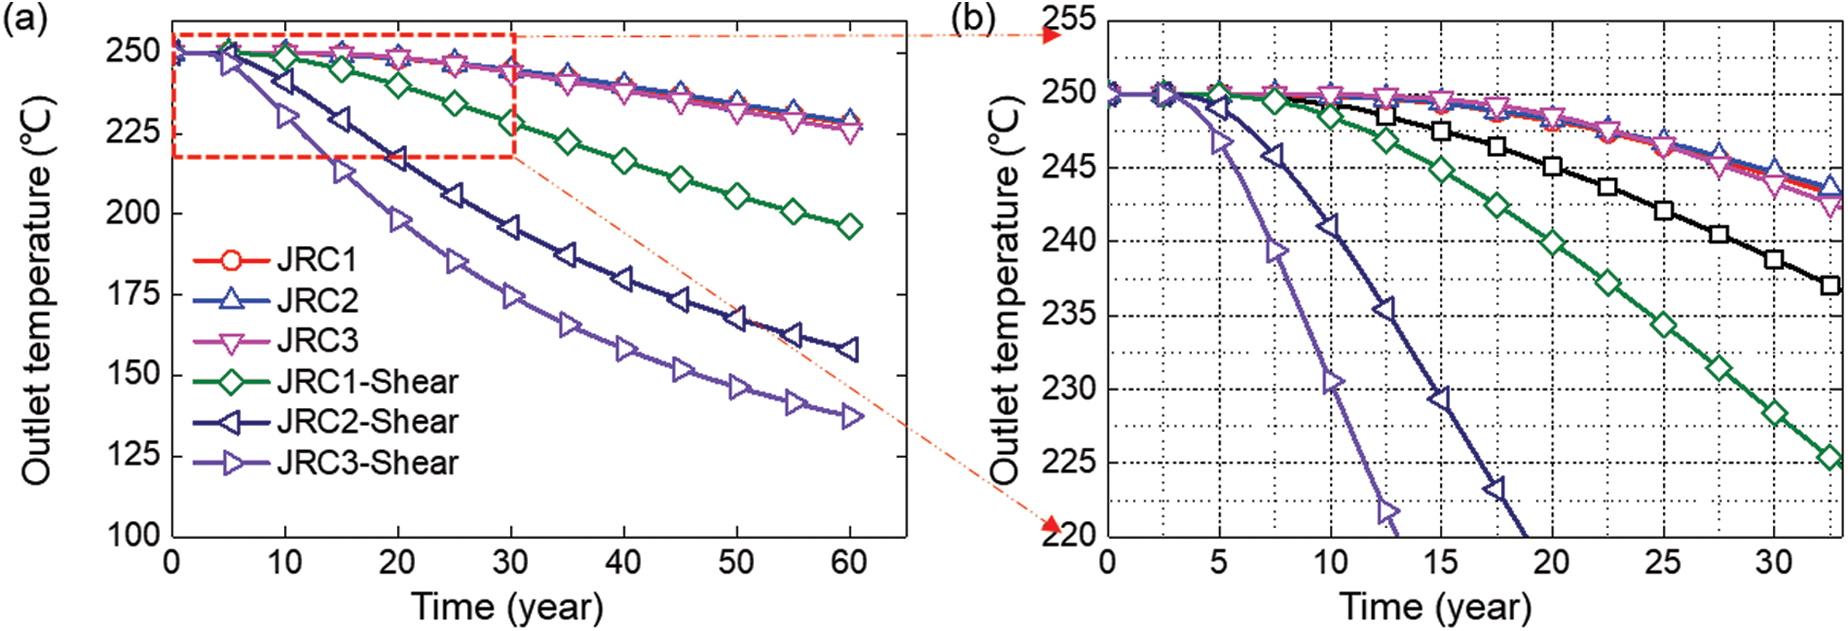
Figure 7: Temperature vs. time curves of outlet fluid before (a) and after (b) shearing of rock fracture
When extracting heat from geothermal reservoir, we should not only concentrate on outlet temperature but also the flow flux. Therefore, in this study, the cumulative heat extraction index is adopted to evaluate the heat extraction efficiency of hydroshearing, and the cumulative heat extraction index is expressed as:

where Qs means the cumulative heat extraction index; cp is the specific heat capacity of water; uout is the outlet flow rate; t is the time; b is the fracture aperture; Tout is the outlet fluid temperature; T0 is the room temperature.
Fig. 8 shows the instantaneous and cumulative heat extraction curves of fracture HDR reservoir. In this study, it is assumed that the hydroshearing technique was employed in the first year. With the occurrence of shearing, the instantaneous heat extraction increases rapidly to the peak value. However, as shown in Fig. 7, the outlet fluid temperature is almost unchanged, thus the reason affecting heat extraction during shearing is the shear-enhanced flow flux. A greater JRC always implies a faster instantaneous heat extraction increasing rate and a higher peak value. Specifically, the peak instantaneous heat extraction values are  J,
J,  J and
J and  J for fracture JR1, JRC2 and JRC3 respectively. As shearing ceased and the shear-increased fluid flux being stable, the instantaneous heat extraction decreases gradually, and the greater the roughness is, the faster the reduction will be. This is because the outlet fluid temperature goes down.
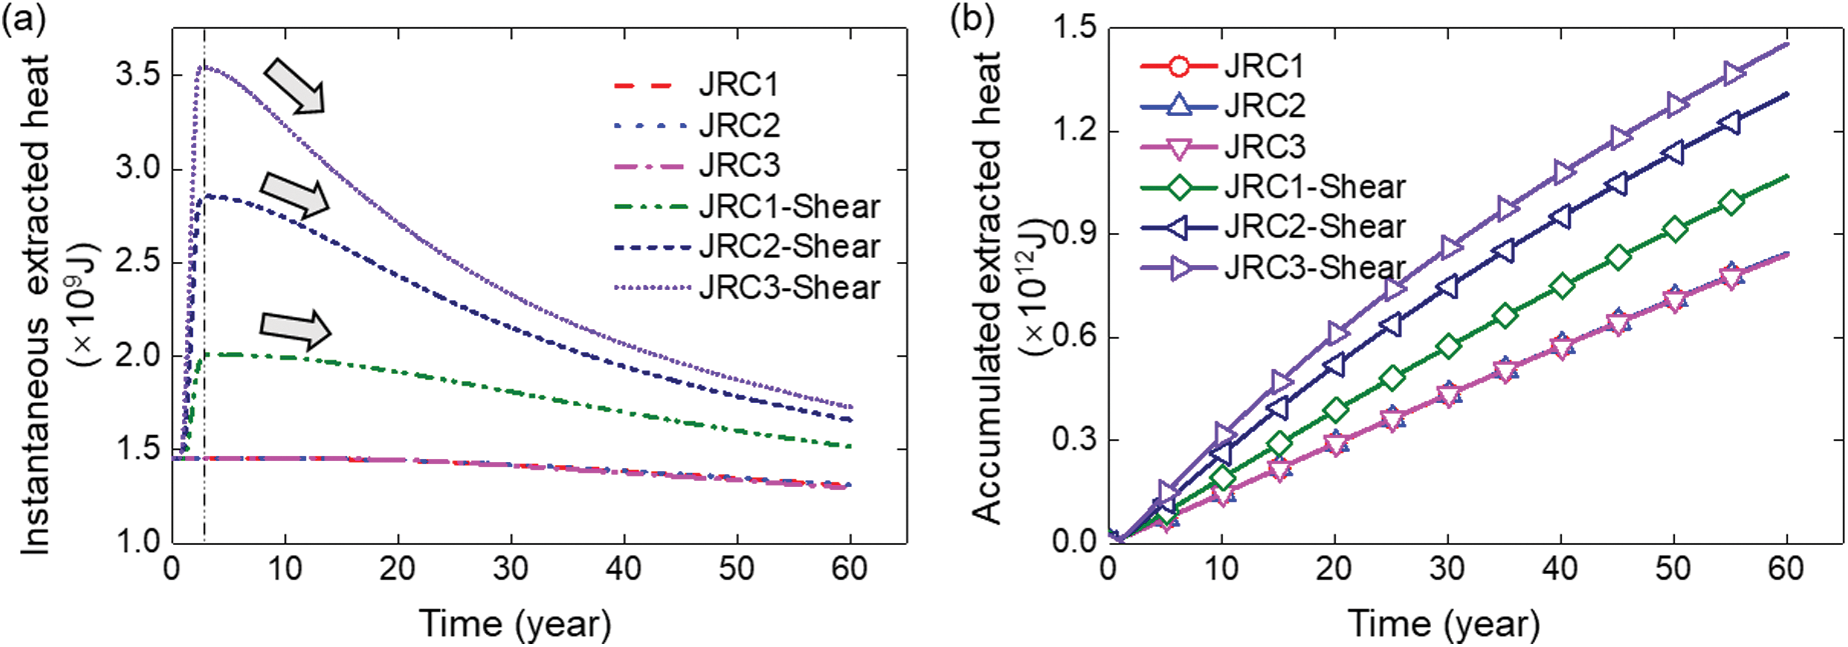
Figure 8: Instantaneous (a) and cumulative (b) heat extraction curves of fracture HDR reservoir
Fig. 8b presents the cumulative heat extraction curves of the production well. It can be seen that all of these curves (before and after shearing) increase with time. After shearing, the curve increases faster when compared with those of non-sheared fracture and a higher fracture roughness implies a greater increasing rate. This is due to the combined effect of shear-enhanced outlet flow flux and the shear-sacrificed outlet temperature. Therefore, although the hydroshearing technique shortens the service life of the EGS system to a certain extent, the increased flow flux and excellent heat extraction efficiency should be fully understood and utilized. Therefore, in terms of the huge amount of geothermal energy, it is worth sacrificing a certain service life in exchange for efficient heat extraction and abundant heat output.
In this study, we combined the method of theoretical analysis, experimental research and numerical simulation to uncover the seepage and heat transfer enhancement mechanism of hot-dry-rock (HDR) mass under the effect of shearing. The main conclusions are shown as follows:
1. The shear-induced dilation of granite rock fractures can be divided into several stages: Displacement adjustment stage, increasing stage and stable stage. With the increase of fracture roughness, the shear peak strength and the maximum dilation of rock fractures increase gradually.
2. Although the hydroshearing enhanced the hydraulic conductivity of the reservoir, it lowered the temperature around target fractures in the EGS reservoir. In the process of hydroshearing, a rougher fracture surface implies a greater hydraulic conductivity, indicating that conducting hydroshearing for rough fracture would be better.
3. When conducting hydroshearing technique, the coupled effects of shear-enhanced outlet flow flux and the shear-sacrificed outlet temperature control the heat extraction efficiency of an EGS reservoir. With the shear-enhanced hydraulic conductivity of rock fracture, the instantaneous heat extraction increases rapidly for several years. After the shear-induced outlet flow flux becomes stable, the decreasing outlet temperature would severely affect the heat extraction of the EGS reservoir.
Highlights: (1) Both shear strength and maximum dilation of rock fractures increase with increasing fracture roughness coefficient. (2) Both hydraulic conductivity and the heat extraction efficiency will be enhanced when conducting hydroshearing tests for EGS reservoir. (3) The coupled effects of shear-enhanced outlet flow flux and the shear-sacrificed outlet temperature control the heat extraction efficiency of the EGS reservoir.
Acknowledgement: We thank Zhaoyang Ma for his help in field of writing and data analysis.
Authors’ Contributions: Hongwei Zhang and Junhui Wang contributed equally to this work.
Funding Statement: This work was supported by the Fundamental Research Funds for the Central Universities (2020XJNY03) and the YueQi Distinguished Scholar Project of China University of Mining & Technology, Beijing.
Conflicts of Interest: The authors declare that they have no conflicts of interest to report regarding the present study.
1. Häringa, M. O., Schanza, U., Ladnera, F., Dyerb, B. C. (2008). Characterisation of the Basel 1 enhanced geothermal system. Geothermics, 37(5), 469–495. [Google Scholar]
2. Ghassemi, A., Tarasovs, S., Cheng, A. D. (2007). A 3-D study of the effects of thermomechanical loads on fracture slip in enhanced geothermal reservoirs. International Journal of Rock Mechanics and Mining Sciences, 44(8), 1132–1148. [Google Scholar]
3. Cladouhos, T., Petty, S., Foulger, G., Julian, B., Fehler, M. (2010). Injection induced seismicity and geothermal energy. GRC Transactions, 34, 1213–1220. [Google Scholar]
4. Rinaldi, A. P., Rutqvist, J., Sonnenthal, E. L., Cladouhos, T. T. (2015). Coupled THM modeling of hydroshearing stimulation in tight fractured volcanic rock. Transport in Porous Media, 108(1), 131–150. [Google Scholar]
5. Yin, Q., Ma, G., Jing, H., Wang, H., Su, H. et al. (2017). Hydraulic properties of 3D rough-walled fractures during shearing: An experimental study. Journal of Hydrology, 555, 169–184. [Google Scholar]
6. Ziagos, J., Phillips, B. R., Boyd, L., Jelacic, A., Stillman, G. et al. (2013). A technology roadmap for strategic development of enhanced geothermal systems. Proceedings of the 38th Workshop on Geothermal Reservoir Engineering. Stanford University, Stanford, California. [Google Scholar]
7. Hao, Y., Fu, P., Carrigan, C. R. (2013). Application of a dual-continuum model for simulation of fluid flow and heat transfer in fractured geothermal reservoirs. Proceedings of the 38th Workshop on Geothermal Reservoir Engineering. Stanford University, Stanford, California. [Google Scholar]
8. Rutqvist, J. (2015). Fractured rock stress-permeability relationships from in situ data and effects of temperature and chemical-mechanical couplings. Geofluids, 15(1–2), 48–66. [Google Scholar]
9. Dieterich, J. H. (1992). Earthquake nucleation on faults with rate-and state-dependent strength. Tectonophysics, 211(1–4), 115–134. [Google Scholar]
10. Lee, H., Cho, T. (2002). Hydraulic characteristics of rough fractures in linear flow under normal and shear load. Rock Mechanics and Rock Engineering, 35(4), 299–318. [Google Scholar]
11. Bauer, S. J., Huang, K., Chen, Q., Ghassemi, A., Barrow, P. (2016). Laboratory and numerical evaluation of EGS shear stimulation. The 41st Workshop on Geothermal Reservoir Engineering. Stanford, California. [Google Scholar]
12. Dempsey, D., Kelkar, S., Lewis, K., Hickman, S., Davatzes, N. et al. (2013). Modeling shear stimulation of the Desert Peak EGS Well 27-15 using a coupled thermal-hydrological-mechanical simulator. 47th US Rock Mechanics/Geomechanics Symposium. San Francisco, CA. [Google Scholar]
13. Tezuka, K., Tamagawa, T., Watanabe, K. (2005). Numerical simulation of hydraulic shearing in fractured reservoir. Proceedings World Geothermal Congress. Antalya, Turkey. [Google Scholar]
14. Rutqvist, J., Wu, Y. S., Tsang, C. F., Bodvarsson, G. (2002). A modeling approach for analysis of coupled multiphase fluid flow, heat transfer, and deformation in fractured porous rock. International Journal of Rock Mechanics & Mining Sciences, 39(4), 429–442. [Google Scholar]
15. Riahi, A., Damjanac, B. (2013). Numerical study of hydro-shearing in geothermal reservoirs with a pre-existing discrete fracture network. Proceedings of the 38th Workshop on Geothermal Reservoir Engineering. Stanford, California. [Google Scholar]
16. Yin, Q., Jing, H., Ma, G., Su, H., Liu, R. (2018). Investigating the roles of included angle and loading condition on the critical hydraulic gradient of real rock fracture networks. Rock Mechanics Rock Engineering, 51(10), 3167–3177. [Google Scholar]
17. Rinaldi, A. P., Rutqvist, J. (2019). Joint opening or hydroshearing? Analyzing a fracture zone stimulation at Fenton Hill. Geothermics, 77, 83–98. [Google Scholar]
18. Kamali, A., Ghassemi, A. (2018). Analysis of injection-induced shear slip and fracture propagation in geothermal reservoir stimulation. Geothermics, 76, 93–105. [Google Scholar]
19. Lee, K. K., Ellsworth, W. L., Giardini, D., Townend, J., Ge, S. et al. (2019). Managing injection-induced seismic risks. Science, 364(6442), 730–732. [Google Scholar]
20. Ye, Z., Ghassemi, A. (2018). Injection-induced shear slip and permeability enhancement in granite fractures. Journal of Geophysical Research Solid Earth, 123(10), 9009–9032. [Google Scholar]
21. Si, G. Y., Durucan, S., Shi, J., Anna, K., Cao, W. (2019). Parametric analysis of slotting operation induced failure zones to stimulate low permeability coal seams. Rock Mechanics and Rock Engineering, 52(1), 163–182. [Google Scholar]
22. Chen, D., Pan, Z., Shi, J., Si, G., Ye, Z. (2016). A novel approach for modelling coal permeability during transition from elastic to post-failure state using a modified logistic growth function. International Journal of Coal Geology, 163, 32–139. [Google Scholar]
23. Barton, N., Choubey, V. (1977). The shear strength of rock joints in theory and practice. Rock Mechanics and Rock Engineering, 10(1–2), 1–54. [Google Scholar]
24. Tse, R., Cruden, D. M. (1979). Estimating joint roughness coefficients. International Journal of Rock Mechanics and Mining Sciences & Geomechanics Abstracts, 16(5), 303–307. [Google Scholar]
 | This work is licensed under a Creative Commons Attribution 4.0 International License, which permits unrestricted use, distribution, and reproduction in any medium, provided the original work is properly cited. |