| Computer Modeling in Engineering & Sciences |
DOI: 10.32604/cmes.2021.014263
ARTICLE
Estimating the Impact of COVID-19 Pandemic on the Research Community in the Kingdom of Saudi Arabia
1Faculty of Computing and Information Technology, King Abdulaziz University, Jeddah, 21589, Saudi Arabia
2Department of Information Technology, Babasaheb Bhimrao Ambedkar University, Lucknow, 226025, India
3Department of Computer Application, Shri Ramswaroop Memorial University, Barabanki, 225003, India
*Corresponding Author: Rajeev Kumar. Email: rs0414@gmail.com
Received: 14 September 2020; Accepted: 26 November 2020
Abstract: Ever since its outbreak in Wuhan, COVID-19 has cloaked the entire world in a pall of despondency and uncertainty. The present study describes the exploratory analysis of all COVID cases in Saudi Arabia. Besides, the study has executed the forecasting model for predicting the possible number of COVID-19 cases in Saudi Arabia till a defined period. Towards this intent, the study analyzed different age groups of patients (child, adult, elderly) who were affected by COVID-19. The analysis was done city-wise and also included the number of recoveries recorded in different cities. Furthermore, the study also discusses the impact of COVID-19 on the economy. For conducting the stated analysis, the authors have created a list of factors that are known to cause the spread of COVID-19. As an effective countermeasure to contain the spread of Coronavirus in Saudi Arabia, this study also proposes to identify the most effective Computer Science technique that can be used by healthcare professionals. For this, the study employs the Fuzzy-Analytic Hierarchy Process integrated with the Technique for Order Performance by Similar to Ideal Solution (F.AHP.TOPSIS). After prioritizing the various Computer Science techniques, the ranking order that was obtained for the different techniques/tools to contain COVID-19 was: A4 > A1 > A2 > A5 > A3. Since the Blockchain technique obtained the highest priority, the study recommends that it must be used extensively as an efficacious and accurate means to combat COVID-19.
Keywords: Coronavirus; social impact; safety; precautions; fuzzy-AHP.TOPSIS; block-chain technique; COVID-19 monitoring
On 31 December, the Chinese Centre for Disease sent a team to Wuhan to examine the source of the Virus [1]. Unlike the established causes of influenza, avian influenza, severe acute respiratory syndrome (SARS-CoV), and Middle East respiratory syndrome, the cause of Coronavirus (MERS-CoV) could not be detected immediately. It took some time for the experts to ascertain the exact cause of the contagion [2]. On 7 January 2020, the virus was identified as the Novel Coronavirus (COVID-19). COVID-19 is different from SARA-CoV and MERS-CoV, but the virus is closely related to both of them [3]. The initial reports on COVID-19 stated that it was not more dangerous than SARS, and MERS-Cov. However when the virus started spreading uncontrollably due to person-to-person transmission with an unprecedented increase in the mortality levels, then the novel Coronavirus was declared to be far more fatal than SARS, and MERS-CoV [4].
China amended the infectious diseases law on 20 January 2020 to make COVID-19 a class B disease and frontier health and quarantine law was amended to intensify the efforts to contain COVID-19. On 23rd January 2020, China quarantined Wuhan, canceling flights and all other modes of travel to and from the city. By the time the world began to understand and respond to the magnitude of the COVID-19, the virus had transformed into a deadly pandemic. Several studies cite that delays in predicting the onset time can also spread the virus. Moreover, effective control and implementation strategies to control the spread of COVID-19 are tough because of the epidemiological features of the virus. Isolation and social distancing are useful in breaking the chain of transmission of the infection. Though most of the countries are now affected by Coronavirus, the worst afflicted are the USA, Brazil, India, Russia, Spain, UK, Italy, Peru, Chile, Cambodia, and Iran. One-third of the total cases have been identified in the USA alone. The USA is the most severely affected country where total cases from COVID-19 reached 48.5 lakhs, Brazil and India also most affected after the USA. The first case of COVID-19 in Saudi Arabia was confirmed in Riyadh City on 2nd March 2020. The source was traced to the carrier who had traveled from Iran to Bahrain than Saudi [5]. Thereafter the patients were treated in the isolation centres and travel to other countries was temporarily suspended. The first death from COVID-19 in Saudi Arabia was reported on 24th March [6].
As an effective technological aid, computer science techniques and tools are being used extensively for predicting, detecting, and tracing the Corona cases. Moreover, the use of Artificial Intelligence techniques has helped in the accurate identification of the COVID-19 patients at the initial stage of the disease, and also facilitated the development of efficacious drugs. Blockchain technology is also being used in the development of drugs and maintaining the data security of the patients [7]. In this article, we have done an exploratory analysis of COVID-19 cases and growth rate in two distinct timelines. The first scenario maps the growth rate of the cases from the very first day of the outbreak of Coronavirus till 31st July, 2020. In the second timeline, the growth rate of the virus from 1 July to 31 July has been analyzed.
Our analysis is aimed at depicting a relation between the two-time frames besides, with specific reference to Saudi Arabia, estimating the number of tests per 1 Million, fatality rate, number of infected, number of recovered cases. The adverse impact of COVID-19 on the economy of Saudi Arabia has also been discussed. Our study also details the side effects of the frequent use of handwash, sanitizer and masks on the environment and health. We have designed a list of factors/criteria that determine the COVID-19 spread and also enlisted the techniques being used to combat COVID-19 as another set of criteria for our calculations. Furthermore, we have applied the F.AHP.TOPSIS prioritization technique on the chosen criteria for assigning the priority rank to the various computer science techniques that are being used in combating COVID-19. As per the calculations and analysis done thereafter, the blockchain technique gets the highest priority.
COVID-19 pandemic is an unprecedented health emergency for the entire world and in the absence of any vaccine against the virus, the only effective means to contain the spread of the disease is early detection and prompt treatment of Corona cases. In this league, the present study assumes significant importance as the motivation of this study is to identify the best computer science technique that can be used by all the practitioners in their efforts to trace the Corona cases promptly and accurately. As per the study’s analysis, the blockchain techniques have the properties that can be effectively employed in identifying the infected people.
In this study, we have analyzed the cases of COVID-19 in Saudi Arabia. The Saudi government announced the temporary suspension of Umrah on 27th February. 20 days after this announcement, the government suspended the daily prayers and Friday prayers in the mosque. On 20th March, prayers for the general public in the mosques of Mecca and Medina were also suspended to control the spread of the COVID-19.
In our study, we have used the Saudi government’s website covid19.moh.gov.sa and worldometers.info for data analysis and other information relevant to our research interest [8]. All the case records of COVID-19 are daily updated on these official websites [9]. Our study is not premised on a specific sampling of the total numbers of cases to predetermine the study size, and no eligibility criteria have been demarcated.
Country-wise confirmed cases and the growth rate from the start of the outbreak of the pandemic to 31 July have been depicted in Fig. 1. In the other scenario that we have analyzed for our research objective, the growth rate of the cases from 1st to 31st of July has also been calculated. The statistics also include the recovered cases, fatality rate distributed graph constructed for the severely affected countries. This study also discusses the impact on the economy and factors that affect COVID 19. In this study, we have focused primarily on Saudi Arabia. In the analysis, we observed that most of the cases are centred in Makkah al Mukarramah, and the second-largest number of confirmed cases is from Eastern Province. Riyadh has the third-largest number of COVID cases. All these three cities cover more than 50% of cases in comparison to the whole of Saudi Arabia. In terms of the maximum number of the recovered cases, Riyadh is first, and Makkah al Mukarramah is the second. Jeddah is on the third position in terms of the recovery rate. The recovery rate in these three cities is much better. Fatality rates are calculated by the total number of deaths divided by the total number of cases, represented in the percentage by the Eq. (1).

Geo graphical-based analysis has also been profiled by the Saudi government, the country level position of every case by the colour-code maps of Saudi Arabia points to the cases in each city of Saudi Arabia [10]. The curve for all cases is also drawn by using the number of cases in the y-axis and reported date on the x-axis. Total deaths, totally recovered cases and total active cases can be analysed through this curve.
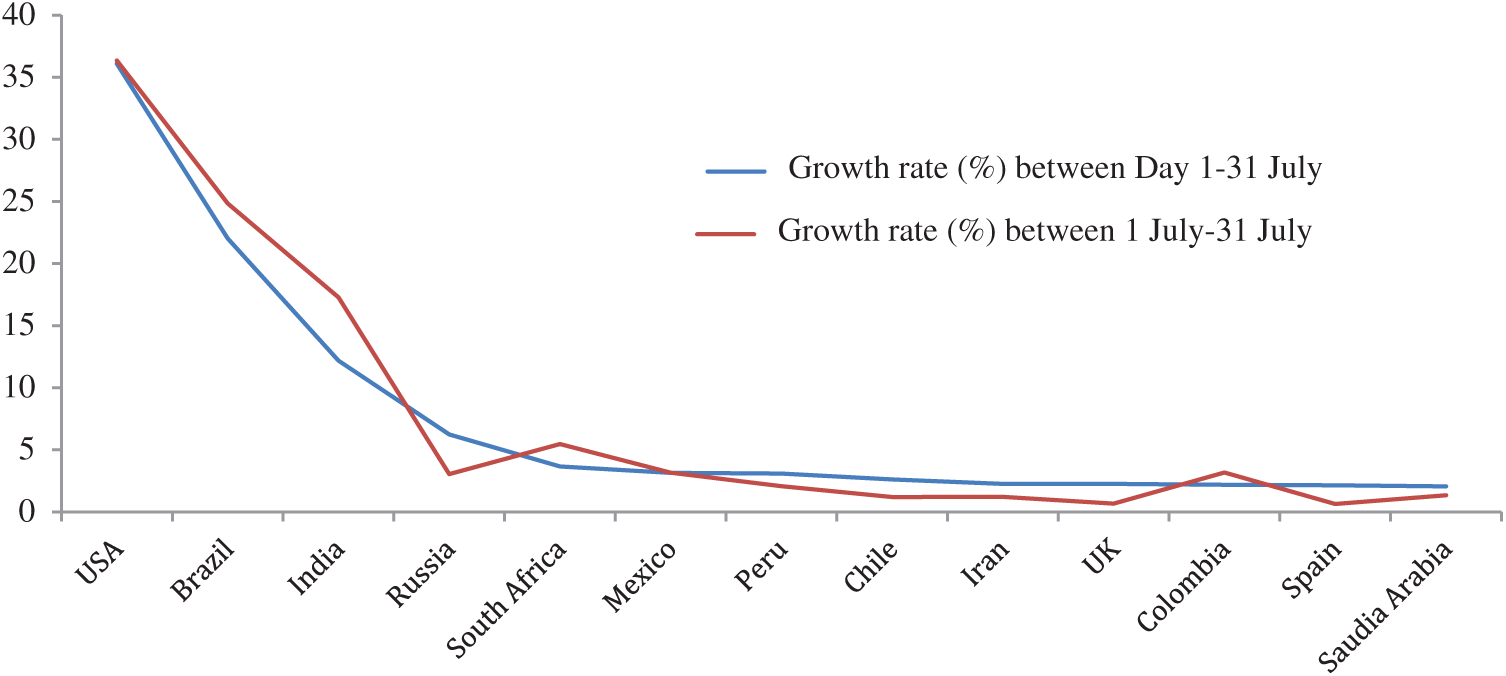
Figure 1: Growth rate of total number of conformed cases
In Tab. 1 we have divided the data set into two parts: The first part pertains to the data set of the confirmed cases from the onset of COVID-19 to 31st July. We have analyzed the overall growth rate of the cases in the 13 worst affected countries in this timeframe. The second part refers to the data set of the confirmed cases from 1st July–31st July 2020. The growth rate in both the timelines has been calculated percentage-wise. In our analysis, we observed that from the start of COVID till 31st July, Saudi Arabia’s growth rate is (2.05%), but this rate reached (1.34%) in the last 31 days. Thus, there is a rising curve, almost down, in the total growth rate. The total number of confirmed cases in Saudi Arabia till 31 July 2020 was 275,905. All the cases till 31 July, whether diagnosed or not, were part of our analysis. In the 275,905 cases, 240,045 patients recovered from COVID-19; 29,316 were active cases, and total deaths were 3,130 till 31st July 2020 [11]. We analyzed the mortality rate of fifteen countries and the results showed that the rate of fatalities in the other countries was higher than in Saudi Arabia.
Table 1: Confirmed cases from day 1 to 31 July and 1 July–31 July 2020
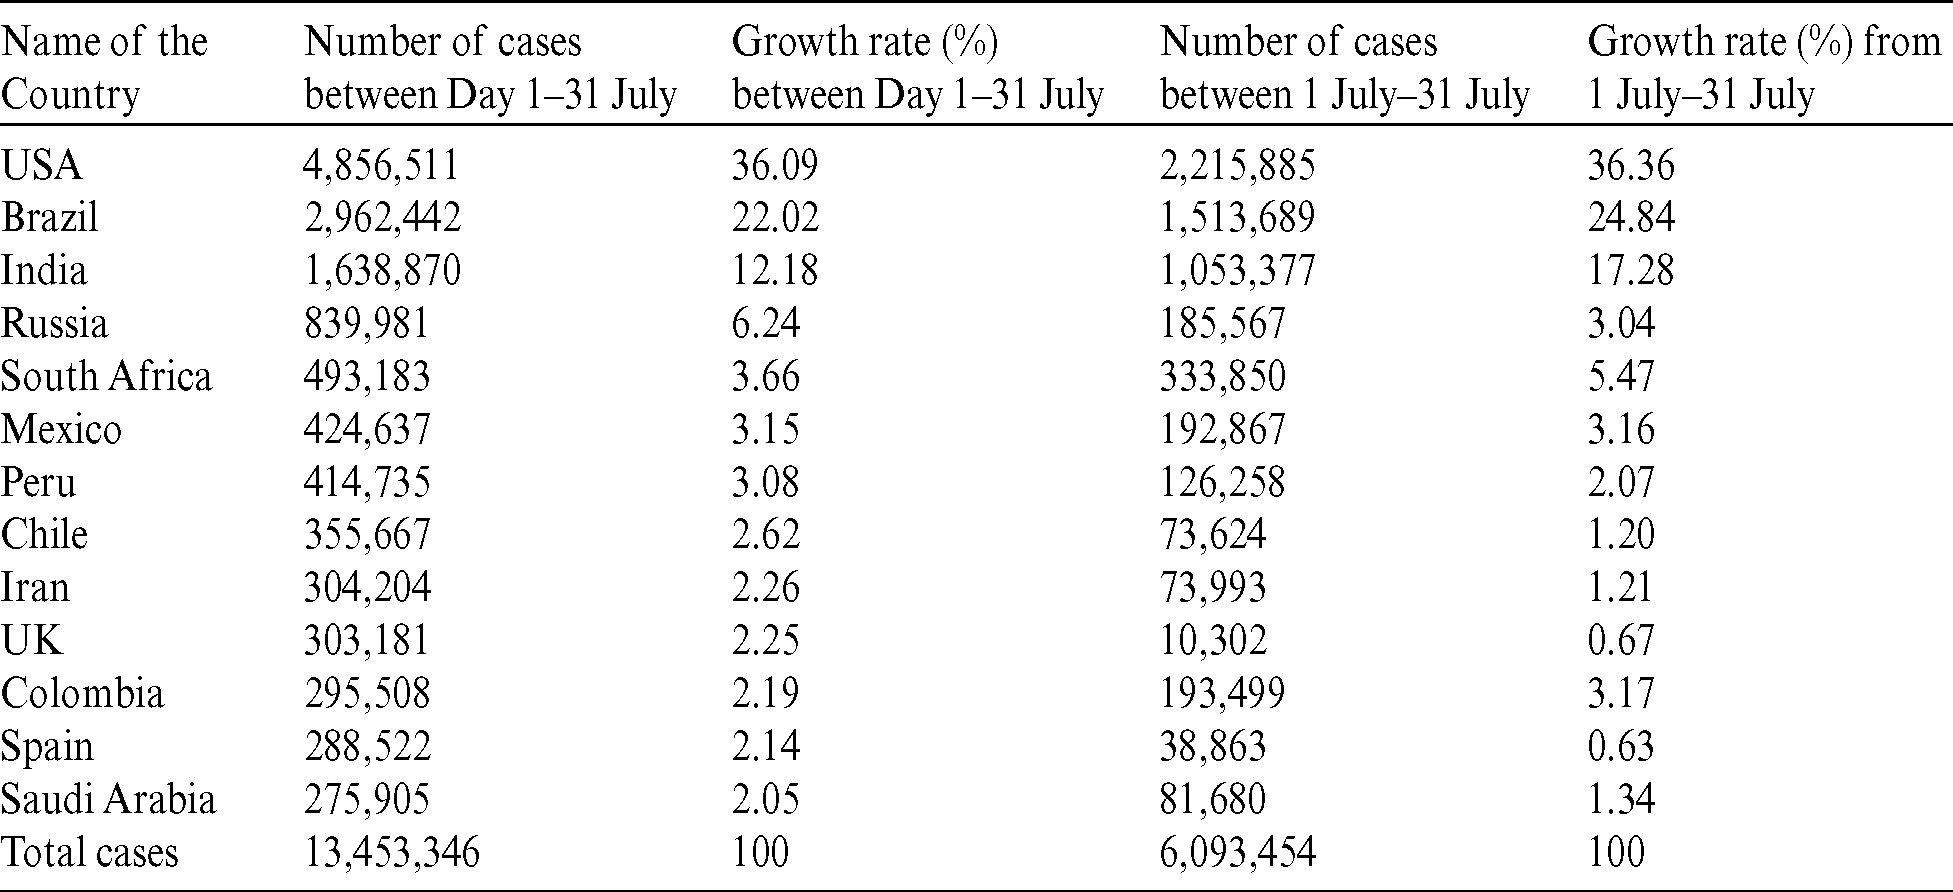
The blue line in the graph depicted above in Fig. 1, shows the growth rate from the outbreak of the Virus to 16 May, and the orange line represents the growth rate from the 1st to 31st of July. As is evident from the graph, some countries like Russia, Spain, and Saudi Arabia have managed to control the spread of the pandemic. But the remaining countries show a marked increase in the growth rate.
Tab. 2 tabulates the rate of confirmed cases in terms of age category, denoted here as stage-wise. Out of the confirmed 275,905 cases, 5% of the infected, i.e., 13,795 people are in the elderly stage. The adults are worst affected by COVID-19 as 84% of the adult stage is infected, i.e., 231,760 cases. And the percentage of children affected by the virus is 11% which makes for 30,350 cases.
Table 2: Total confirmed cases by the stage
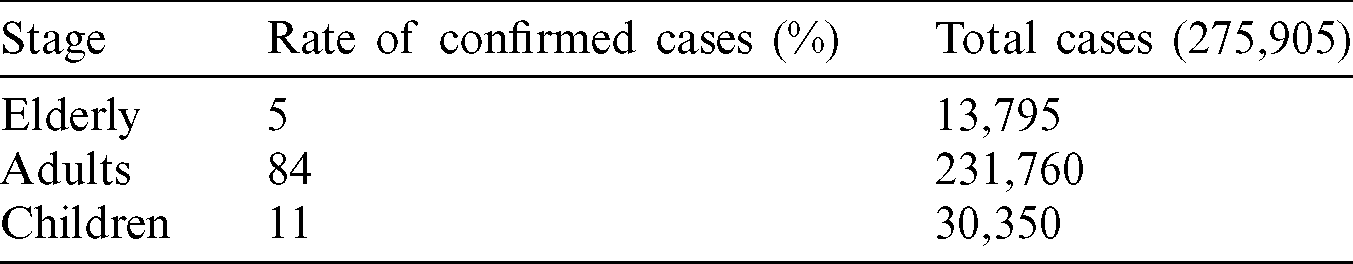
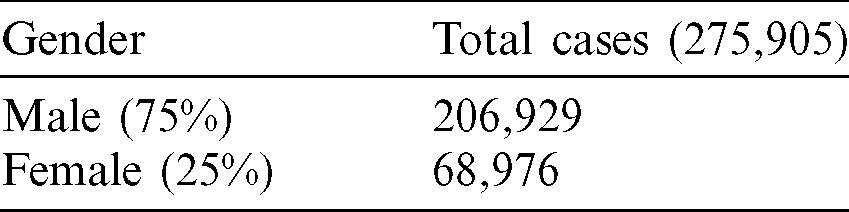
Fig. 2 also shows the confirmed cases in different age groups, and Tab. 3 shows the confirmed cases in terms of gender ratio. Tab. 3 shows that 75% of the patients are male, whereas 25% are female patients. The total number of male patients is 206,929 and the total count of female patients is 68,976.
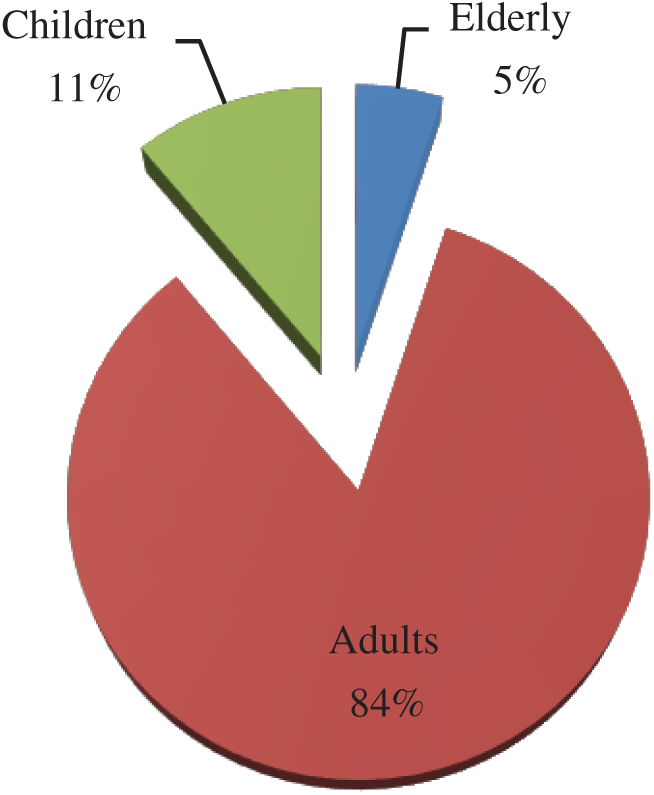
Figure 2: Confirmed cases rates by stage
Table 3: Total confirmed cases by gender
For our empirical estimations, we used a polynomial model for forecasting the cases. The forecasting Model was tested on the data that accounts for the first case reported in Saudi Arabia to the cases reported till 31 July 2020. When we executed the model, then the actual number of confirmed cases in Saudi Arabia was 275,905. As per the statistics in Fig. 3, the forecasting of new cases shows a decline. Furthermore, the analysis of the data by the forecasting model predicts that the monthly-wise cases would be slightly down in August and September and reach just one-third of the number of cases registered in June by 31st August 2020.
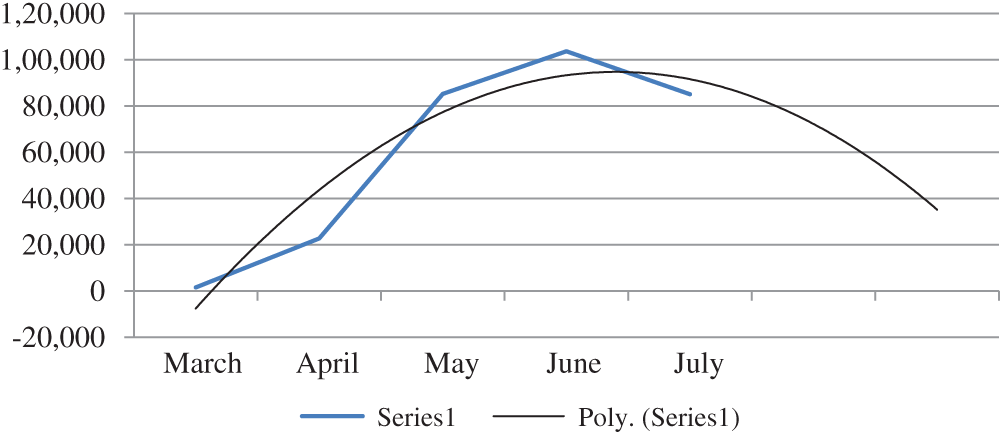
Figure 3: Forecasting of the number of confirmed cases
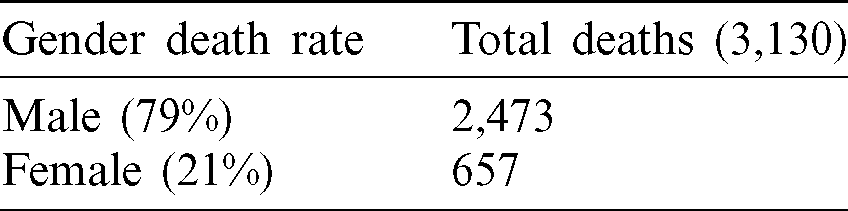
The fatality rate of the 13 worst affected countries was calculated by Eq. (1) mentioned in the above section. According to the analysis, the percentage of fatality rate was 15% in Spain, the highest of all the 13 countries (Tab. 4 and Fig. 4). But most of the deaths happened in the USA with 165,074 fatalities. The fatality rate was least in Saudi Arabia (1.1%); which is a good sign. The total number of fatalities in Saudi Arabia till 31st July 2020 was 3,130 out of 275,905 confirmed cases (Tab. 5). This was calculated by using the Eq. (1) mentioned in the above section.
Table 4: Death and fatality rate in percentage (%) till 31 May 2020
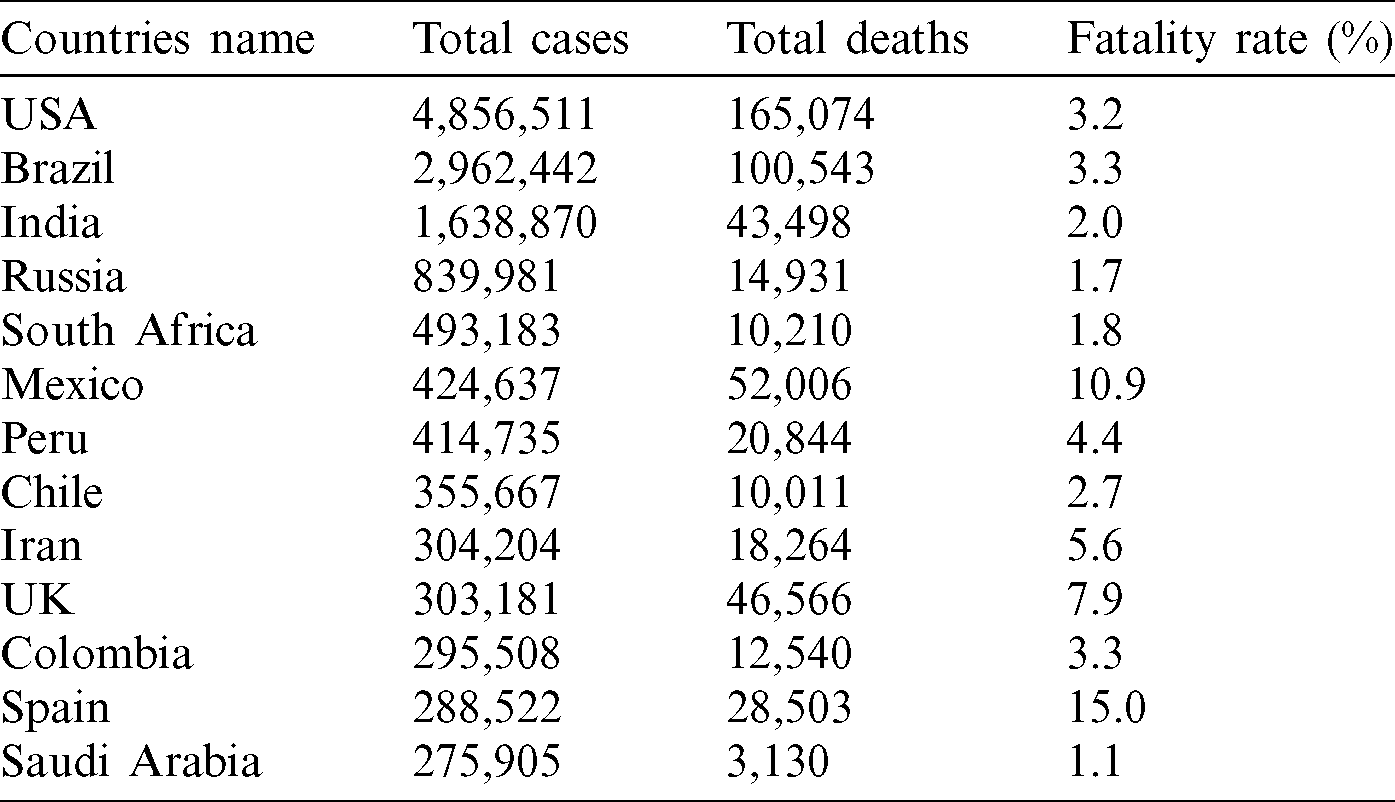
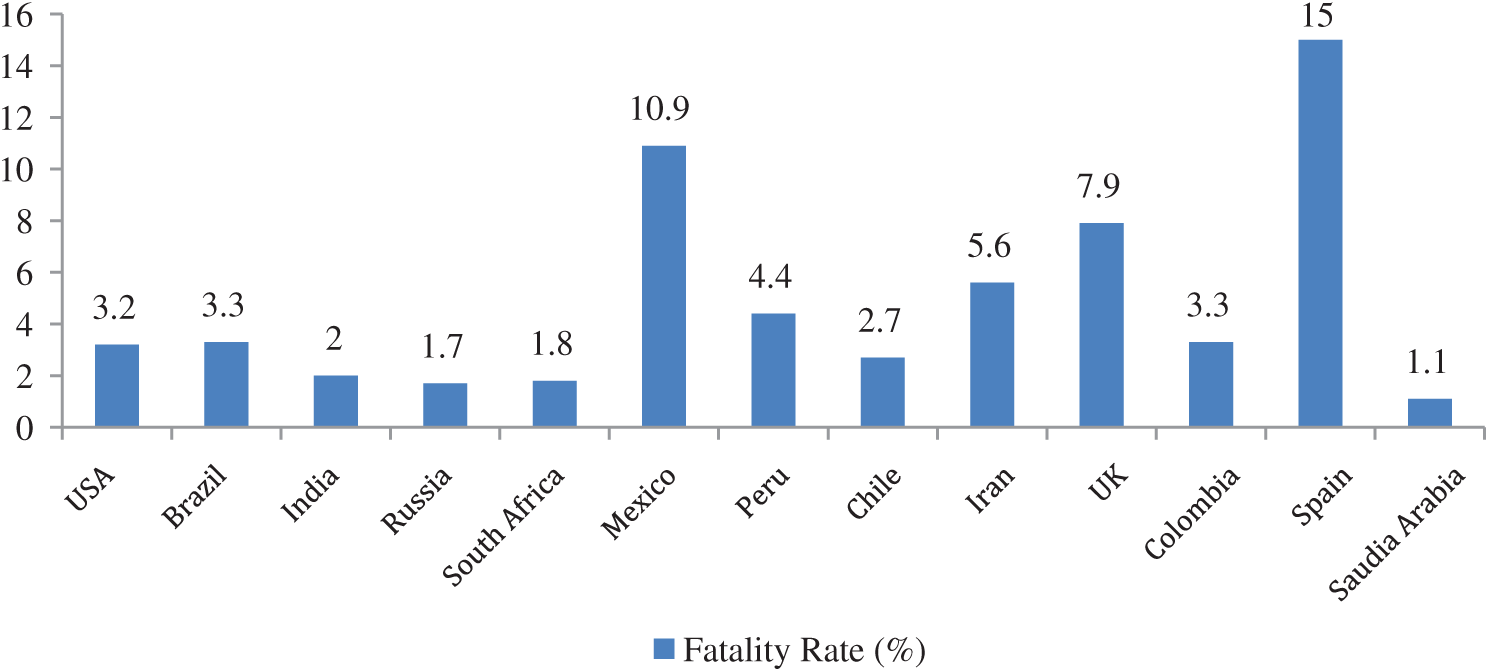
Figure 4: Fatality rate in percentage
Table 5: Deaths rate by gender
The fatality rate in Saudi Arabia is very low in comparison to other countries as shown in Fig. 5 graph. In the other study, we have observed that if the patient’s age group is  75+, then the fatality rate is higher than in the other age group’s fatality rate. The first death in Saudi Arabia from COVID-19 was on 24 March [7]. The countries with a higher fatality rate are Spain (15%), Mexico (10.9%), and the UK (7.9%). And on the other side, the lowest can be seen in Saudi Arabia (1.1%), Russia (1.7%), and South Africa (1.8%).
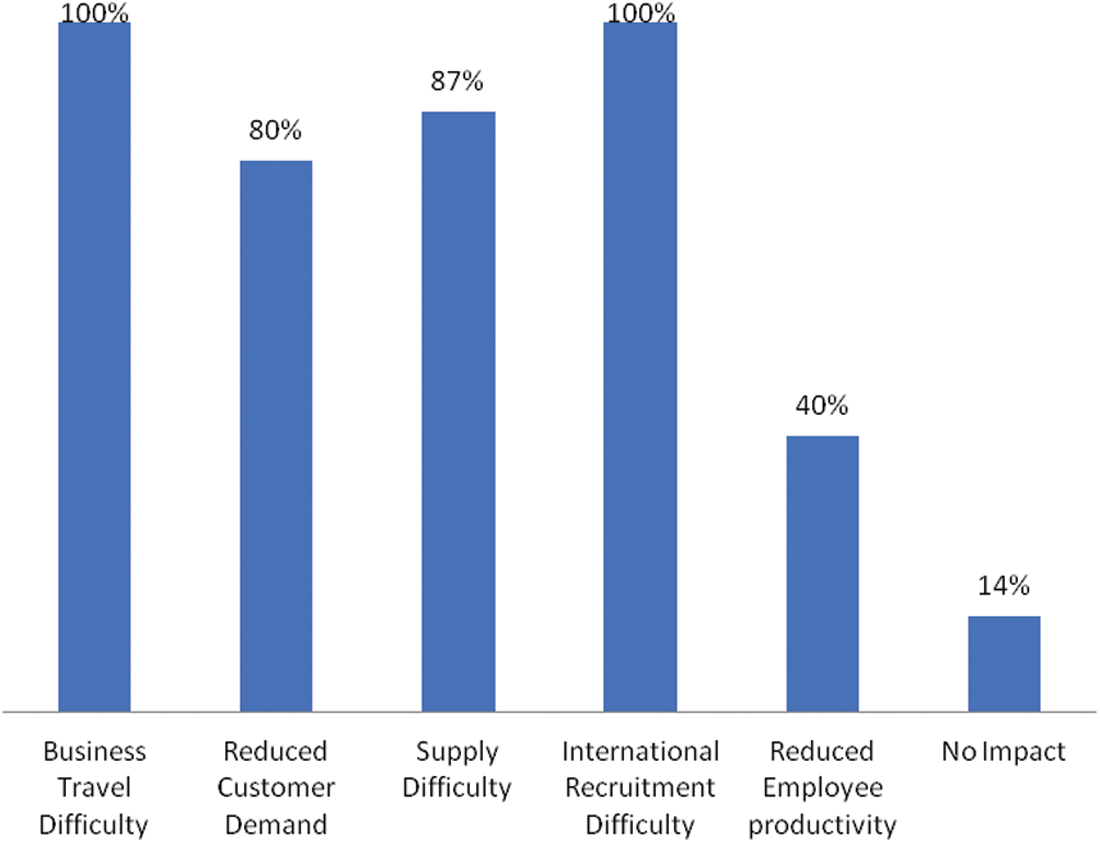
Figure 5: Impact of COVID 19 on GCC
We observed that the highest fatality rate (11.79%) was amongst the elderly people. The lowest fatality rate of 0.7% was recorded amongst the adults, whereas the fatality rate in the children category was 5.36%. The total number of infected patients till 31st July 2020 in Saudi Arabia was 275,905. In terms of gender ratio, there were 75% male patients and 25% female patients. A total of 2,473 and 657 fatalities were recorded in the case of male and female patients, respectively.
3.3 Confirmed Cases and Recovered Cases and Deaths City-Wise in Saudi Arabia’s Cities
Tab. 6 is a city-wise representation of the count of people infected by Coronavirus in Saudi Arabia along with the number of recovered cases and their percentage. We have included all the cities of Saudi Arabia which were severely affected by COVID-19.
Table 6: City-wise confirmed cases and recovered cases
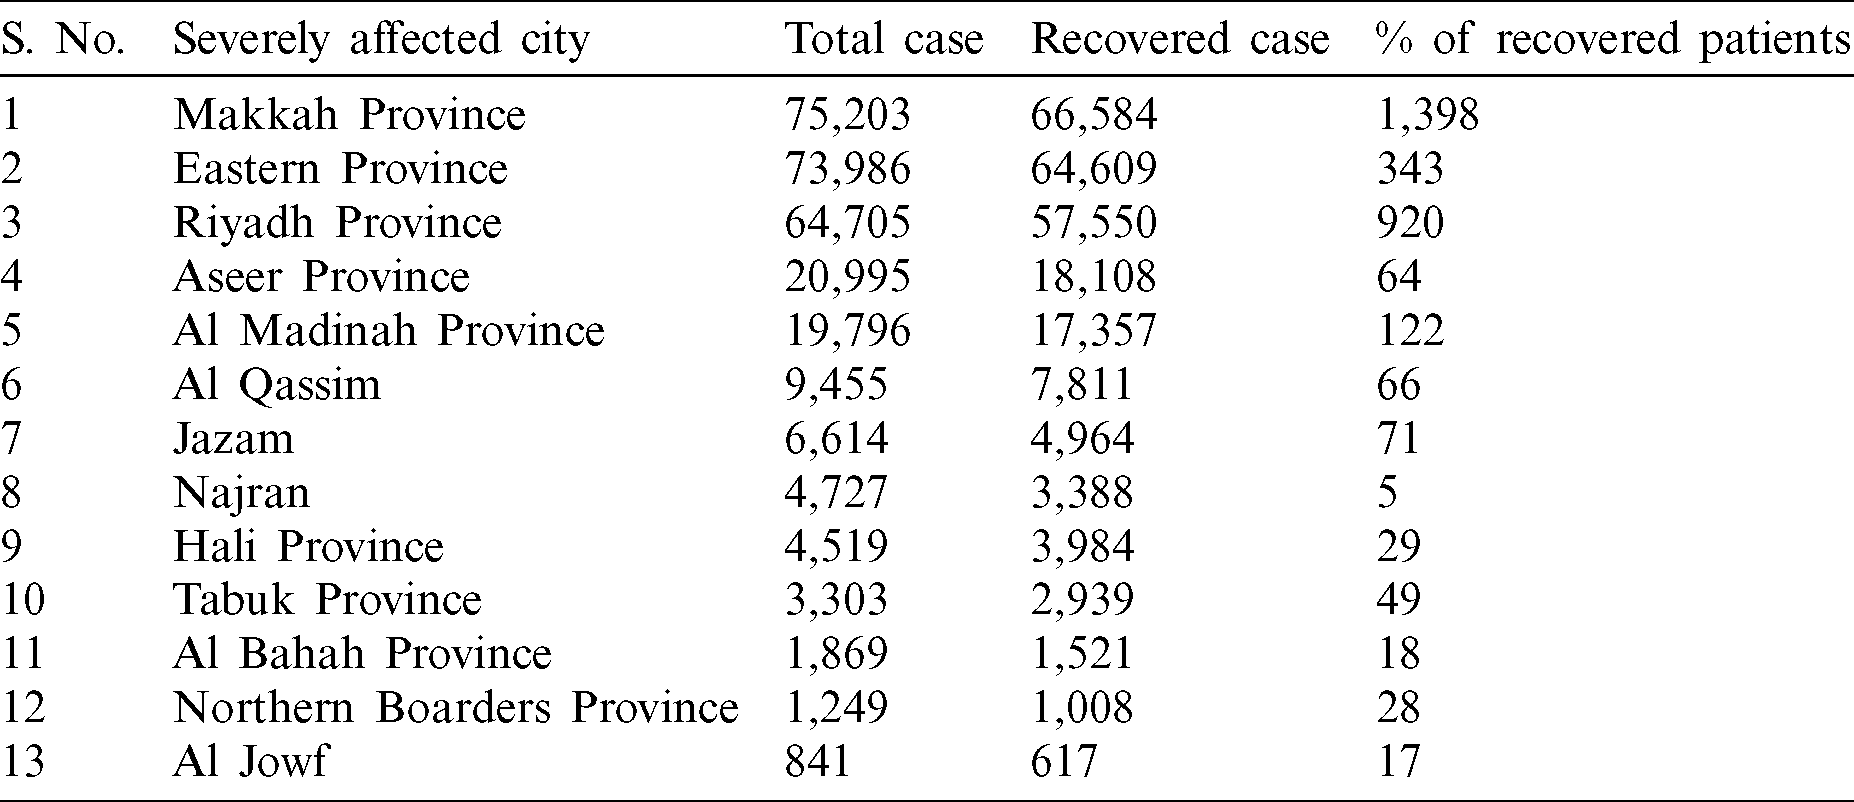
Tab. 6 details the total cases and percentage of recovered cases from 2nd March to 31st July 2020. All data was drawn from the official site of the government-covid19.moh.gov.sa. As per Tab. 6, the evident facts are:
• Makkah Province is the worst affected region with 75,203 COVID-19 cases; 66,584 total recovered cases; and 1,398 deaths.
• The second-largest affected region in Eastern Province with 73,986 cases; 66,604 recovery cases and 343 deaths.
• Riyadh Province is the third-largest affected city in Saudi with 64,705 cases; 57,550 recovery cases; and 920 deaths.
• Aseer Province is the fourth most affected city with 20,995 cases; 18,108 recovered cases, and 64 deaths.
• The rest of the cities have just half the number of patients in comparison to the count of Coronavirus patients in the top three regions.
After the overall study of the recovery rate, we observed that the recovery rate of patients is low in Makkah Province. This is a serious concern for the government. On the other hand, Aseer Province and Jafran framed a more positive study with the highest recovery rate. Most of the Saudi Arabian cities’ recovery rate was more than 75%. Though the overall analysis is optimistic, the government needs to intensify the Coronavirus countermeasures in those cities which are more vulnerable and show a relatively less recovery rate of the patients.
COVID-19 has derailed the world’s economy. With countries under lockdown, all economic and business activities have been suspended. Travelling has seen a complete ban ever since the WHO declared COVID-19 outbreak a pandemic. With the countries at a virtual standstill and declining demand for oil, the price of oil fell to all-time low in the history of the world. 87% of Saudi Arabia’s economy depends on oil and the remaining 13% is shared by tourism and other sectors. Hit by the COVID-19 debacle, the country’s income spiraled down by 22% in the first quarter of the year.
At the same time, the Central Bank of Saudi Arabia saw a marked decline in the foreign reserves in the first quarter and reached the lowest since 2011 [11]. The Saudi government announced cost-cutting from the living allowance of 1000 Riyal/month from 1 June 2020 and the VAT was also increased to 15% from 5% on all goods from 1 July 2020 [12]. The Saudi government also intends to reduce 100 billion Riyals from its investments. The country’s finance minister has already asserted that maintaining economic stability was the country’s top priority and that the government was committed to defeating the uncommon Coronavirus emergency with the least possible harm to the economic wellbeing of the citizens. Due to the slowdown of the economy in the wake of COVID-19, there was a 13% increase in the rate of unemployment in Saudi Arabia.
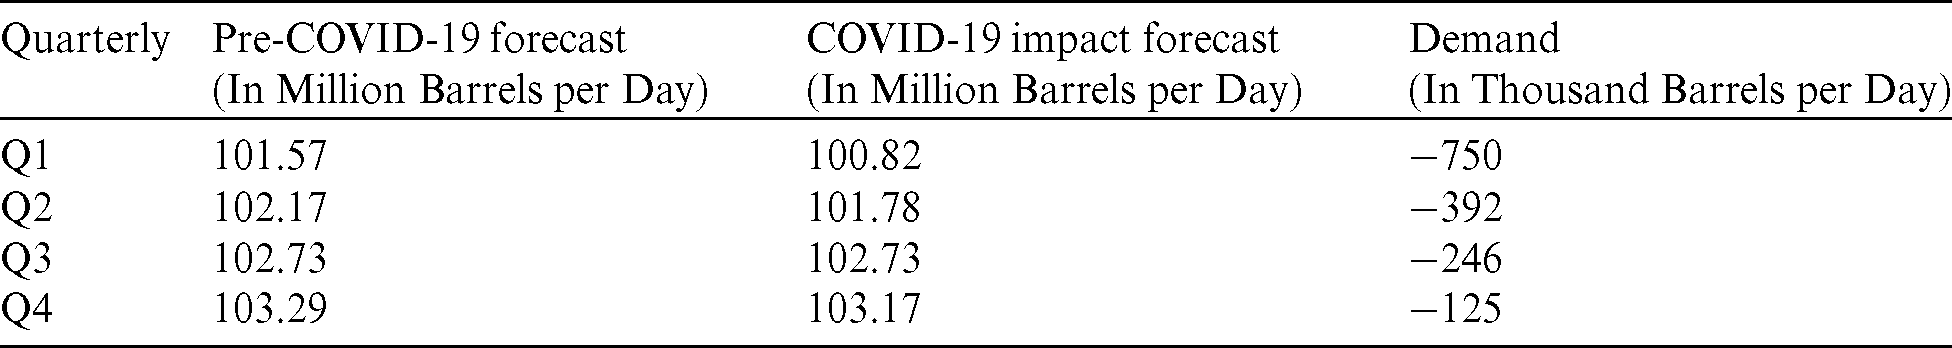
On March 2020, the World Health Organization officially announced the COVID-2019 as a pandemic. Its impact on different economic sectors is yet to be fully understood, but forecasts suggest a dire scenario. Tab. 7 shows the projections for 2020. According to the statistics, one can see a decline in the demand for oil by 8.1 million barrels per day, in comparison of 2019. The decline in the consumption of oil will fall even more sharply in the 2nd quarter. This would bring the quarterly total to 100.82 million barrels per day instead of 101.57 million as previously forecasted. The first quarter is set to be hit the hardest, whereas revisions for the fourth quarter suggest a decline of 125,000 barrels per day [12]. The forecast projects that oil consumption to 7.0 million barrels per day will increase only in 2021. Unsold oil stored in the barrel would weaken the economy of the kingdom. Aramco and Saudi Arabia are also suffering from revenue drops. Saudi Arabia’s government deposited 2.18 billion riyals into the poorest Saudi citizens’ accounts and helped more than 12 million citizens. The government is already paying average monthly support of approx $240 per family. Moreover, the Saudi government also announced that all private-sector employees will be given only 40% of their salary.
Table 7: Quarterly impact on oil price
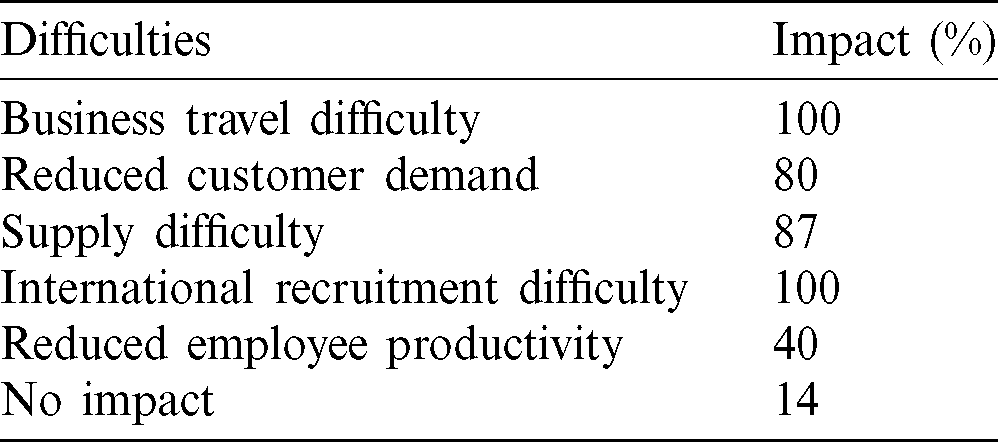
Tab. 8 and Fig. 5 show the impact of the Coronavirus on the GCC. Travel and recruitment are the worst affected sectors and the adverse effect is 100%. Customer demand and supply difficulty reached 80% and most of the industries retrenched 40% of their employees.
Table 8: Impact on the business
4.2 Impact of Hand Wash/Sanitizer on Environment and Health
Hygiene is one of the most important factors in preventing COVID-19. However, frequent hand-washing can create an environmental crisis. The increase in the use of water consumption will not only reduce the water level but also affect the ecosystem badly because the freshwater resource is also reducing day-by-day. Sanitizers are effective against Coronavirus. However, excess use of sanitizer can be the cause of cancers as cited by many studies. Thus, following these preventive steps might create other health hazards for us.
4.3 Impact of Mask on the Health
The impact of the mask on human health is both good and bad. While masks protect people from the virus, masks can also reduce the oxygen level, thereby increasing the Carbon dioxide (Co2) in our body. Increase in the level of Co2 can weaken the immunity.
5 COVID-19 Factors and Sub-Factors (Criteria and Sub-Criteria)
Fig. 6 illustrates the 5 techniques used in combating COVID-19 at level 2 as a sub-factors; level 1 illustrates the factors selected by the authors that affect COVID-19. The techniques used for combating COVID-19 have been discussed below with reference. This hierarchy is constructed with the help of experts’ opinions and suggestions. Factors affecting the COVID-19 are discussed in detail. Authors have selected the criteria and sub-criteria to determine the most effective technique in this context.
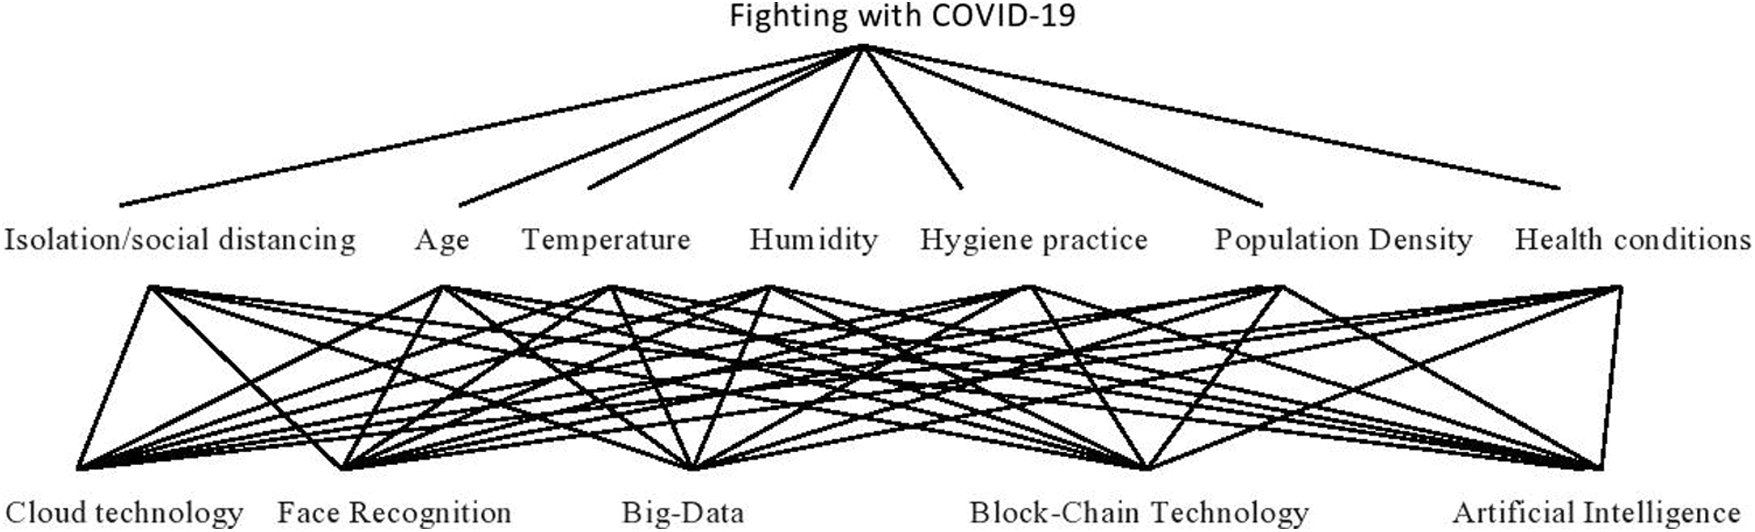
Figure 6: Various factors and sub-factors depicted in levels
All these factors affected by the COVID-19 are discussed below.
As borne out by our analysis, age is a big factor in COVID-19. Fatality rates are higher amongst the elderly than in the other age groups. The reason for this is attributed to the weak immune system of the aged which renders them susceptible to any kind of infection. In the data provided by the New York City Health, the fatality rate due to Novel Coronavirus among those aged 75 and above was as high as 48%.
5.1.2 Isolation and Social Distancing
It is not clear if isolation is effective in the starting period of infection or when the patient becomes infected. This in itself is a subject of further research. But isolation is useful for breaking the transmission of the COVID-19 from person to person. If the infected persons are isolated, it would break the chain of transmission. Hellewell et al. [13] qualitatively examined that isolation of COVID-19 patients can indeed break the transmission. Isolation was firstly implemented in Wuhan, China, and after two months of quarantine only, the city could control the spread of COVID-19. Isolation can break the transmission chain and make a barrier between the infected and non-infected people.
Low temperature also contributes to the spread of COVID-19. When temperature increases, then the droplets of coughs, sneezes, will vaporize and reduce the chances of infection. At the time of winter, immunity of the body is less due to low levels of vitamin D. So most of the flues spread easily in winter and stay for a long time.
The main source of transmission of COVID-19 is droplets of infected patients. The concentration of water vapor in the air is called Humidity. High temperature and high humidity > 80% has a negative effect on COVID-19. The virus can survive at surface up to 5 days at 22–25 C and 40–50% humidity in the atmosphere. High temperature > 38
 C and humidity > 80% is good for reducing the survival of the virus.
Population density has been reported to be the key reason for the rapid spread of the pandemic. In high density, the spread can be stopped by measures like hygiene awareness, social distancing and ban on travel.
Pre-existing conditions of patient’s health like suffering from any other serious disease (Diabetes, Cancer, Hypertension, Cardiac ailments, etc.) are known to increase the fatality rate. Cardiac patients can be at a higher risk and the mortality rate of such patients due to the contagion has been reported to be 13.2%.
All these factors are the reasons for the spread of the COVID-19 pandemic. While some reasons are beyond human control, more disciplined participation in preventive steps like social distancing and wearing masks can be effective safeguards against the virus. All the factors and sub-factors shows in Fig. 6.
Various combat tools and techniques have been used by the researchers in their studies. We have categorized these in the hierarchy in Fig. 6. These techniques are enumerated below.
Cloud technology is used for securing the patient’s information. Cloud technology provides easy development, processing and securing tools for the organization. Cloud technology services are being used by Amazon Web Services (AWS) for the diagnosis of COVID-19 [14].
Face recognition technology is used for fighting and identifying the infected patients easily. Face recognition system is a highly accurate mechanism in identifying the patients and monitor if they are wearing masks or not. This technology helps the government to identify and monitor the quarantined people and also recognize the infected people [7].
COVID-19 has not only affected a single country; almost all the countries of the world are battling with Coronavirus contagion today. Hence, countries are generating a huge amount of patients’ data nearly everyday. This includes: Number of infected people, Number of recovered people, Number of deaths, etc., on a daily basis. This information can be managed and analyzed by using big data analytic tools [7].
AI is an essential element in healthcare for security and accurate diagnosis. Nowadays, AI technology is being used in medication, development of drugs and forecasting of the pandemic. AI is also used in differentiating the common flu patients from the COVID-19 patients [7,14].
Block-Chain is used to maintain COVID-19 patient’s information securely and for efficient surveillance. Block-Chain helps in the initial stages of the treatment through early detection of the symptoms of Coronavirus. The technique also allows the secure processing of the data [15].
The methodology used for the present analysis is Fuzzy Analytic Hierarchy Process (F.AHP) integrated with Technical for Order of Preference by Similarity to Ideal Solution (TOPSIS). Both the techniques are MCDM based method. Fuzzy.AHP.TOPIS technique provides accurate and validated results of the techniques [16].
In this study, the authors have used the Multi-criteria decision making (MCMD) techniques for quantitative assessment of the factors and techniques being used in detecting and curing Corona cases. Fuzzy AHP is used for evaluating the weights of each factor because it is one of the most effective MCMD processes. Besides this, TOPSIS is used for assigning the rank of each factor because TOPSIS is the best ranking method. Fuzzy- analytic hierarchy process (F.AHP) has been used for designing the hierarchy of the model [17]. The model uses a fuzzy comprehensive for assigning the weights of each criterion. The factors that are more essential in containing COVID-19 have already been discussed in the above section.
For prioritization of these tools based on their effective levels and to gauge the efficiency of each one in combating Coronavirus spread, we have used the integrated F.AHP-TOPSIS method. This integrated method assigned the ranks to the factors and sub-factors. Hierarchy of the factors and techniques helped in analyzing the ranking of the techniques as shown in Fig. 6.
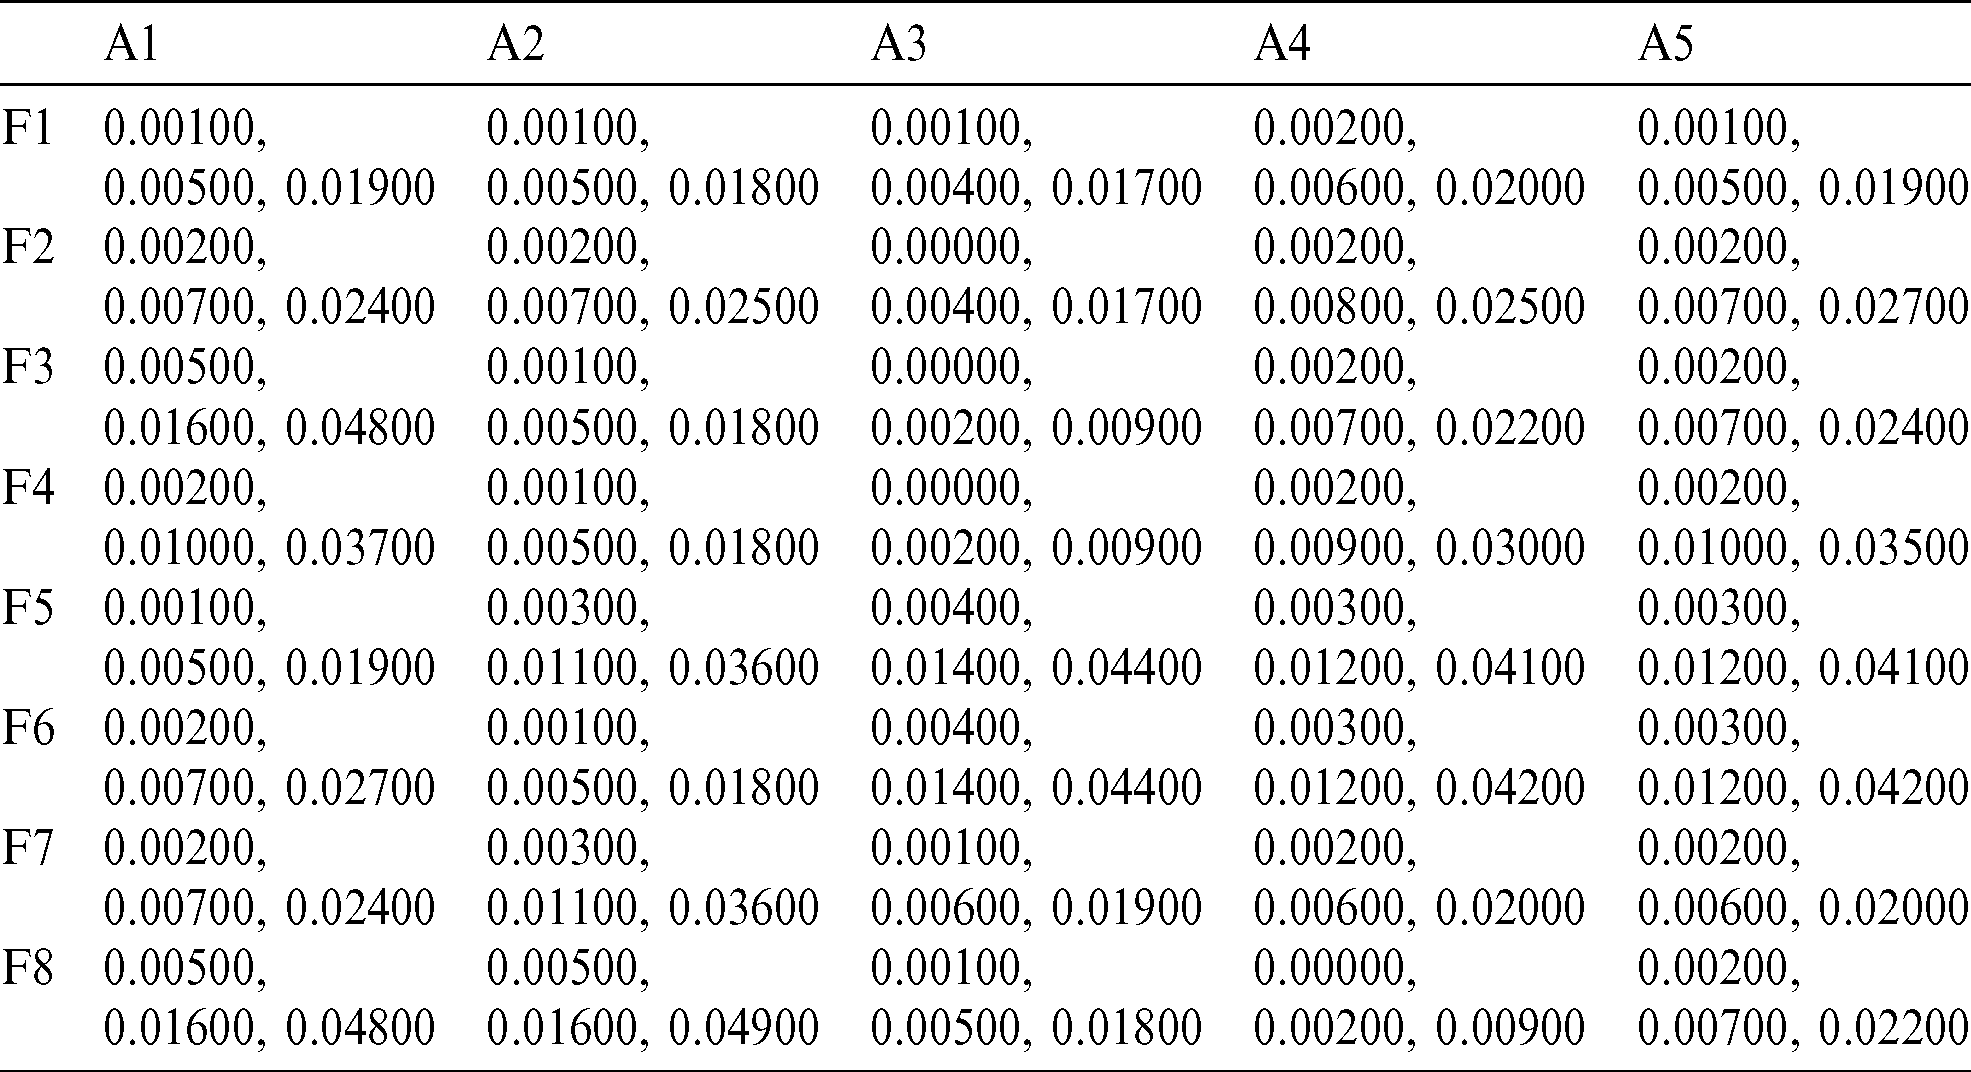
F.AHP.TOPSIS approach has already been used by the authors in their previous research work [16]. By using the methodology entailed in the work [17], we constructed the pair-wise comparison matrix and de-fuziffied comparison matrix and weight, as shown in Tabs. 9 and 10 for level 1. Hierarchy level one contains the factors of the COVOD-19, as shown in Fig. 6. For calculating the weights, we used [17]. The Alpha cut ( -cut) has been used for evaluating the defuzzification, as in Tab. 10. With the help of Tab. 10 and [18], we constructed the subject to cognition matrix, as shown in Tab. 11 for level 2. A normalized fuzzy decision matrix was constructed after normalizing the cognition matrix and calculating the normalized fuzzy weights of the decision matrix for level 2 with the help of [18,19] (as shown in Tabs. 12 and 13).
Table 9: Pair-wise comparison matrix
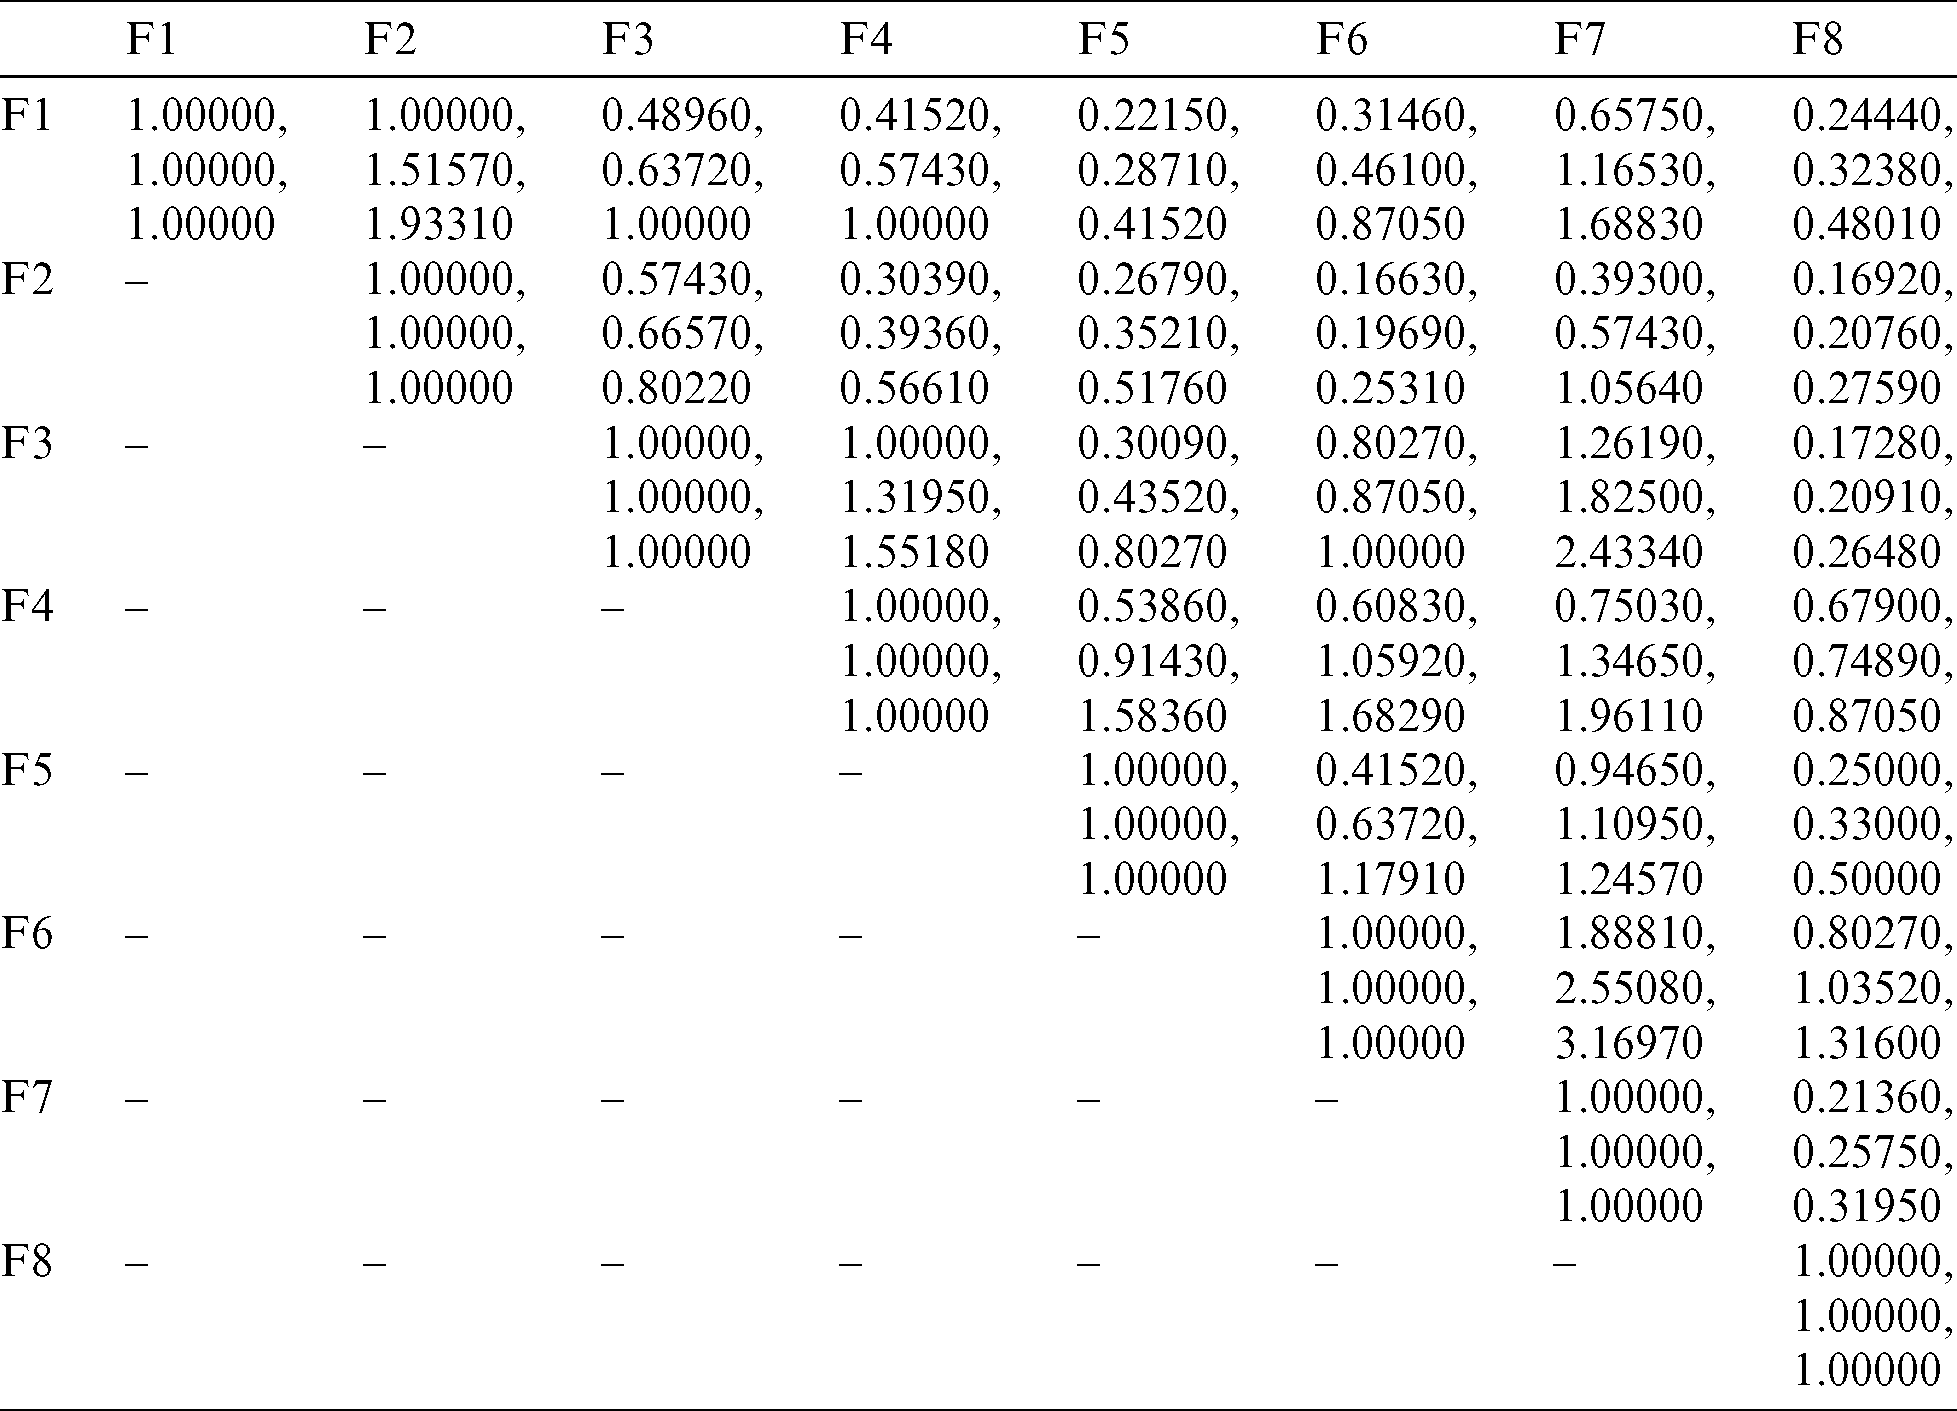
Table 10: Defuzzified pair-wise comparison matrix and weights of the matrix
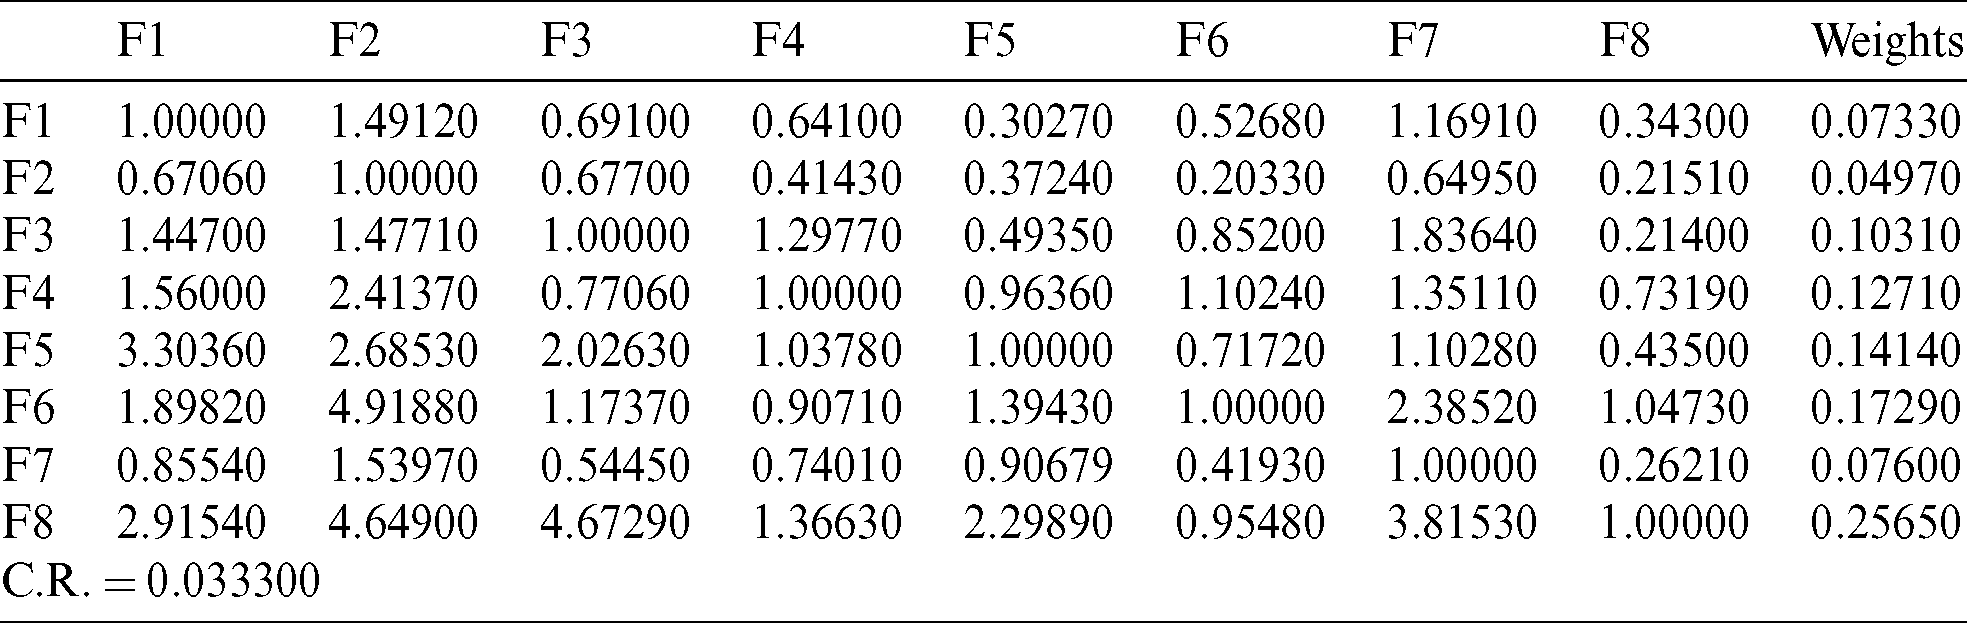
Table 11: Subject cognition matrix
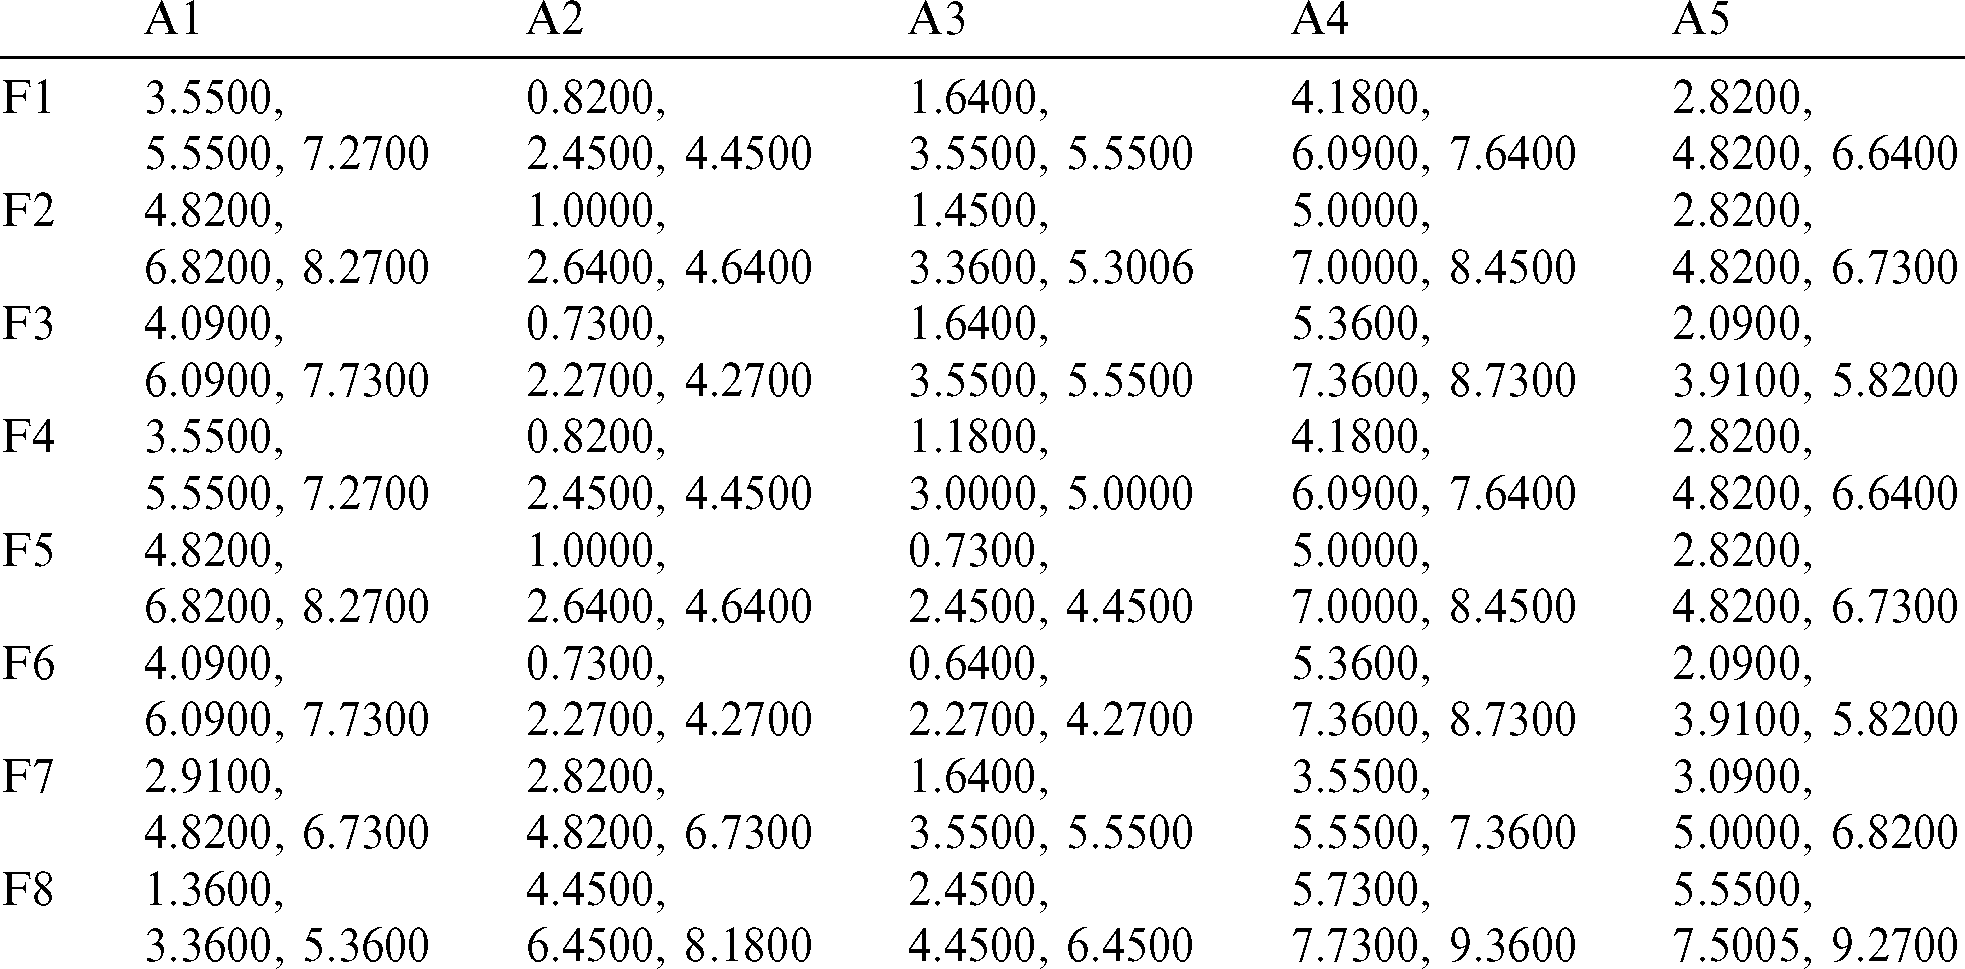
Table 12: Normalized fuzzy decision matrix
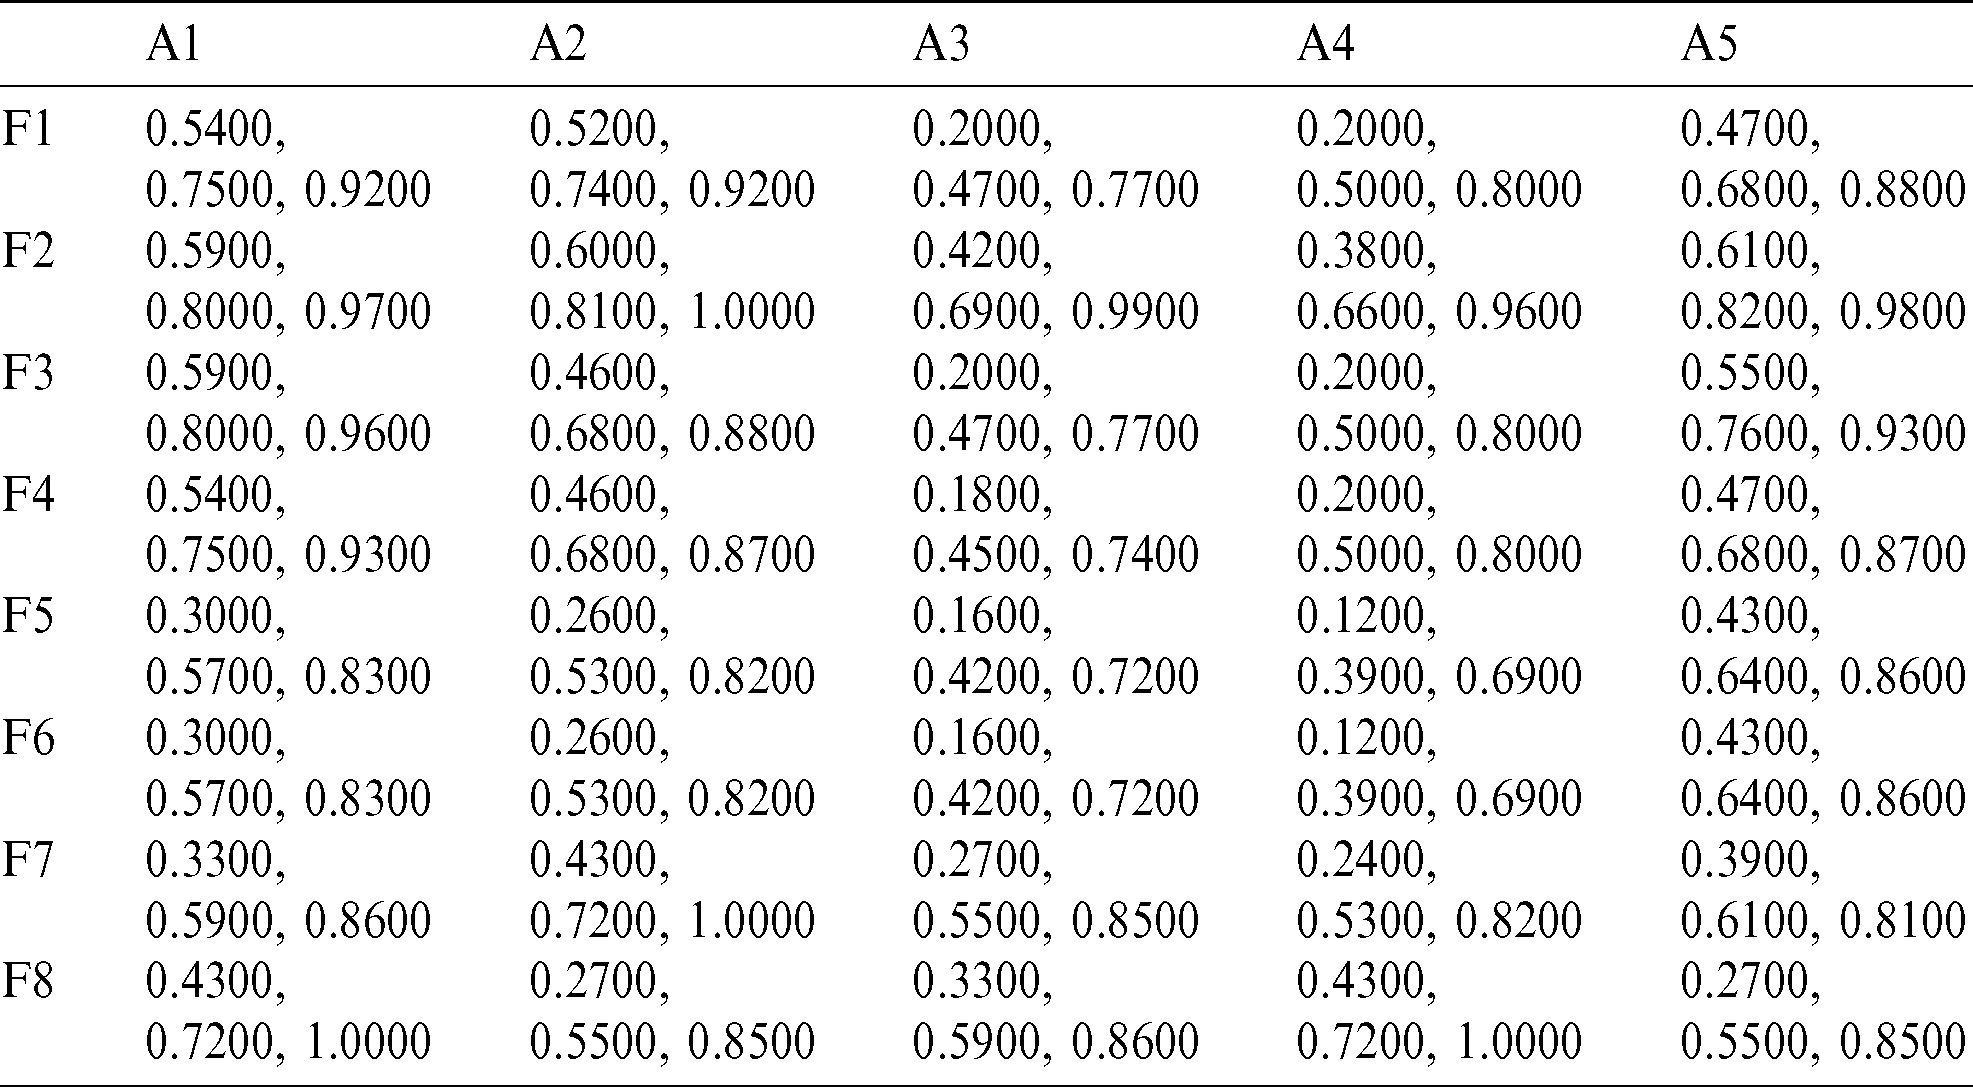
Table 13: Normalized fuzzy weighted decision matrix
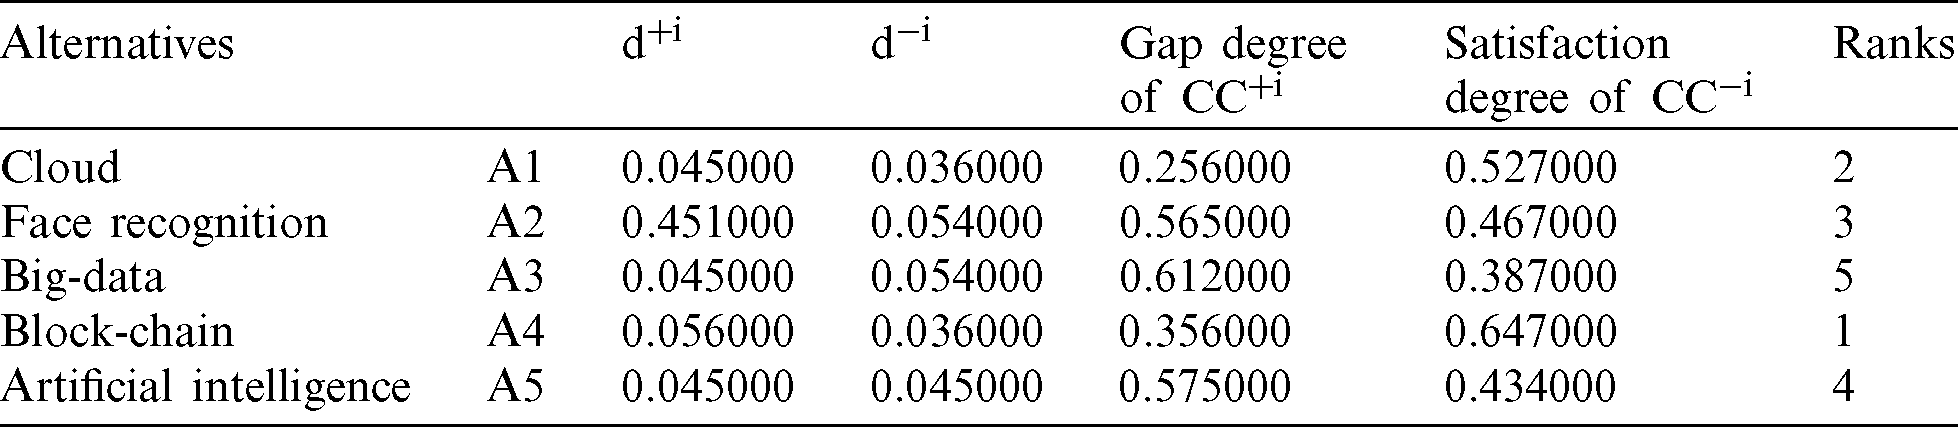
Tab. 14 represents the satisfaction degree and ranks of the sub-factors for level 2. For obtaining the results, the authors used [19] process for calculating the closeness coefficient. The ranks drawn after these calculations to determine the most prioritized combative tool against COVID-19 has also been shown in Tab. 14. As per the calculations, the blockchain technique obtained the highest priority (0.647) in comparison to other techniques. This finding will help the researchers to focus on the computer vision techniques for containing the spread of COVID-19 pandemic. This is evaluated by the F.AHP.TOPSIS ranking methods. This mathematical prioritization provides an accurate and conclusive classification of the techniques according to their priority levels as obtained in the evaluations.
Table 14: Closeness coefficient and ranking of the techniques
The primary finding of this portrayal and exploratory investigation of the initial 2,75,905 instances of COVID-19 found in Saudi Arabia in the 5 months from the main acknowledgment of the episode of pneumonia with obscure etiology on 2 March 2020 till July 31, 2020, is that the novel Coronavirus (COVID-19) is highly infectious.
In this study, we have calculated the growth rate of 13 severely affected countries including Saudi Arabia. We also calculated the fatality rate of countries and observed that with the total number of 3130 deaths, the fatality rate in Saudi Arabia is very low (1.1%) in comparison to other countries. The first context described the confirmed cases and calculated the growth rate from starting to 31 July. The second scenario calculated the growth rate of Coronavirus from 1–31st July. The number of confirmed cases recovered cases and fatality (Region-wise) were calculated by Eq. (1). As per our analysis, with reference to the graph in Fig. 3, the spread of COVID-19 was average till the 30th April. In May and June, the graph towers are increasing day-by-day. After the 30th of June, the graph tower again comes under control. On some days, the number of recovered cases was greater than the infected cases because of the high changes and recombination rates. We selected the factors that are influencing the spread of the COVID-19 pandemic as well as the computer science techniques that are currently in use to contain the spread of the pandemic. After formulating a list of criteria, we designed a three-level hierarchy based on the factors and computer science combat techniques. Level 0 shows the goal of the model, and level 2 shows the criteria of the model. In the criteria, the authors applied the Fuzzy-AHP-TOPSIS prioritization technique and found that the block-chain technique attains the top priority. This study gives significant knowledge into a few pivotal open inquiries on this pestilence and how to plan procedures so as to control the virus spread viably.
This study analyzed 275,905 confirmed cases of the pandemic in Saudi Arabia till 31 July 2020. The growth rate of the confirmed cases, fatality rate and the recovery rate were also formulated. Furthermore, the study also details the impact of Coronavirus on the economy, environment & health. This analysis underlines the efforts that need to be intensified for controlling the rapid spread of the COVID-19. We have executed the forecasting model on the confirmed cases and predicted the cases for the next two months. The projections point out that the count of the cases could decline from 30,000 to 20,000 by the end of August and September. Similarly, after the model was executed on the number of death cases, the prediction was that the death toll could reach up to 5000 by September end. The authors specifically selected the criteria and the goal based on the factors that affect the COVID-19 and techniques in use. Based on the choice of the criteria, a three-level hierarchy model was designed. The model was instrumental in prioritization of the techniques. F.AHP.TOPSIS methodology was used to accord ranks to techniques. After calculation, the ranking order for the different techniques/ tools to contain COVID-19 was: A4 > A1 > A2 > A5 > A3. This means that the block-chain technique obtained the 1st rank or the highest priority, and big data technique obtained the lowest priority. In addition to this, another novel premise in the present study has been to underline the side effects of the few preventive means suggested to contain the spread of the pandemic. For instance, the use of hand wash/sanitizer and masks are also detrimental to human health and pose a threat to the environment as well. Our study seeks to be an accurate reference point for the strategists working on countermeasures to contain the impact of COVID-19. However, one limitation that can be cited in this regard is that the study’s analysis is solely guided by the data availed for the time frame specified in the study.
Funding Statement: The authors received no specific funding for this study.
Conflicts of Interest: The authors declare that they have no conflicts of interest to report regarding the present study.
1. Wuhan Municipal Health Commission. (2020). Report of clustering pneumonia of unknown aetiology in Wuhan City. Wuhan, China: Wuhan Municipal Health Commission. http://wjw.wuhan.gov.cn/front/web/showDetail/2019123108989. [Google Scholar]
2. World Health Organization. (2020). Novel coronavirus-China. Geneva, Switzerland: World Health Organization. https://www.who.int/csr/don/12-January-2020-novalcoronavirus-china/en/. [Google Scholar]
3. Chan, J., Kok, K., Zhu, Z., Chu, H., To, K. et al. (2020). Genomic characterization of the 2019 novel human-pathogenic coronavirus isolated from a patient with atypical pneumonia after visiting Wuhan. Emerging Microbes & Infections, 9(1), 221–236. DOI 10.1080/22221751.2020.1719902. [Google Scholar] [CrossRef]
4. Team, N. C. (2020). The epidemiological characteristics of an outbreak of 2019 novel coronavirus diseases (COVID-19) in China. ZhongHua Liu Xing Bing Xue Za Zhi = ZhongHua Liuxingbingxue Zazhi, 41(2), 145–151. [Google Scholar]
5. RIYADH, March 2 (Xinhua). (2020). Saudi Arabia registered on Monday the first novel coronavirus case, the Saudi Press Agency reported. Xinhuant.com/English/2020-03/03/c_138836749.htm. [Google Scholar]
6. Aljazeera. (2020). Coronavirus Pandemic, Saudi Arabia reports first coronavirus death. https://www.aljazeera.com/news/2020/3/24/saudi-arabia-reports-first-coronavirus-death. [Google Scholar]
7. Manjunath, B. S. (2020). COVID-19: 8 ways in which technology helps pandemic management. The Economic Times-India. https://cio.economictimes.indiatimes.com/news/next-gen-technologies/covid-19-8-ways-in-which-technology-helps-pandemic-management/75139759. [Google Scholar]
8. COVID 19 Dashboard: Saudi Arabia. (2020). Ministry of Health, Kingdom of Saudi Arabia. Covid19.mod.gov.sa. [Google Scholar]
9. WorldOMeter. (2020). Reported Cases and Deaths by Country, Territory, or Conveyance. https://www.worldometers.info/coronavirus/#countries. [Google Scholar]
10. International Policy Digest. (2020). How COVID-19 Will Impact Saudi Arabia’s Patronage-Based Economy. https://intpolicydigest.org/2020/04/27/how-covid-19-will-impact-saudi-arabia-s-patronage-based-economy/. [Google Scholar]
11. BBC News Services. (2020). Saudi Arabia Triples VAT to Support Coronavirus–-Hit Economy. https://www.bbc.com/news/business-52612785. [Google Scholar]
12. Statista. (2020). Global Oil Demand Outbreak. https://www.statista.com/statistics/332291/global-oil-demand-outlook-following-covid-19/. [Google Scholar]
13. Hellewell, J., Abbott, S., Gimma, A., Bosse, N., Jarvis, C. I. et al. (2020). Feasibility of controlling COVID-19 outbreaks by isolation of cases and contacts. Lancet Global Health, 8(4), 488–496. DOI 10.1016/S2214-109X(20)30074-7. [Google Scholar] [CrossRef]
14. Johansson, A. (2020). Five ways tech is being used to fight COVID-19. IEEE Computer Society. https://www.computer.org/publications/tech-news/five-ways-tech-is-being-used-to-fight-covid-19. [Google Scholar]
15. Nguyen, D. C., Dinh, M., Pathirana, P. N. (2020). A Blockchain and AI-based solutions to combat coronavirus (COVID-19)–-Like epidemics: A survey. Preprints, 2020, 1–15. [Google Scholar]
16. Algarni, A., Ahmad, M., Attaallah, A., Agrawal, A., Kumar, R. et al. (2020). A fuzzy multi-objective covering-based security quantification model for mitigating risk of web based medical image processing system. International Journal of Advanced Computer Science and Applications, 11(1), 481–489. DOI 10.14569/IJACSA.2020.0110159. [Google Scholar] [CrossRef]
17. Agrawal, A., Zarour, M., Alenezi, M., Kumar, R., Khan, R. (2020). Security durability assessment through fuzzy analytic hierarchy process. PeerJ Computer Science, 5(2019), 1–44. [Google Scholar]
18. Agrawal, A., Mohemmed, A., Kumar, R., Khan, R. (2019). Measuring the sustainable-security of web applications through a fuzzy-based integrated approach of AHP and TOPSIS. IEEE Access, 7, 153936–153951. DOI 10.1109/ACCESS.2019.2946776. [Google Scholar] [CrossRef]
19. Algarni, A., Ahmad, M., Attaallah, A., Agrawal, A., Kumar, R. et al. (2020). A hybrid fuzzy rule-based multi-criteria framework for security assessment of medical device software. International Journal of Intelligent Engineering and Systems, 13(2020), 51–62. DOI 10.22266/ijies2020.1031.06. [Google Scholar] [CrossRef]
 | This work is licensed under a Creative Commons Attribution 4.0 International License, which permits unrestricted use, distribution, and reproduction in any medium, provided the original work is properly cited. |