| Computer Modeling in Engineering & Sciences |
DOI: 10.32604/cmes.2021.012895
ARTICLE
Application of FCM Algorithm Combined with Artificial Neural Network in TBM Operation Data
1School of Computer Science and Technology, Dalian University of Technology, Dalian, 116024, China
2School of Mechanical Engineering, Dalian University of Technology, Dalian, 116024, China
*Corresponding Author: Maolin Shi. Email: shl5985336@126.com
Received: 16 July 2020; Accepted: 11 September 2020
Abstract: Fuzzy clustering theory is widely used in data mining of full-face tunnel boring machine. However, the traditional fuzzy clustering algorithm based on objective function is difficult to effectively cluster functional data. We propose a new Fuzzy clustering algorithm, namely FCM–ANN algorithm. The algorithm replaces the clustering prototype of the FCM algorithm with the predicted value of the artificial neural network. This makes the algorithm not only satisfy the clustering based on the traditional similarity criterion, but also can effectively cluster the functional data. In this paper, we first use the t-test as an evaluation index and apply the FCM–ANN algorithm to the synthetic datasets for validity testing. Then the algorithm is applied to TBM operation data and combined with the cross-validation method to predict the tunneling speed. The predicted results are evaluated by RMSE and R2. According to the experimental results on the synthetic datasets, we obtain the relationship among the membership threshold, the number of samples, the number of attributes and the noise. Accordingly, the datasets can be effectively adjusted. Applying the FCM–ANN algorithm to the TBM operation data can accurately predict the tunneling speed. The FCM–ANN algorithm has improved the traditional fuzzy clustering algorithm, which can be used not only for the prediction of tunneling speed of TBM but also for clustering or prediction of other functional data.
Keywords: Data clustering; FCM; artificial neural network; functional data; TBM
Cluster analysis belongs to unsupervised pattern recognition and is a multivariate statistical analysis method. It divides an initial sample set into several subsets according to a certain criterion, so as to achieve clustering of sample sets and analyze clustering results. Because in the actual engineering application, the research objects without clear classification boundaries occupy the main position, the fuzzy clustering is mainly used to cluster such objects, that is, the objects can belong to two or more categories at the same time [1,2]. In practical applications, the more general method is the fuzzy clustering method based on the objective function. This method transforms the cluster into a nonlinear programming problem with constraints, and then obtains the fuzzy partitioning and the clustering of the datasets through optimization. In the clustering algorithm based on objective function, Fuzzy c-Means (FCM) algorithm has the most complete theory and the most widely used. The algorithm was originally proposed and developed by Bezdek and Hathaway [3–5]. It introduces the concept of membership degree based on the hard c-means (HCM) algorithm and implements fuzzy clustering by means of alternating optimization.
There have been many researches on FCM algorithms. Yu et al. [6] proposed the generalized fuzzy clustering regularization (GFCR) model based on various fuzzy clustering algorithms such as FCM algorithm, and verified the validity of the model. Zhang et al. [7] applied an improved weighted fuzzy c-means (WFCM) model and introduced an interval number, making it easier to obtain appropriate weights. Askari et al. [8] proposed a Generalized Entropy based Possibilistic Fuzzy C-Means (GEPFCM) algorithm for noise data clustering, which is more accurate than the Possibilistic Fuzzy C-Means (PFCM) algorithm. Li et al. [9] improved the FCM algorithm for the clustering problem of data with missing attribute values, and realized the clustering of incomplete datasets.
In the research of FCM type clustering algorithm, the research of clustering prototype has always been an important direction. The initial clustering prototype is a “point” in space, which is only suitable for the detection of hypersphere clustering structures. In order to detect the non-hypersphere clustering structure, Bzedek et al. [10] proposed a new clustering prototype, which is a multi-dimensional linear cluster over a certain point. In addition, according to different clustering structures, the researchers also developed a variety of clustering prototypes, such as the spherical shell [11,12] and the ellipsoid shell [13,14] two clustering prototypes. With the deepening of research and the expansion of application requirements, clustering prototypes have been extended to more forms. For example, Suh et al. [15] proposed a fuzzy clustering algorithm based on the polyhedral shell as a clustering prototype. Although these clustering prototypes can detect the detection of one or more clustering structures, they need to use prior knowledge to select prototypes before clustering. This does not enable efficient clustering when encountering functional data with high complexity and inconspicuous clustering structure.
Functional data refers to data obeying a function, and can also be regarded as random observation data of a function in an interval. With the development of data acquisition and storage capabilities, data can be collected in many fields with functional features. Functional data has been applied to many fields such as economics, medicine, meteorology and neuroscience [16–19]. Functional data clustering analysis is a research hotspot in recent years. Researchers have proposed a variety of clustering methods for different objects. From the data itself, Zambom et al. [20] proposed a new method based on functional data clustering combining parallel hypothesis testing and mean testing. Delaigle et al. [21] first project data onto a finite-dimensional space, and then use the K-means algorithm to achieve clustering. Bruckers et al. [22] used data interpolation with multiple imputations for functional data with missing values, and then clustered the imputed datasets.
Although the above method can achieve clustering of some functional data, it lacks universality in application. Because some of these methods require high accuracy of data, they cannot be implemented with high data noise. Others will ignore certain parameter information, resulting in low classification accuracy.
In the recent period, machine learning methods represented by deep learning have been applied to many fields, such as computer vision, natural language processing, and data mining. Since deep learning has good feature learning capabilities, it is also used as an alternative method for engineering problems. Samaniego et al. [23] combined DNN in the configuration method and the deep energy method to provide a novel idea for solving partial differential equations. Guo et al. [24] applied a deep learning method to the thin plate bending problem, which is suitable for the bending analysis of Kirchhoff plates with various geometric shapes. Vien et al. [25] proposed a deep energy method for processing nonlinear large deformation hyperelasticity based on DNN, which can quickly and efficiently obtain numerical solutions. Anitescu et al. [26] proposed an adaptive configuration strategy using artificial neural networks to solve partial differential equations, and obtained the desired results in solving boundary value problems.
In the field of fuzzy clustering, there are also many studies that combine neural network methods. ANN simulates a biological neural network and builds a training model from multiple nodes to achieve regression and approximation of complex functions. Xu et al. [27] proposed a WLAN hybrid indoor positioning method based on FCM and ANN, which reduces the positioning error while ensuring efficiency. Karlik et al. [28] proposed a new fuzzy clustering neural network (FCNN) algorithm as a pattern classifier for real-time odor recognition systems. The FCNN algorithm uses FCM clustering to reduce the number of data points before inputting to the neural network system, thereby shortening the training cycle of the neural network. In addition, Mohd-Safar et al. [29] and Moradi et al. [30] also combined FCM and ANN, proposed different models, and applied them to engineering problems. However, in these methods, FCM and ANN are independent of each other, which will not only increase the computational burden but also fail to achieve effective clustering on complex problems such as the clustering of functional data. In addition, in these studies, FCM is used more as a data preprocessing method and serves ANN. The algorithm we proposed takes FCM as the overall framework and ANN as a way to describe the functional relationship. The structure achieves the integration of the two, and at the same time carries out end-to-end training, which can realize the effective clustering of complex functional data.
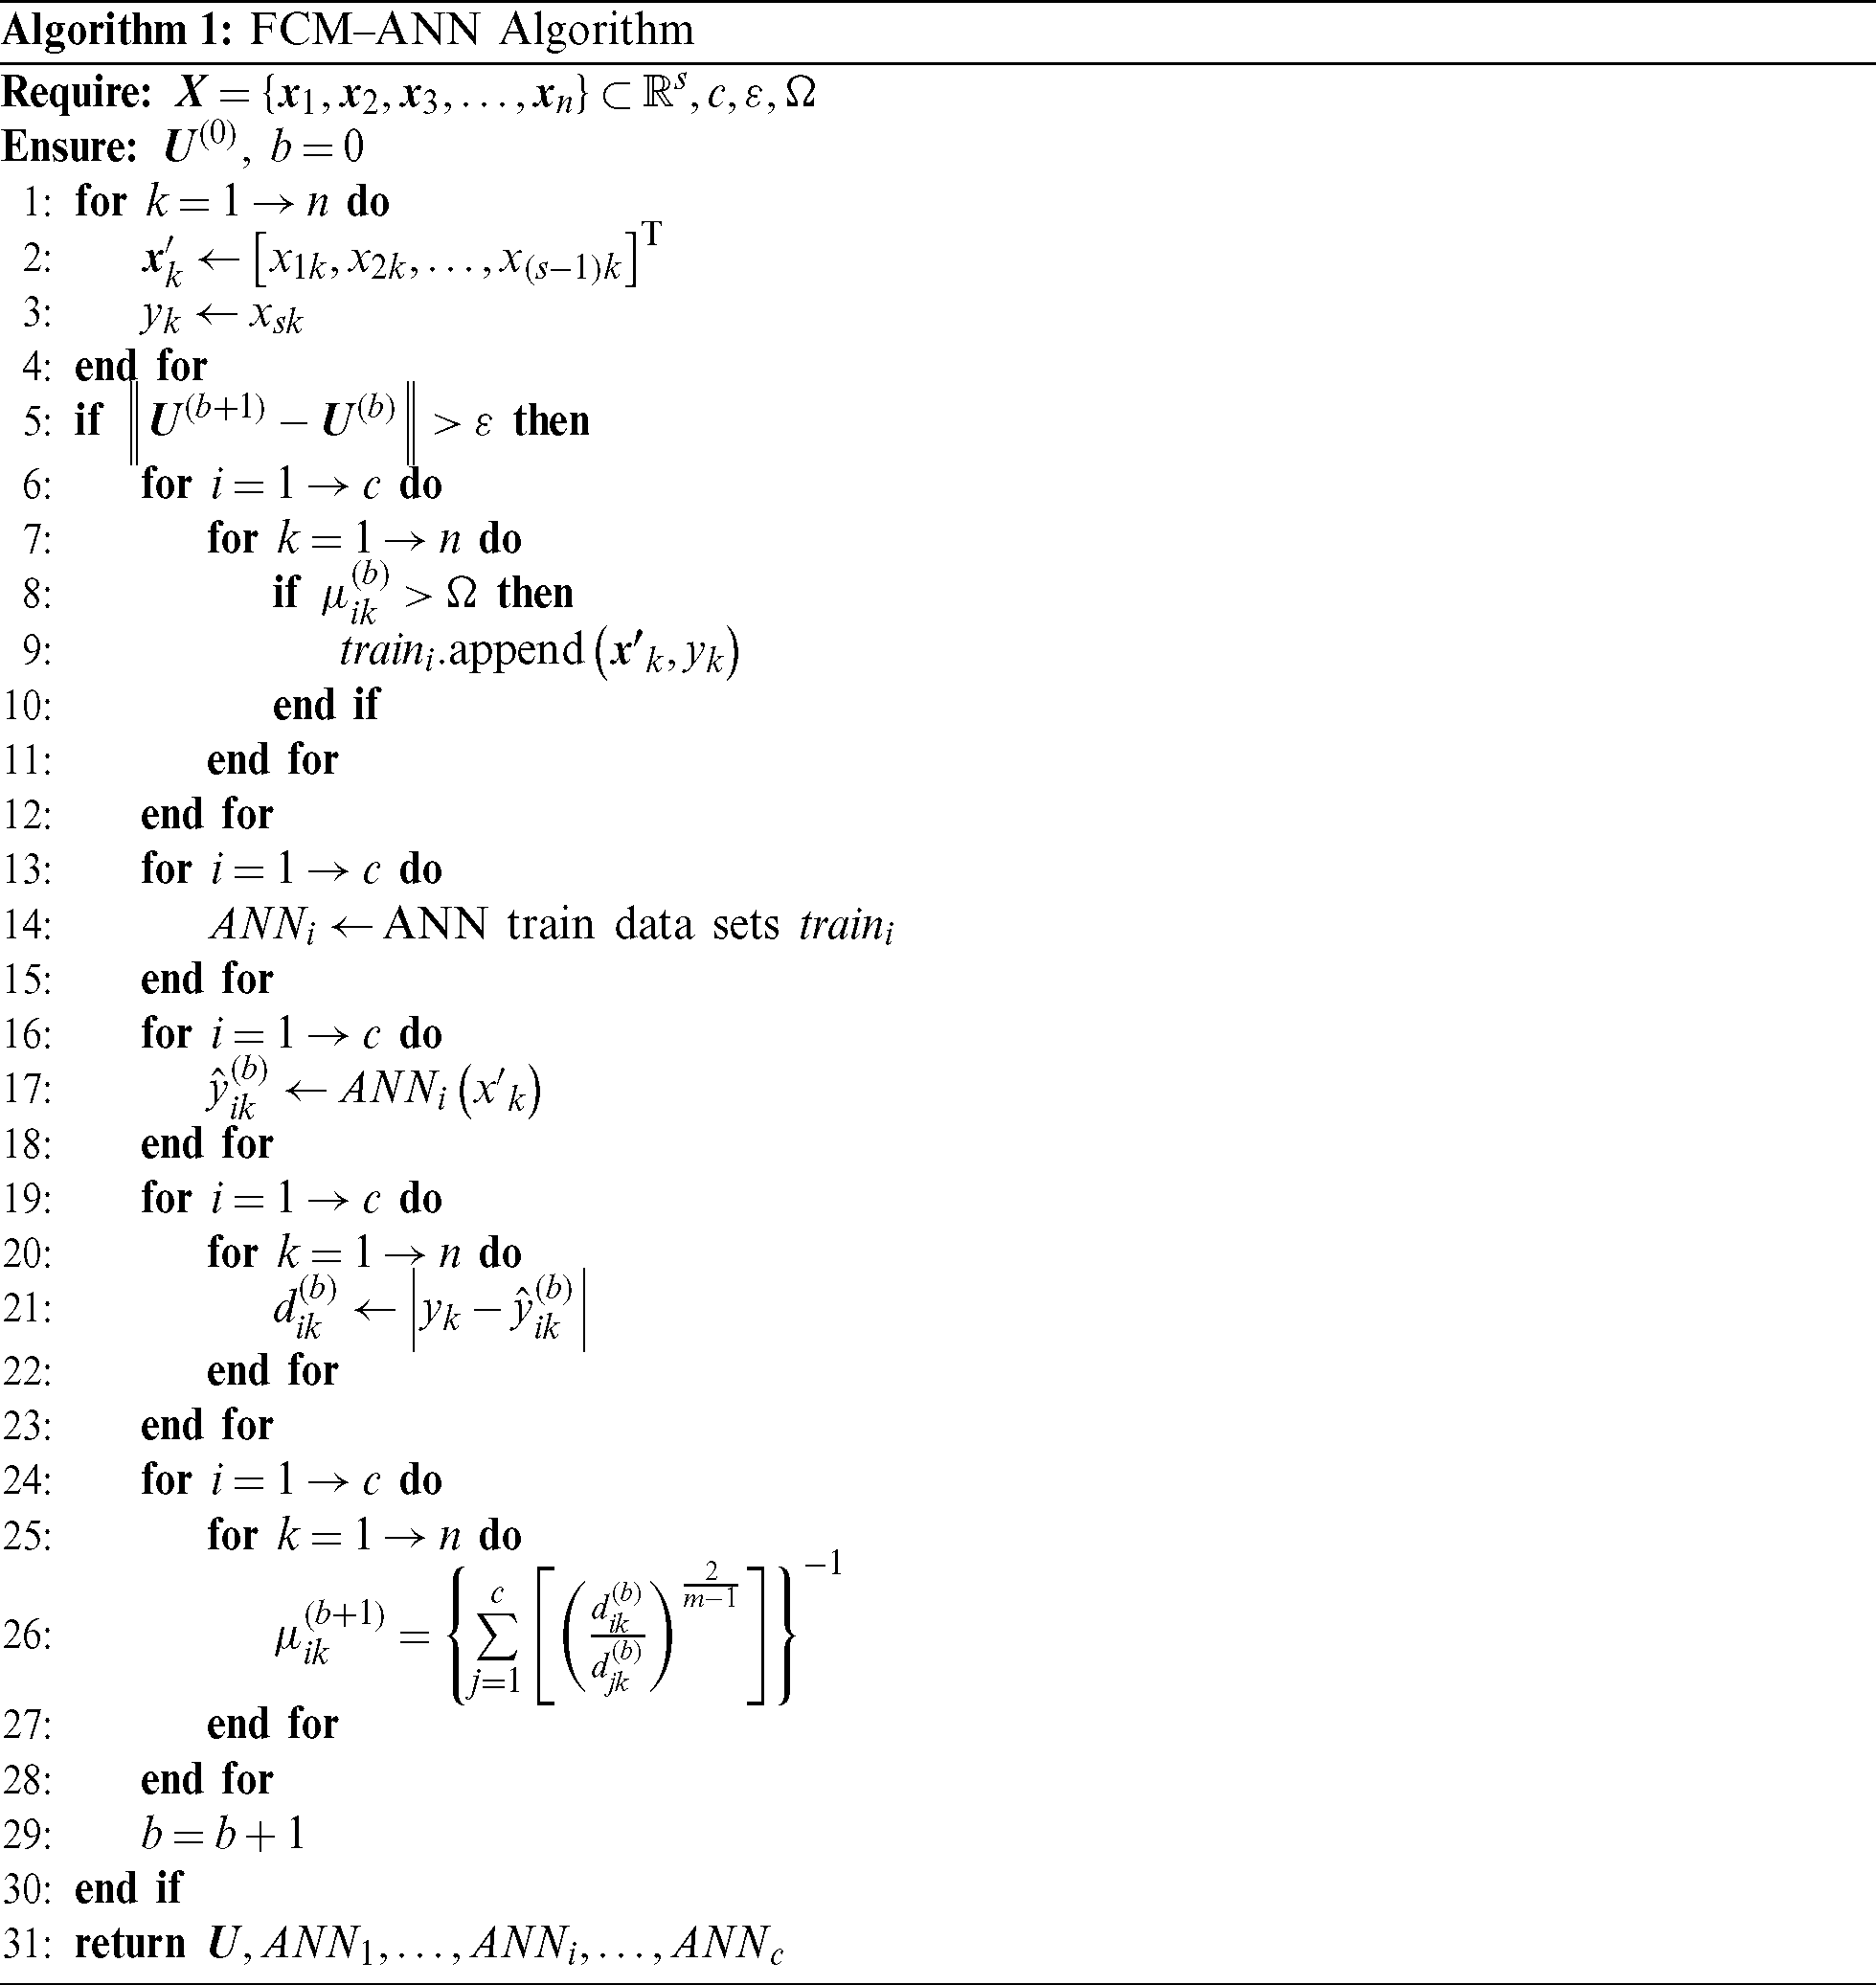
For the clustering problem of functional data, this paper proposes the FCM–ANN algorithm. It obtains an approximate functional model through the ANN training dataset. Then the function model is used as a new clustering prototype to replace the clustering prototype of the traditional FCM algorithm, and participates in the algorithm’s alternating optimization. Finally, the algorithm will obtain the clustering result of the dataset and the corresponding functional data ANN model.
The rest of this paper is organized as follows. In Section 2, we first introduce the FCM algorithm and the artificial neural network algorithm, and then propose the FCM–ANN algorithm. Section 3 introduces the clustering results of applying the algorithm to synthetic dataset experiments and compares it with the traditional FCM algorithm. Section 4 introduces the experimental results of applying the FCM–ANN algorithm to the operation data of the tunnel boring machine (TBM) and compares it with the method of not performing classification modeling. In Section 5 we make some conclusions on this paper.
2 Proposed Algorithm (FCM–ANN)
The FCM algorithm is a fuzzy clustering algorithm based on objective function. For a given dataset  , the FCM algorithm divides
  into
into  clusters by minimizing the clustering objective function. The clustering objective function is as follows:

where  is the target data, xjk is the j-th attribute value of the data;
  represents the clustering prototype vector of the i-th cluster, and the clustering prototype matrix is represented as
  is the membership degree, which indicates the degree to which the data
  belongs to the i-th cluster. For
  , there is
  , and it satisfies the following relationship:

The partition matrix is expressed as  is a weighting parameter, also called a smoothing parameter,
  is the Euclidean distance in the s-dimensional space.
Combined with the constraint Eq. (2), the Lagrange multiplier method can be used to minimize the objective function. The final formula for the partition matrix and clustering prototype is as follows:


The specific steps of the FCM algorithm are as follows:
Step (i) Set the number of subclusters of fuzzy clustering c, for  , n is the number of data of the target dataset; set the iteration stop threshold
  ; initialize the cluster prototype
  ; set the iteration counter b = 0.
Step (ii) Calculate (or update) the partition matrix  using Eq. (3) and
  .
.
Step (iii) Update clustering prototypes  using Eq. (4) and
Step (iv) Calculate the discriminant Eq. (5):

If the Eq. (5) is established, the algorithm stops and outputs the partition matrix  and and the cluster prototype matrix
  ; otherwise set b = b + 1 and re-execute Step (ii). In Eq. (5),
  is a suitable matrix norm.
The algorithm can also start by initializing the fuzzy partition matrix  , then calculate (update) the clustering prototype matrix with the Eq. (4), and then update the fuzzy partition matrix with the Eq. (3), until the stopping criterion is met.
2.2 Artificial Neural Network ( ANN)
As a hotspot in recent years, artificial neural network is a multi-disciplinary subject area with a wide range and depth. A neural network is a broad and interconnected network of adaptive simple units whose organization mimics the interactions of the biological nervous system with the real world. The most basic building block in a neural network is a neuron. Each neuron is connected to other neurons, and each neuron transmits information through signals.
In this paper, we use the BP (error BackPropagation) algorithm to construct a neural network, which is the most common neural network learning algorithm by far. For a given training dataset  for
for  and
and  , that is, the input data contains d attribute values, and the output data contains l attribute values. We abstract the algorithm model into a feedforward neural network structure as shown in Fig. 1.
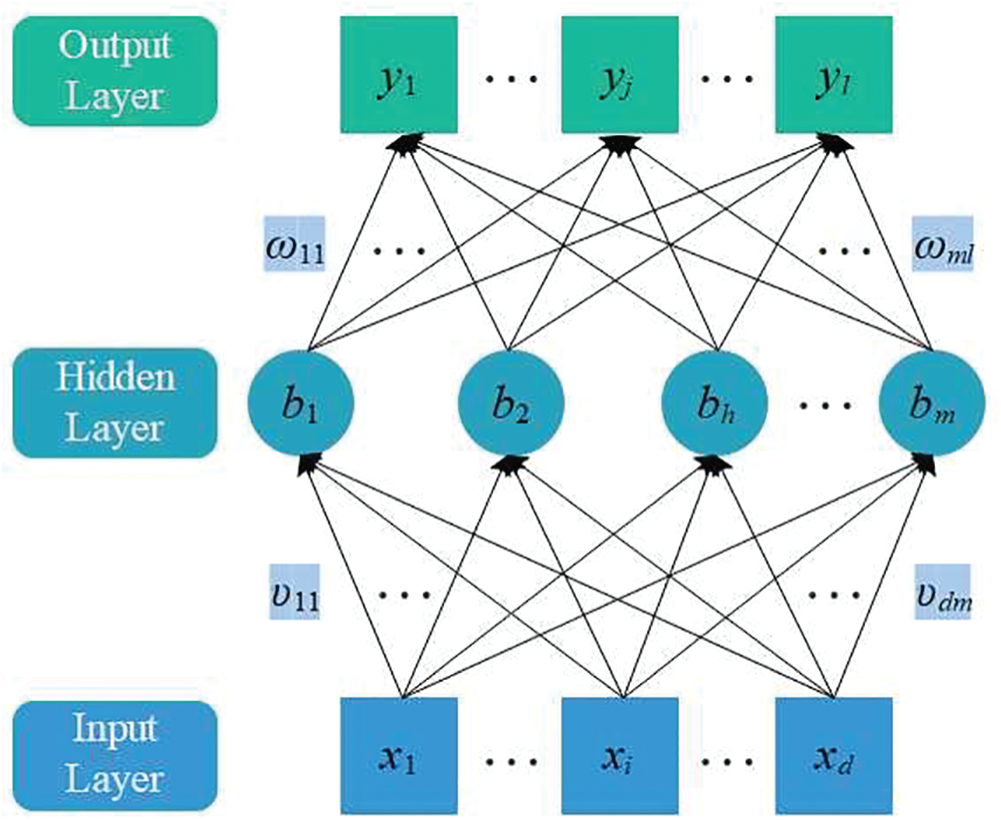
Figure 1: Feedforward neural networks with one hidden layer
The structure has d input neurons and l output neurons. The hidden layer neurons can be assumed to be m. The threshold of the j-th neuron in the output layer is represented by  , and the threshold of the h-th neuron in the hidden layer is represented by
  . The connection weight between the h-th neuron in the hidden layer and the j-th neuron in the output layer is
  , and the connection weight between the i-th neuron in the input layer and the h-th neuron in the hidden layer is
  .
.
For a d-dimensional input  , the output value
  can be obtained according to the neural network structure. The final calculation result of yj is as follows:

where  is a sigmoid function, its equation is:

In view of the fact that the traditional FCM algorithm can not effectively solve the fuzzy clustering problem of functional data, we propose the FCM–ANN algorithm. In the FCM–ANN algorithm, we replace the clustering prototype in the traditional FCM algorithm with the neural network prediction value. This makes the clustering prototype change to conform to a certain data partitioning function, thus achieving accurate clustering of data.
For functional data, the iterative process of the FCM–ANN algorithm can be expressed as follows:
Step (i) Set the number of subclusters of fuzzy clustering c, for  , n is the number of data of the target data set; set the iteration stop threshold
  ; initialize the partition matrix
  ; Set the membership threshold
  ; set the iteration counter b = 0.
Step (ii) The clustering result can be obtained according to the partition matrix  . We use the clustering results as training data set to input artificial neural networks for training, and then we can obtain different neural network prediction models
 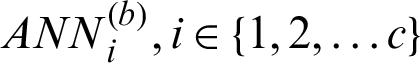 .
.
Step (iii) The prediction model is used for the independent variables  in the dataset to obtain the corresponding predicted output
  .
.
Step (iv) Use the predicted output as a clustering prototype, the corresponding Euclidean distance  can be obtained according to the distance function:

Step (v) Update the partition matrix  by the Eq. (9).
Step (vi) Calculate the discriminant:

If the Eq. (10) is established, stop the algorithm and output the partition matrix  and neural network prediction models
  ,
,  ; otherwise set b = b + 1 and repeat Step (ii).
The FCM–ANN algorithm combines the advantages of both FCM and ANN. FCM makes the iteration always go in the direction of gradient descent. ANN provides accurate prediction results and can approximate any nonlinear function. In theory, the algorithm can achieve fuzzy clustering of arbitrary functional data.
3 Experiments on Synthetic Datasets
In this section, we construct some synthetic datasets to study the validity of FCM–ANN algorithms and their effect on predictions with the different number of samples, number of attributes, and noise.
The synthetic datasets are created as follows. In each cluster of each dataset, the objects of i-th cluster except xobj are first randomly sampled. The xobj of each object is calculated according to the setted FRA. After that, the data of different cluster are combined as the obtained dataset. Each dataset is given a denomination by the number of object data, attributes, clusters and functional relationships among attributes. For instance, N400A2C2F1 denotes that the dataset contains 400 object data and can be divided evenly into two clusters, A2 denotes the dataset has two attributes. The clustering performance of the proposed clustering algorithm is compared with FCM.
Number of samples The synthetic datasets that discuss the effect of the number of samples size are divided into four groups. Each group of dataset consists of two clusters, each of which has 50, 100, 150, and 200 object data. And each cluster has two attributes, which is a functional relationship of  . The specific function relationship corresponding to the two types of data is as shown in Eqs. (11.1) and (11.2). At the same time, the noise is set to satisfy 3% of the standard functional relationship data and is subject to a Gaussian distribution.
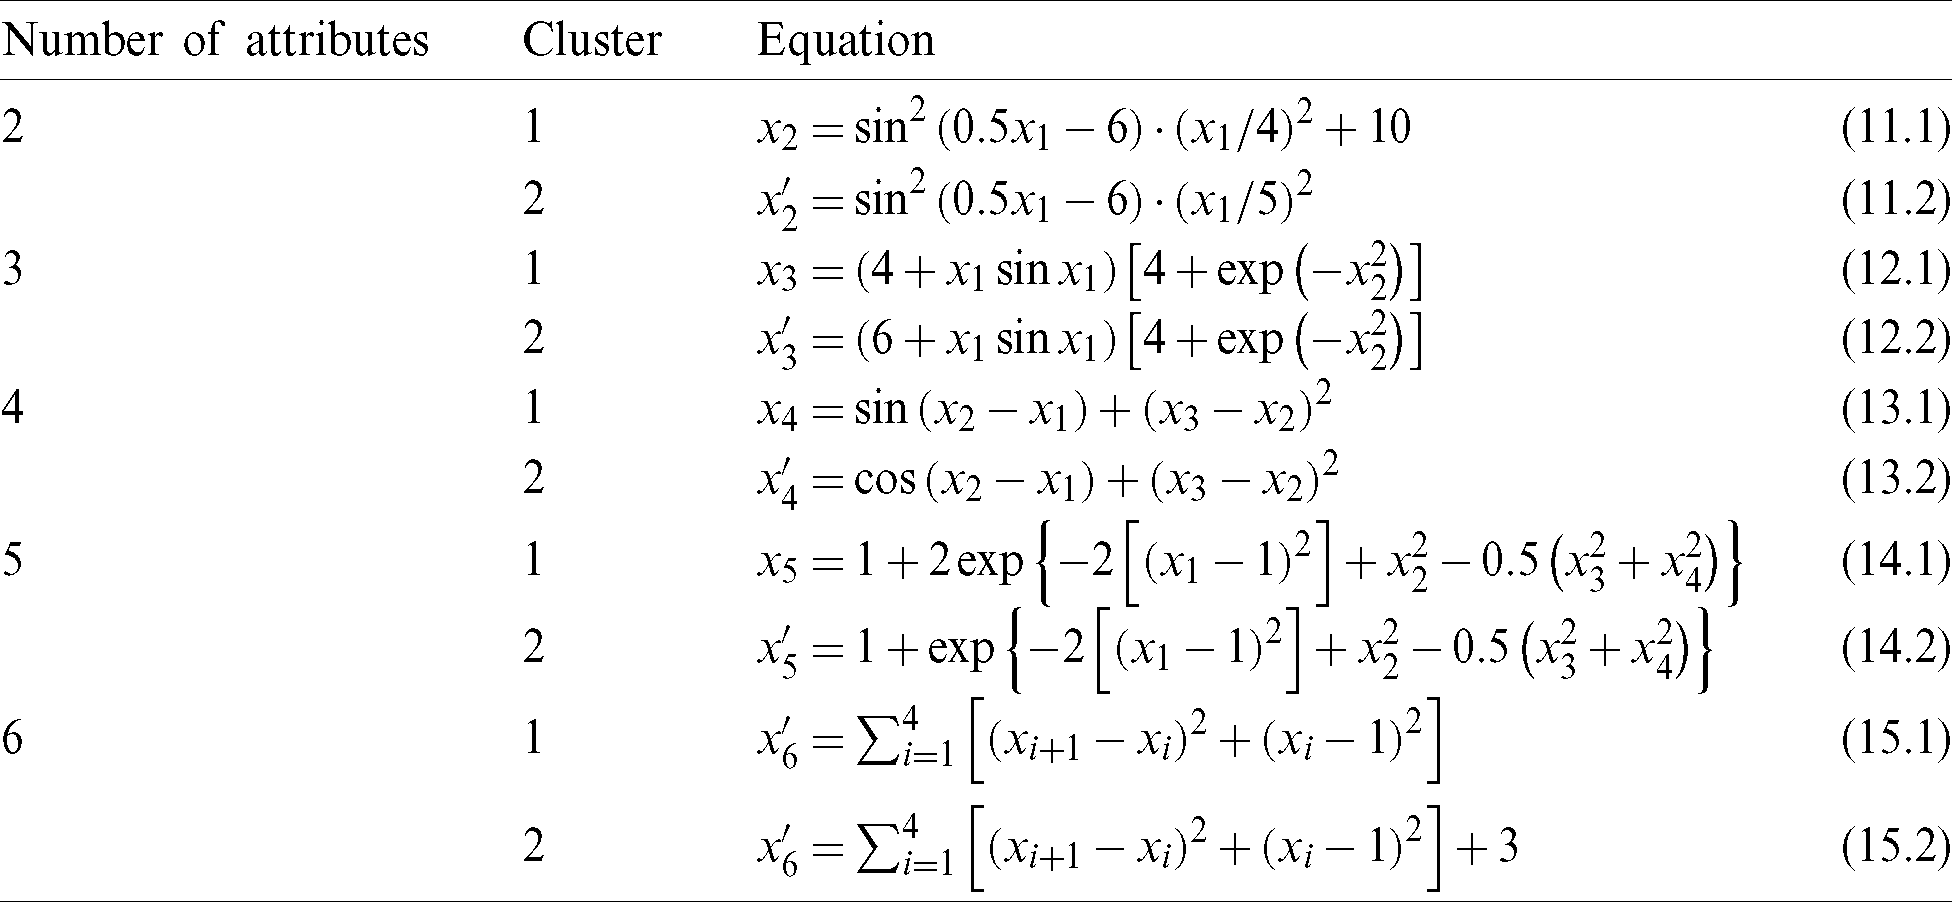
Number of attributes The synthetic datasets that discuss the effect of the number of attributes are divided into five groups. Each dataset consists of two clusters, and the number of attributes of each cluster is 2–6, separately. They respectively satisfy the relationship as shown in Tab. 1. Each dataset have 200 samples. The noise is also set to 3%, as well as the Gaussian distribution is satisfied.
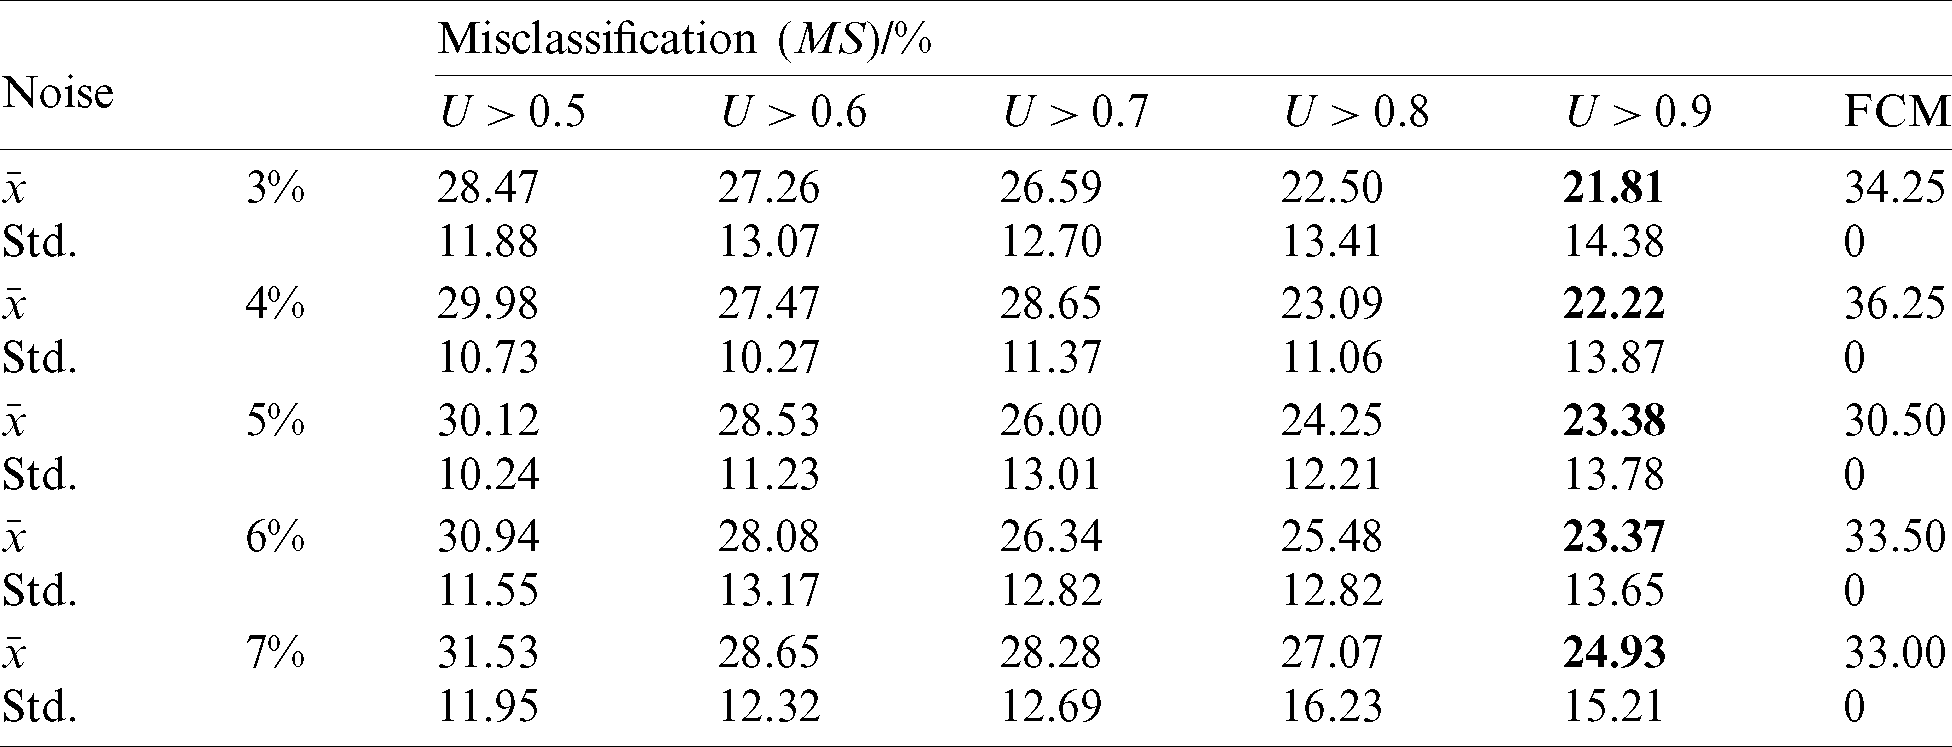
Noise The synthetic datasets that discuss the effect of noise are divided into five groups. Each dataset consists of two clusters, each of which has 3–7% noise of the standard data. And the noise subject to Gaussian distribution. They have 200 samples per cluster and 6 attributes. The specific function relationships corresponding to the two clusters of dataset are shown in Eqs. (15.1) and (15.2).
Table 1: Functional equation corresponding to the number of attributes
In order to test the clustering performance, we carried out a comparison experiment between the proposed algorithm and the FCM algorithm.
The clustering performance is evaluated in terms of misclassification (MS), which is calculated as follows:

where Nerror is the number of misclassified object data; Ntotal is the total number of object data.
We set the fuzzification parameter m = 2, convergence threshold c = 10−4. The misclassification is discussed in each experiment by controlling the membership threshold. Tabs. 2–4 present the average results over 30 experiments, with the optimal results being indicated in bold.
Table 2: Effect of the number of samples on algorithm prediction
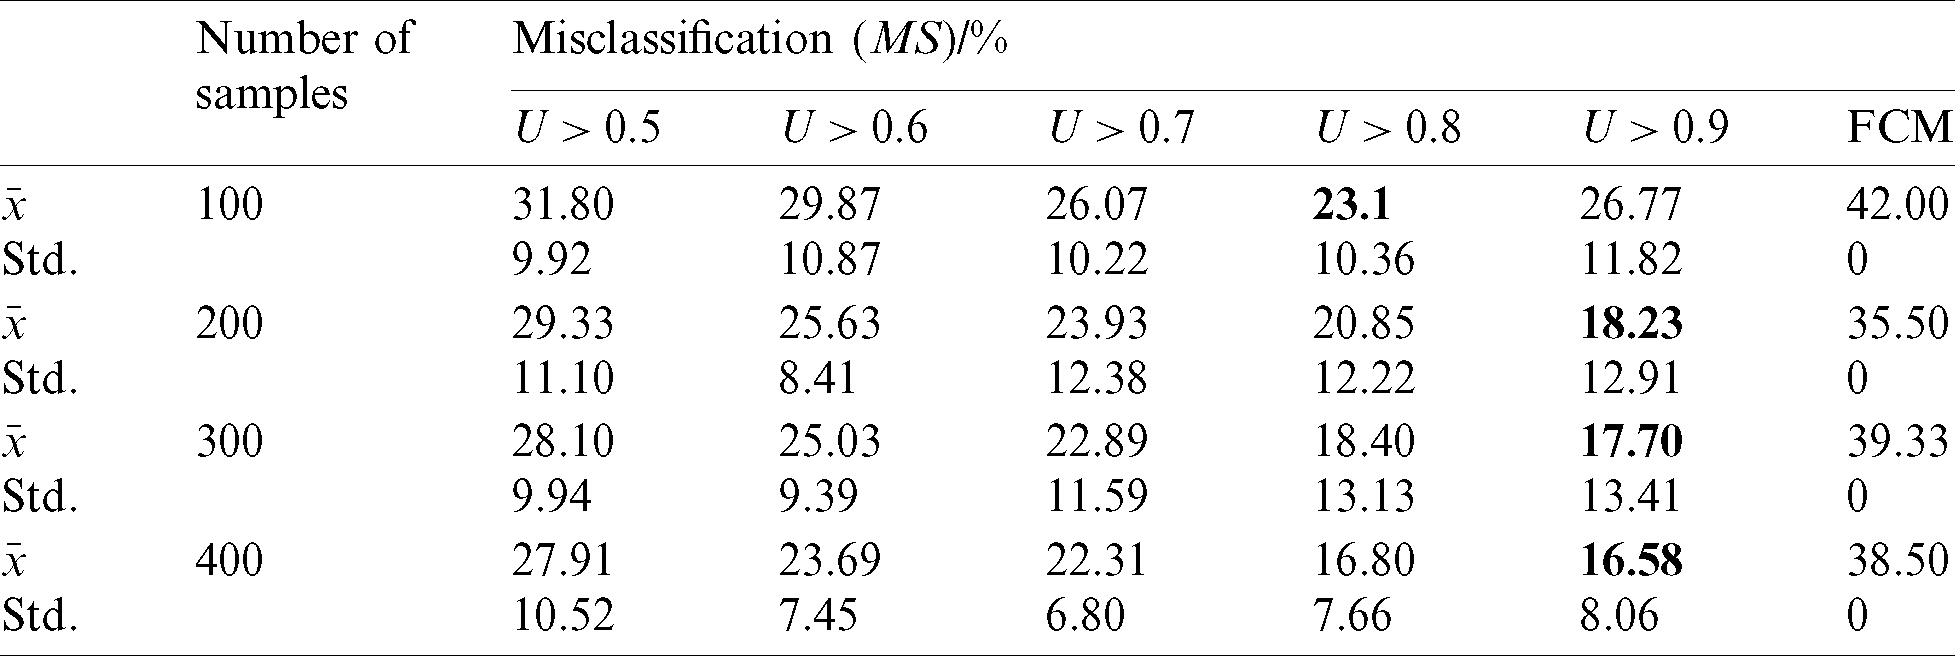
Table 3: Effect of the number of attributes on the algorithm prediction
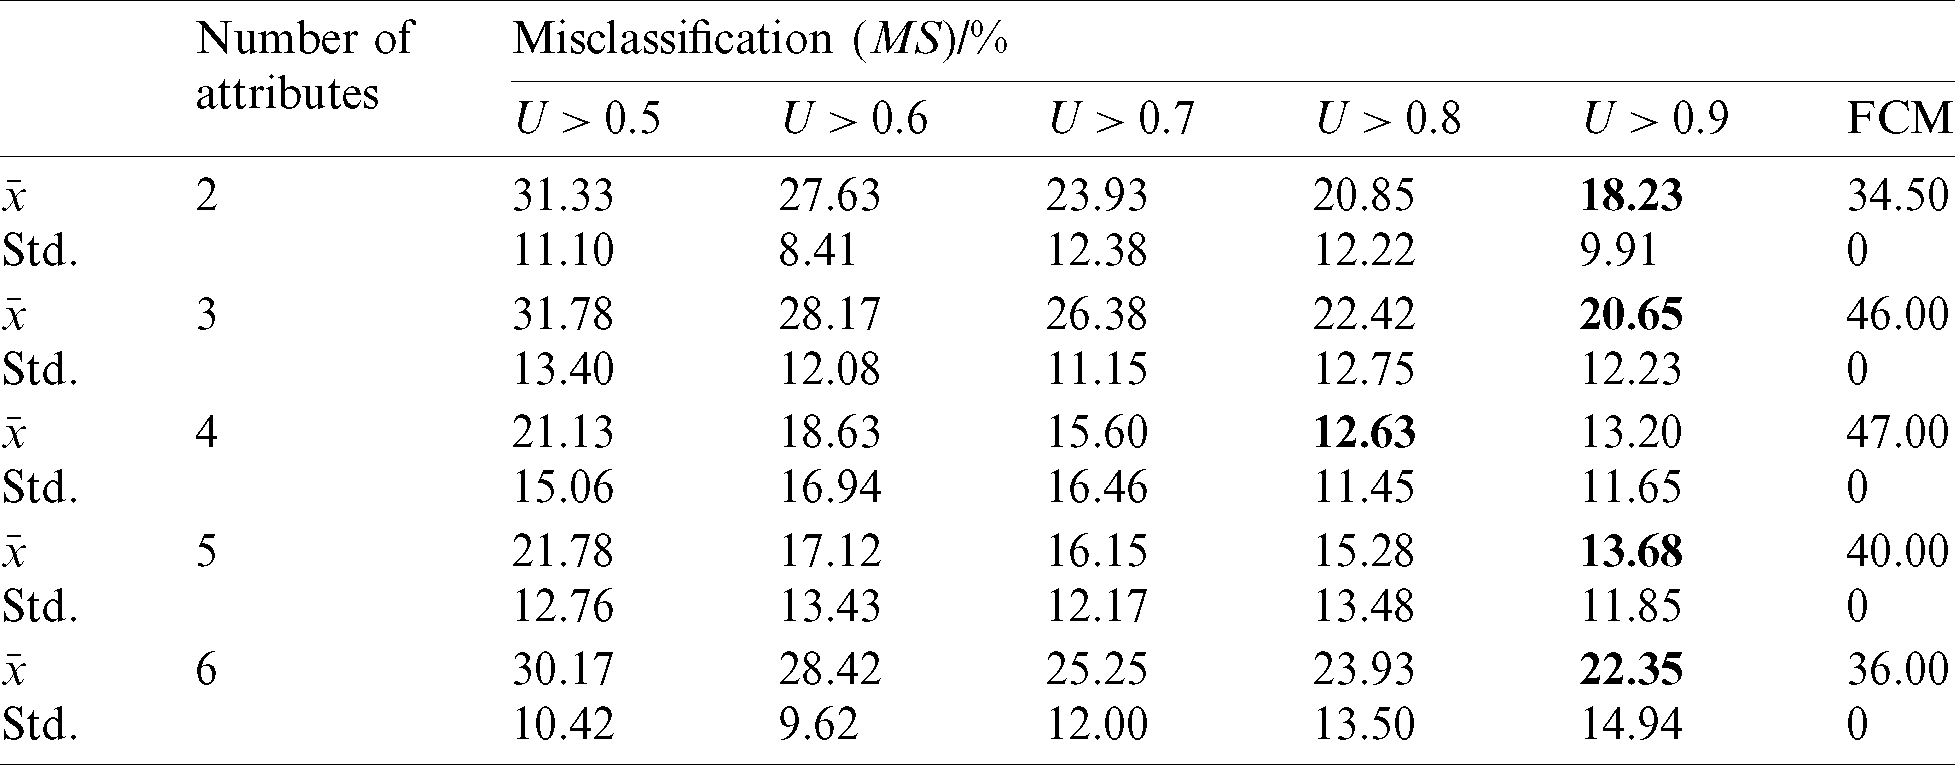
Table 4: Effect of the noise on the algorithm prediction
We use the t-test as the measure to analyze the convergence of the experimental results. The t-test is mainly used for a normal distribution with a small sample size and an unknown population standard deviation  . The t-test uses the t-distribution theory to infer the probability of occurrence of the difference, thereby comparing whether the difference between the two means is significant. The t-test can be divided into the one-sample t-test, the two-sample t-test and the paired t-test. The paper uses the one-sample t-test method to test the results of clustering.
The one-sample t-test is used to test whether the difference between the average of a sample set and the known population mean is significant. When the distribution of the population shows a normal distribution, the sample size is small and the standard deviation of the population is unknown, the dispersion statistics of the sample mean and the population mean are t-distributed.
The statistic for the one-sample t-test is:

where N is the total number of samples,  is the mean number of samples,
  is the mean of the population, and S is the sample standard deviation. The t statistic obeys the t-distribution with a degree of freedom of
  when
when 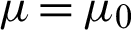 .
.
The t-test was performed using the data in Tabs. 2–4. The hypothesis is as follows:

Under the condition of the significance level  , the rejection region of the hypothesis is
  . Checking out the table of t-distribution to get the upper quantile
  .
.
This hypothesis is tested by calculating the statistic t using the Eq. (17). The results are listed in Tab. 5, where the results over the upper quantile are indicated in bold.
Table 5: The results of test statistics
In order to evaluate whether there is a significant difference between the results obtained by the FCM–ANN algorithm and the FCM algorithm, we also used the SPSS software to conduct a Wilcoxon rank-sum test. We compare the results in Tabs. 2–4 with the results of the FCM algorithm according to different membership thresholds and calculate their rank-sum. The results of the rank-sum test are shown in Tab. 6. Given the significance level  , we can obtain the critical value of the rank sum of
 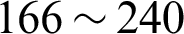 . According to the calculated rank-sum, we can judge whether the difference between the results of the two methods is significant.
Table 6: The result of the Wilcoxon rank-sum test

1) By analyzing Tabs. 2–4, the mean of misclassifications obtained by using the FCM–ANN algorithm is significantly lower than that of the FCM algorithm, except for the experimental results corresponding to 3% noise in Tab. 4. In addition, from the Wilcoxon rank-sum test results in Tab. 6, it can be seen that the results obtained by the FCM–ANN algorithm are significantly different from those obtained by the FCM algorithm. Therefore, we can conclude that the clustering result of the FCM–ANN algorithm is better than the FCM algorithm. At the same time, according to the results in Tabs. 2–4, as the membership threshold increases, the misclassifications show a downward trend. The results show that the higher the membership threshold, the more the invalid data can be avoided to participate in the artificial neural network training, so the fitting result is more accurate and the prediction effect is better. However, as the membership threshold increases, the standard deviation of the misclassification increases, which results in a decrease in the stability of the results.
2) According to the results of Tab. 2, in the case where the membership threshold is the same, the misclassifications will decrease as the number of samples increases. According to the results, as the number of samples increases, the training dataset provided by the experiment will also increase, which makes the prediction effect of the algorithm more accurate.
3) According to the vertical comparison Tab. 3, the clustering results of the dataset are better when the different number of attributes are taken. Therefore, it can be concluded that the FCM–ANN algorithm can achieve effective clustering of functional data with the different number of attributes. This also shows that the algorithm has favorable stability.
4) According to the results of Tab. 4, when the noise increases, the misclassifications of the experiment using the FCM algorithm has no significant change, which indicates that the increase of noise will have less influence on the clustering result of the FCM algorithm. However, in the test results using the FCM–ANN algorithm, misclassifications will increase as the noise increases. Therefore, improving the accuracy of datasets and the reduction of noise can improve the clustering effect of the FCM–ANN algorithm.
5) According to Tab. 5, most of the results of the test are below the upper quantile. Therefore, it can be considered that the hypothesis H0 is valid, and the FCM–ANN algorithm can effectively implement the clustering of functional data. However, the results in the reject domain appear when the membership threshold is small. Therefore, appropriately increasing the membership threshold can make the clustering result more accurate.
3.4 Computation Cost and Convergence Analysis
We use the average of running time to measure the computation cost of the algorithm. The experimental environment is intel(R) Core (TM) i5-9300H 2.40 GHz CPU, 8 GB RAM, Windows 10 operating system, Python 3.7.0. Tab. 7 show comparisons of running times for experiments on synthetic datasets.
Table 7: Comparison of running times
According to the results in Tab. 7, although the FCM–ANN algorithm runs less time than the FCM algorithm, the results are still within acceptable limits. Therefore, the FCM–ANN algorithm can be considered to have a lower computation cost. At the same time, in the results, the running time will increase with the increase of the membership threshold, so the computation cost should be considered to set a reasonable membership threshold.
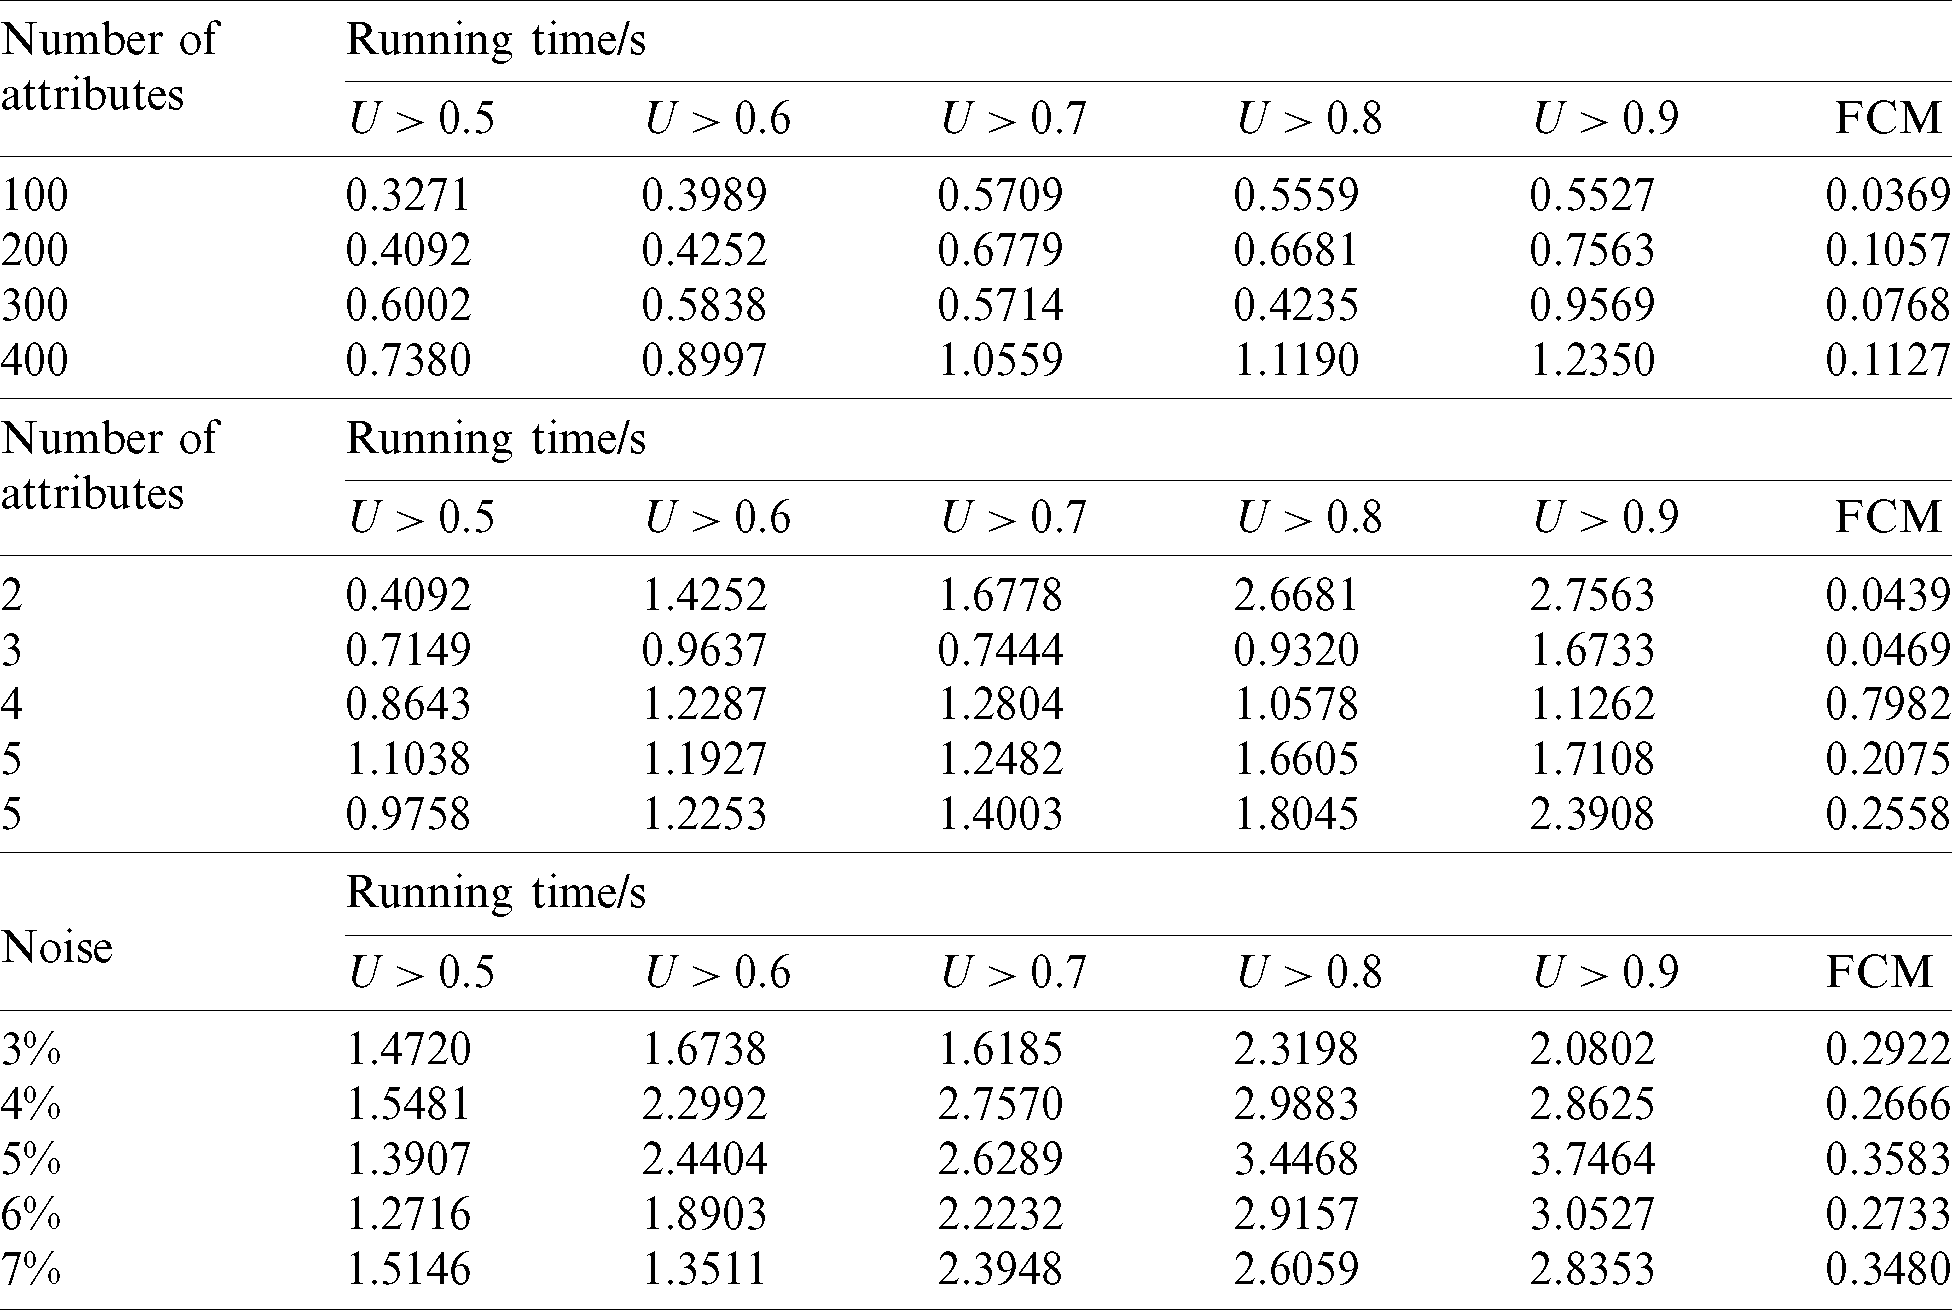
Then, we concentrate on the convergence analysis of FCM–ANN algorithm. In the Synthetic data sets, we selected data sets with the number of attributes of 2–5 for testing, as shown in Fig. 2.
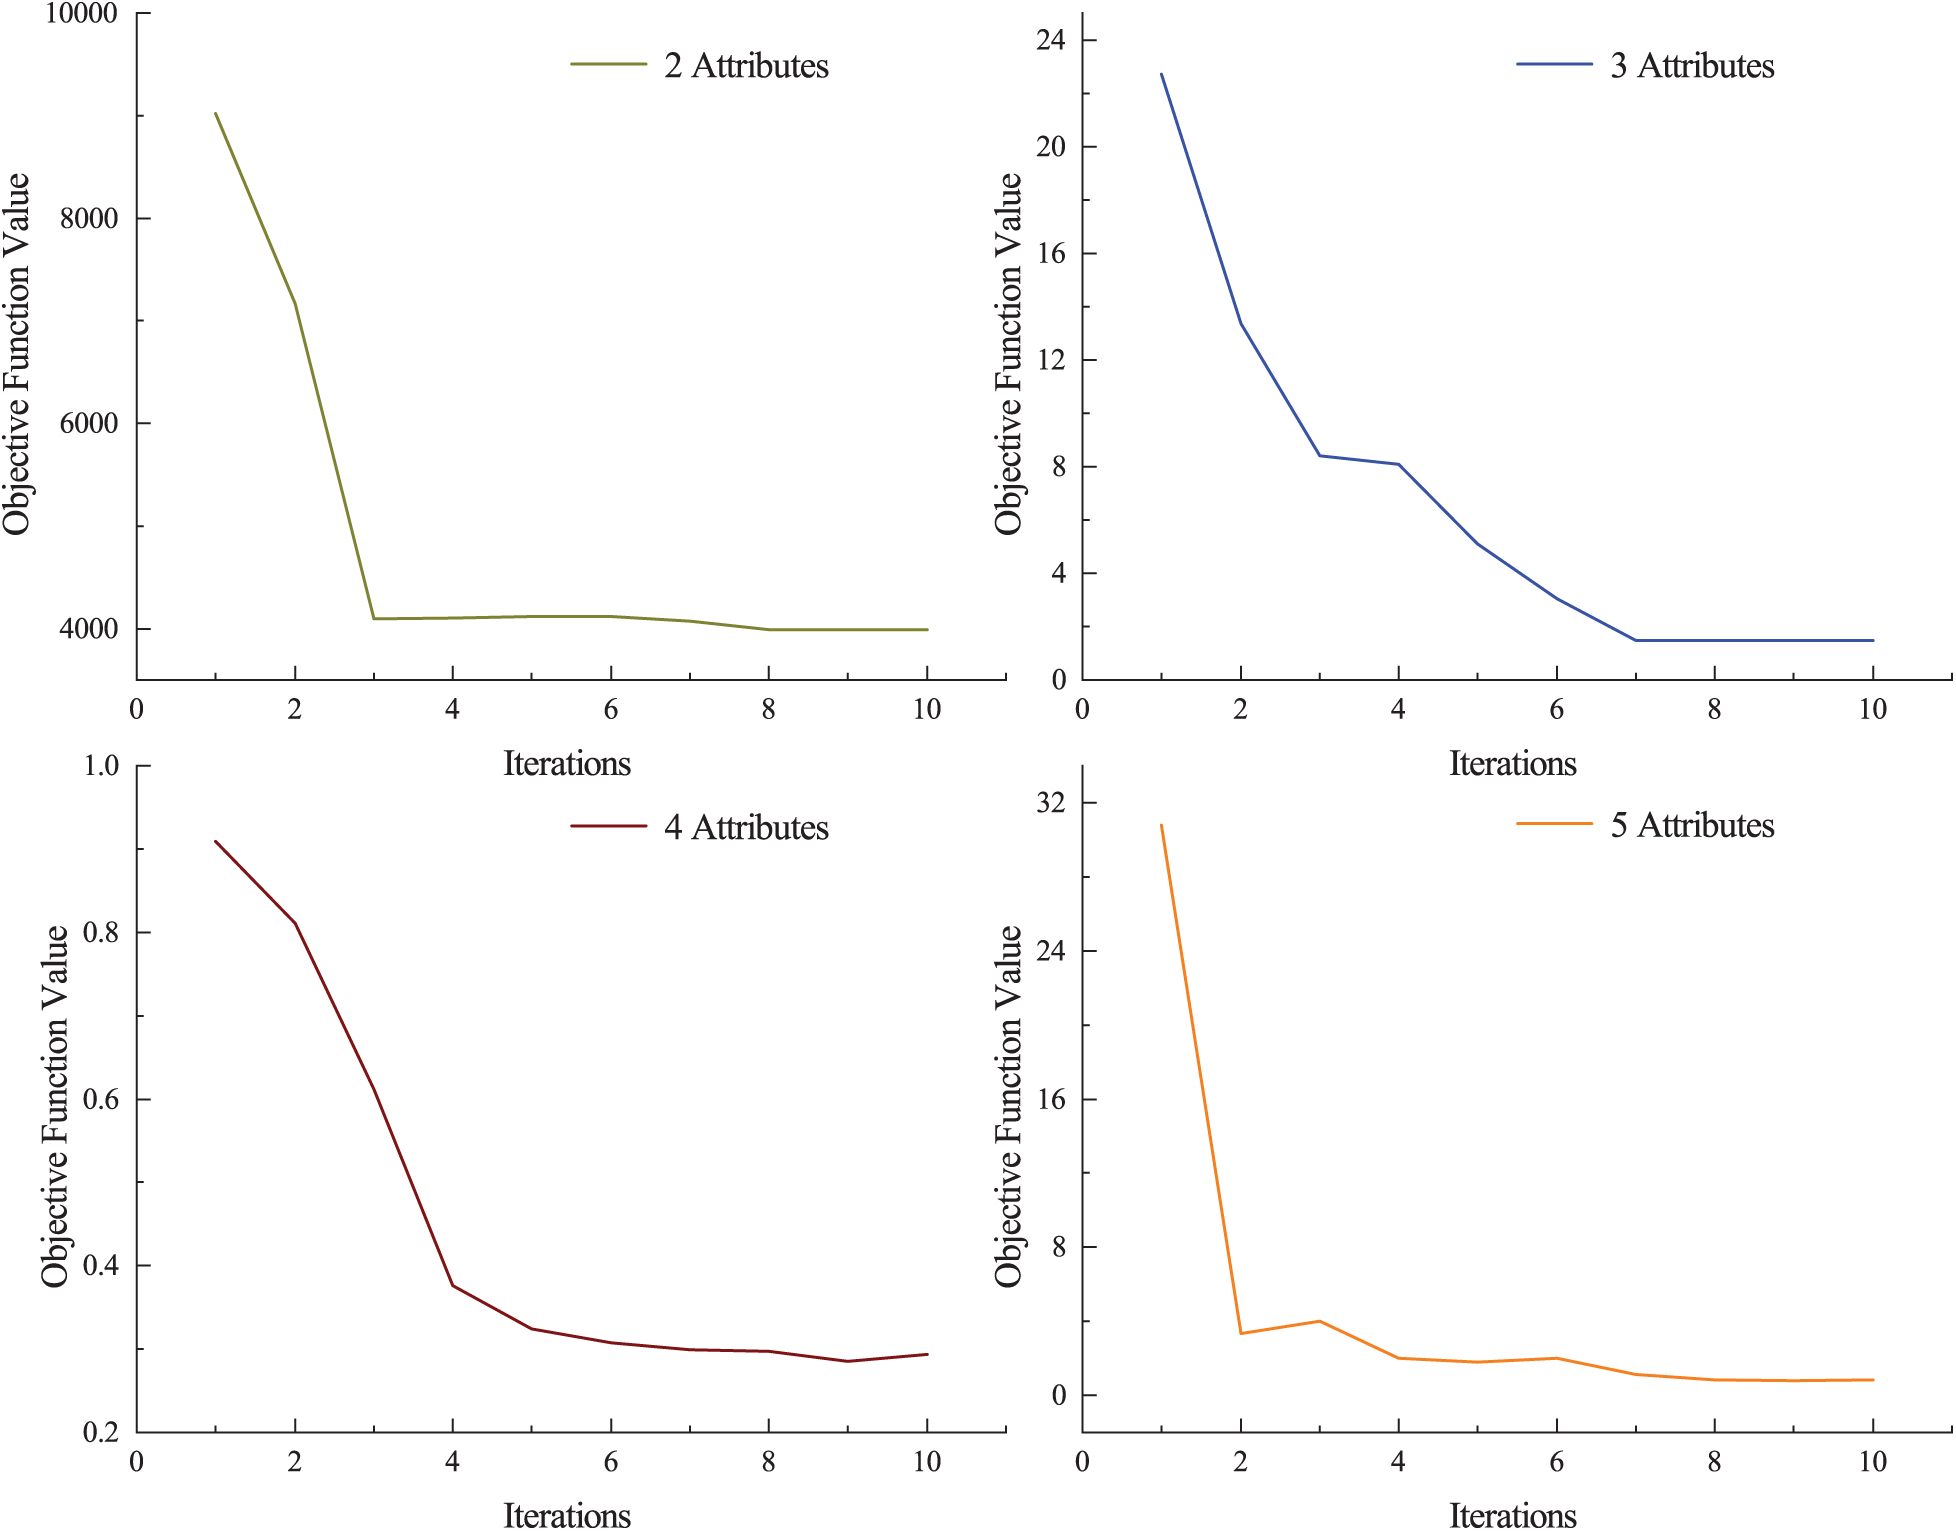
Figure 2: Objective function value in the iterative procedure
It can be seen that in the case of different number of attributes, the objective function value declines rapidly in the first 6 iterations and then tends to converge gradually. Therefore, it can be further proved that the proposed algorithm is effective.
4 Engineering Application on TBM Operation Data
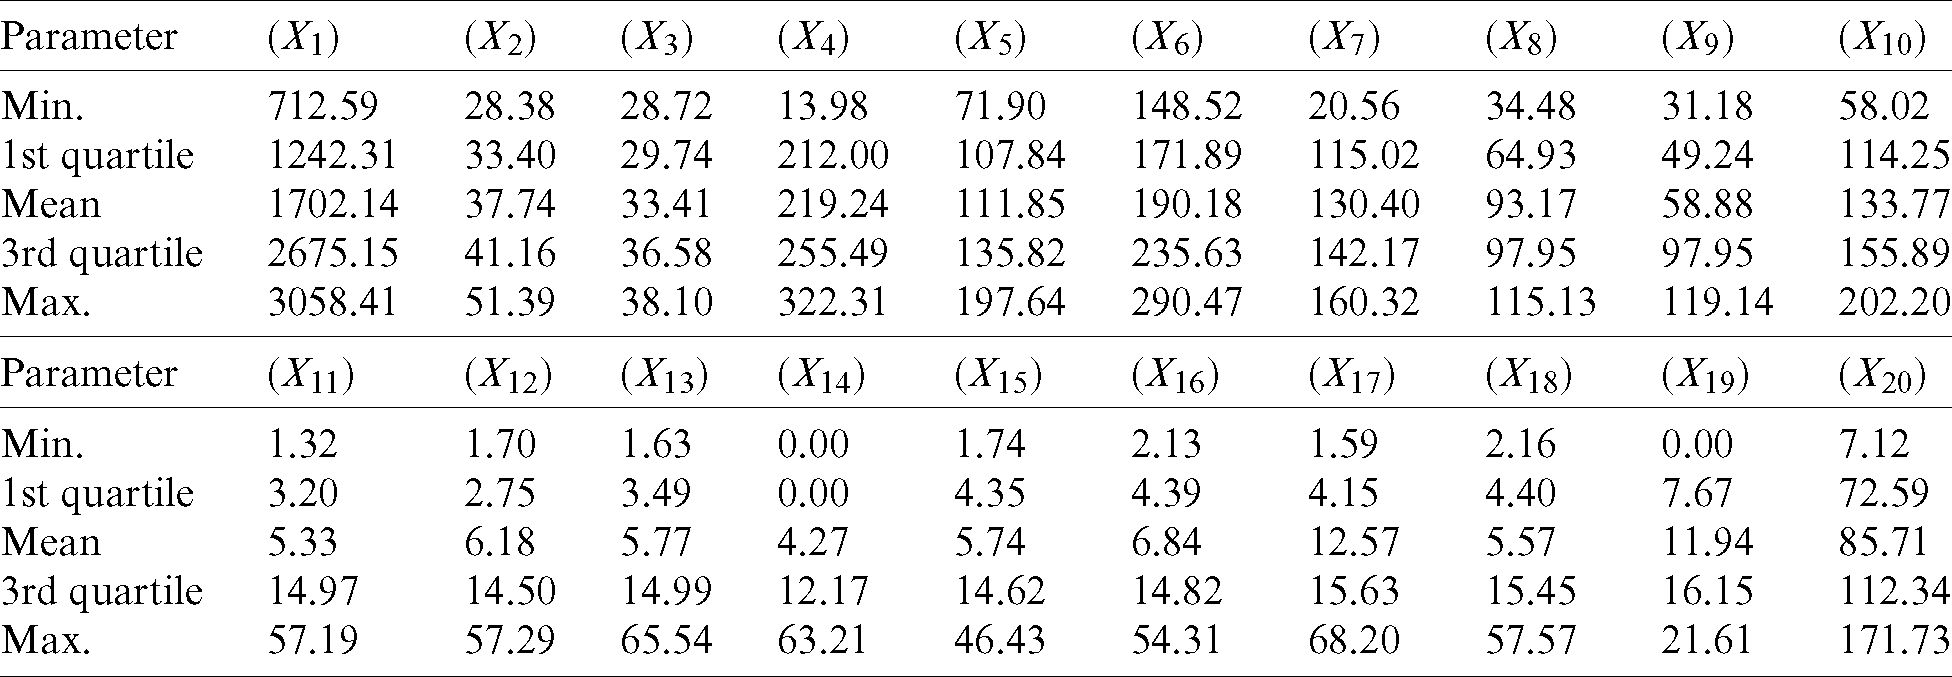
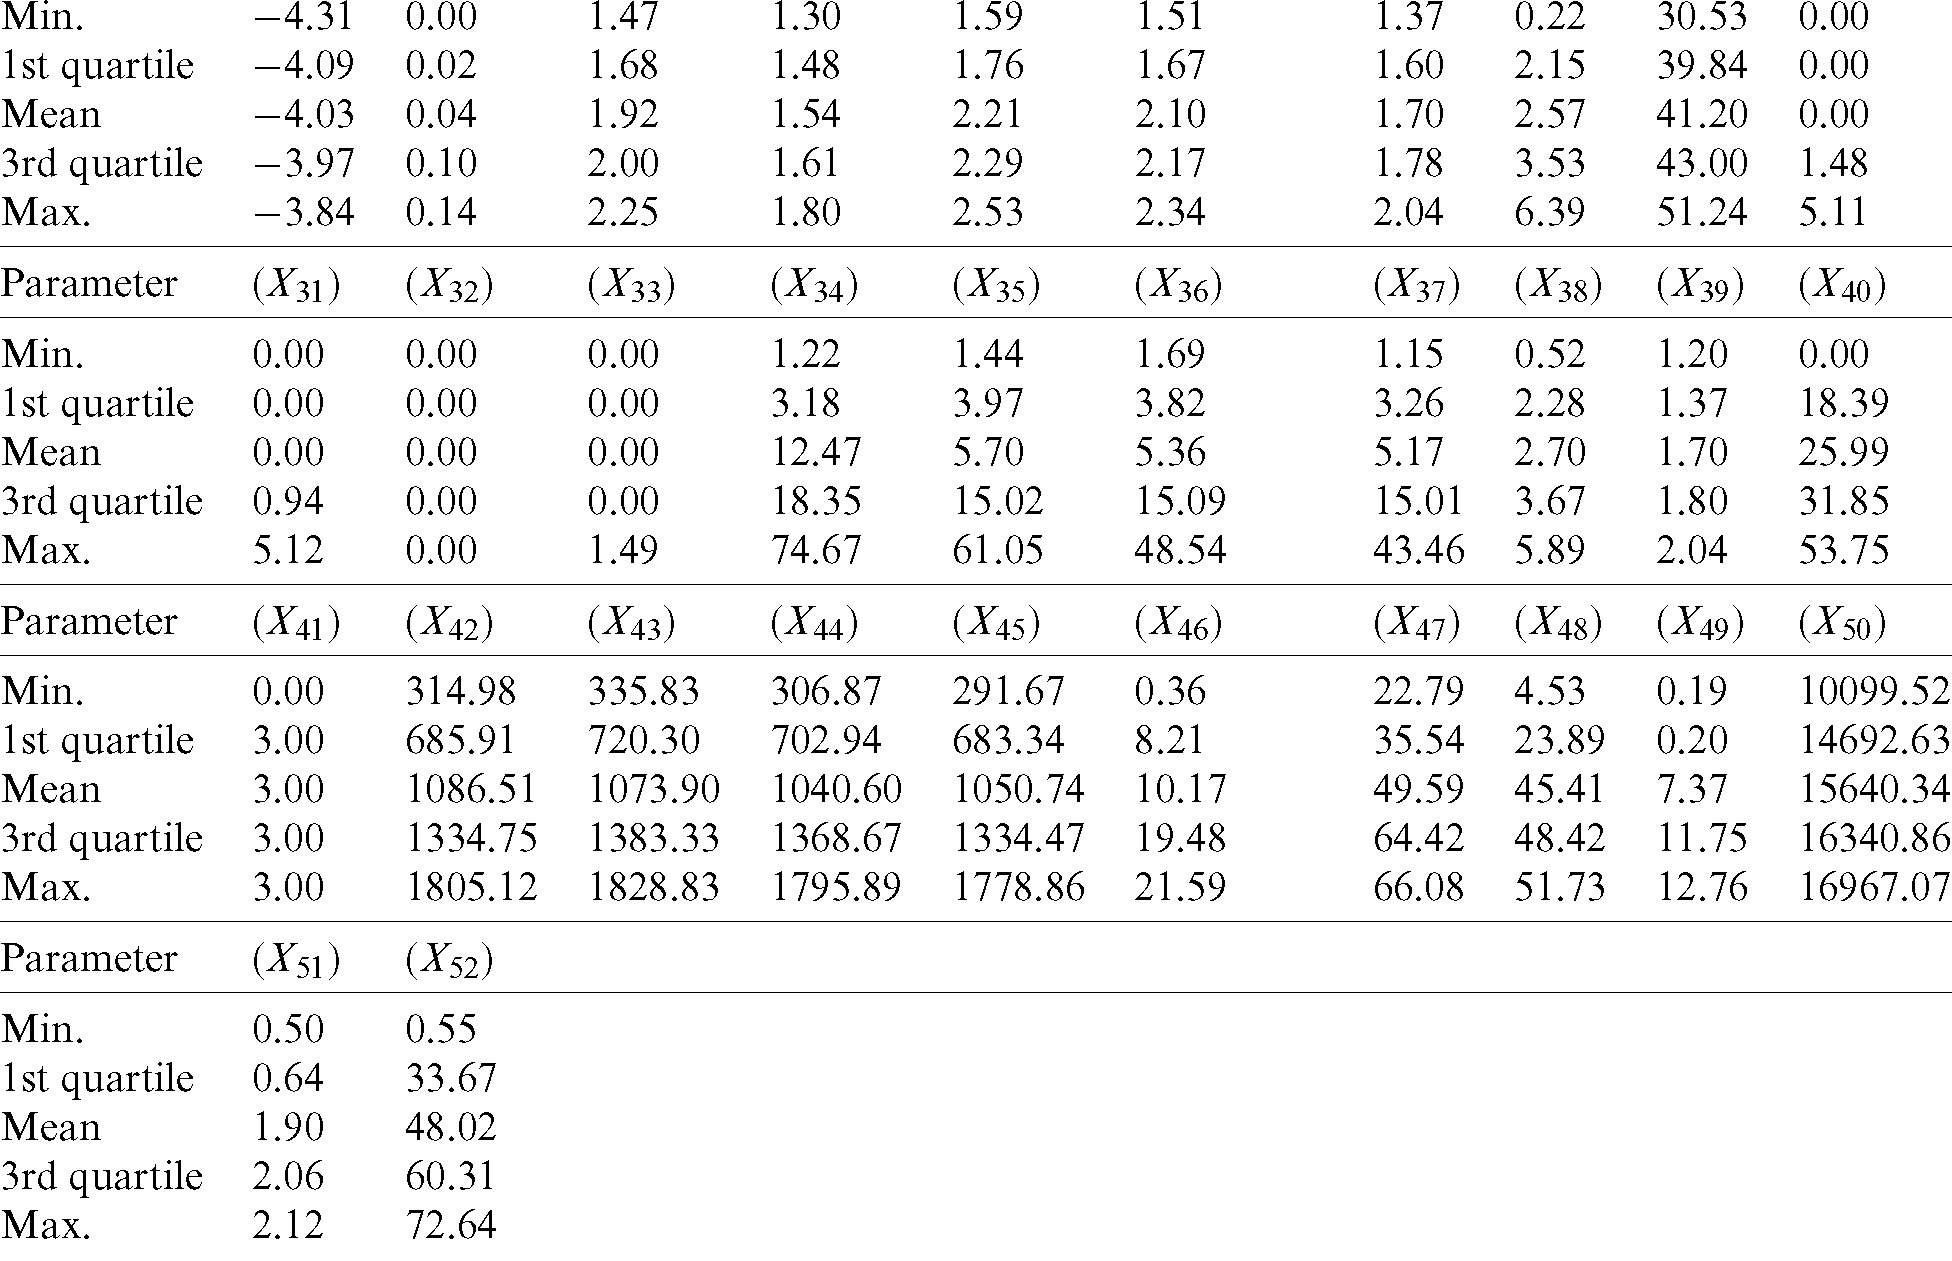
The tunnel project studied in this paper is located on a metro line in China, with a length of 2,000 meters and a diameter of 6.4 meters. The project adopted earth pressure balance (EPB) shield TBM. This system consists of a cutterhead, chamber, screw conveyor, tail skin and other auxiliary. The operation data adopted in this paper are collected from TBM construction projects, and there are 52 parameters, among which each parameter has different correlation with the tunneling speed. The statistical chart of the datasets used in this paper is listed in Appendix A.
The experiment is divided into two parts. Experiment 1 uses the neural network algorithm to directly train the TBM operation data to establish the prediction model of predicting the tunneling speed. Experiment 2 uses the FCM–ANN algorithm to cluster the TBM operation data firstly, aiming to obtain clustering results and prediction models for each cluster, and then use the model to predict each cluster of data. The two experimental results are compared to verify the practicability of the algorithm.
The same 1200 sets of TBM operation data were used in both experiments. We divide the datasets into three parts: Training set, validation set, and test set. Among them, the test set accounts for 20%, and the remaining 80% of the data is divided into training sets and validation sets. In addition, in order to prevent over-fitting problems, we perform 5-fold cross-validation on the training set and the validation set. The data are randomly divided into 5 equal parts, and each of the 5 equal parts is used as a separate test set, and the remaining 4 parts are used as the training set for building the model for validity verification. We use mean square error (MSE) as an indicator to evaluate the prediction accuracy of the validation set, which is calculated by Eq. (18).

1) The steps of Experiment 1 are as follows:
① Use the neural network algorithm to train the training set and the validation set, and adopt the cross-validation method to obtain multiple neural network prediction models.
② Use MSE as an indicator to evaluate the predictive effect of each model, and select the optimal model.
③ Apply the optimal model to the test set for prediction to obtain prediction results of the tunneling speed.
④ Compare the prediction results of the tunneling speed with the target values to evaluate the prediction results of the neural network algorithm.
2) The steps of Experiment 2 are as follows:
① Use the FCM–ANN algorithm to train the training set, so as to obtain the clustering results of the training set and their corresponding neural network prediction models.
② Use the FCM–ANN algorithm to train the validation set, then the clustering results of the validation set can be obtained.
③ According to the clustering results of the validation set, the neural network prediction models obtained by the training set is used to predict each cluster of corresponding data, then the prediction results of the validation set can be obtained.
④ Use the cross-validation method to repeat Steps 1–3, and use MSE as an indicator to evaluate the effect of each prediction, and select the optimal model.
⑤ Use the FCM–ANN algorithm to train the test set, then the clustering results of the test set can be obtained.
⑥ According to the clustering results of the test set, the optimal neural network prediction models are used to predict each cluster of corresponding data, then the prediction results of the tunneling speed can be obtained.
Tab. 8 shows the comparison results of the MSE of the validation set obtained through cross-validation during the two experiments. According to the above steps, Experiment 1 and Experiment 2 are executed and we obtain 240 sets of data were respectively. Compare this with the target values and the results are shown in Figs. 3 and 4.
Table 8: Comparison of Validation MSE
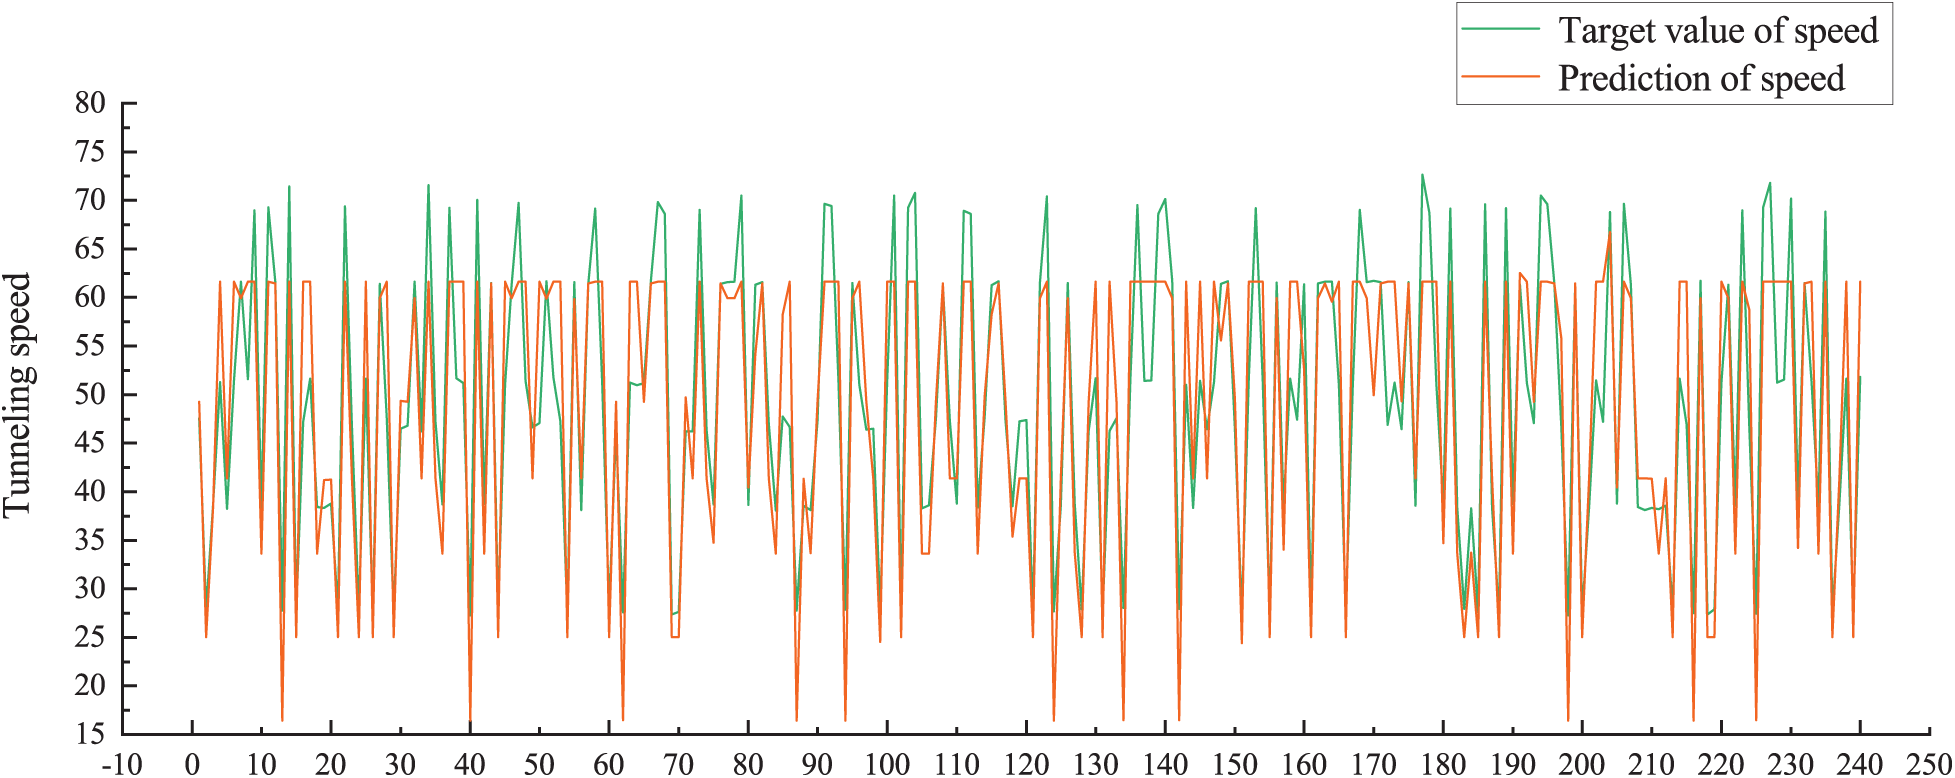
Figure 3: Correlation between predicted and target values (Experiment 1)
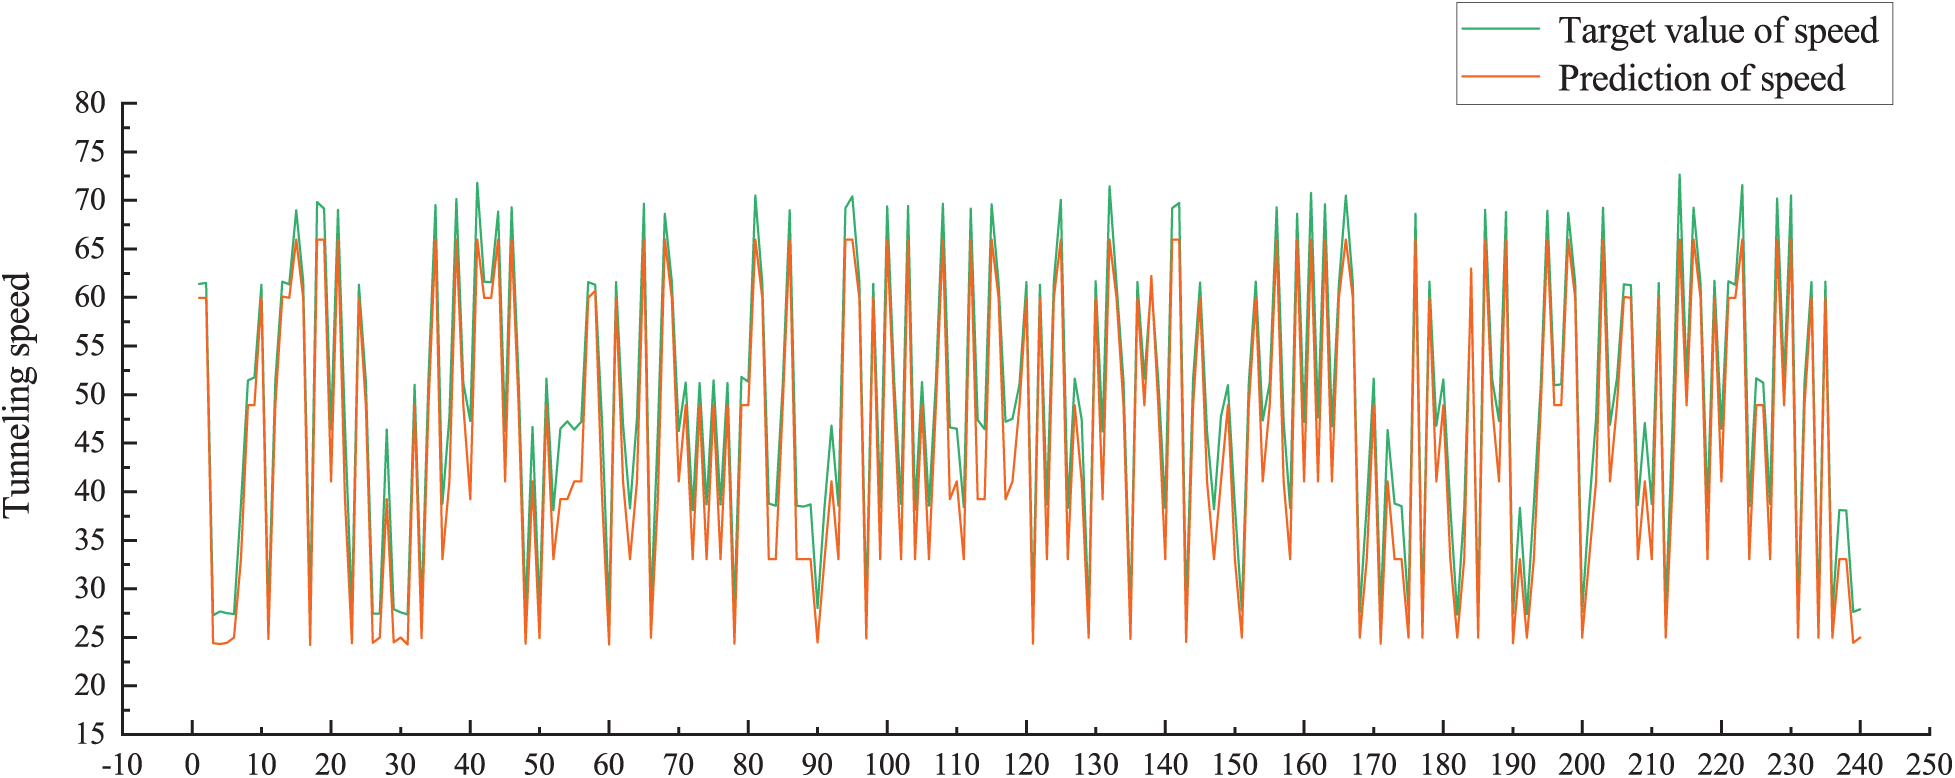
Figure 4: Correlation between predicted and target values (Experiment 2)
As can be seen from Fig. 3, the differences between the target values and the predicted values of the tunneling speed are obvious. This indicates that the neural network algorithm cannot accurately predict the tunneling speed without the cluster. But in Fig. 4, the target values of the tunneling speed show a good correlation with the predicted values.
In this section, we use root mean square error (RMSE) and coefficient of determination R2 as statistical criteria to evaluate the performance of the algorithm. The root mean square error (RMSE) is a measure of goodness-of-fit that best describes the average measure of error when predicting a dependent variable. For a set of data  , the result of regression prediction is
  . The RMSE can be expressed as the form shown in Eq. (19).

The coefficient of determination R2 is also a measure of the goodness-of-fit. It can be used to test the error of the predicted dependent and target values at the variable level. Before describing the goodness-of-fit, several additional indicators, namely the population squared TSS, the regression squared ESS, and the residual squared sum RSS, need to be introduced.


where  . The equation for calculating the R2 is:

The value range of R2 is [0,1]. The closer R2 is to 1, the higher the goodness-of-fit.
In the prediction experiment of the tunneling speed, 8 independent experiments were performed, and the RMSE and R2 indicators were calculated for each experiment. The results are shown in Figs. 5 and 6.
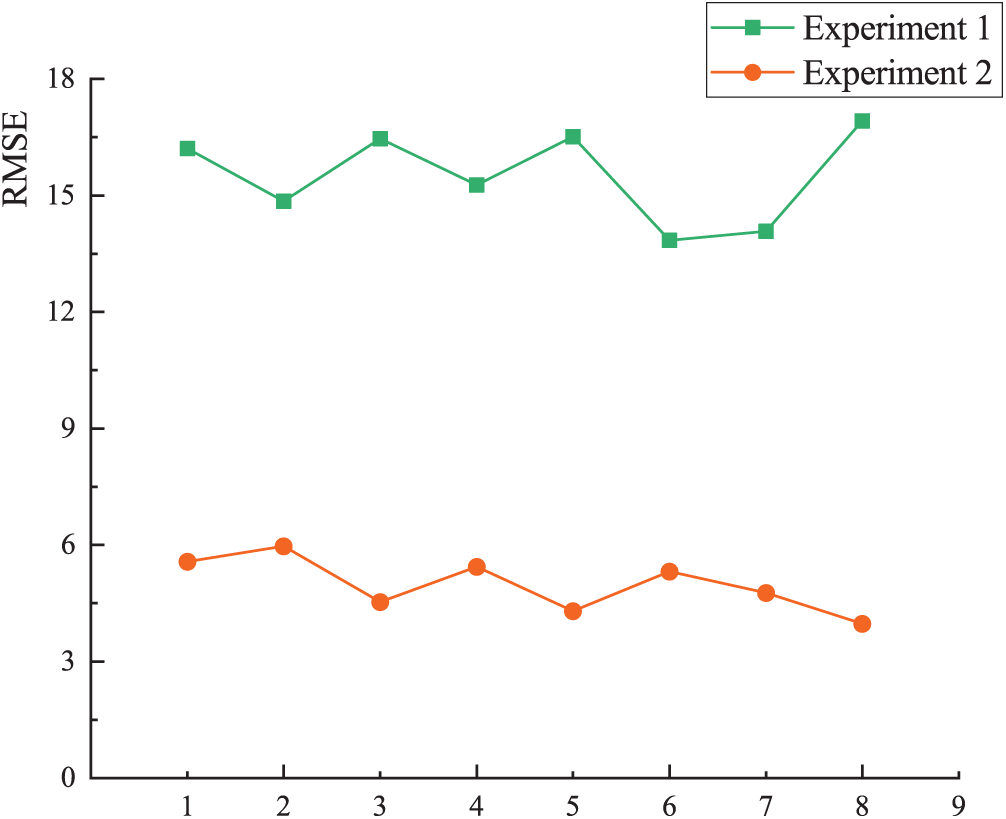
Figure 5: RMSE indicator evaluation results
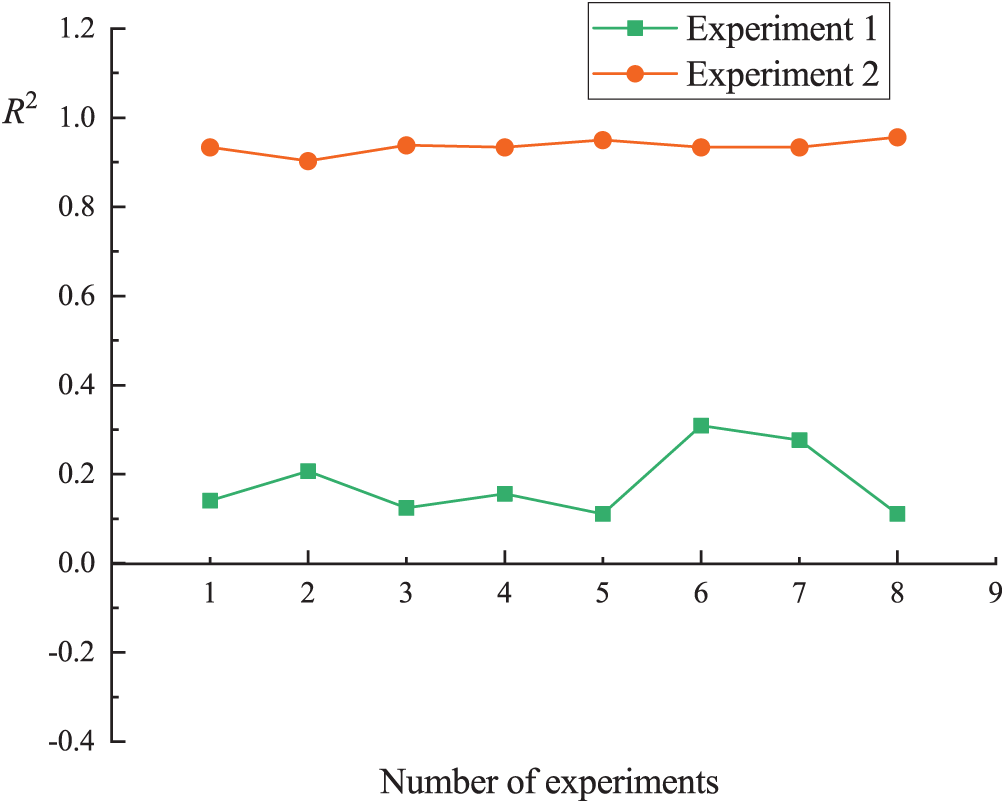
Figure 6: R2 indicator evaluation results
The results of Experiment 1 and Experiment 2 can be compared by the above figure. As can be seen from Fig. 5, most of the RMSE values of Experiment 1 are much higher than Experiment 2, and the results of Experiment 1 varied so much that the maximum value reached 16.92. However, the results of Experiment 2 remain stable between 3.5 and 6.5. As can be seen from Fig. 6, the R2 of Experiment 1 vary so much that some negative values appear. But the R2 of Experiment 2 are always maintained above 0.9. Therefore, according to the results of RMSE and R2, it can be concluded that the FCM–ANN algorithm can accurately predict the tunneling speed of TBM, and the effect is obviously better than the neural network algorithm.
In this paper, we propose the FCM–ANN algorithm for functional data that is difficult to cluster effectively in traditional methods. The FCM–ANN algorithm is based on the FCM algorithm and uses the predicted value of artificial neural network as the clustering prototype to perform the iterative update of the algorithm. We first apply the algorithm to the synthetic datasets and discuss the effects of different number of samples, different number of attributes, and different noise on the clustering results under different membership thresholds. Then the algorithm is applied to the TBM operation data and compared with the method of modeling without clustering. The results show that the FCM–ANN algorithm can accurately and effectively predict tunneling speed. The future work will be mainly focused on replacing existing ANN models with more sophisticated neural network models while improving algorithm theory to make the iterative process more complete.
Funding Statement: This research is supported by the National Key R&D Program of China (Grant Nos. 2018YFB1700704 and 2018YFB1702502) and the Study on the Key Management and Privacy Preservation in VANET, The Innovation Foundation of Science and Technology of Dalian (2018J12GX045).
Conflicts of Interest: We declare that we have no conflicts of interest to report regarding the present research.
1. Jain, A. K., Murty, M. N., Flynn, P. J. (1999). Data clustering: A review. ACM Computing Surveys, 31(3), 264–323. DOI 10.1145/331499.331504. [Google Scholar] [CrossRef]
2. Hamdia, K. M., Arafa, M., Alqedra, M. (2018). Structural damage assessment criteria for reinforced concrete buildings by using a fuzzy analytic hierarchy process. Underground Space, 3(3), 243–249. DOI 10.1016/j.undsp.2018.04.002. [Google Scholar] [CrossRef]
3. Bezdek, J. (1981). Pattern recognition with fuzzy objective function algorithms. New York, NY, USA: Plenum. [Google Scholar]
4. Hathaway, R. J., Bezdek, J. C. (1995). Optimization of clustering criteria by reformulation. IEEE Transactions on Fuzzy Systems, 3(2), 241–245. DOI 10.1109/91.388178.
5. Hathaway, R. J., Bezdek, J. C., Hu, Y. K. (2000). Generalized fuzzy c-means clustering strategies using lp norm distances. IEEE Transactions on Fuzzy Systems, 8(5), 576–582. DOI 10.1109/91.873580. [Google Scholar] [CrossRef]
6. Yu, J., Yang, M. S. (2007). A generalized fuzzy clustering regularization model with optimality tests and model complexity analysis. IEEE Transactions on Fuzzy Systems, 15(5), 904–915. DOI 10.1109/TFUZZ.2006.889957. [Google Scholar] [CrossRef]
7. Zhang, L., Pedrycz, W., Lu, W., Liu, X., Zhang, L. (2014). An interval weighed fuzzy c-means clustering by genetically guided alternating optimization. Expert Systems with Applications, 41(13), 5960–5971. DOI 10.1016/j.eswa.2014.03.042. [Google Scholar] [CrossRef]
8. Askari, S., Montazerin, N., Zarandi, M. H. F., Hakimi, E. (2017). Generalized entropy based possibilistic fuzzy c-means for clustering noisy data and its convergence proof. Neurocomputing, 219, 186–202. DOI 10.1016/j.neucom.2016.09.025. [Google Scholar] [CrossRef]
9. Li, T., Zhang, L., Lu, W., Hou, H., Liu, X. et al. (2017). Interval kernel fuzzy c-means clustering of incomplete data. Neurocomputing, 237, 316–331. DOI 10.1016/j.neucom.2017.01.017. [Google Scholar] [CrossRef]
10. Bezdek, J. C., Anderson, I. M. (1985). An application of the c-varieties clustering algorithms to polygonal curve fitting. IEEE Transactions on Systems Man and Cybernetics, 15(5), 637–641. DOI 10.1109/TSMC.1985.6313440. [Google Scholar] [CrossRef]
11. Dave, R. N. (1990). Fuzzy shell-clustering and application to circle detection in digital images. International Journal of General Systems, 16(4), 343–355. DOI 10.1080/03081079008935087. [Google Scholar] [CrossRef]
12. Mahdipour, H. H. A., Khademi, M., Sadoghi, H. Y. (2012). Model-based fuzzy c-shells clustering. Neural Computing & Applications, 21(S1), S29–S41. DOI 10.1007/s00521-011-0571-0. [Google Scholar] [CrossRef]
13. Dave, R. N. (1992). Generalized fuzzy c-shells clustering and detection of circular and elliptic boundaries. Pattern Recognition, 25(7), 713–721. DOI 10.1016/0031-3203(92)90134-5. [Google Scholar] [CrossRef]
14. Szilagyi, L., Varga, Z. R., Szilagyi, S. M. (2014). Application of the fuzzy-possibilistic product partition in elliptic shell Clustering. In: Torra, V., Narukawa, Y., Endo, Y., (Eds.Modeling decisions for artificial intelligence, Mdai 2014, vol. 8825, pp. 158–169. Lecture Notes in Artificial Intelligence. [Google Scholar]
15. Suh, I., Kim, J., Rhee, F. (1996). Fuzzy clustering involving convex polytopes. 5th IEEE International Conference on Fuzzy Systems (FUZZ-IEEE 96September 08–11, New Orleans, LA. [Google Scholar]
16. Aue, A., Horvath, L., Pellatt, D. F. (2017). Functional generalized autoregressive conditional heteroskedasticity. Journal of Time Series Analysis, 38(1), 3–21. DOI 10.1111/jtsa.12192. [Google Scholar] [CrossRef]
17. Shah, D. A., De Wolf, E. D., Paul, P. A., Madden, L. V. (2019). Functional data analysis of weather variables linked to fusarium head blight epidemics in the united states. Phytopathology, 109(1), 96–110. DOI 10.1094/PHYTO-11-17-0386-R.
18. Curceac, S., Ternynck, C., Ouarda, T. B. M. J., Chebana, F., Niang, S. D. (2019). Short-term air temperature forecasting using nonparametric functional data analysis and sarma models. Environmental Modelling & Software, 111, 394–408. DOI 10.1016/j.envsoft.2018.09.017.
19. Zipunnikov, V., Caffo, B., Yousem, D. M., Davatzikos, C., Schwartz, B. S. et al. (2011). Functional principal component model for high-dimensional brain imaging. Neuroimage, 58(3), 772–784. DOI 10.1016/j.neuroimage.2011.05.085. [Google Scholar] [CrossRef]
20. Zambom, A. Z., Collazos, J. A. A., Dias, R. (2019). Functional data clustering via hypothesis testing k-means. Computational Statistics, 34(2), 527–549. DOI 10.1007/s00180-018-0808-9. [Google Scholar] [CrossRef]
21. Delaigle, A., Hall, P., Tung, P. (2019). Clustering functional data into groups by using projections. Journal of the Royal Statistical Society Series B–-Statistical Methodology, 81(2), 271–304. DOI 10.1111/rssb.12310. [Google Scholar] [CrossRef]
22. Bruckers, L., Molenberghs, G., Dendale, P. (2017). Clustering multiply imputed multivariate high-dimensional longitudinal profiles. Biometrical Journal, 59(5), 998–1015. DOI 10.1002/bimj.201500027. [Google Scholar] [CrossRef]
23. Samaniego, E., Anitescu, C., Goswami, S., Nguyen-Thanh, V. M., Guo, H. et al. (2020). An energy approach to the solution of partial differential equations in computational mechanics via machine learning: Concepts, implementation and applications. Computer Methods in Applied Mechanics and Engineering, 362(SI), 112790.1–112790.29. [Google Scholar]
24. Guo, H., Zhuang, X., Rabczuk, T. (2019). A deep collocation method for the bending analysis of kirchhoff plate. Computers, Materials & Continua, 59(2), 433–456. DOI 10.32604/cmc.2019.06660. [Google Scholar] [CrossRef]
25. Nguyen-Thanh, V. M., Zhuang, X., Rabczuk, T. (2020). A deep energy method for finite deformation hyperelasticity. European Journal of Mechanics A–-Solids, 80, 10384. [Google Scholar]
26. Anitescu, C., Atroshchenko, E., Alajlan, N., Rabczuk, T. (2019). Artificial neural network methods for the solution of second order boundary value problems. Computers, Materials & Continua, 59(1), 345–359. DOI 10.32604/cmc.2019.06641. [Google Scholar] [CrossRef]
27. Yubin, X., Mu, Z., Lin, M. (2009). Hybrid FCM/ANN indoor location method in WLAN environment. IEEE Youth Conference on Information, Computing and Telecommunication, Beijing: Grad Univ. [Google Scholar]
28. Karlik, B., Yuksek, K. (2007). Fuzzy clustering neural networks for real-time odor recognition system. Journal of Automated Methods & Management in Chemistry, 2007(12), 38405. [Google Scholar]
29. Mohd-Safar, N. Z., Ndzi, D., Sanders, D., Noor, H. M., Kamarudin, L. M. (2018). Integration of fuzzy c-means and artificial neural network for short-term localized rainfall forecast in tropical climate. lecture notes in networks and systems. SAI Annual Conference on Areas of Intelligent Systems and Artificial Intelligence and their Applications to the Real World (IntelliSysSeptember 21–22, Vol. 16. London, England. [Google Scholar]
30. Moradi, A. M., Dariane, A. B. (2017). Evolving neural networks and fuzzy clustering for multireservoir operations. Neural Computing & Applications, 28(5), 1149–1162. DOI 10.1007/s00521-015-2130-6. [Google Scholar] [CrossRef]
Appendix A: Statistics of TBM Operation Data
 | This work is licensed under a Creative Commons Attribution 4.0 International License, which permits unrestricted use, distribution, and reproduction in any medium, provided the original work is properly cited. |
 -Means Algorithm