| Computer Modeling in Engineering & Sciences |
DOI: 10.32604/cmes.2021.012111
ARTICLE
Essential Features Preserving Dynamics of Stochastic Dengue Model
1Department of Mathematics and General Sciences, Prince Sultan University, Riyadh, Saudi Arabia
2Department of Medical Research, China Medical University Hospital, China Medical University, Taichung, 40402, Taiwan
3Department of Mathematics, Hashemite University, Zarqa, Jordan
4Stochastic Analysis & Optimization Research Group, Department of Mathematics, Air University, Islamabad, 44000, Pakistan
5Department of Mathematics, National College of Business Administration and Economics, Lahore, Pakistan
6Department of Mathematics, Faculty of Sciences, University of Central Punjab, Lahore, 54500, Pakistan
7Department of Mathematics, Comsats University Islamabad, Islamabad, Pakistan
8Department of Mathematics, Uppsala University, Uppsala, Sweden
*Corresponding Author: Ali Raza. Email: Alimustasamcheema@gmail.com
Received: 15 June 2020; Accepted: 15 September 2020
Abstract: Nonlinear stochastic modelling plays an important character in the different fields of sciences such as environmental, material, engineering, chemistry, physics, biomedical engineering, and many more. In the current study, we studied the computational dynamics of the stochastic dengue model with the real material of the model. Positivity, boundedness, and dynamical consistency are essential features of stochastic modelling. Our focus is to design the computational method which preserves essential features of the model. The stochastic non-standard finite difference technique is most efficient as compared to other techniques used in literature. Analysis and comparison were explored in favour of convergence. Also, we address the comparison between the stochastic and deterministic models.
Keywords: Dengue model; stochastic ordinary differential equations; numerical methods; convergence of the proposed method
Dengue disease was first described in 1780 when dengue cases are observed in the Philadelphia epidemic (Rush 1789). In 1906, dengue transmission was established by the Aedes mosquito. In 1953, dengue hemorrhagic was first apprehend in the Philippines and 1955 it was recognized in Thailand. Dengue virus is one of the most common viruses. Four dengue (DENV-1 to DENV-4) serotypes viruses that can spread to feminine mosquitoes causes dengue fever (DF). A DENV serotype induces permanent immunity to serotypes but only partial temporary immunity to three different serotypes. Annually there are about 390 million dengue infections, of which 96 million are registered on a clinical basis (any severity of the disease). DENV infection is at risk for 128 countries. This is because of a mosquito-borne virus. A mosquito bites a human and repeats this process to another human, and this cycle continues. The rainy season is a suitable season for this virus [1]. Virus serotypes cause the disease (DENV 1 to 4) not all of these were exposed at the same time. DENV 1 and 2 were exposed in 1960 [2]. The DENV-3 strain of dengue was exposed in 1961, while DENV-4 was discovered in 1963. The disease was restricted in the middle of the 20th century. The fifty million dengue infections have been reported globally by the world health organization and 2.5 million people face the illness. Dengue virus can change into (DHF) and (DSS). The patient suffers from bleeding and plasma leakage in DHF. Whereas, in (DSS) the patient suffers from low blood pressure at a dangerous level. The dengue virus is incurable. No medicine is discovered to cure this disease permanently. It is the only way to overcome its spreading sources, namely water storage in car pipes used in containers and other sources that can store rainwater. Aedes virus bites its prey two times a day in the morning and also in the evening. It is an old virus which was at first found in china in 610 AD and then in 922 AD. It was multiplied in the 18th and 19th centuries. It was first isolated in Japan in 1943 and 1944 in Calcutta, an Indian city. Before 1980, Africa was the only region that was unknown from this virus, but in 1997 the virus disturbed the tropical and subtropical areas of the world [3]. For the past couple of years, many authors have contributed to the development of mathematical dengue disease modelling. In order to model dynamics and to determine the efficacy or cost efficiency of behaviour, mathematical simulations were used. Some models were compartmental, usually suggesting that the mosquito bites of humans are universally mixed, i.e., every mosquito can bite every host with the same probability. However, this concept contrasts with actual epidemics that are heterogeneous at multiple levels: Geographic heterogeneity and heterogeneity in individuals. In particular, environmental and ecological change has influenced spatial heterogeneity leading to poorly coupled host mosquito encounters. In particular, the contact to mosquito bites was due to the heterogeneous nature of hosts, such as their proximity to aquatically immature mosquito habitats, their house type, their use of insecticides, human movement, and so on. Heterogeneous heterogeneity was characterized by some mosquitoes to have more muzzle than other mosquitoes, correlated with, among others, sex, age, height, pregnancy, protective behaviour, type of blood and human odour variability. The effects of heterogeneity on transmission dynamics have already been discussed with metapopulation models and agent-based models. This subject, however, is still more important. Nevai et al. have used a negative binomial distribution (NBD) approach in order to investigate the heterogeneity rates of Middle East respiratory coronavirus transmission in South Korea by 2015 and have found considerable potential for over-spreading. The NBD was widely used for representing count data, particularly for data with excessive dispersion. In biology literature, NBD was used to investigate the effect of transmission heterogeneity, including heterogeneity, in various transmission dynamic models [4]. It was beneficial to forecast dengue, malaria, and chikungunya spatial time dynamics as a result of this integrated approach [5]. A multi-strain dengue model involving four equilibrium points was proposed by authors. The effects of reinfection with the same serotype on transmission dynamics of dengue were discussed in that mathematical model [6]. Tay constructed a secondary dengue infection model involving two human populations named as seropositive and seronegative [7,8]. The ratio of these two serotypes was calculated. This ratio could be used as a helping tool in vaccination programs. In 2018 a human and vector population-based SIR dengue model was proposed by the authors [9,10]. The impacts of vaccination on transmission of dengue were taken into account. Routh–Hurwitz criteria were utilized to explore the stability of the system. Three strategies named mechanical control, chemical control and vaccination were suggested to eradicate the dengue disease. However, only vaccination was found to be a more authentic tool for elimination presented in [11–14]. In recent years, many studies have been conducted for essential features preserving analysis of well-known stochastic epidemic models. Raza et al. [15] investigated the structure preserving analysis of the stochastic meme epidemic model. In which, analyzed the randomness of the rumours in social life. Abodayeh et al. [16] studied the dynamics of the stochastic vector borne plant disease, in which how the plant population may infect insects. Secondly, the numerical analysis of the effect of alcohol with gonorrhea disease in the human population [17]. Thirdly, the stochastic analysis of foot and mouth disease dynamics is investigated in the animal population [18]. The authors discussed a dengue transmission model derived from nonlinear fractional-order differential equations. Mathematically modelling has come forward as an efficient tool to extract in the right about diseases. Usually, the determination of the stochastic differential equation is difficult and does not have closed-form solutions. We used different numerical techniques for this purpose. A natural question about these: Does any numerical scheme reserve the system’s dynamic properties? Our emphasis is on proposing a stochastic non-standard SNSFD (finite difference technique) for this model, and this paper’s game plan is as follows. In Section 2, we discussed the deterministic model and its equilibrium points. In Section 3, we explore the stochastic dengue model and introduce different techniques and also compare their results which deterministic solutions. In the final section, we come to a conclusion and suggest future guidelines.
A GBM or (otherwise called exponential Brownian motion) is a ceaseless time stochastic procedure wherein the logarithm of the haphazardly fluctuating amount pursues a Brownian movement (additionally known as Wiener procedure) with the float. It is a significant cause of stochastic procedures fulfilling a stochastic differential condition (SDE). Specifically, it is utilized in the scientific fund to show stock costs operating at a profit Scholes model [19]. A Geometric Brownian movement X(t) is the arrangement of an SDE with straight float and dispersion coefficients.

with initial values  .
.
In this section, we considered the dynamics of the deterministic model, as presented in [20]. For any time  , the susceptible humans are detailed as
  , the asymptomatic infected humans are detailed as
  , the symptomatic infected humans are detailed as
  ,
,  individual treated humans,
  represent the humans who fail treatment,
  shows the amount of disposed of mosquitoes,
  represent visible mosquitoes and
  shows the quantity of quick-spreading mosquitoes. The transmission flow is modelled in Fig. 1.
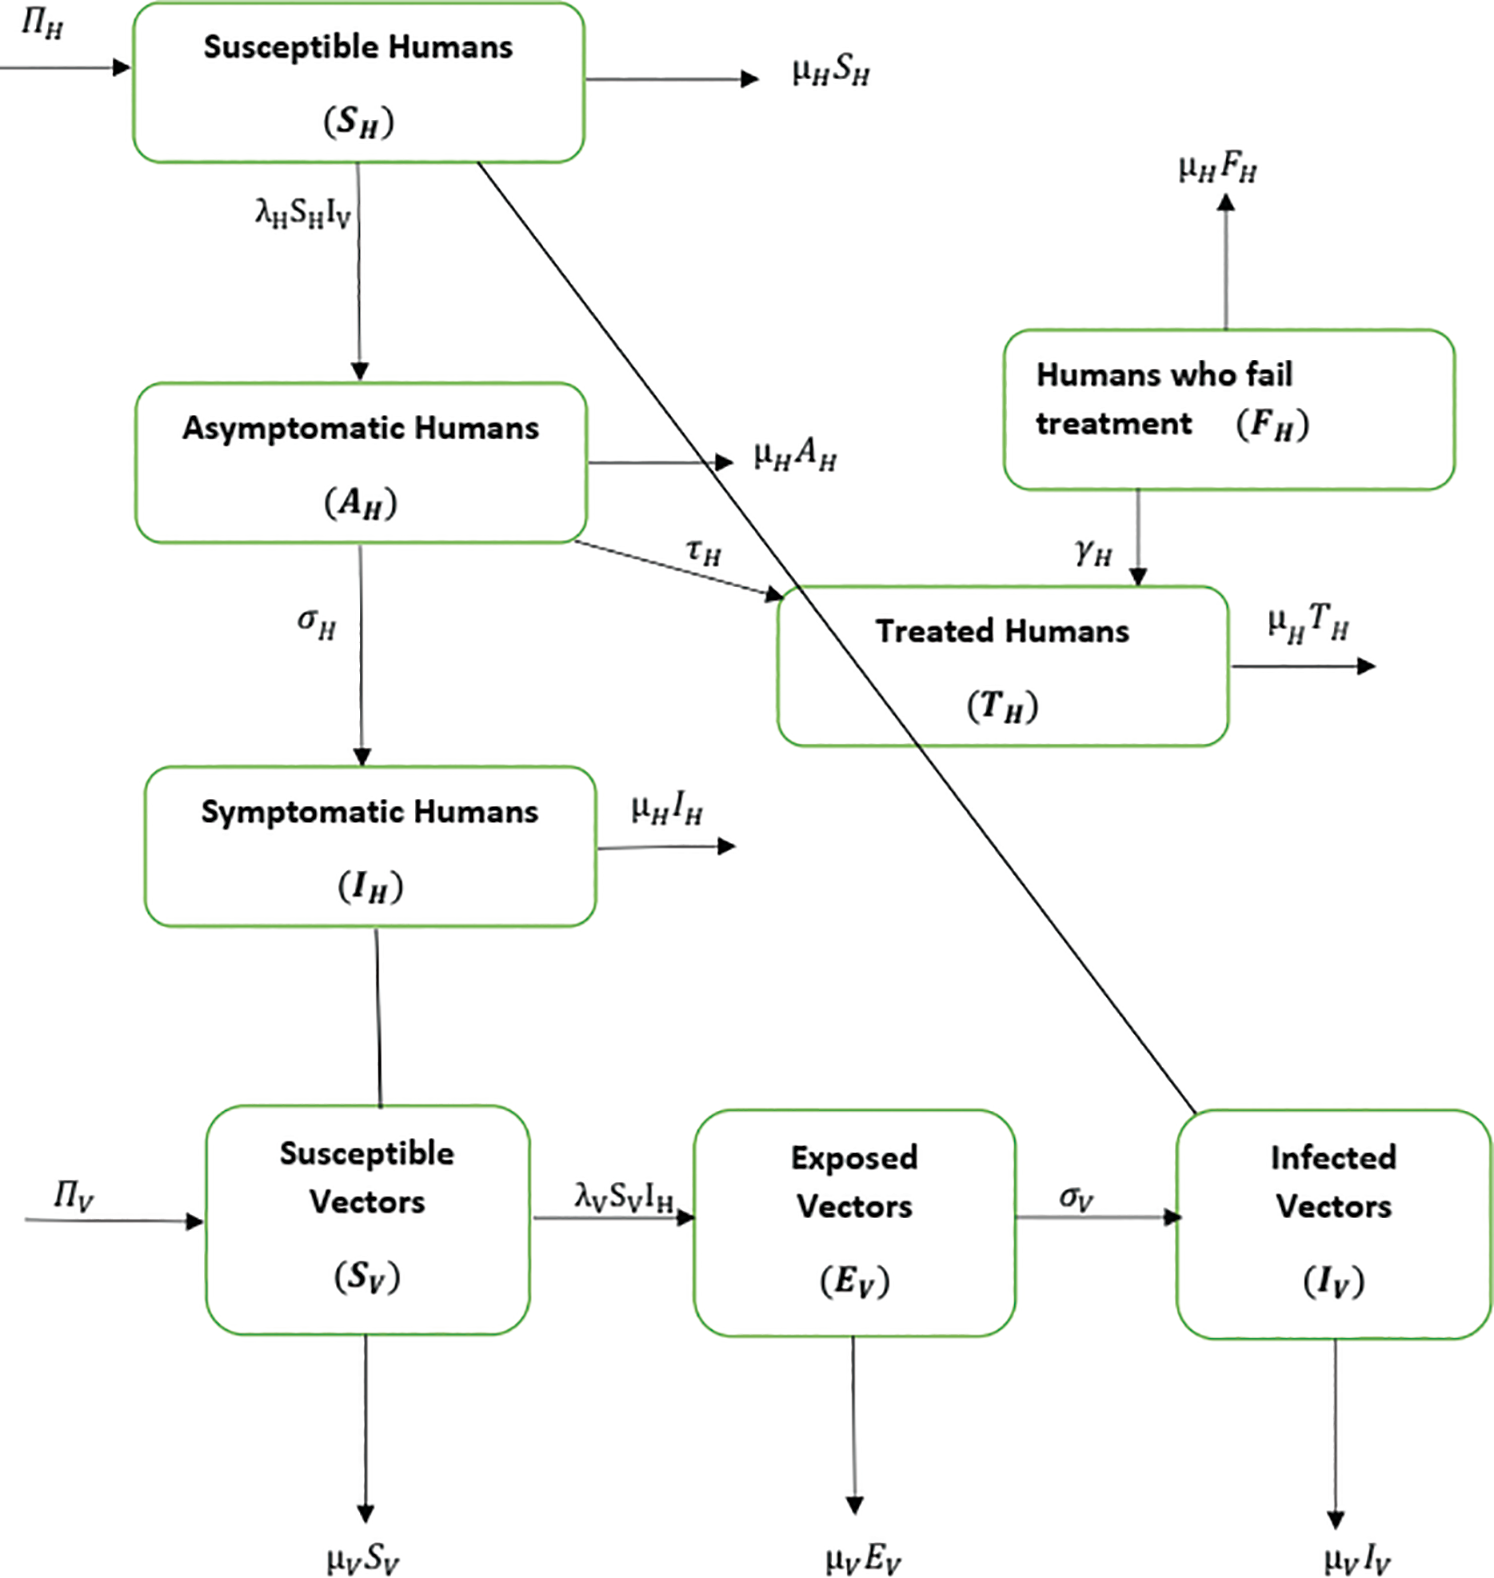
Figure 1: Flow of material from the vector population to the human population
The transmission rates are explained as  (denotes the rate at which the person infected),
  (the rate at which mosquitoes infected),
  (denotes natural death rate of mosquitoes),
  (denotes the natural death rate of persons),
  (represented the rate of infection of mosquitoes),
  (represented the new recruitment of the humans),
  (represented the new recruitment of the mosquitoes),
  (probability of transmission AH to IH classes),
  (probability of transmission IV to EV classes),
  (represented the mortality rate of humans),
  (represented the mortality rate of the mosquitoes),
  (represented the rate of vaccination of the humans),
  (represented the rate of unsuccessful vaccination). The nonlinear equations of the model as follows:


therefore, 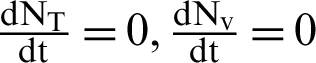 .
.
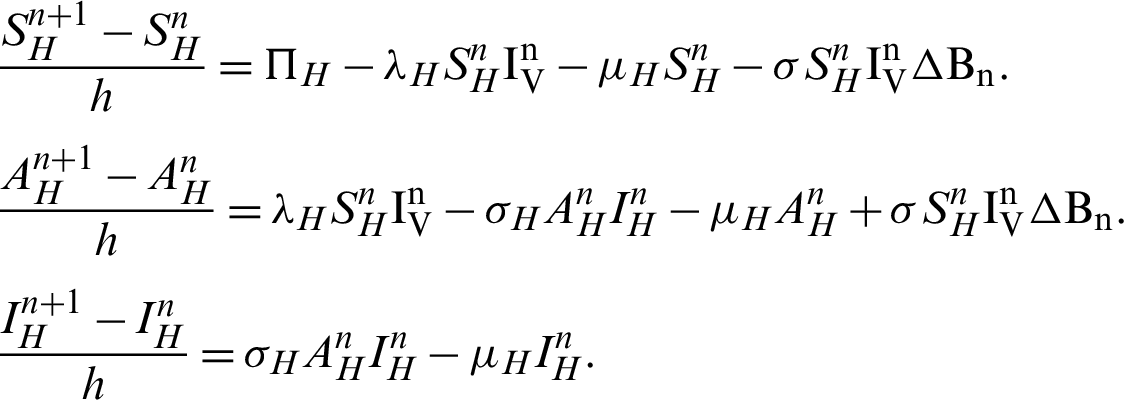
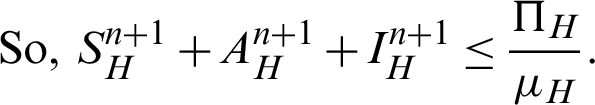
The stabilized form of model (2)–(9) is as follows:


There are two regions for the system (12)–(17) like humans population and vector population are  and
and  respectively. These given regions are bounded and closed. The solution of system (12)–(17) lie in the same regions. So, these given regions are also called the non-negative invariant region.
3.1 Equilibria of the Material
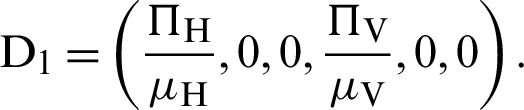
The equilibria of system (12)–(17) can be classified into two ways under as Disease-free equilibrium is
Endemic equilibrium is
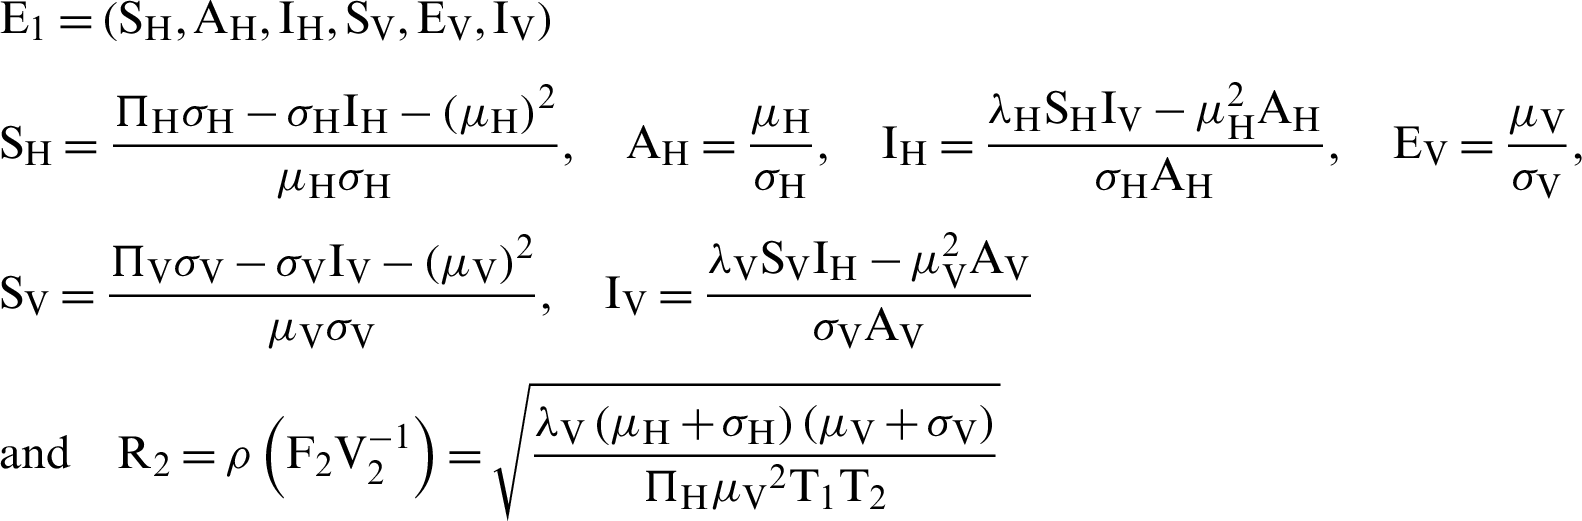
where  . Note that
  is the threshold number of the model (12)–(17).
The construction of a stochastic material of the model from the deterministic model has presented in [21]. For this, we shall substitute in the model (12)–(17) as follows:
Put 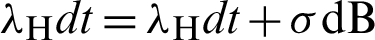 and
and 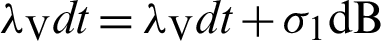 .
.


where “B” is the geometric Brownian motion.
This scheme is constructed for the model (18)–(23) as follows:


where ‘ ’ is the time parameter. The solution of the deterministic model for the DFE, i.e.,
 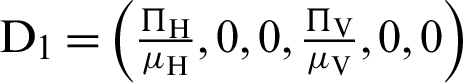 and the reproduction number
  1 means help us these procedures to switch the dengue virus. The EE, i.e.,
  and the reproduction number
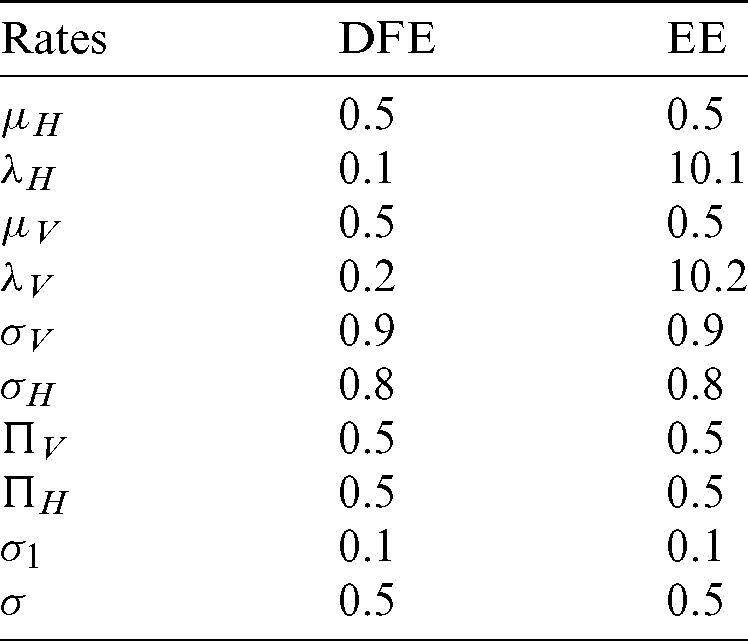
  1 means dengue is endemic. We are simulating the solution of this technique by using parameters values prearranged in [20] and see Tab. 1.
Table 1: Rates of the material of the model
4.2 Stochastic Runge–Kutta Method
The pseudo-code for stochastic Runge Kutta for the system (18)–(23) is as follows:
Begin:
Declare all constants
Set the step size ‘h’
Declare arrays for  . The arrays should be able to store 2000 values.
Put initial values for  at index 1 of the corresponding arrays.
For t from 0.1 till t < 200
Calculate stage 1 equations
Calculate stage 2 equations
Calculate stage 3 equations
Calculate stage 4 equations
Calculate final stage equations
t = t + 0.1
End For
Plot required data
end program
We make the simulation of discussed technique by using parameters values prearranged in [20] and see Tab. 1.
This scheme is constructed for the model (18)–(23) as follows:


We make the simulation of the above-discussed technique by using parameters values prearranged in [20] and see Tab. 1.
For this, we shall satisfy the following theorems as follows:
Theorem 1: Forgiven initial values ( )
) 
 and (
and ( )
) 
 for the system (30)–(35) has a unique positive solutions (
 )
) 
 and (
and ( )
) 
 , respectively for all n
  0.
0.
Proof: Since all rates and state variables of the system are non-negative. So, the proof is straightforward.
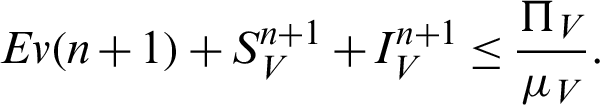
Theorem 2: These regions  and
and  for all
  0 are the positive invariant set for the system (31)–(35).
Proof: Now, we rewrite the system (30)–(32) as follows:
Also, we rewrite the system (33)–(35) as follows:
More precisely,
Theorem 3: For given  , the eigenvalue of the system (30)–(35) lies in the semi-circle.
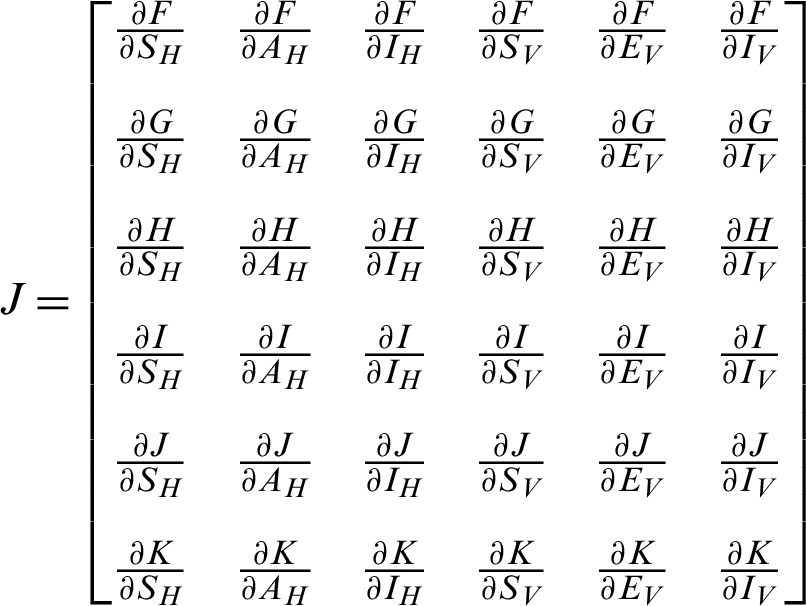
Proof: Considering the functions F, G, H, I, J and K from the system (30)–(35) as follows:
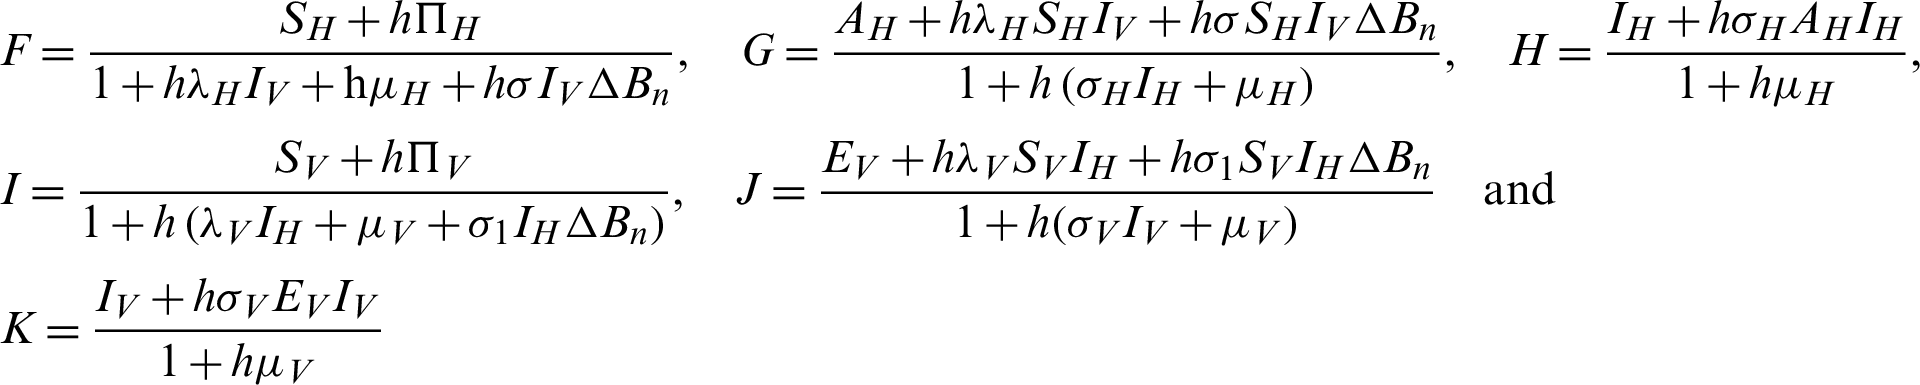
The Jacobi matrix J as
By simplify, we get the following eigenvalues as follows:
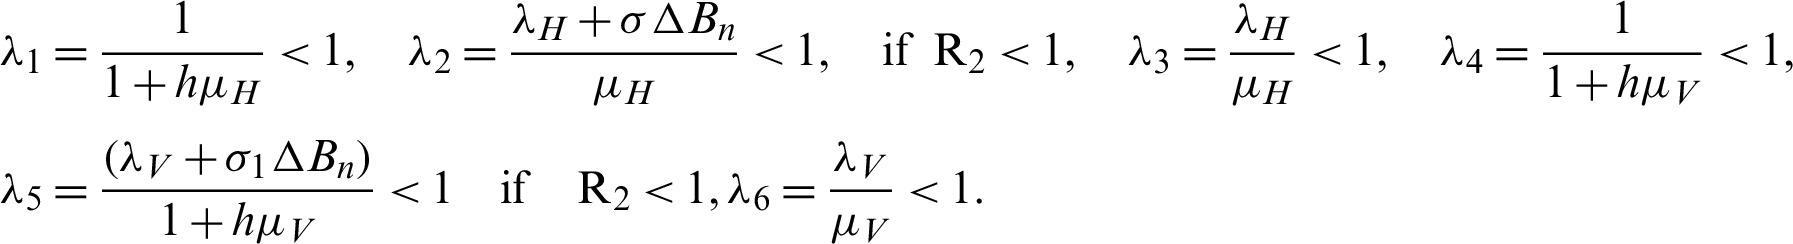
Thus, the system is stable at the rates of the material of the model.
In this part, we are going to discuss the comparison of existing stochastic techniques and proposed technique as follows:
The correlation coefficient has obtained among the compartments of the model, and results are described in Tab. 2.
Table 2: Covariance coefficient
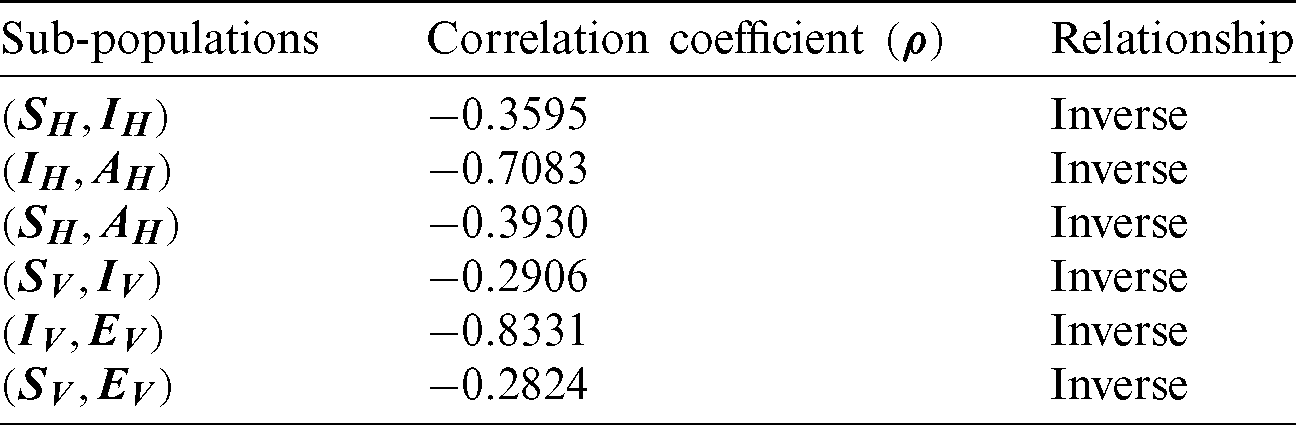
Tab. 2 exhibits that susceptible humans have an inverse relation with other components of the model. It is concluded that the decreases in the other components of the model prove the disease-free state for both populations of the model.
Fig. 2, exhibits the solution of the stochastic Euler method for different discretization values of the parameters, and lose the essential features for  , as desired. In Fig. 3, we can observe that the stochastic Runge–Kutta method meets equilibria for step size
  and lose the essential features. In Fig. 4, we can observe that the stochastic NSFD technique meets for both equilibria for any value of the parameters. In a stochastic context, we have concluded that this method preserves all the essential features presented in [22]. In Fig. 5, we have presented a comparative analysis of both types of modelling. In Fig. 6, the 3D phase plots have presented with the comparison of the computational methods.
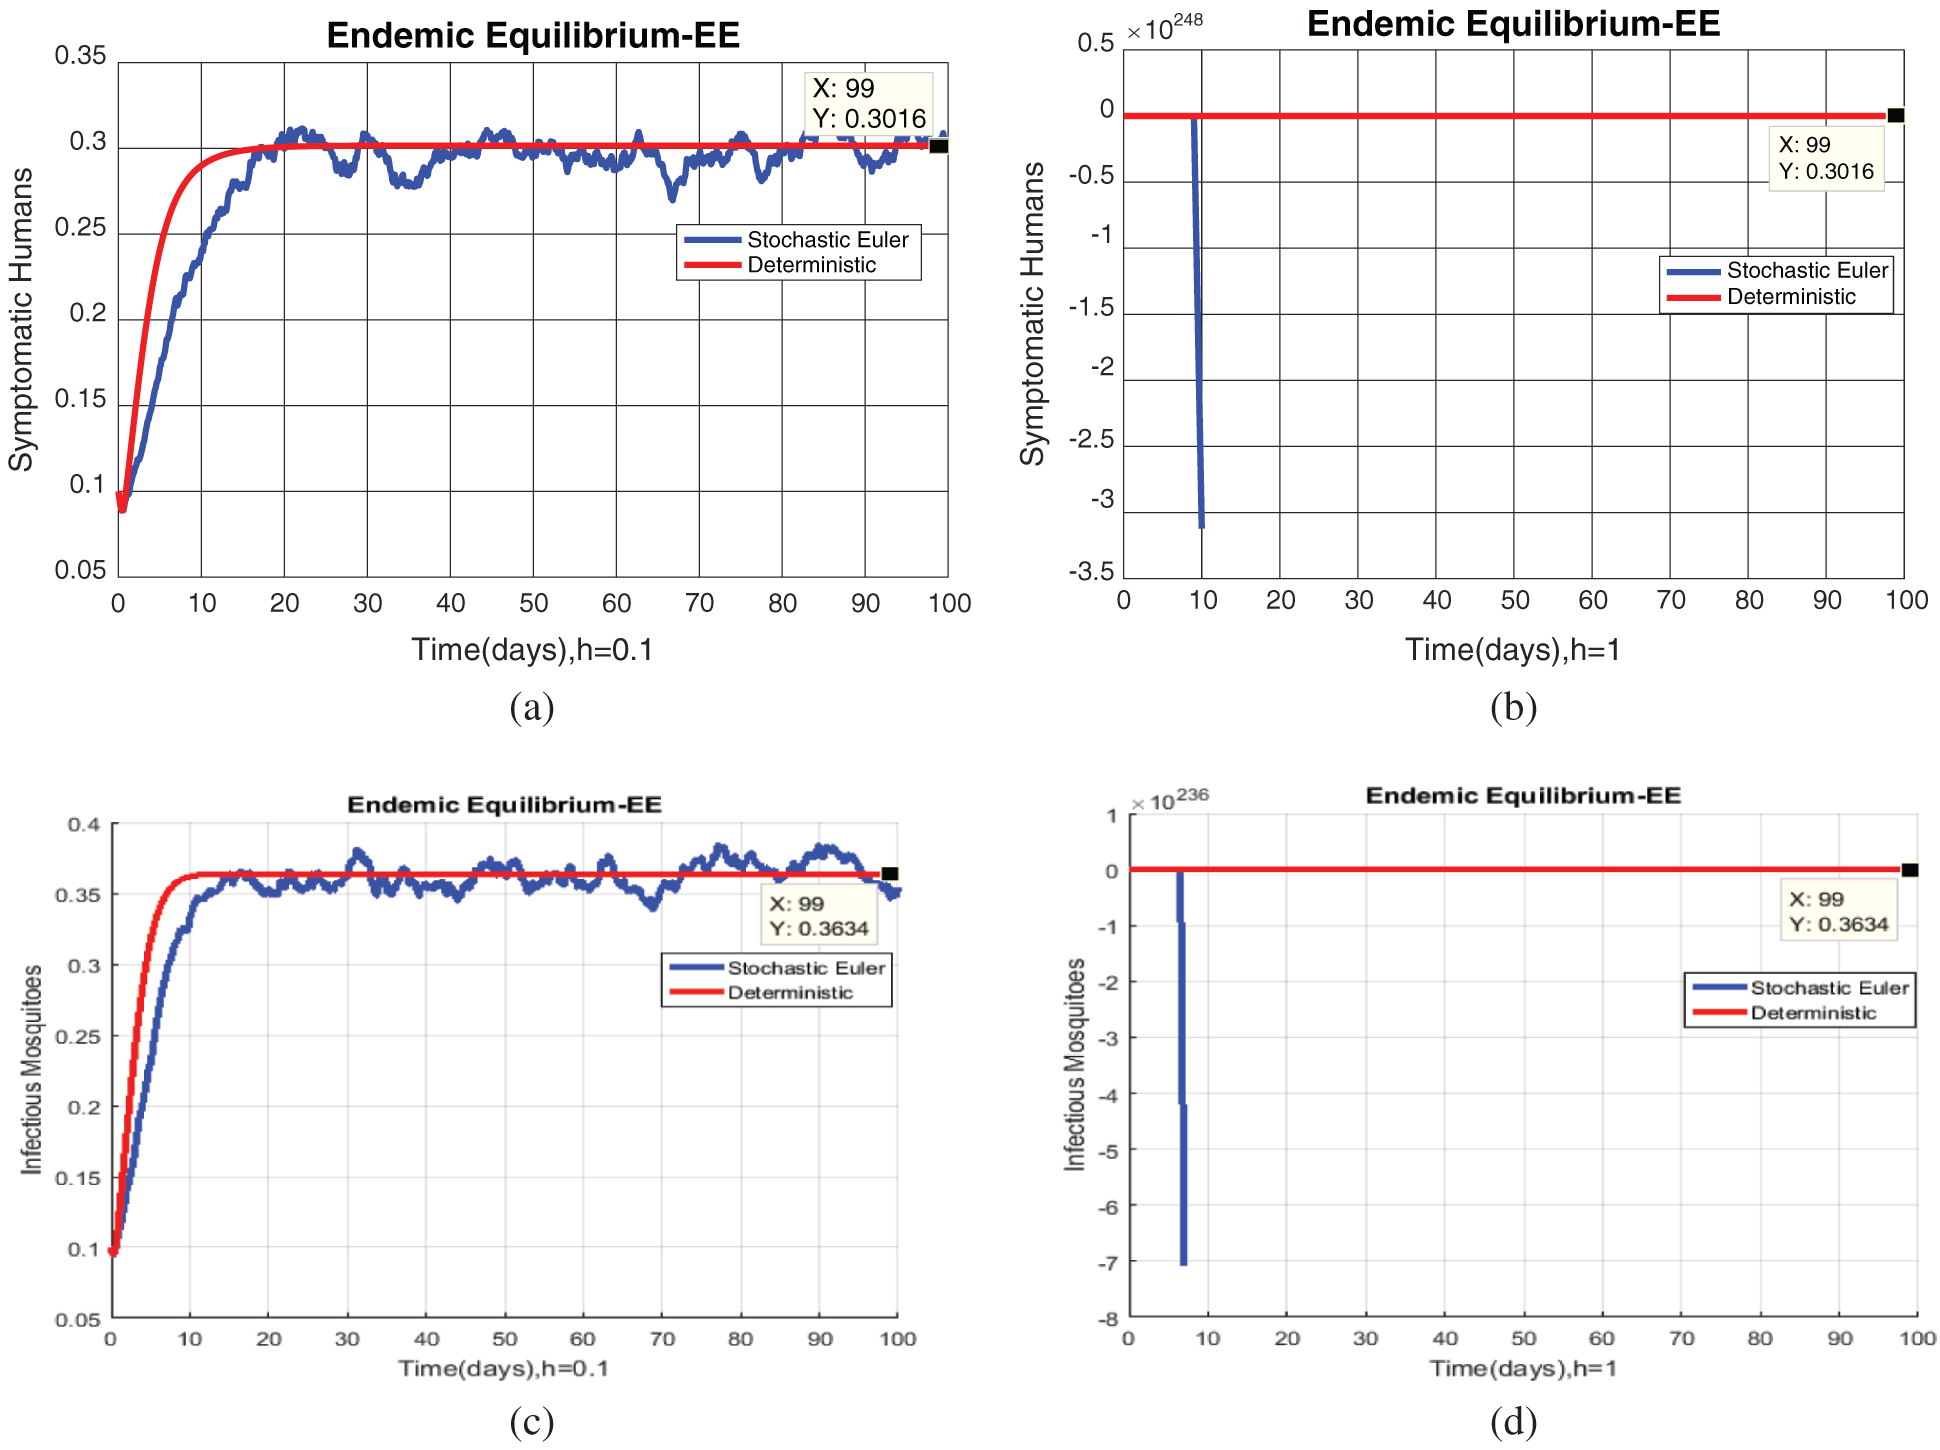
Figure 2: (a) Symptomatic humans at  (b) symptomatic humans at
  (c) infected mosquitoes’ section at
  (d) infected mosquitoes’ section at
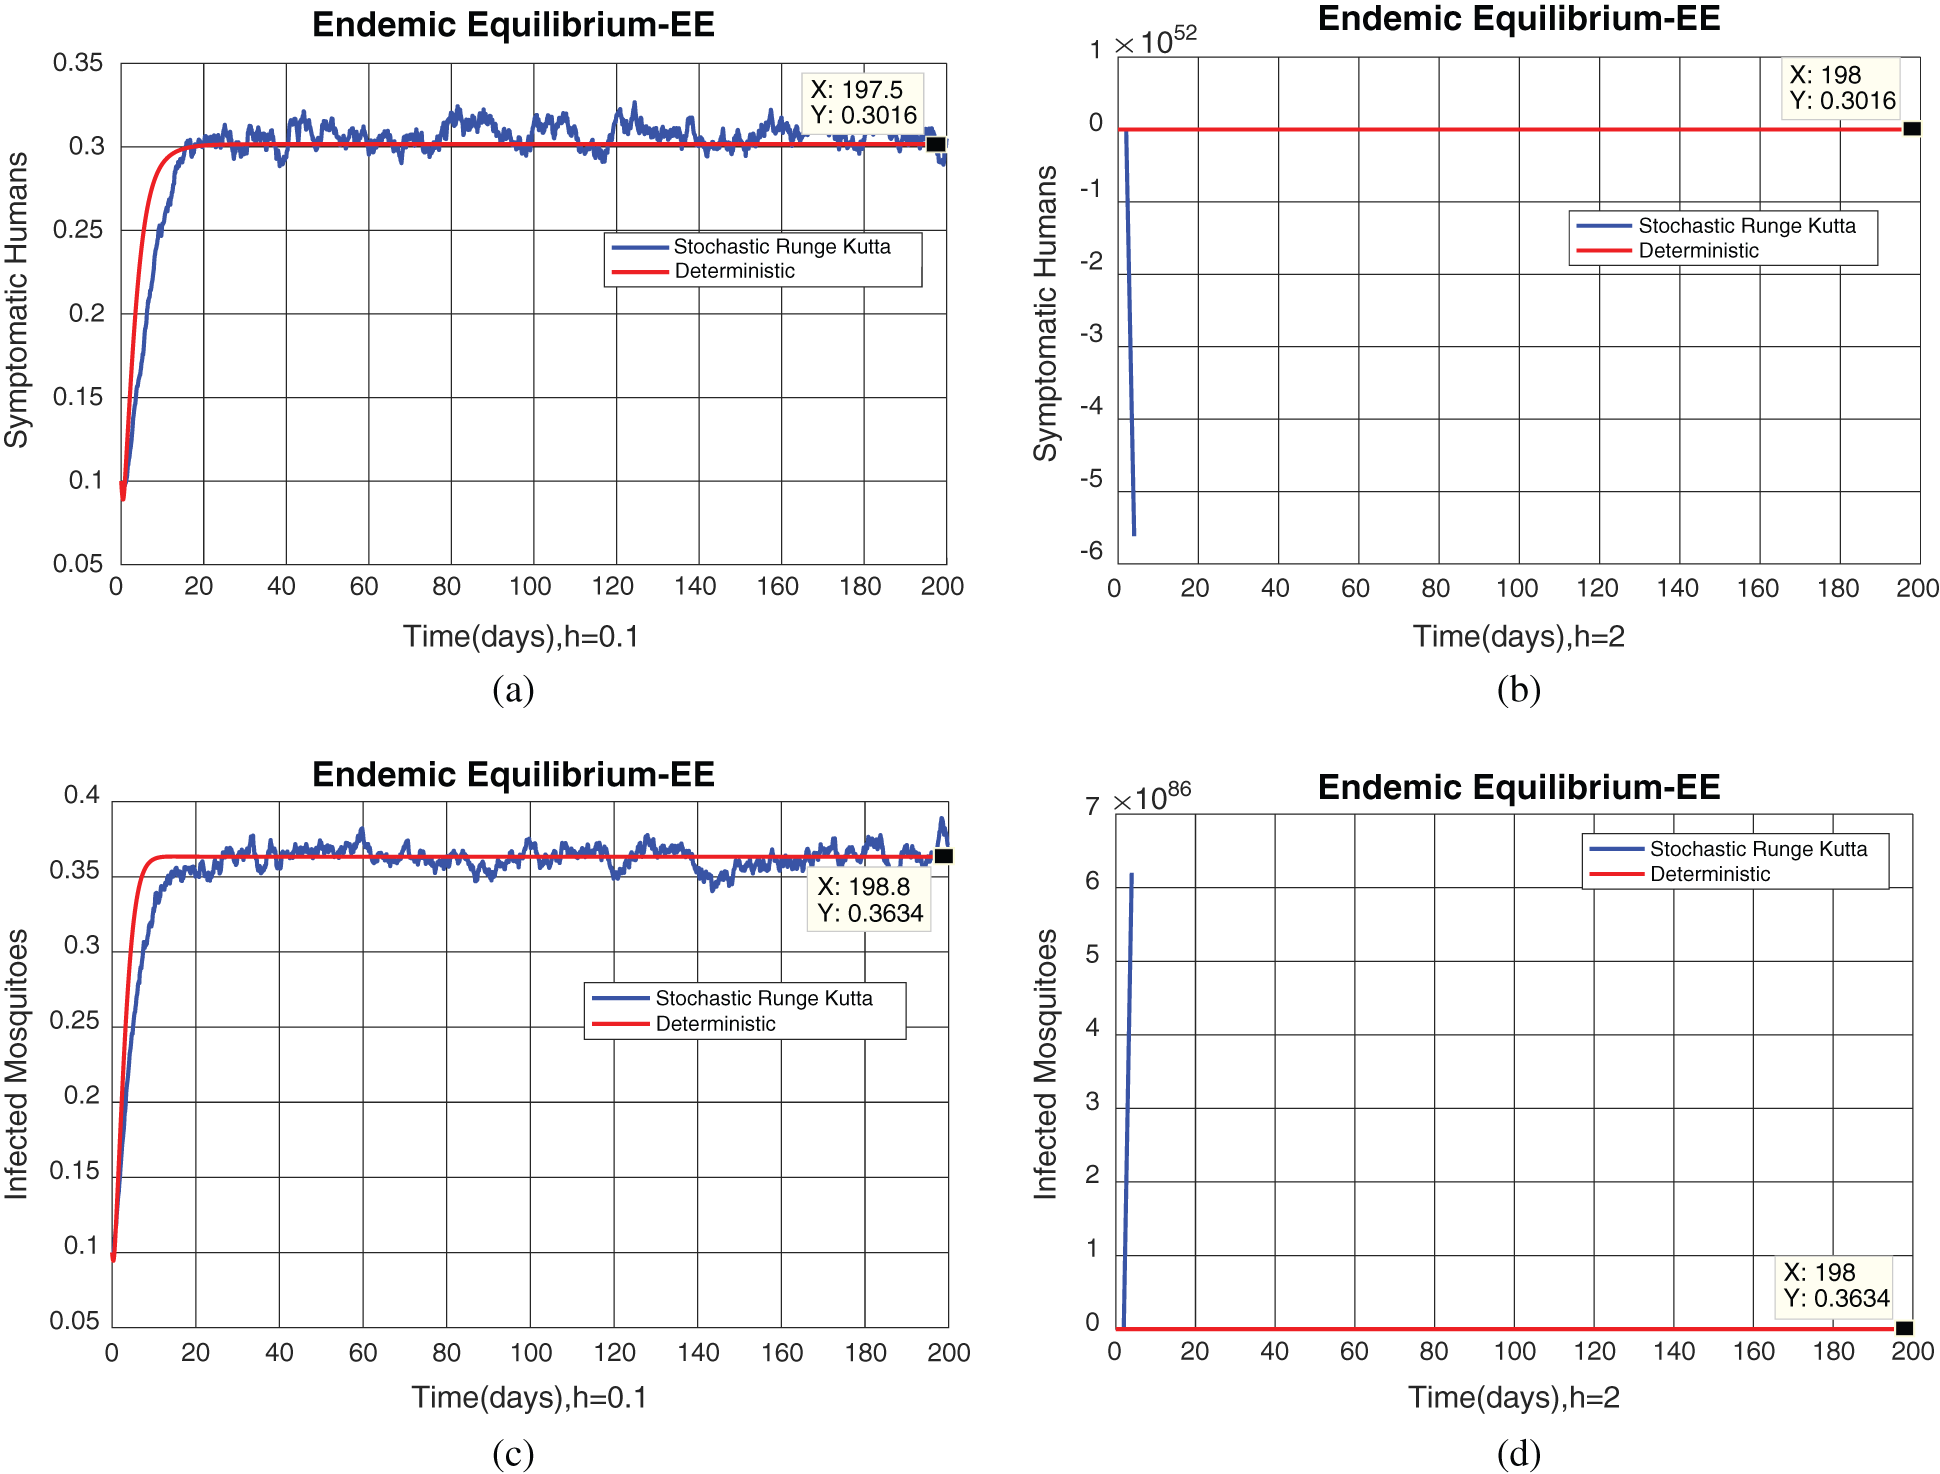
Figure 3: (a) Symptomatic humans section at  (b) symptomatic humans section at
  (c) infected mosquitoes section at
  (d) infected mosquitoes section at
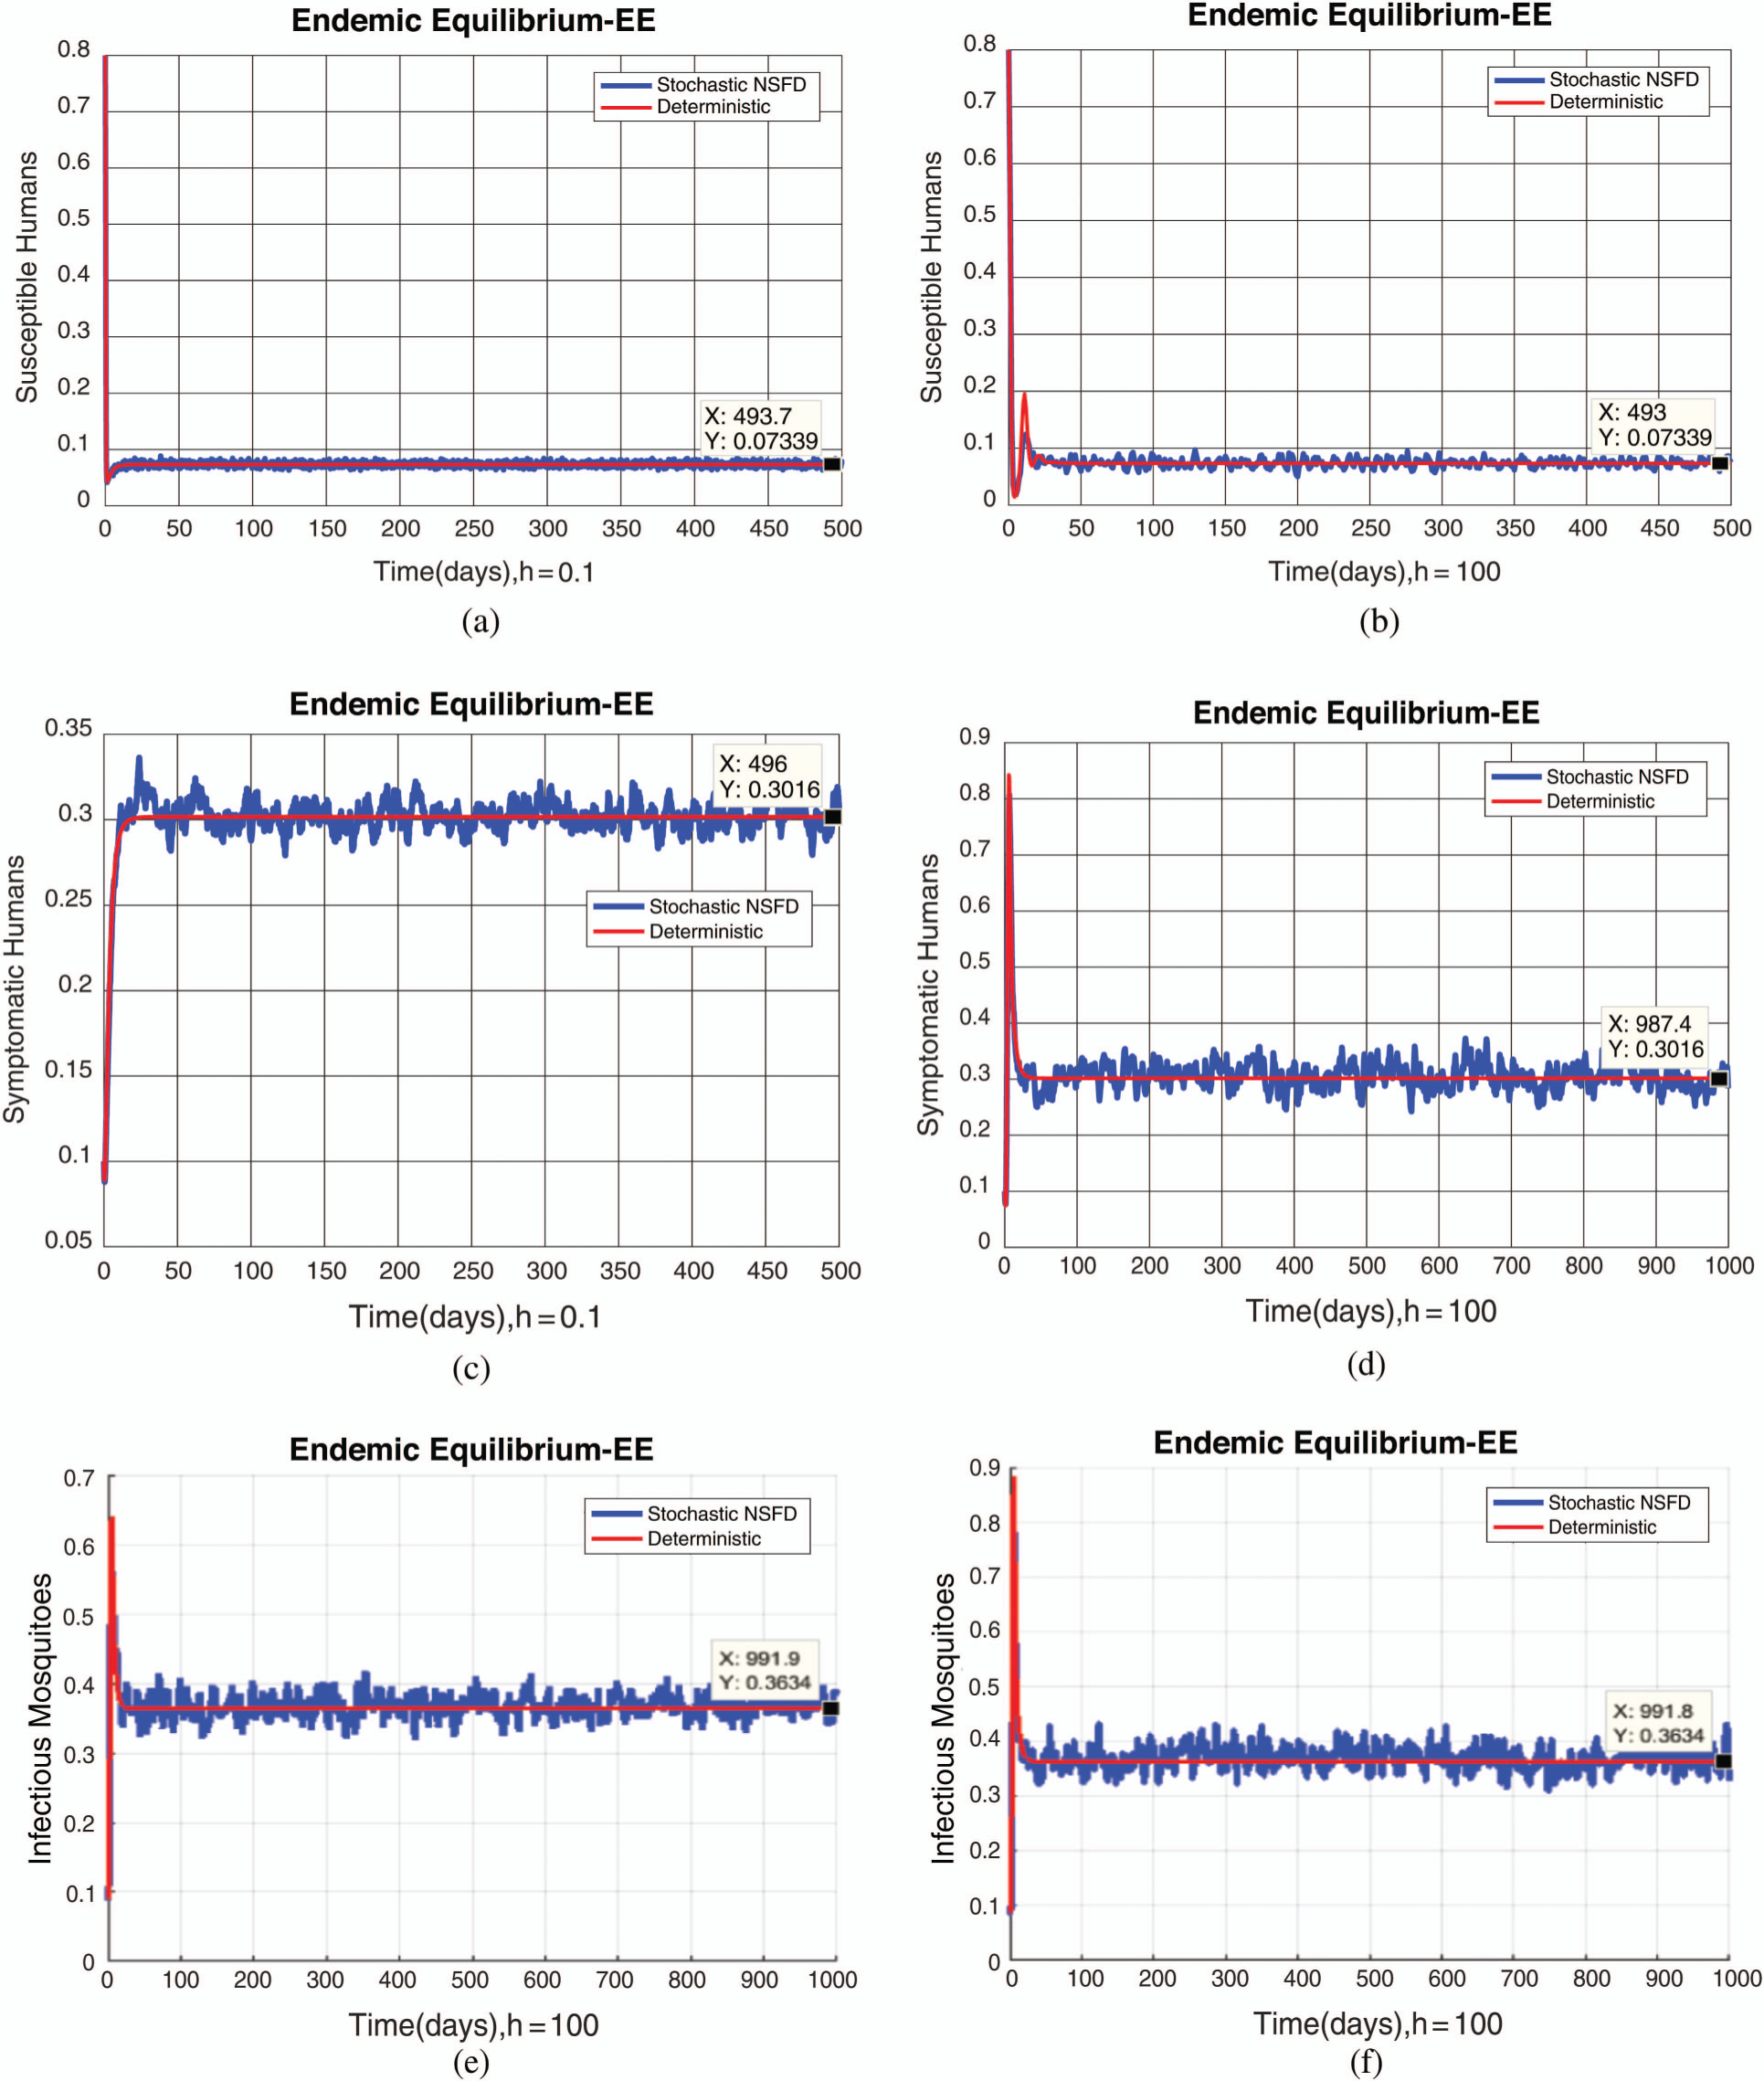
Figure 4: (a) Susceptible humans at  (b) susceptible humans at
  (c) symptomatic humans at
  (d) symptomatic humans at
  (e) infected mosquitoes at
  (f) infected mosquitoes at
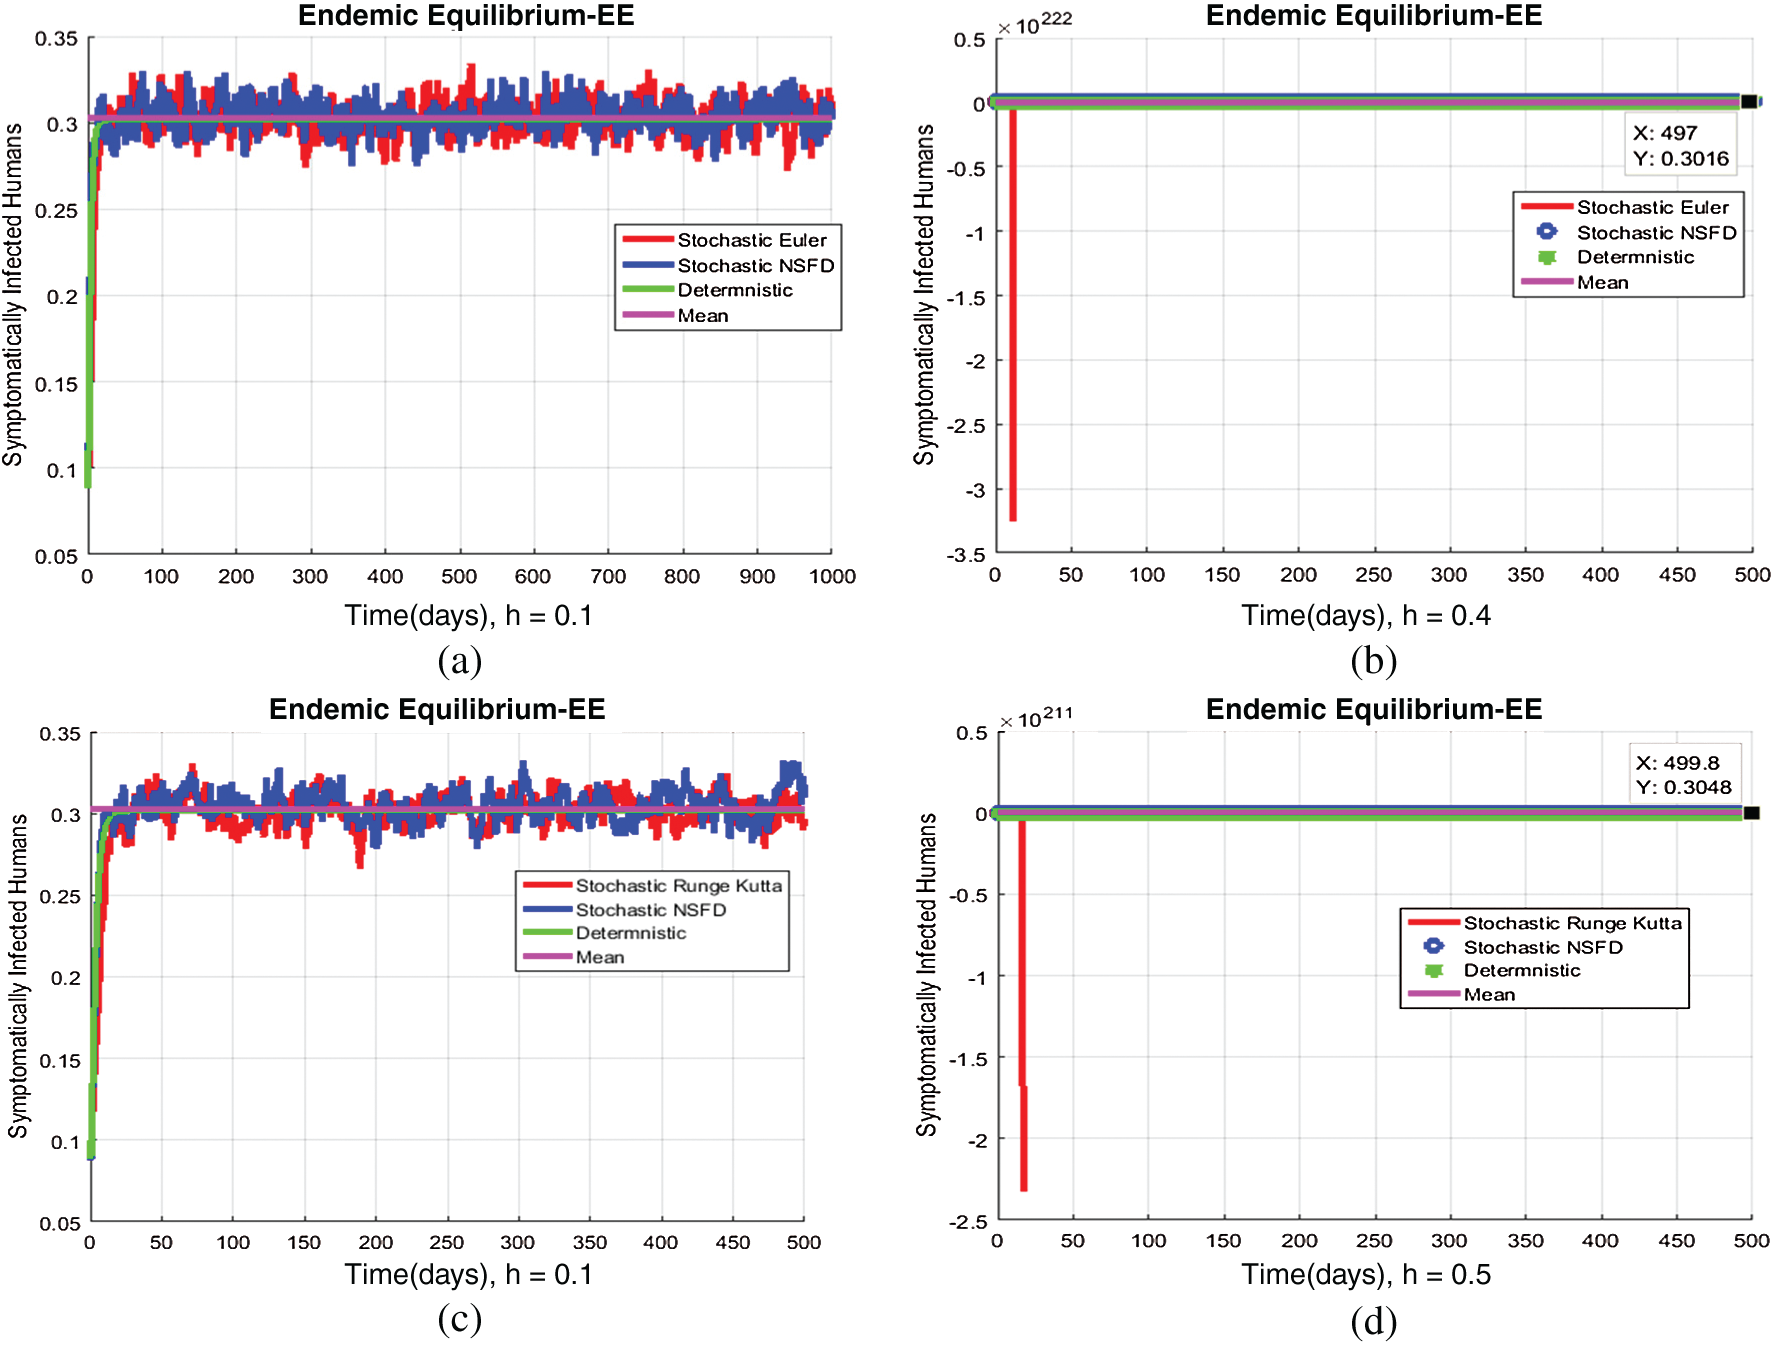
Figure 5: (a) Symptomatic infected individuals’ section at  (b) symptomatic infected individuals’ section at
  (c) symptomatic infected individuals’ section at
  (d) symptomatic infected individuals’ section at
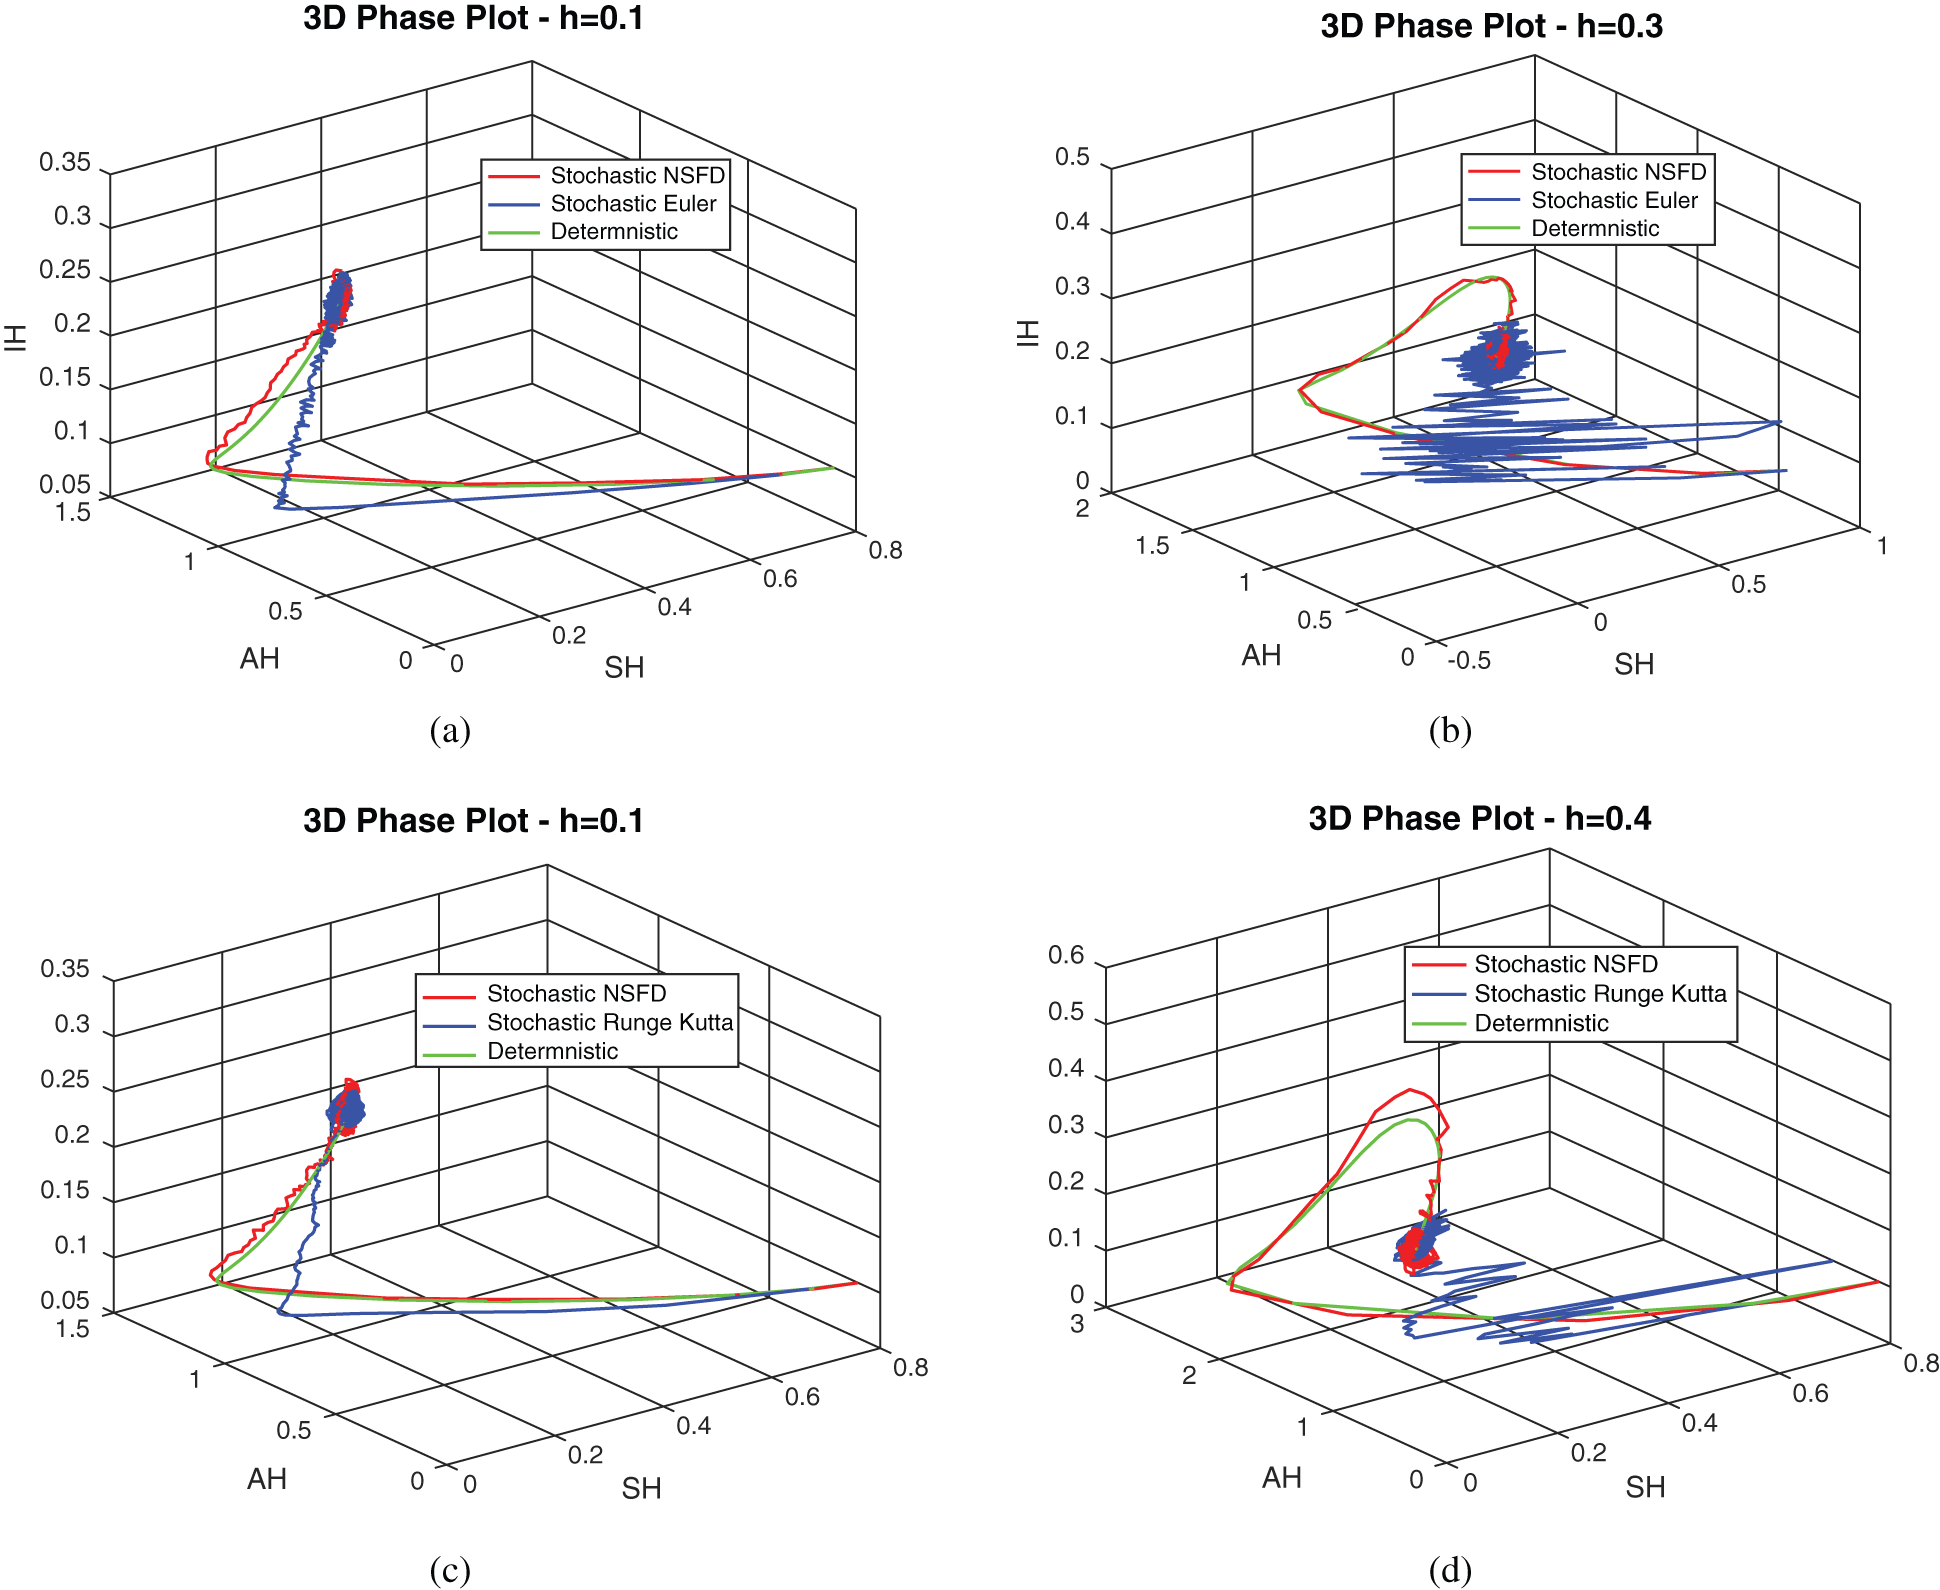
Figure 6: 3D phase plots using stochastic NSFD scheme in comparison with stochastic Euler and stochastic Runge–Kutta methods
6 Conclusion and Future Directions
In this study, we must claim the most effective and real stochastic analysis in comparison with the deterministic analysis of the model. Also, the construction of the stochastic model has presented with the rates of the material of the model. Unfortunately, numerical research is presented in all disciplines of science because of the non-differentiability of Brown’s motion. The standard stochastic methods employed here were the usual stochastic Euler method and the fourth-order stochastic Runge–Kutta method. Numerical properties of those methods are well known like positivity, boundedness and dynamical consistency. Various simulations were produced using different step sizes, and comparisons were shown graphically. The results showed that the methodology proposed in this work is capable of preserving the essential features of the relevant solutions of the mathematical model, as expected. On the other hand, the graphical results showed that the standard methods were not able to guarantee the preservation of some of those essential features. In particular, we proved computationally that those standard stochastic methods are incapable of preserving the essential features of the model, as desired. In that sense, the stochastic NSFD method designed in this work is a more reliable technique. Moreover, we shall extend our work in all discipline as bio-economics, biophysics, biochemistry, and many more sub-branches of material sciences. Also, the given essential features preserving analysis could be extended in the fractional-order models [23,24].
Acknowledgement: We always warmly thanks to anonymous referees. We are also grateful to Vice-Chancellor, Air University, Islamabad, for providing an excellent research environment and facilities. The first author is also thankful to Prince Sultan University for funding this work.
Funding Statement: This research project is funded by the Research and initiative centre RG-DES2017-01-17, Prince Sultan University.
Conflicts of Interest: The authors declare that they have no conflicts of interest to report regarding the present study.
1. Laureano-Rosario, A. E., Duncan, A. P., Mendez-Lazaro, P. A., Graccia-Rejon, J. E., Gomez-Carro, S. et al. (2018). Application of artificial neural networks for dengue fever outbreak predictions in the northwest coast of Yucatan, Mexico and San Juan, Puerto Rico. Tropical Medicine and Infectious Disease, 3(1), 1–19. DOI 10.3390/tropicalmed3010005. [Google Scholar] [CrossRef]
2. World Health Organization. (2012). Global strategy for dengue prevention and control: 2012–2020. Geneva, Switzerland: WHO Press. [Google Scholar]
3. Andraud, M., Hes, N., Marais, C., Beutels, P. (2012). Dynamic epidemiological models for dengue transmission: A systematic review of structural approaches. PLoS One, 7(1), 1–19. DOI http://dx.doi.org/10.1371/journal.pone.0049085. [Google Scholar]
4. Nevai, A. L., Soewono, E. (2014). A model for the spatial transmission of dengue with daily movement between villages and a city. Mathematical Medicine and Biology, 31(2), 150–178. DOI 10.1093/imammb/dqt002. [Google Scholar] [CrossRef]
5. Laureano-Rosario, A. E., Graccia-Rejon, J. E., Gomez-Carro, S., Farfan-Ale, J. A., Muller-Karger, F. E. (2017). Modelling dengue fever risk in the State of Yucatan, Mexico using regional-scale satellite-derived sea surface temperature. Acta Tropica, 172(1), 50–57. DOI 10.1016/j.actatropica.2017.04.017. [Google Scholar] [CrossRef]
6. Derouich, M., Boutayeb, A., Twizell, E. H. (2003). A model of dengue fever. Bio Medical Engineering Online, 2(1), 1–10. DOI 10.1186/1475-925X-2-1. [Google Scholar] [CrossRef]
7. Phaijoo, G. R., Gurung, D. B. (2016). Mathematical study of dengue disease transmission in multi-patch environment. Applied Mathematics, 14(1), 1521–1533. DOI 10.4236/am.2016.714132. [Google Scholar] [CrossRef]
8. Sardar, T., Rana, S., Chattopadhyay, J. (2015). A mathematical model of dengue transmission with memory. Communication in Nonlinear Science and Numerical Simulation, 22(1), 511–525. DOI 10.1016/j.cnsns.2014.08.009. [Google Scholar] [CrossRef]
9. Aguiar, M., Kooi, B. W., Rocha, F., Ghaffari, P., Stollenwerk, N. (2014). How much complexity is needed to describe the fluctuations observed in dengue hemorrhagic fever incidence data. Ecological Complexity, 16(1), 31–40. DOI 10.1016/j.ecocom.2012.09.001. [Google Scholar] [CrossRef]
10. Alphey, L., Benedict, M., Bellini, R., Clark, G. G., Dame, D. A. et al. (2010). Sterile-insect methods for control of mosquito-borne diseases: An analysis. Vector Borne Zoonotic Diseases, 10(3), 295–311. DOI 10.1089/vbz.2009.0014. [Google Scholar] [CrossRef]
11. Rohani, A., Zamree, I., Joseph, R. T., Lee, H. L. (2008). Persistency of transovarial dengue virus in Aedes Aegypti (LINN). Southeast Asian Journal of Tropical Medicine and Public Health, 39(1), 813–816. [Google Scholar]
12. Yang, H. M., Ferrarei, C. P. (2008). Assessing the effects of vector control on dengue transmission. Applied Mathematics and Computation, 198(1), 401–413. DOI 10.1016/j.amc.2007.08.046.
13. Garba, S. M., Gumel, A. B. (2008). Effect of cross immunity on the transmission dynamics of two strains of dengue. International Journal of Computer Mathematics, 87(10), 2361–2384. DOI 10.1080/00207160802660608.
14. Tewa, J. J., Dimi, J. L., Bowang, S. (2009). Lyapunov functions for a dengue disease transmission model. Chaos, Solitons and Fractals, 39(2), 936–941. DOI 10.1016/j.chaos.2007.01.069. [Google Scholar] [CrossRef]
15. Raza, A., Rafiq, M., Baleanu, D., Arif, M. S. (2020). Numerical simulations for stochastic meme epidemic model. Advances in Difference Equations, 176(1), 1–16. DOI 10.1186/s13662-020-02593-1. [Google Scholar] [CrossRef]
16. Abodayeh, K., Raza, A., Arif, M. S., Rafiq, M., Bibi, M. et al. (2020). Numerical analysis of stochastic vector borne plant disease model. Computers, Materials & Continua, 63(1), 65–83. DOI 10.32604/cmc.2020.08838. [Google Scholar] [CrossRef]
17. Abodayeh, K., Raza, A., Arif, M. S., Rafiq, M., Bibi, M. et al. (2020). Stochastic numerical analysis for impact of heavy alcohol consumption on transmission dynamics of gonorrhoea epidemic. Computers, Materials & Continua, 62(3), 1125–1142. DOI 10.32604/cmc.2020.08885. [Google Scholar] [CrossRef]
18. Abodayeh, K., Raza, A., Arif, M. S., Rafiq, M., Bibi, M. et al. (2020). Numerical techniques for stochastic foot and mouth disease epidemic model with impact of vaccination. Advances in Difference Equations, 2508(1), 1–14. DOI 10.1186/s13662-020-2503-8. [Google Scholar] [CrossRef]
19. Raza, A., Arif, M. S., Rafiq, M. (2019). A reliable numerical analysis for stochastic dengue epidemic model with incubation period of virus. Advances in Difference Equations, 32(1), 1–19. DOI 10.1186/s13662-019-1958-y. [Google Scholar] [CrossRef]
20. Bakar, M. R. A., Mohammed, S. G., Ibrahim, N. A., Monsi, M. (2013). Deterministic models in dengue transmission dynamics. Research Bulletin of Institute for Mathematical Research, 2(1), 1–16. [Google Scholar]
21. Allen, E. J., Allen, L. J. S., Arciniega, A., Greenwood, P. E. (2008). Construction of equivalent stochastic differential equation models. Stochastic Analysis and Applications, 26(1), 274–297. DOI 10.1080/07362990701857129. [Google Scholar] [CrossRef]
22. Mickens, R. E. (2006). A fundamental principle for constructing non-standard finite difference schemes for differential equations. Journal of Difference Equations and Applications, 11(7), 645–653. DOI 10.1080/10236190412331334527. [Google Scholar] [CrossRef]
23. Zafar, Z. U. A., Rehan, K., Mushtaq, M. (2017). HIV/AIDS epidemic fractional order model. Journal of Difference Equations and Applications, 23(7), 1298–1315. DOI 10.1080/10236198.2017.1321640. [Google Scholar] [CrossRef]
24. Zafar, Z. U. A., Rehan, K., Mushtaq, M. (2017). Fractional-order scheme for bovine babesiosis disease and tick populations. Advances in Difference Equations, 86(1), 1–18. [Google Scholar]
 | This work is licensed under a Creative Commons Attribution 4.0 International License, which permits unrestricted use, distribution, and reproduction in any medium, provided the original work is properly cited. |